Article

Transcriptome Analyses Reveal the Mechanism of Changes in the Sugar Constituents of Jujube Fruits under Saline–Alkali Stress

1
College of Horticulture and Forestry, Tarim University, Alar 843300, China
2
College of Life Science and Technology, Tarim University, Alar 843300, China
3
National-Local Joint Engineering Laboratory of High Efficiency and Superior-Quality Cultivation and Fruit Deep Processing Technology on Characteristic Fruit Trees, Alar 843300, China
*
Author to whom correspondence should be addressed.
These authors contributed equally to this work.
Agronomy 2023, 13(9), 2243; https://doi.org/10.3390/agronomy13092243
Submission received: 2 August 2023 / Revised: 24 August 2023 / Accepted: 24 August 2023 / Published: 27 August 2023
(This article belongs to the Section Crop Breeding and Genetics)

Abstract

:
Saline–alkali stress is an important environmental factor affecting the growth and development of plants. Plants affected by saline–alkali stress can mitigate the damage by regulating the content of osmoregulatory substances such as soluble sugars. Elucidating the regulatory mechanism of the changes in sugar fractions in jujube fruits under saline–alkali stress is crucial for the development of the jujube fruit industry in saline areas. In this study, we investigated the effects of saline–alkali stress on the development and sugar contents of jujube fruits by subjecting jujube trees to low- and high-saline–alkali stress treatments. The result showed that low saline–alkali stress increased the content of each sugar component and total sugar, whereas high saline–alkali stress suppressed their contents. In the early developmental stage, the fruit mainly accumulated fructose and glucose, whereas in the late stage, it accumulated mainly sucrose. We screened various genes, namely trehalose 6-phosphate phosphatase gene (LOC107418410), α-amylase gene (LOC107428855), α-glucosidase gene (LOC107418468), sucrose synthase gene (LOC107416188), and β-amylase gene (LOC107430415, LOC107406235), all of which were highly correlated with sucrose content in saline–alkali stress, indicating that the starch and sucrose metabolic pathways of jujube fruit are the key pathways regulating sugar accumulation in response to saline–alkali stress. To summarize, this study provides a system-level perspective on the dynamic transcriptional regulation of jujube fruits under saline–alkali stress. Additionally, the study preliminarily screened key differentially expressed genes that affect sugar accumulation in response to saline–alkali stress, providing a theoretical basis for the scientific regulation of jujube fruit quality.

1. Introduction

Jujube (Ziziphus jujuba Mill.), one of the most important fruit crops in China [1], has been cultivated for more than 7000 years. It is also one of the five dominant economic forest tree species in China. Jujube fruits are rich in sugars, vitamin C, mineral elements, and other nutrients essential for the human body. These fruits also possess various pharmacological properties and are thus beneficial to human health. Furthermore, jujube trees are drought resistant, windproof, and sand-fixing; they prevent soil erosion and serve as vital ecological construction trees [2,3].
Since the 21st century, the planting area of jujube trees in Northwest China, especially in Xinjiang, has been undergoing rapid expansion. Saline–alkali stress due to severe soil salinization in the area is a major limiting factor affecting the growth and fruit quality of jujube trees [4]. Minerals (including salts) in the soil are essential for plant growth; however, a high salt content limits plant growth. Extensive ion deposits in high-salinity soils lead to a high osmotic potential, which makes it difficult for plants to absorb water, similarly to that under drought stress [5]. At the same time, high salt concentrations can induce ionic toxicity, which, together with osmotic stress, causes serious damage to plants [6]. In addition, under long-term saline–alkali stress, plants accumulate various reactive oxygen species (ROS) such as hydrogen peroxide (H2O2) and superoxide anion (O2−), resulting in structural damage to cell membranes, which leads to the obstruction of intracellular substance synthesis and cell function disorders. Plant morphology also changes under saline–alkali stress. Saline–alkali stress was reported to inhibit root development of apple, limit biomass accumulation, and cause damage to leaves to different degrees [7]. In another study, the number of leaves, plant height, and relative water content in the above-ground and underground parts of seedlings decreased significantly after salt stress treatment [8]. A study reported that when salt stress exceeds a certain threshold, the size of cherry tomato fruits is reduced [9].
Carbohydrates, especially water-soluble carbohydrates, play an important role in providing energy, supplementing nutrition, and resisting adversity [10]. Studies have shown that various water-soluble carbohydrates (such as sugar, glucose, sucrose, and sorbitol) accumulate in plants to resist saline–alkali stress, and these substances can play a role in osmoregulation and clearance of ROS [11]. A recent study reported that hydrolase in the mesophylls can be activated under stressful conditions, causing starch to degrade into sugars, thereby sustaining plant growth [12]. Soluble sugars regulate the balance between growth and stress resistance throughout the plant life cycle.The content of soluble sugars in jujube fruits is increased to different levels under drought and high temperature stress [13]. NaCl stress increases cell membrane permeability, antioxidant enzyme activities, and the content of osmoregulatory substances in jujube [14]. However, relevant studies are not systematic and detailed compared with those using model plants, and the response mechanism of soluble sugars in jujube fruit, which are osmoregulatory substances, toward saline–alkali stress is not known.
Transcriptome sequencing is an important means to systematically analyze the correlation between the physiological and biochemical mechanisms and biomolecular functions of fruit trees in response to stress as well as in regulating fruit quality [15,16,17,18]. Zhike Zhang [15] identified and analyzed the genes related to glucose metabolism of ‘red crystal’ in Pitaya fruit based on transcriptome data. Qing Hao et al. [16] studied the changes in long non-coding RNA expression in jujube under heat stress by using transcriptomics method. Chenhui Li et al. [12] revealed the mechanism of glucose metabolism in response to drought stress by using transcriptomics method and showed that the genes encoding β-furan fructosidase (INV), sucrose synthase (SUS), raffinose synthase (RS), and other genes were closely related to glucose metabolism. Jinhai Zhao et al. [17] conducted a full-length transcriptome analysis of sugar accumulation in sugarcane and found one allele encoding SPS (Soff.03G0017710-5G) and two alleles encoding SuSy (XLOC008117 and XLOC010274).
The sugar content in jujube fruit is determined via the combined action of genes related to sugar synthesis and transport. Many functional and regulatory genes related to sugar synthesis have been identified. Sucrose content was positively correlated with the expression levels of ZjSPS1, ZjSPS2, and ZjSS2 [18]. A study on sucrose content and related genes at different stages of jujube fruit development showed that ZjSPS3 and ZjSPS4 were the main genes regulating sugar accumulation [19]. Zhang et al. identified five key genes for sucrose synthesis in jujube through genome sequencing, namely ZjSPS1, ZjSPS2, ZjSS1, ZjSS2, and ZjSS3 [20]. The interconversion of different types of sugar components is also influenced by the regulation of related genes. The low expression of invertase genes (vINV, nINV, and cINV) in jujube fruits is an important factor for the sucrose content being higher than those of fructose and glucose. INV gene encodes enzymes that catalyze the hydrolysis of sucrose to glucose and fructose, and its low expression level contributes to sucrose accumulation in jujube fruits [20]. Most scholars have studied the expression level of sugar regulation-related genes in jujube, but which genes play a regulatory role in stress conditions has been rarely studied.
Studies on the adaptability of jujube fruits and the changes in fruit quality under complex salt–alkali stress are scarce. Furthermore, it is not clear how sugar content in jujube fruit changes in response to saline–alkali stress and which genes regulate sugar accumulation in jujube fruits under saline–alkali stress. The study of gene expression differences under saline–alkali stress can provide a basis for understanding the molecular mechanism for the adaptation of plants to saline–alkali stress. In this direction, transcriptomics, as an important aspect of functional genomics, contributes to understanding the mechanism of plant response to environmental stress at the transcriptional level. Therefore, to fully understand the molecular mechanism of jujube fruit development under saline–alkali stress, in this study, we used transcriptomic technology to identify differentially expressed genes (DEGs) in jujube fruits subjected to saline–alkali stress and analyzed the transcriptome expression profiles at different periods. The results of this study provide a reference and technical support for planting jujube trees in saline–alkali soils.

2. Results

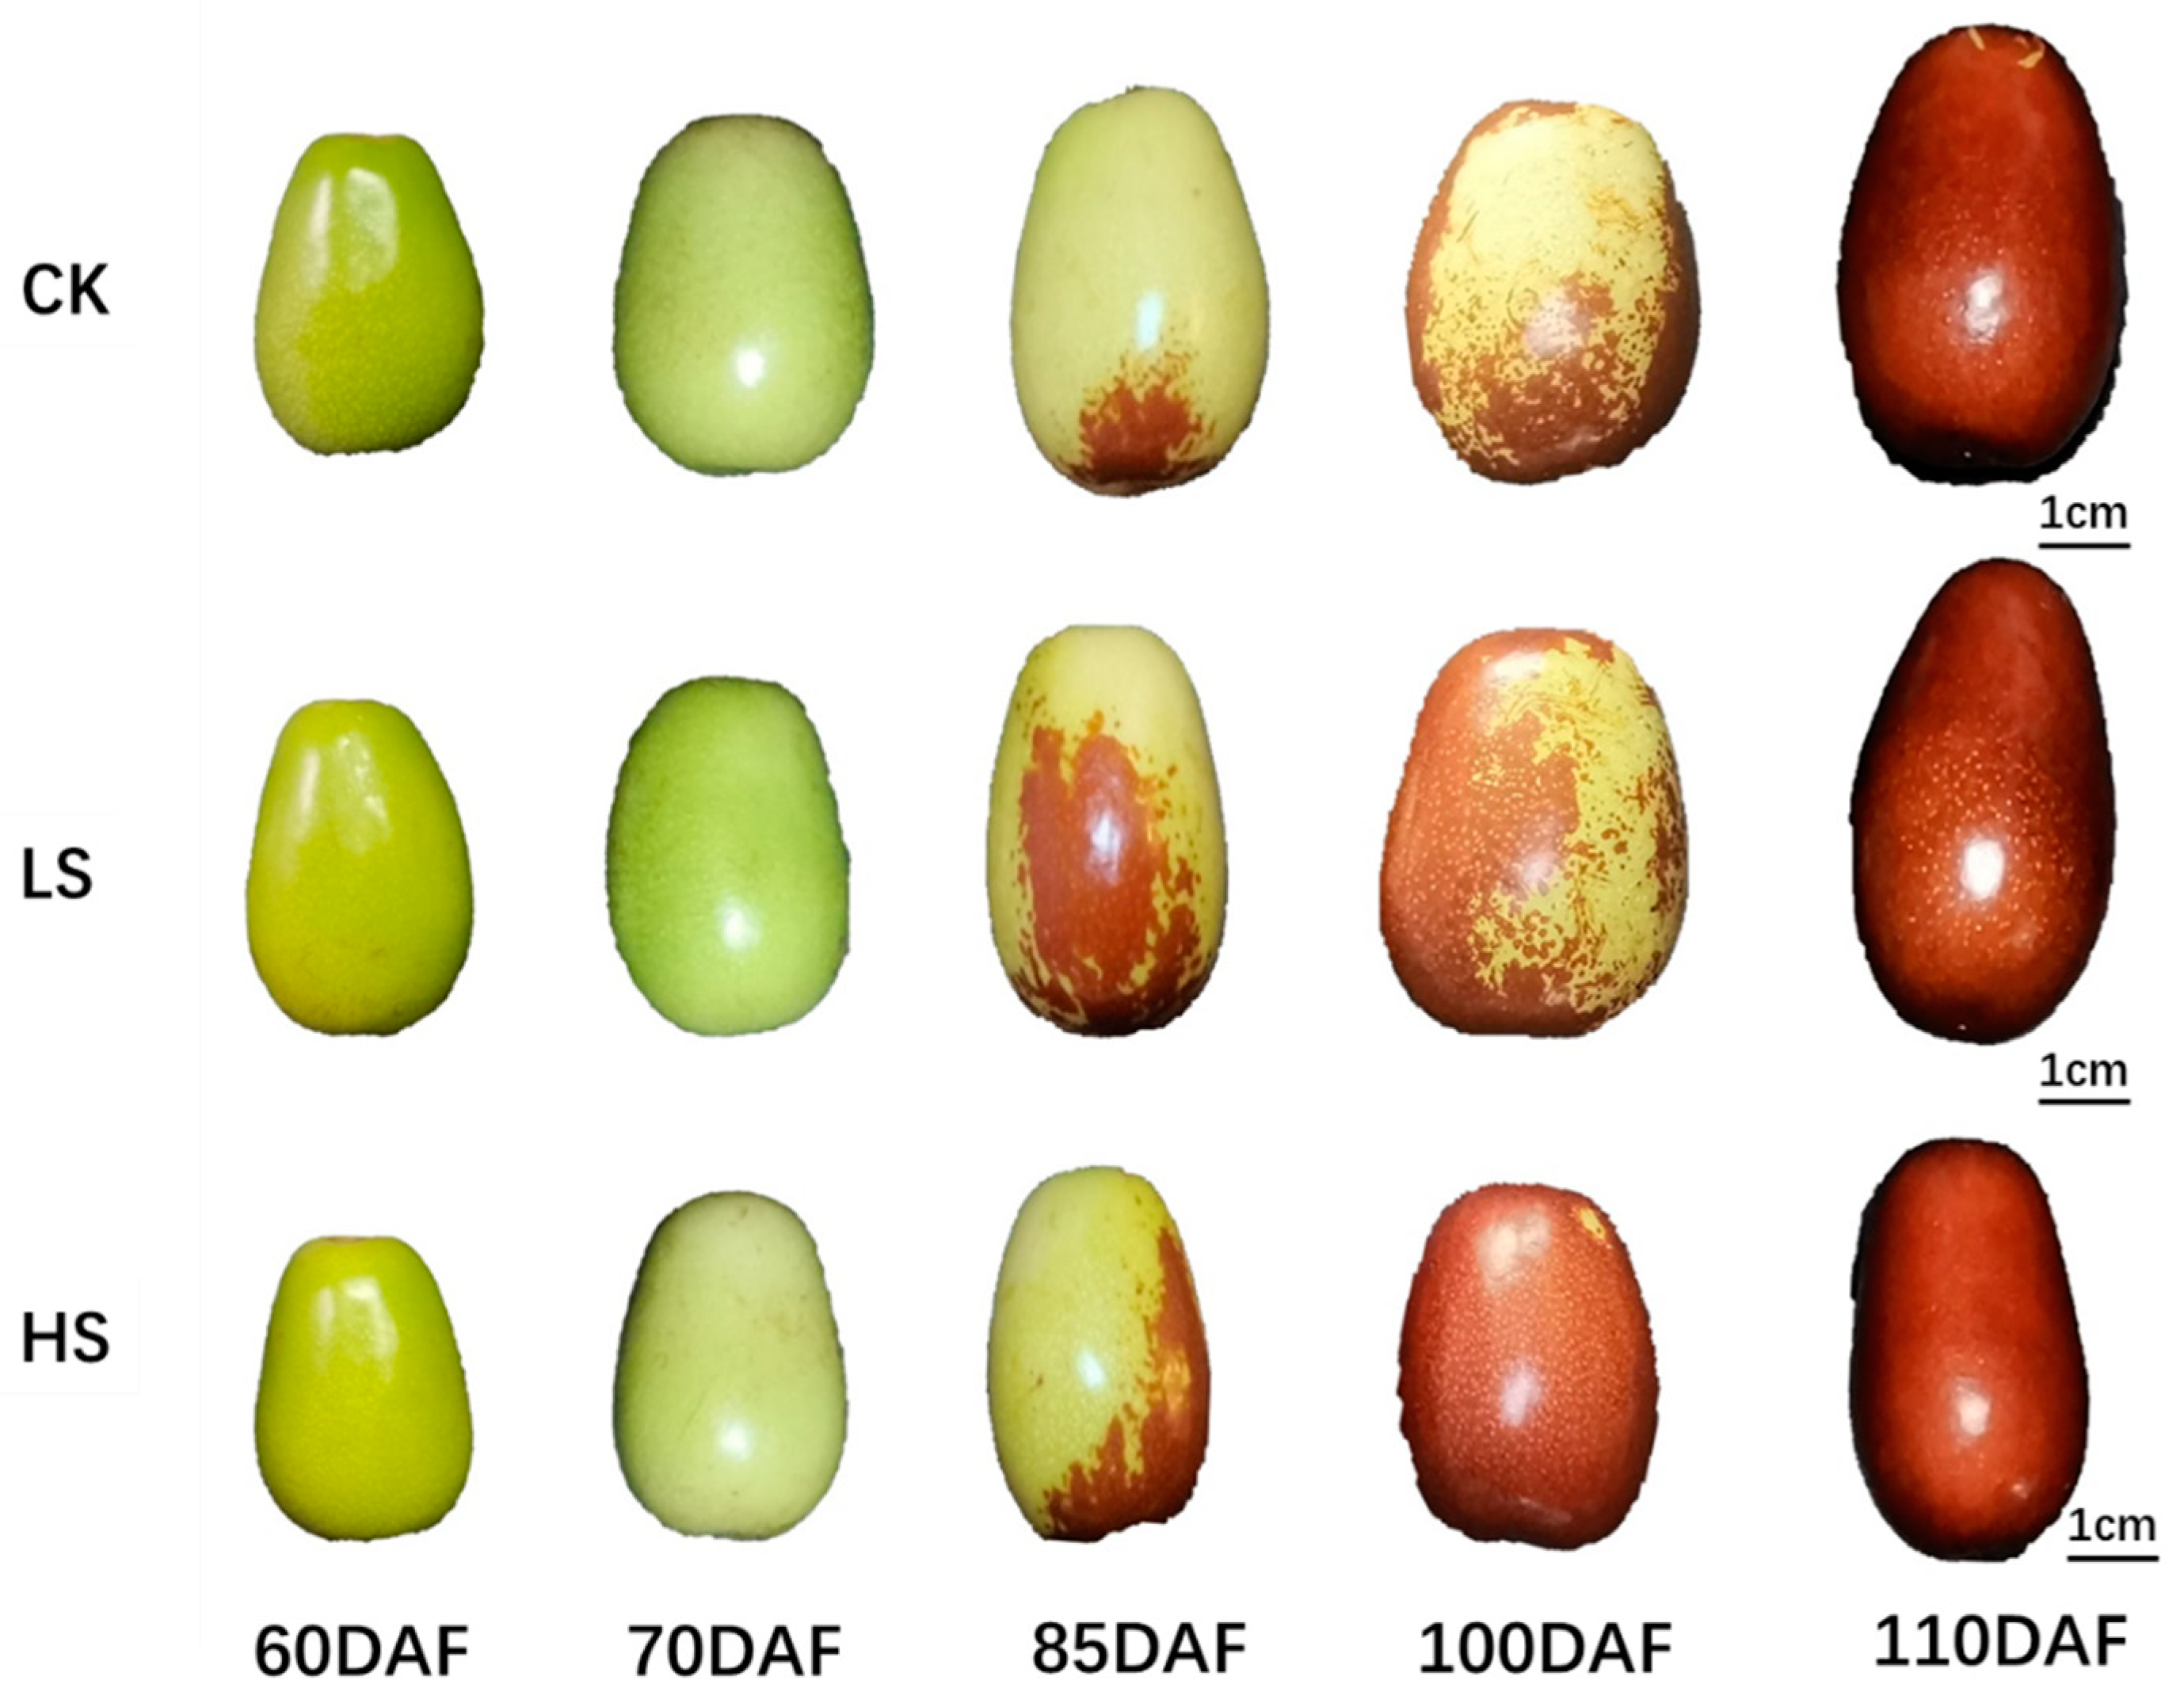
2.1. Effect of Saline–Alkali Stress on Jujube Fruit Development

The color of jujube fruit varied significantly among different fruit development stages and under different saline–alkali stress treatments (Figure 1). However, at 60 days after flowering (DAF), no significant difference was found in jujube fruit color under different treatments. At 70 DAF, jujube fruits under high saline–alkali stress treatment (HS) distinctly turned white. From 85 to 100 DAF, the color of jujube fruits turned red with increasing saline–alkali stress concentration. Furthermore, at 110 DAF, jujube fruits under each saline–alkali stress treatment turned red, with no significant differences among the treatments.

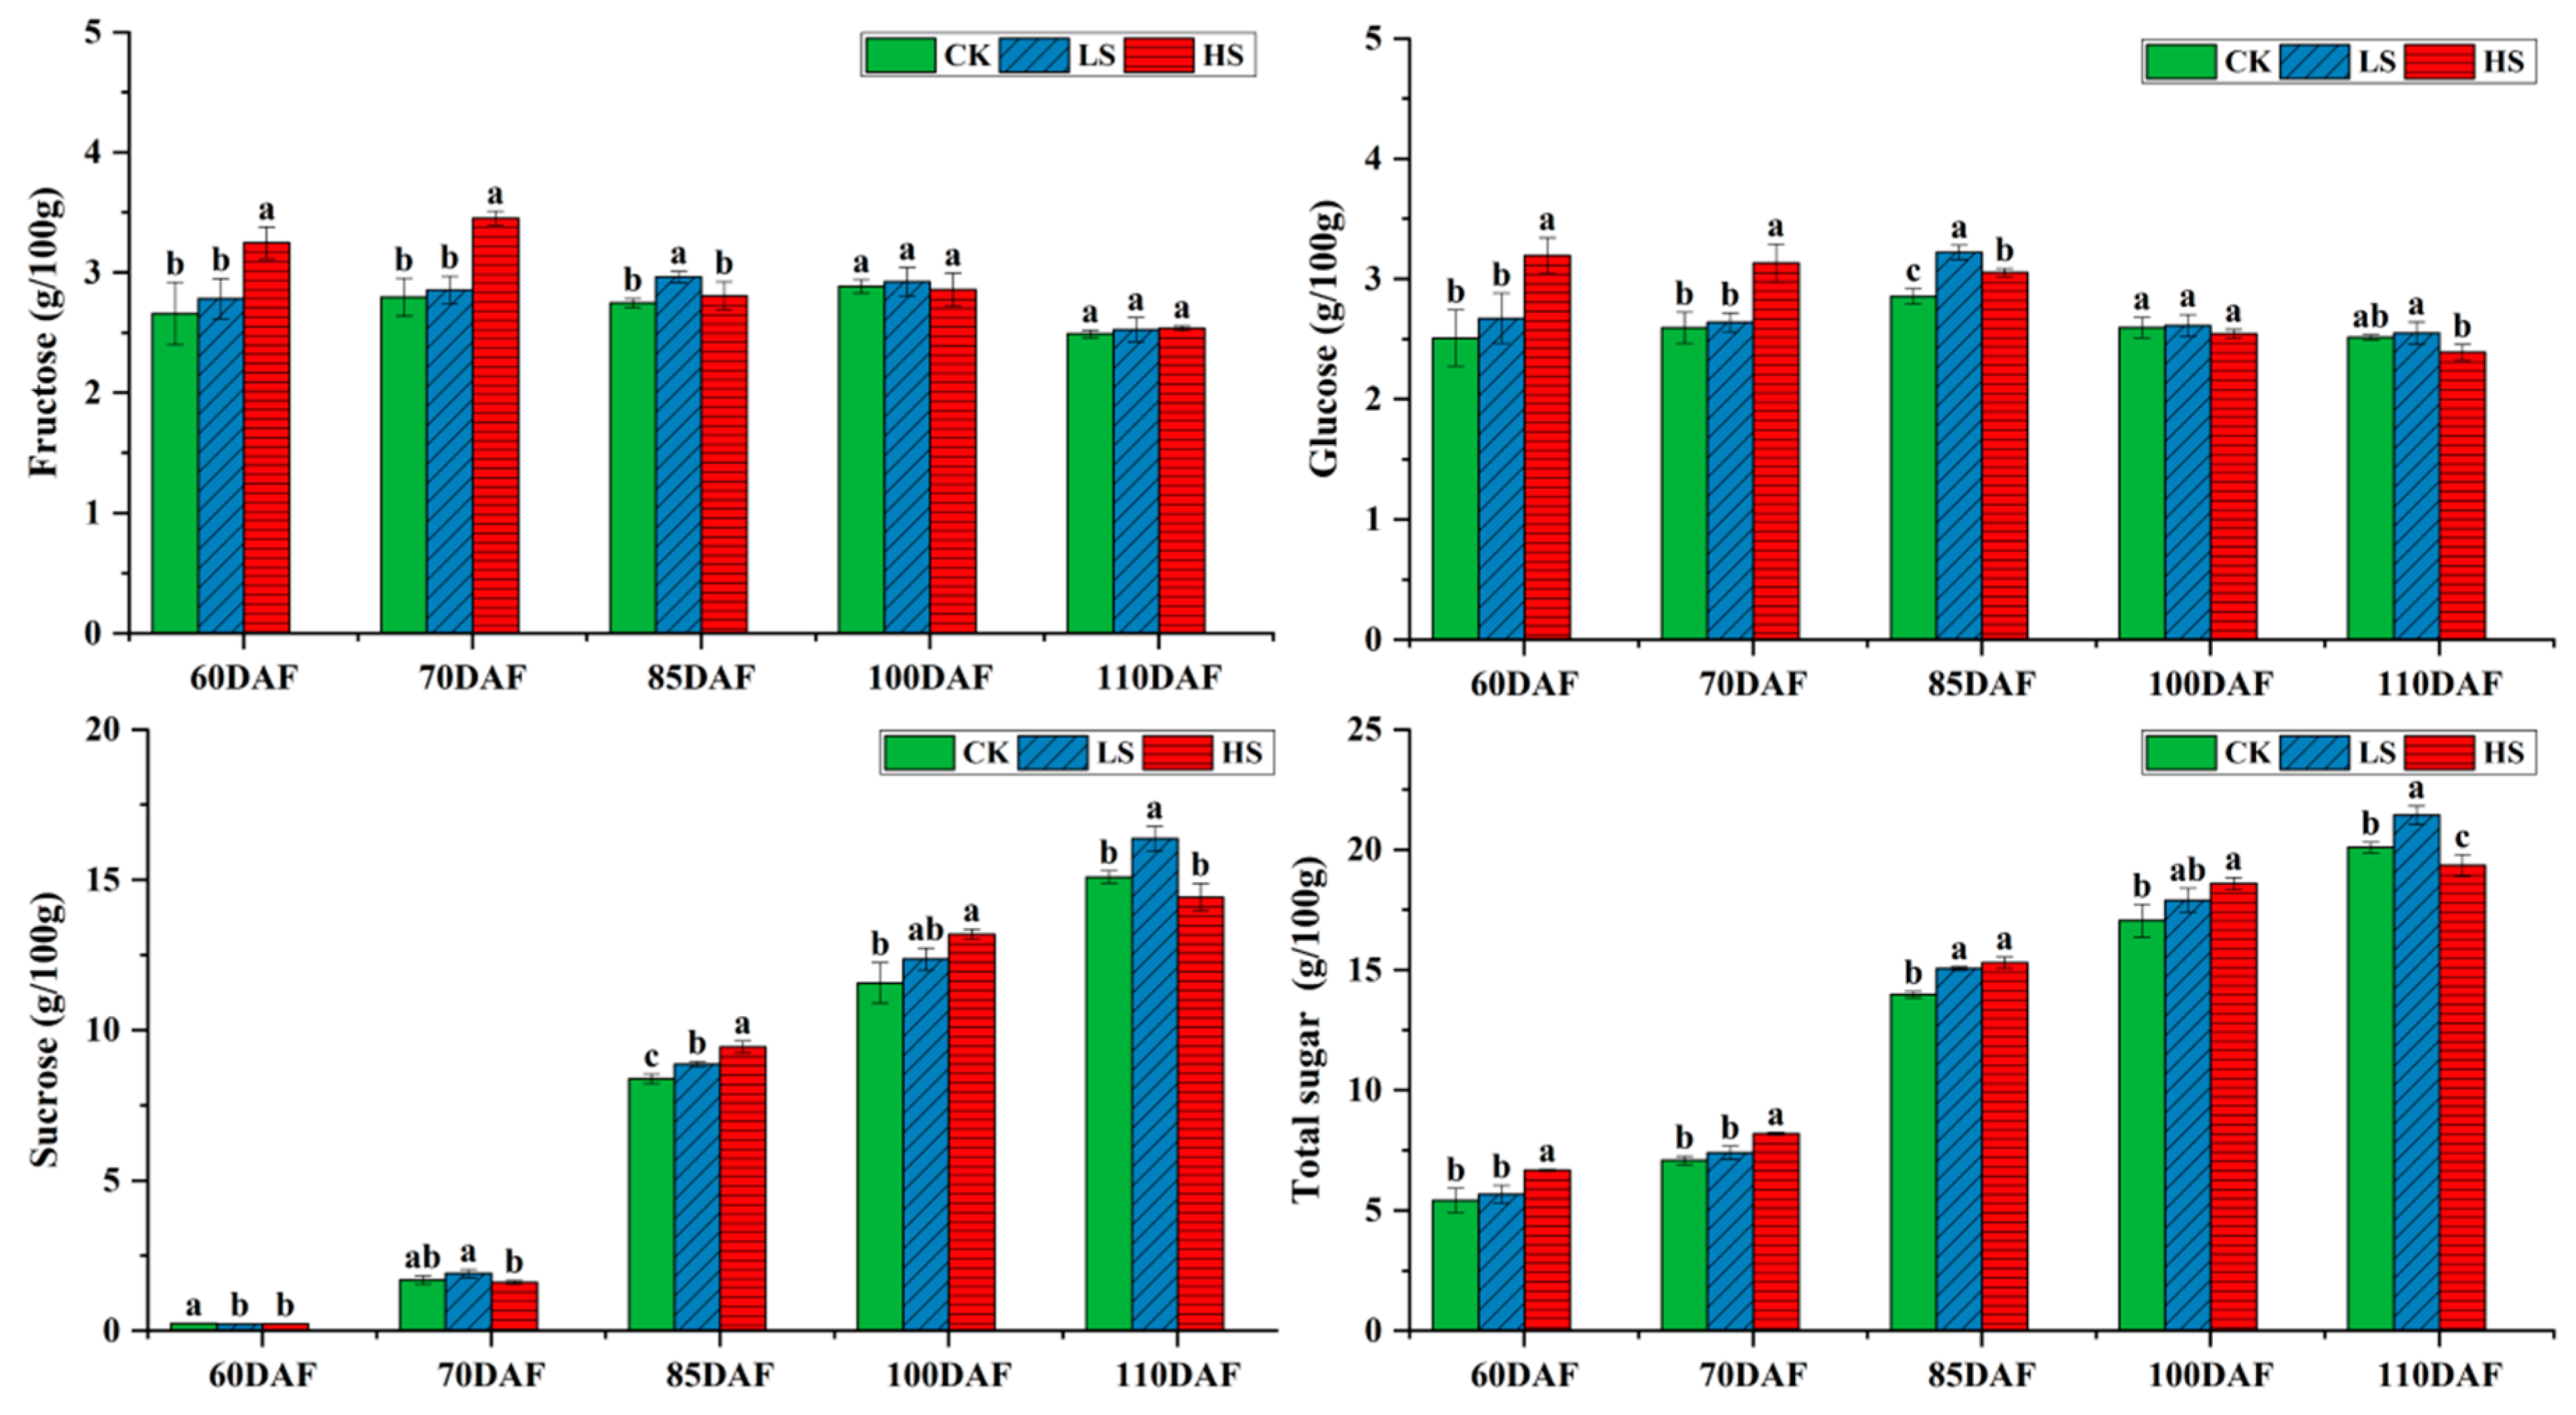
2.2. Changes in Sugar Constituents of Jujube Fruits at Different Developmental Stages under Saline–Alkali Stress

The differences in sugar component content and total sugar content of jujube fruits under different saline–alkali stress treatments are shown in Figure 2. The content of sucrose and total sugar in jujube fruits gradually increased with the fruit development stages under each treatment. Fructose and glucose contents decreased with the increasing concentration of saline–alkali stress treatment. At 85, 100, and 110 DAF, fructose and glucose contents increased and then decreased with the increasing concentrations of saline–alkali stress treatments. However, fructose and glucose contents under all treatments were higher than those under no saline–alkali stress treatment (CK).
At 60 and 70 DAF, the sucrose content decreased with the increasing concentration of saline–alkali stress treatment. However, the opposite trend was observed at 85 and 100 DAF; at 110 DAF, the sucrose content increased and then decreased with the increasing concentration of saline–alkali stress treatment.
The trends of total sugar content in jujube fruits with saline treatment at 60 and 70 DAF were consistent with those of fructose and glucose contents, whereas the trends of total sugar content with saline treatment at 85–100 DAF were consistent with those of sucrose.

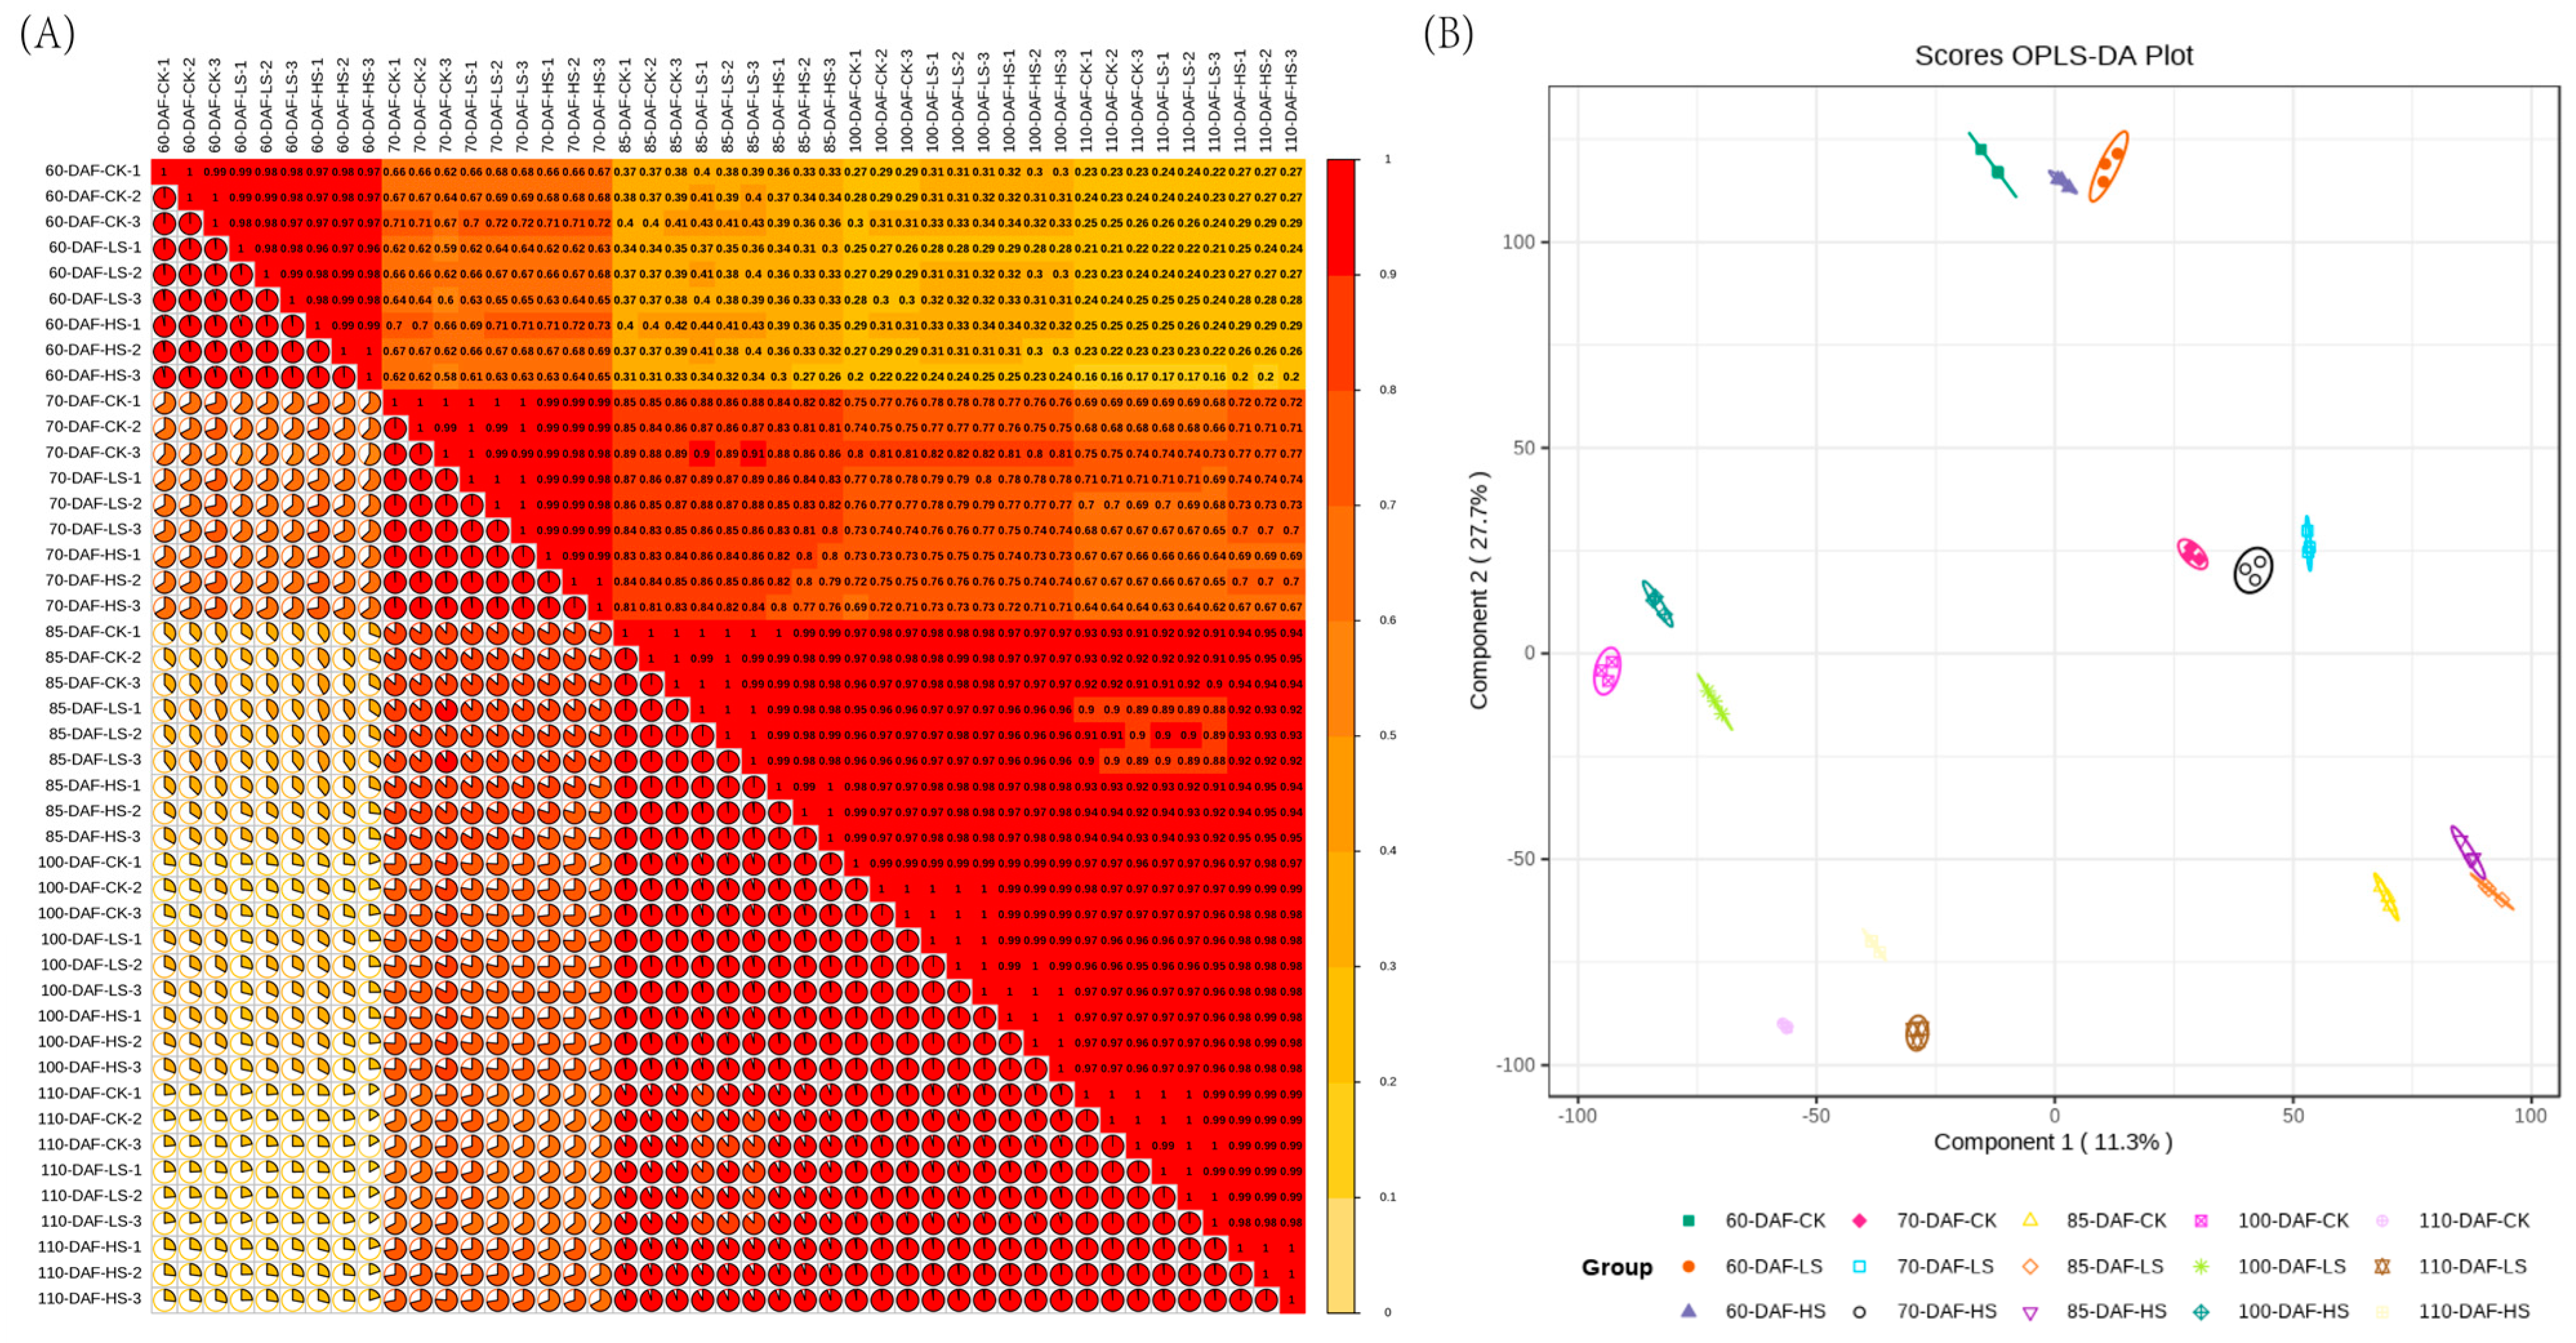
2.3. Transcriptomic Sequencing Analysis

The transcriptome sequencing analysis was performed using RNA-seq technology on 15 jujube fruit samples at five fruit development stages under CK, low-saline–alkali stress treatment (LS), and HS treatments, with three replicates of each sample. The transcriptome sequencing analysis of 45 samples yielded a total of 298.33 Gb of valid data (clean data). The clean data output of each sample reached 6.17 GB (Table A1). The percentages of Q30 and Q20 bases in the high-quality clean reads were ≥93% and ≥97%, respectively, and the sequencing error rate was 0.03%, which is lower than 0.5%. The percentage of GC contents was >42%. High-quality clean reads obtained through screening were compared with the jujube genome reference sequence (Table A2). By comparing with jujube genome sequences, the matching rate of jujube fruit samples at different fruit development stages under all saline–alkali stress treatments reached 87.87–90.34%. The percentage of uniquely mapped reads for subsequent analysis reached 76.37–78.49%, which indicated that the sequencing results were reliable and could be used for subsequent analyses.
Correlation analysis and cluster analysis were performed on 45 samples from the three treatment groups (CK, LS, and HS) for five fruit development stages (Figure 3). Based on the expected number of fragments per kilobase of transcript sequence per millions of base pairs sequenced from different samples, Pearson’s correlation coefficients calculated for both intra and inter-group samples were >0.9 (Figure 3A), indicating that the data of fruit samples were dependable among the treatments, and different periods under the three stress treatment conditions were clearly distinguishable. Furthermore, samples at 60 and 70 DAF were clustered in a group, whereas those at 85, 100, and 110 DAF were clustered in another group. The correlation analysis of the samples from different treatments in each period showed that the coefficient R2 between biological replicate samples was greater than 0.8, indicating that the test transcriptome data were reproducible and the DEGs screened were reliable for the subsequent analysis. A total of 31,718 genes were obtained after analysis with data filtering and quality control. Orthogonal projections to latent structures discriminant analysis (OPLS-DA) of transcriptome data between the samples was performed (Figure 3B), with three biological replicates aggregated for each treatment, indicating good reproducibility of transcriptome data in this study. All five periods of jujube fruit development were distinguishable between the samples. These results indicated that the samples showed some chronological differences with progression to the maturation stages of fruit.

2.4. Screening and Analysis of DEGs in Jujube Fruits under Saline–Alkali Stress

To identify the DEGs associated with jujube fruit development during sugar accumulation in response to saline–alkali stress, the expression of genes in jujube fruit samples at different periods under CK, LS, and HS treatments was compared. A total of 2831 DEGs were obtained, of which 1487 were upregulated, and 1344 were downregulated (Table 1). In terms of the number of DEGs under LS and HS treatments, a considerably higher number of DEGs were identified between HS and CK (2296) than between LS and CK (535), and their expression first decreased and then increased with the fruit developmental stage. Most DEGs were obtained at 60 DAF, whereas the least DEGs were obtained at 85 DAF between LS and CK treatments. Furthermore, at 110 DAF and 70 DAF, least number of DEGs were identified between HS and CK treatments. We found that the DEGs in both stress conditions first showed a decreasing trend, followed by an increasing trend, with progression to the fruit maturation stages. The number of DEGs determined between LS and HS treatments increased with the fruit development stages. The number of DEGs in the HS treatment group was much higher than those in the LS treatment group and CK group, indicating that the biological processes caused by stress varied under different fruit development and maturation stages. In conclusion, saline–alkali stress can induce transcriptional changes in jujube fruits.

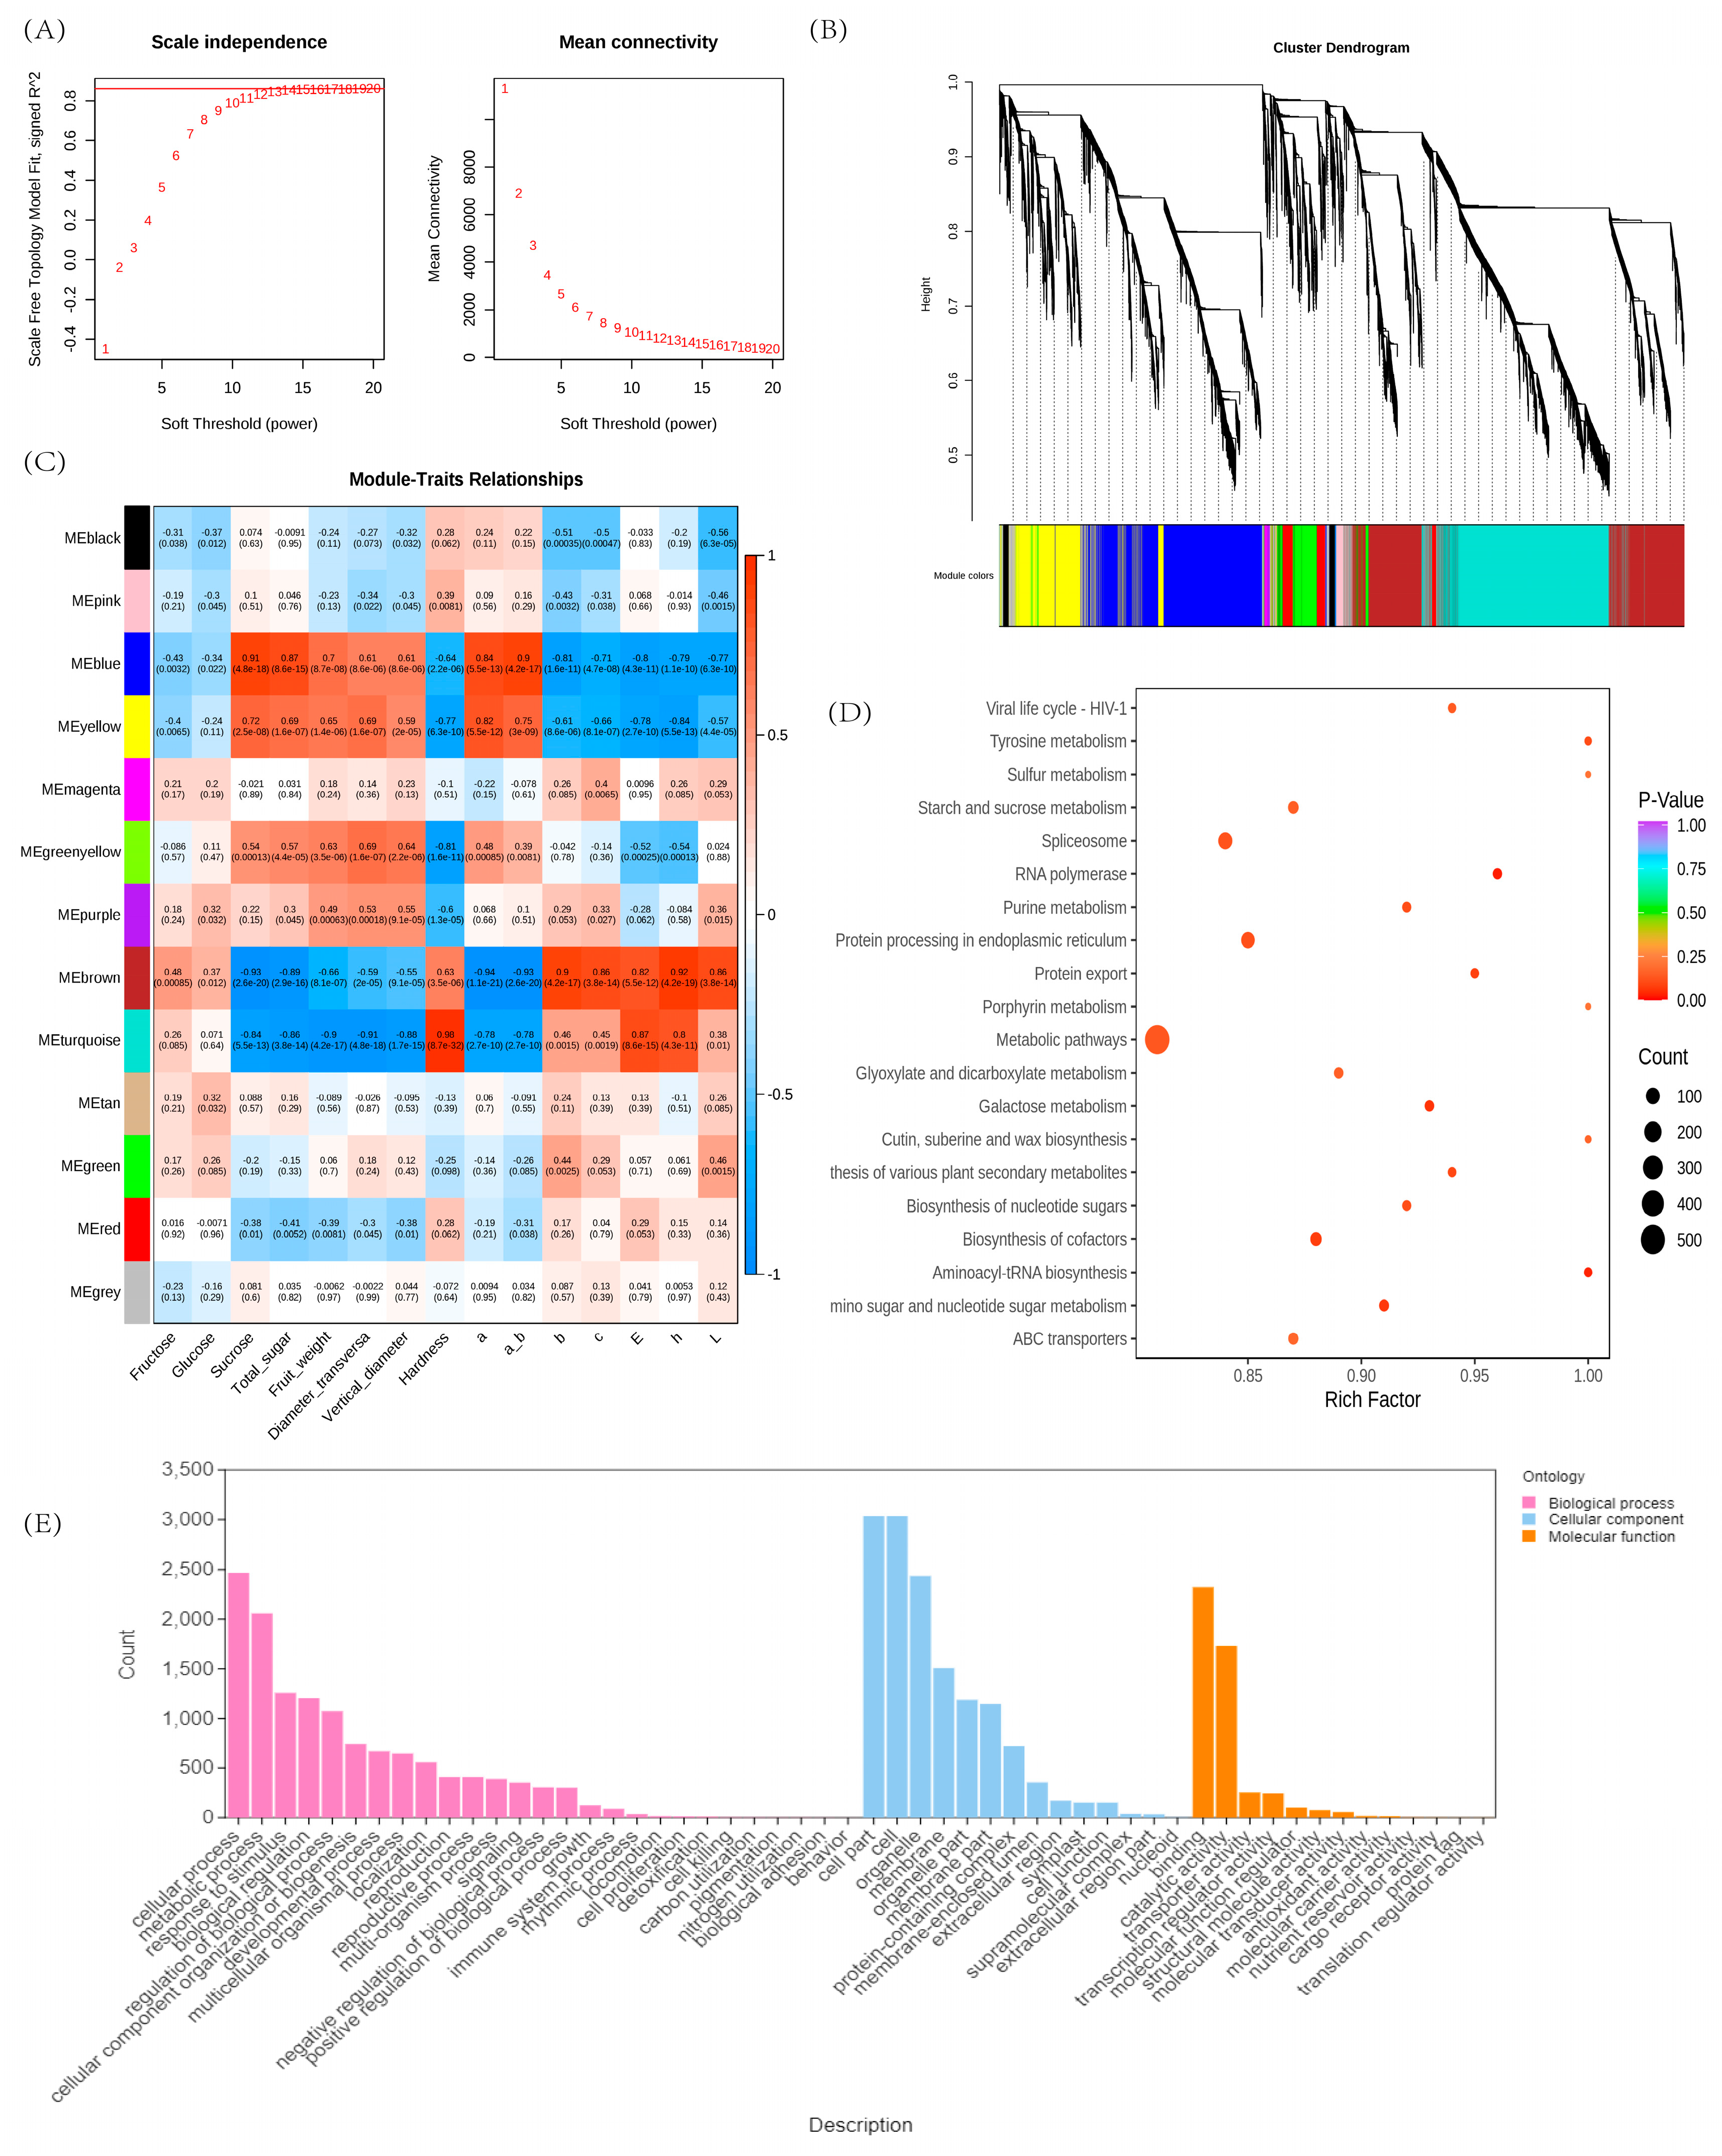
2.5. Co-Expression Network Analysis of Weighted Genes

To further study the response of jujube fruit to salt and alkali stress, we performed a weighted gene co-expression network analysis (WGCNA). Before constructing the co-expression network, we determined the optimal soft threshold to ensure that the constructed network conforms to the scale-free topology (Figure 4A). The DEGs were clustered in 13 modules (marked with different colors), and the genes within the modules were highly correlated with each other, with the blue and brown modules having the most DEGs (Figure 4B). Through “module-correlation” analysis (Figure 4C), 5219 genes of the “MEblue” module were identified to be strongly positively correlated with sucrose content in 45 samples (r = 0.91), and 4864 genes of the “MEbrown” module were highly negatively correlated with sucrose content in 45 samples (r = −0.93). These results indicated that the genes in the “MEblue” and “MEbrown” modules were involved in sucrose accumulation in jujube fruit in response to the saline–alkali stress, thereby confirming the role of these genes in sucrose accumulation in jujube fruits in response to saline–alkali stress. At the same time, it also shows that the change in sucrose content plays a crucial role in the adaptation of jujube fruit to salinity stress.
Gene ontology enrichment analysis of 5219 genes in the “MEblue” module showed that “cell part,” “cell”, “organelle,” “metabolic process,” “cellular process,” “binding,” and “catalytic activity” were the seven most enriched functional entries. “Response to stimulus” and “biological regulation” were also significantly enriched (Figure 4E). The Kyoto Encyclopedia of Genes and Genomes (KEGG) enrichment analysis of the “MEblue” module revealed that numerous genes were significantly enriched in the “starch and sucrose metabolism” pathways (Figure 4D).

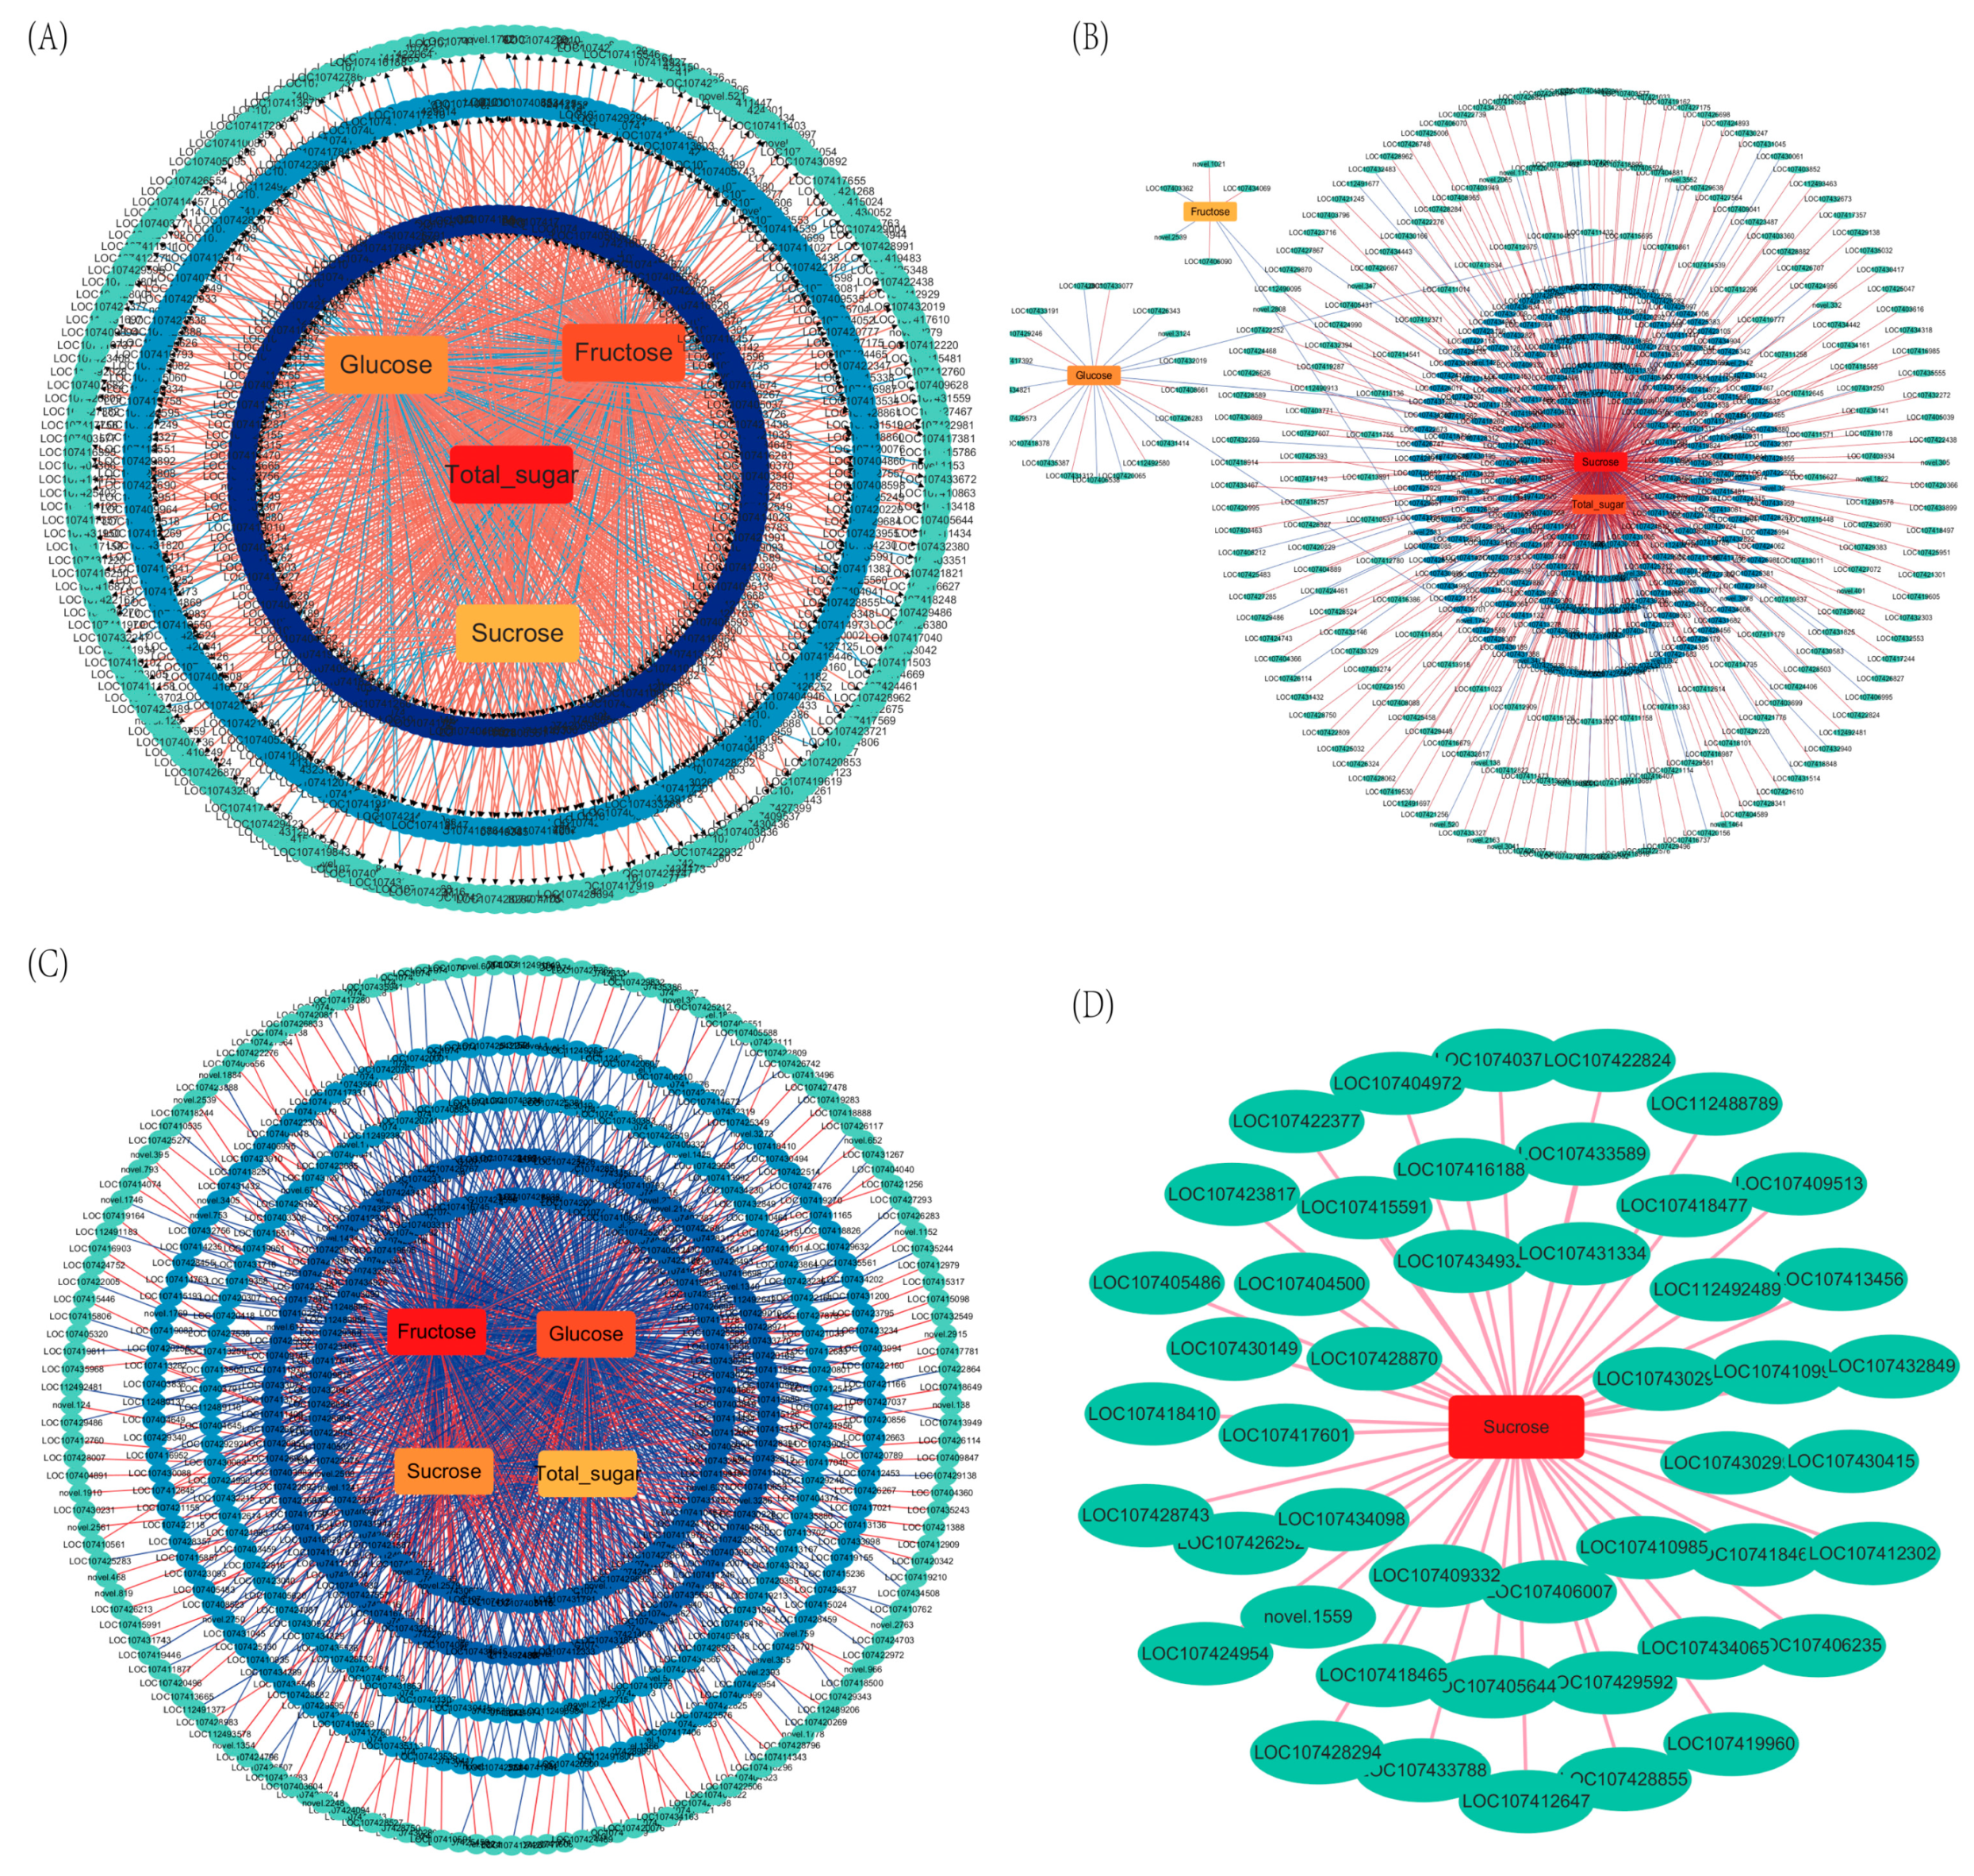
2.6. Co-Expression Network Analysis of DEGs and Sugar Components

The co-expression network of sugar accumulation in jujube fruits during the critical period under salt and alkali stress was analyzed (Figure 5). A total of 2437 hub genes of the trait association module were screened based on the module membership (MM) > 0.8 and gene significance (GS) > 0.6. At 85 DAF (Figure 5A), hub genes controlling sucrose content were clustered into one class; a total of 32 hub genes were significantly associated with sucrose content, of which 8 were strongly and positively associated. At 100 DAF (Figure 5B) and 110 DAF (Figure 5C), the number of hub genes associated with sucrose increasing. These results suggest that the number of hub genes controlling sucrose accumulation increased with the fruit development stages and the increasing concentration of saline–alkali stress.
Screening was performed based on FPKM values of transcriptomic data. Additionally, the co-expression analysis of 47 structural genes involved in the starch and sucrose metabolic pathways in the “MEblue” module was performed (Figure 5D).These 47 genes were found to be highly correlated with sucrose content, which included the trehalose 6-phosphate phosphatase gene (LOC107418410), α-amylase gene (LOC107428855), α-glucosidase gene (LOC107418468), sucrose synthase gene (LOC107416188), glucose-1,3-β-glucosidase gene (LOC107434932, LOC107409513), amylase gene (LOC107430415, LOC107406235), and alglucose-6-phosphate synthase/phosphatase genes (LOC107418465, LOC107405644). These genes were screened among hub genes in response to saline–alkali stress in all periods, which indicated that they play a vital role in the regulation of sucrose accumulation in response to saline–alkali stress.

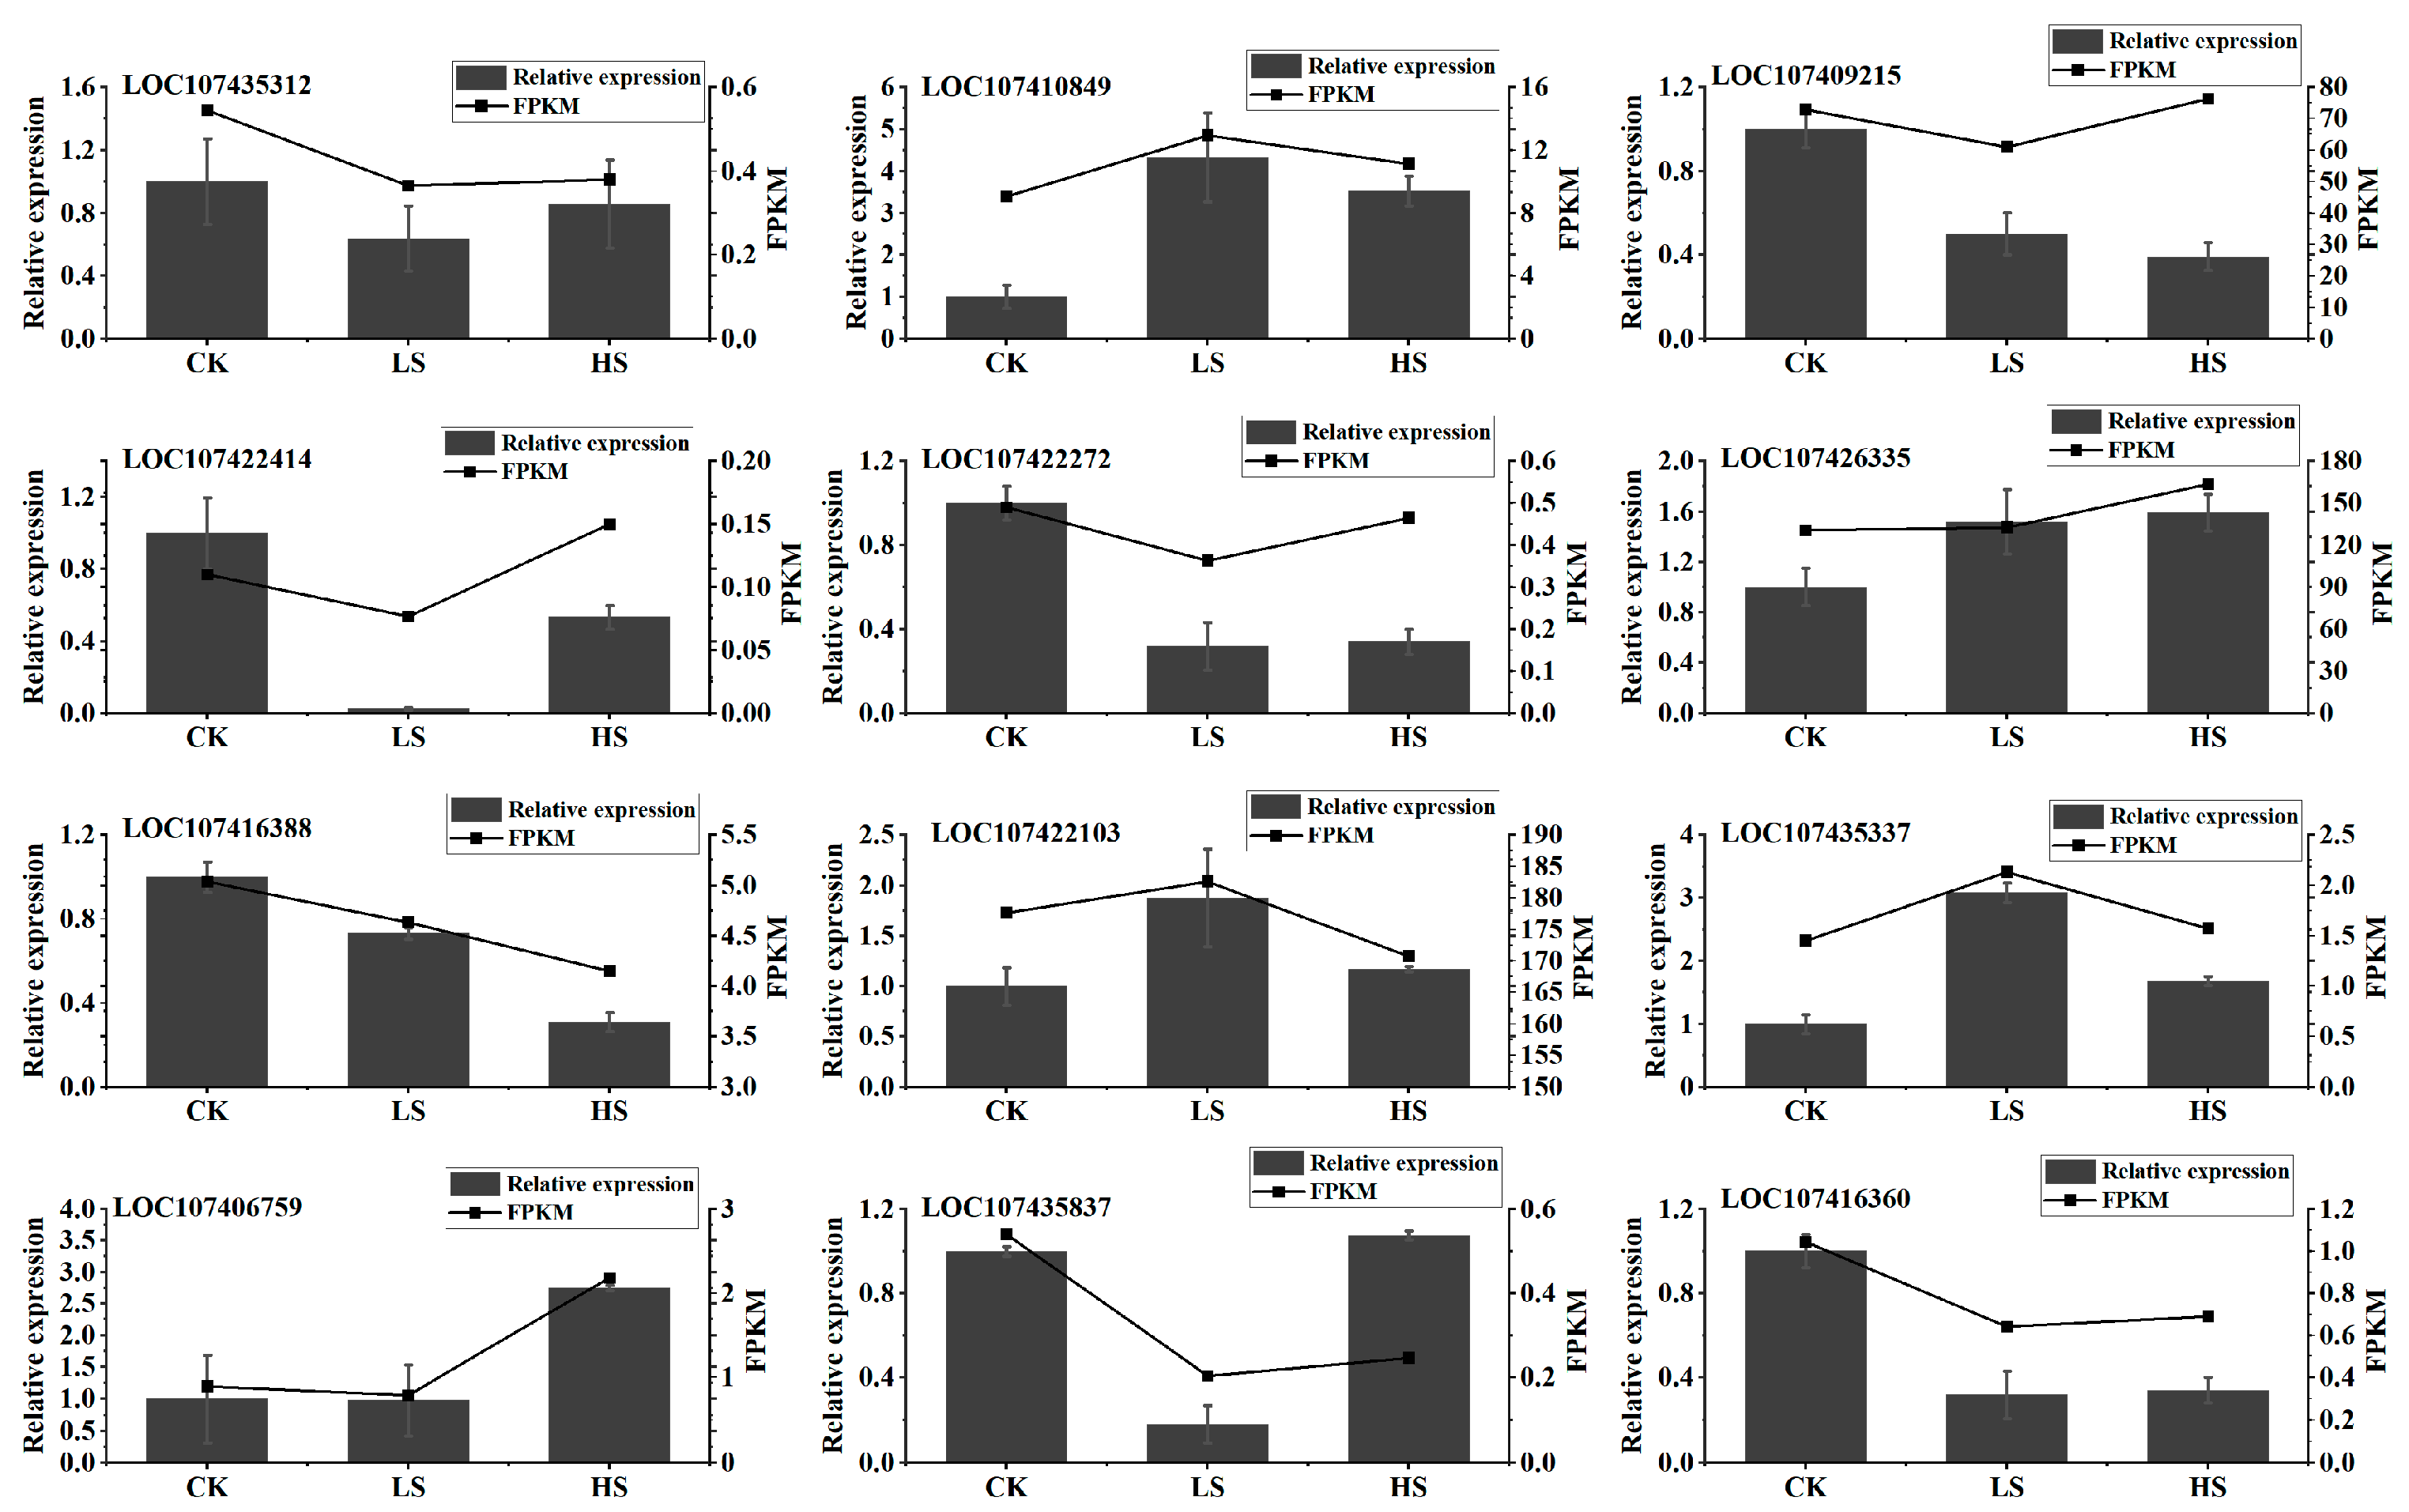
2.7. Quantitative Reverse Transcription-Polymerase Chain Reaction Validation

To verify the accuracy of RNA-seq results, 12 sucrose metabolism-related genes were randomly selected for quantitative reverse transcription-polymerase chain reaction (qRT-PCR) validation (Figure 6). The results showed that the change trends of qRT-PCR and RNA-seq data were consistent, indicating the reliability of the transcriptome data, which were then used to evaluate the gene expression level of jujube fruit under different saline–alkali treatments.

3. Discussion

Sugar is an important component that determines fruit flavor, and the accumulation characteristics of sugar vary across different fruit trees [21]. In the development stage of apple fruit, the fructose content in fruits is much higher than those of sorbitol, glucose, and sucrose [22]. As the brightness of the peel increases and the color intensifies, the ripening speed of citrus fruits accelerates, and the flesh is formed as a result of sucrose accumulation [23]. During the development of peach fruit, the concentration of citric acid peaks at the mid-ripening stage, while mature fruits are characterized by an increased concentration of sugars, especially sucrose [24]. Our test results showed that fructose and glucose were mainly accumulated in the early stage of jujube fruit development, whereas sucrose was mainly accumulated in the later stage (Figure 2). Overall, the content of sucrose was much higher than those of other sugars, belonging to the sucrose accumulation type, which is consistent with the results of most studies [20,25]. However, some studies have also shown that sucrose is not the main sugar component in some varieties of dried jujube [26], and some fruits lack sucrose [27]. These results do not imply that these varieties accumulate less or no sucrose, but it is possible that sugars are transformed during the drying process after maturation stage.
Appropriately increasing the saline concentration during fruit development can limit nutritional growth and enhance fruit quality [28]. Salt stress can increase the total acid and soluble solids content of soluble sugar in fruits compared with that in the control, making them more attractive to consumers [29]. Low concentrations of complex salt treatment improved strawberry fruit quality; however, the fruit quality gradually decreased with increasing concentrations of complex salt [30]. A previous study showed that low- and high-alkaline salt stresses increased the soluble sugar and vitamin C contents in melon and decreased the content of organic acids, indicating that fruit quality can be improved by using certain concentrations of saline water [31]. The results of the present study indicated that the sugar content increased at 85–110 DAF and then decreased with the increasing saline–alkali stress levels, indicating that an appropriate level of saline–alkali stress can improve fruit quality, especially the soluble sugar content.
While saline–alkali stress affects the sugar content, sugar in fruit also plays an anti-stress role. Trehalose and its bioanabolic pathways are components of plant sugar signaling system and important regulatory factors for water stress response in apple [32]. In peach fruit, a decrease in the sucrose content led to the intensification of internal browning, indicating that the maintenance of sucrose content in the fruit played a role in cold resistance [33]. Under abiotic stress conditions, sugars can regulate the osmotic potential in plants, maintain cellular osmolarity, and protect cells [34,35]. Through GO functional enrichment analysis (Figure 4), we found that the functions of cells, cellular processes, organelles, metabolic processes, and stimulated responses are closely associated with sugar accumulation in jujube fruits, indicating that jujube fruits adapt to the unfavorable saline environment by adjusting their cellular structure and accelerating the metabolism of sugars to resist saline–alkali stress [18].
The transcriptome responds to the transcriptional status of plant genes under stress conditions at an overall level and is vital for the study of processes such as stress and disease resistance in plants [36]. Liang et al. analyzed the transcriptome differences in the bark of 1-year-old branches of two apple varieties with different levels of frost resistance under cooling and freezing treatments and systematically screened the genes involved in frost resistance [37]. Wang et al. conducted proteomics and transcriptomics studies to analyze the lignin biosynthesis pathway, identify regulatory signaling networks, and explore the mechanisms for the formation of russet fruit epidermis [38]. In the present study, the number of DEGs between the stress and control groups gradually increased with progression of the fruit development stages, which may be because at the beginning of salinity treatment, plants adapt to saline–alkali stress by regulating the expression of genes related to cell membrane protection [39]. Meanwhile, the number of DEGs under HS group was much higher than that in the LS group. This could be because stress leads to the accumulation of cellular osmotically active substances, ion toxicity, and peroxidative stress, all of which cause damage to the plant. Plants respond to saline–alkali stress at the physiological and biochemical levels by regulating various pathways to mitigate the damage of a highly saline environment [40]. However, with an increase in the salinity concentration and the extension of stress exposure time, the accumulation of salt ions increases in plants, ion toxicity becomes severe, and plants’ stress regulation mechanism can no longer protect them against ion toxicity [40,41], thus leading to a massive upregulation of DEGs. However, in this study, jujube fruits showed gradual adaptation to low saline–alkali stress, and the number of DEGs decreased with fruit development.
Jujube is a sucrose-accumulating fruit, and the regulation of sucrose-metabolizing enzyme genes plays a major role in sugar accumulation in these fruits [20,42]. Different genes regulate sucrose synthesis and metabolism in the fruits on different tree species. The gene ASR of strawberry contains a typical ABA/WDS domain related to fruit stress resistance, and the overexpression of this gene can promote sucrose accumulation in strawberry fruit, thereby improving its cold resistance [43]. PpHXK2 in peach fruit was negatively correlated with sucrose content, which could be used as a sugar sensor to regulate sugar signal and metabolism in response to postharvest disease stress [44]. Sucrose synthase (SS) gene expressions were positively correlated with resistance to biotic and abiotic stresses in grapes [45]. In our research, the number of DEGs related to sucrose content was the highest in all stages of fruit growth and development; among the identified genes, alglucose-6-phosphate phosphatase gene (LOC107418410), α-amylase gene (LOC107428855), α-glucosidase gene (LOC107418468), sucrose synthase gene (LOC107416188), and amylase genes (LOC107430415, LOC107406235) were strongly correlated with sucrose content. Meanwhile, the expression of sucrose synthase genes (LOC107416188), α-glucosidase genes (LOC107418468), α-amylase genes (LOC107428855), and β-glucosidase genes (LOC107426252, LOC107428870) differed significantly at different time points, suggesting that these genes may play an important role in regulating sucrose accumulation in response to saline–alkali stress. Further studies are required to determine how the genes involved in the metabolism of sucrose and related metabolites are regulated in jujube fruits.

4. Materials and Methods

4.1. Plant Materials and Treatments

The experiments were performed in the orchard of the Seventh Company of the Tenth Regiment of Xinjiang Alar (81°28′ E, 40°58′ N) in China, with a test site of 624 m2 and a plant spacing of 1.5 m × 3 m. The jujube species selected for the study was “Junzao”, an 8-year-old grafted seedling with sour jujube rootstock, a tree height of 2.0–2.5 m, and a crown width of 1.8–2.2 m. The soil type of the test site was sandy soil, the orchard was flat, and the soil, fertilizer, and water management conditions were kept consistent throughout the study.
The experiments were performed using a one-way completely randomized design, with three treatments and three replicates for each treatment; four valid plants were selected for each treatment as a fixed survey sample, with a total of 36 jujube palms as the test samples. Long 90 cm deep trenches were dug between the rows of each treatment and isolated with double plastic film to prevent the short-term effect of saline treatments. Based on the salinity level of soils in jujube palm plantations in Alar Reclamation, the ratio of Cl to HCO3 in the soil was 3:1. Therefore, the following three saline mixture gradient treatments were set up using neutral salt NaCl and alkaline salt NaHCO3 in a 3:1 molar ratio: 0 mmol·L−1 (CK), 60 mmol·L−1 (LS), and 300 mmol·L−1 (HS) (pH 8.2). The plants in the treatment groups were provided with water and salt starting from the young fruit stage and with the saline solution every 14 d. To prevent the occurrence of salt excitation injury, saline solution was added starting from 1/2nd of each concentration, with a gradient increase after every day, and the set concentration was reached gradually after 2 days. During the experimental period, a plastic rain shelter with ventilation around the perimeter was provided to protect the plants against rainfall. Irrigation was controlled a few days before the saline treatment to allow rapid diffusion after pouring the saline solution.

4.2. Sample Collection

Fruit samples collected at 10 DAF (jujube fruits developed to a short columnar shape) were selected from the middle of jujube hangings at the periphery of the tree canopy. Furthermore, the fruits were collected during the critical periods of sugar accumulation at 60 DAF, 70 DAF, 85 DAF, 100 DAF, and 110 DAF, and 30 fruits of the same size were selected from different directions of the tree. The fruits were immediately brought back to the laboratory in a low-temperature incubator, followed by wipe cleaning, coring, and mixing. Finally, they were divided into two groups: one group was stored at −20 °C for determining sugar content, whereas the other group was stored at −80 °C in an ultra-low temperature refrigerator for transcriptome determination.

4.3. Determination of Sugar Composition

Sugar content in the jujube fruits was determined using high performance liquid chromatography (HPLC) [46]. Briefly, 1.0 g of quick-frozen pulp was accurately weighed using a scale precise to 0.001 g. Further, the pulp was transferred to a mortar and grinded until homogenized. The homogenate was then placed in an 80 °C water bath for 30 min, ensuring continuous oscillation during this period. Next, the mixture was centrifuged at 4000 rpm for 15 min, following which the supernatant was transferred into a 25 mL volumetric flask, using a filter membrane with a pore size of 0.22 μm. The sample was separated using an HPLC column, detected using an evaporative light scattering detector (ELSD), and quantified using the external standard method. Chromatographic conditions included the use of a Waters XBridgeTM BEH Amide column (4.6 mm × 250 mm, 5 μm) and a column temperature of 30 °C. The mobile phase consisted of acetonitrile and water in a 76:24 volume ratio, and the flow rate was 0.35 mL/min. The injection volume was 10 μL, the running time was 18 min, and each sample was measured three times in parallel. The standard curve was created using mass concentration (X) and peak area (Y), and a regression equation was established. The sugar content was calculated based on the peak area of the sample and the standard curve.

4.4. Transcriptomic Sequencing

Total RNA of the samples was extracted with an RNAprep Pure Plant kit (DP441, Tiangen, China). RNA quality was determined using the Agilent Bioanalyzer 2100 system (Agilent Technologies, Santa Clara, CA, USA). The mRNA was randomly fragmented. First-strand cDNA was synthesized using the M-MuLV reverse transcriptase system. The RNA strand was then degraded by RNase H, and second-strand cDNA was synthesized using DNA polymerase. After amplification and purification, cDNA libraries were obtained and sequenced using the Illumina Novaseq6000 system. Raw data were filtered to obtain clean reads.
The correlation among the samples was determined using Pearson’s correlation analysis (R2), and the principal component analysis was performed using the linear algebra method. FPKM was calculated based on the length of the gene and the number of reads mapped to the gene. The expression difference was analyzed using DESeq (1.20.0), and Padj value was obtained using the Benjamini and Hochberg methods to control the error discovery rate. After correction, Padj ≤ 0.05 and |Log 2-fold change| ≥ 1 were considered thresholds for significant DEGs. A heat map was generated using Metware Cloud, a free online platform for data analysis (https://cloud.metware.cn, 1 March 2020.).

4.5. Quantitative Real-Time PCR (qRT-PCR)

RNA was extracted using the TransGen Biotech TransZol Plant kit. The mortar, medicine spoon, centrifuge tube, and gun head used for RNA extraction were treated with diethyl pyrocarbonate water to create an enzyme-free environment, and all operations were performed at room temperature of 22 °C. cDNA was synthesized using the TransGen Biotech EasyScript® One-Step gDNA Removal and cDNA Synthesis SuperMix kits.
Fluorescence intensity was quantified using the TransGen Biotech TransStart® Green qPCR SuperMix kit. PCR was performed using the first strand of the synthesized cDNA as a template. The reaction system comprised 10.5 L of the cDNA template, 0.2 L of the forward and backward primers, two sets of 5 μL of PerfectStart Green qPCR SuperMix, 0.2 L of Passive Reference Dye, and 3.9 L of ddH2O. The fluorescence quantification PCR (Applied Biosystems T M QuantStudio TM 5, Thermo Fisher Scientific, Waltham, MA, USA) response procedure was set to 42 cycles of degeneration at 94 °C for 30 s, denaturation at 94 °C for 5 s, annealing at 55 °C for 15 s, and extension at 72 °C for 10 s. Finally, the system was heated from 1.6 °C/s to 95 °C/s and maintained at 95 °C for 15 s; it was then allowed to cool down for 60 s to 1.6 °C/s, and then maintained again at 0.075 °C/s. The selected and reference genes were amplified using three biological replicates each. The gene expression of the control group was used as a reference for analysis. The relative abundance of the transcripts was calculated using the 2−∆∆Ct method [47]. Primers used for qRT-PCR are shown in Table A3.

4.6. Statistical Analysis

Statistical analyses were performed using DPS 7.05. Values are presented as the mean (n = 3) ± standard error. Significant differences among individual treatments were determined using Duncan’s multiple range tests. Statistical significance was considered at p < 0.05.

5. Conclusions

In this study, we evaluated the content of sugar components in jujube fruits at different levels of saline–alkali stress and under different fruit developmental periods and found that mild saline–alkali stress increased the content of each sugar component and total sugar in the middle and late stages of fruit development, that is, from 85 DAF to 110 DAF, whereas severe saline–alkali stress suppressed the increase in their contents (Figure 2). We performed transcriptome data analysis and identified 31,718 DEGs associated with the accumulation of sugar components. Furthermore, we obtained 13 modules by using WGCNA, focusing on the “MEblue” module associated with sugar metabolism, and screened out 2437 trait-associated hub genes. The present study also revealed that most DEGs were associated with sucrose content in each sugar fraction in the advanced fruit development stages and with prolongation of stress exposure time; alglucose-6-phosphate phosphatase (LOC107418410), α-amylase (LOC107428855), α-glucosidase (LOC107418468), sucrose synthase (LOC107416188), and amylase genes (LOC107430415, LOC107406235) were highly correlated with sucrose content and were thus considered key genes for sucrose synthesis under saline–alkali stress. Further studies on the functions and regulatory networks of these key genes under saline–alkali stress are warranted.

Author Contributions

Y.W.: methodology, formal analysis, data curation, writing—original draft, and writing—review and editing. Y.F.: methodology, writing—original draft, writing—review and editing, and supervision. M.Y.: investigation, and formal analysis. X.P.: writing—review and editing. D.L.: funding acquisition and supervision. H.Y.: methodology and project administration. C.W.: funding acquisition, project administration, supervision, and writing—review and editing. All authors have read and agreed to the published version of the manuscript.

Funding

This research was funded by the Commissioned project of Agriculture and Rural Affairs Bureau of XPCC (2021011); Innovation and Entrepreneurship Platform and Base Construction Project of XPCC (2019CB001).

Data Availability Statement

The data presented in this study are available on request from the corresponding author.

Acknowledgments

The authors would like to thank the University of Tarim for supporting the project.

Conflicts of Interest

The authors declare that they have no known competing financial interests or personal relationships that could have appeared to influence the work reported in this paper.

Appendix A

Table A1. Quality control analysis of transcriptome data.
SampleRaw ReadsClean ReadsClean Base (G)Q20 (%)Q30 (%)GC Content (%)
60-DAF-CK-146896952447908626.7297.7693.7143.39
60-DAF-CK-246268966443180646.6597.6893.5243.37
60-DAF-CK-346738576441786786.6397.7493.6442.99
60-DAF-LS-148469392462202606.9397.7693.7843.12
60-DAF-LS-247989768458836486.8897.4993.0943.98
60-DAF-LS-344300870425340006.3897.7993.7643.99
60-DAF-HS-146304818442496086.6497.7393.5943.87
60-DAF-HS-245167064431237066.4797.8193.8143.90
60-DAF-HS-346913320447762046.7297.6793.4743.85
70-DAF-CK-145702590432703966.4997.8493.8944.03
70-DAF-CK-245251794429784766.4597.8293.8644.06
70-DAF-CK-347918850451744266.7897.8993.9544.00
70-DAF-LS-146171330434713646.5297.6993.5044.10
70-DAF-LS-247294346447662506.7197.8493.9044.01
70-DAF-LS-347601724448529666.7397.8793.9543.72
70-DAF-HS-147649234439378146.5997.5293.1143.56
70-DAF-HS-248466654461891126.9397.7193.5944.31
70-DAF-HS-347033076448195746.7297.8393.8844.25
85-DAF-CK-145329698431197286.4797.7693.6644.00
85-DAF-CK-245602142435194086.5397.7293.5844.28
85-DAF-CK-346332666437665486.5697.9294.0744.28
85-DAF-LS-146455296437008586.5697.6093.3144.02
85-DAF-LS-246716526442826526.6497.9294.0644.32
85-DAF-LS-345544790434410386.5297.7993.7443.98
85-DAF-HS-148330934454242206.8197.8693.9143.93
85-DAF-HS-246370896427959306.4297.8193.7743.63
85-DAF-HS-348670574446794406.7097.7293.5843.74
100-DAF-CK-146304964438290806.5797.6993.6143.49
100-DAF-CK-253693900516421447.7597.6893.4844.02
100-DAF-CK-346537854445580406.6897.9194.0544.03
100-DAF-LS-146128808439733126.6097.6593.5244.12
100-DAF-LS-247574422451219846.7797.7193.5444.15
100-DAF-LS-345359914431150126.4797.7193.5543.72
100-DAF-HS-144515002424894866.3797.6593.4043.50
100-DAF-HS-243910128420841826.3197.993.9944.03
100-DAF-HS-347919786457387626.8697.9194.0243.57
110-DAF-CK-145991250442768926.6497.6493.4043.47
110-DAF-CK-246090012440236426.6097.8393.8843.10
110-DAF-CK-344091626422547846.3497.6593.3943.28
110-DAF-LS-144423566415501346.2397.7893.7342.96
110-DAF-LS-247358900445065246.6897.6893.5944.03
110-DAF-LS-344703024411015246.1797.5593.2944.05
110-DAF-HS-147172650443361406.6597.7893.6744.25
110-DAF-HS-247821584448082706.7297.8093.7844.18
110-DAF-HS-348162024451154426.7797.9294.0544.15
Table A2. Alignment of the sample sequencing data to the reference genome sequence.
SampleTotal ReadsReads MappedUnique MappedMulti MappedRead1 MappedRead2 Mapped
60-DAF-CK-14479086289.94%77.31%2.64%38.75%38.56%
60-DAF-CK-24431806490.18%77.68%2.51%38.95%38.73%
60-DAF-CK-34417867889.89%77.36%2.53%38.78%38.58%
60-DAF-HS-14424960889.85%77.51%2.35%38.87%38.63%
60-DAF-HS-24312370689.91%77.50%2.41%38.82%38.67%
60-DAF-HS-34477620489.72%77.29%2.43%38.77%38.52%
60-DAF-LS-14622026090.21%77.63%2.58%38.85%38.78%
60-DAF-LS-24588364889.31%77.15%2.15%38.74%38.41%
60-DAF-LS-34253400089.97%77.69%2.28%38.92%38.77%
70-DAF-CK-14327039689.74%77.64%2.10%38.90%38.74%
70-DAF-CK-24297847689.48%77.39%2.09%38.78%38.61%
70-DAF-CK-34517442689.77%77.76%2.01%38.95%38.81%
70-DAF-HS-14393781489.04%76.96%2.08%38.68%38.28%
70-DAF-HS-24618911289.69%77.71%1.98%38.97%38.74%
70-DAF-HS-34481957489.71%77.61%2.10%38.88%38.72%
70-DAF-LS-14347136489.39%77.29%2.10%38.73%38.56%
70-DAF-LS-24476625089.83%77.59%2.24%38.86%38.73%
70-DAF-LS-34485296689.67%77.50%2.18%38.82%38.68%
85-DAF-CK-14311972889.74%78.12%1.63%39.14%38.97%
85-DAF-CK-24351940889.76%78.23%1.53%39.24%38.99%
85-DAF-CK-34376654889.60%77.90%1.69%39.02%38.88%
85-DAF-HS-14542422089.49%77.56%1.93%38.85%38.71%
85-DAF-HS-24279593088.71%77.04%1.67%38.61%38.43%
85-DAF-HS-34467944088.85%77.12%1.73%38.67%38.45%
85-DAF-LS-14370085889.34%77.86%1.49%39.08%38.78%
85-DAF-LS-24428265289.85%78.17%1.68%39.13%39.04%
85-DAF-LS-34344103889.81%78.18%1.63%39.17%39.01%
100-DAF-CK-14382908089.65%77.95%1.70%39.04%38.91%
100-DAF-CK-25164214489.92%78.39%1.53%39.34%39.05%
100-DAF-CK-34455804090.17%78.49%1.68%39.30%39.19%
100-DAF-HS-14248948689.96%78.25%1.72%39.25%39.00%
100-DAF-HS-24208418290.34%78.42%1.92%39.30%39.12%
100-DAF-HS-34573876290.26%78.41%1.84%39.27%39.14%
100-DAF-LS-14397331289.56%77.90%1.66%39.01%38.89%
100-DAF-LS-24512198489.92%78.25%1.67%39.25%39.00%
100-DAF-LS-34311501289.84%78.22%1.63%39.23%38.99%
110-DAF-CK-14427689289.83%77.89%1.94%39.07%38.82%
110-DAF-CK-24402364289.84%77.82%2.02%38.97%38.85%
110-DAF-CK-34225478489.79%78.02%1.77%39.12%38.90%
110-DAF-HS-14433614089.49%77.74%1.75%38.97%38.77%
110-DAF-HS-24480827089.38%77.57%1.82%38.87%38.70%
110-DAF-HS-34511544289.49%77.73%1.77%38.93%38.80%
110-DAF-LS-14155013489.44%77.44%2.00%38.80%38.65%
110-DAF-LS-24450652488.95%77.24%1.71%38.68%38.57%
110-DAF-LS-34110152487.87%76.37%1.50%38.26%38.11%
Table A3. Primer of qRT-PCR.
Gene IDPrimer Sequence (5′–3′)Primer Sequence (3′–5′)
LOC107406759CCTTCCTCAAGAGTATCGGTAGAGTTTCATCCAAACGCTC
LOC107409215GCATGGTTATTATGCGATTCTTAATGCTTTGACCAATGTCGT
LOC107410849TACTTGCATGAAGCCTTGAACCGGATCCATCTTCTGTAAC
LOC107416388GGGGTTTTCTACTTCACCACATTCCTTTGATTCAGGCACC
LOC107422103TGAGCATATGGGATAAGGCATGTCATGCCACAATGACAAT
LOC107422414CATGCCTCAGCAAATACTGTTCTTGGGTTCTGTGCCTTAT
LOC107426335GATCGATGAGGTGGACAATGCTTCCTGTGCGGATCTTATG
LOC107427369TACGATTCCTTAGGTGGCATTCTAATGGTATTTACTTGATAGCG
LOC107430742AGGCTAAACCCATATCGGAACTTCGTACGGAAAATCGACA
LOC107435312CCGAATTGCTTGGAGAGAAAAGATACTGGGAGTGAGAAGC
LOC107435837CTGCTGCAAACTCCAAGTATATTTTCTAAACCAACGCCGA
LOC112492534GCGTACTCACAGAAACTTGTCCAGCACTATATCTGCCTCT

References

  1. Liu, M.J.; Wang, J.R.; Wang, L.L.; Liu, P.; Zhao, J. The historical and current research progress on jujube—A superfruit for the future. Hortic. Res. 2020, 7, 119. [Google Scholar] [CrossRef] [PubMed]
  2. Gao, Q.H.; Wu, C.S.; Wang, M. The jujube (Ziziphus jujuba Mill.) fruit: A review of current knowledge of fruit composition and health benefits. J. Agric. Food Chem. 2013, 61, 3351–3363. [Google Scholar] [CrossRef] [PubMed]
  3. Gao, Q.H.; Wu, C.S.; Yu, J.G.; Wang, M.; Ma, Y.J.; Li, C.L. Textural characteristic, antioxidant activity, sugar, organic acid, and phenolic profiles of 10 promising jujube (Ziziphus jujuba Mill.) selections. J. Food Sci. 2012, 77, C1218–C1225. [Google Scholar] [CrossRef] [PubMed]
  4. Shi, X.J.; Xiong, J.R.; Yang, X.L.; Kadambot, H.M.; Du, T.S. Carbon footprint analysis of sweet sorghum–based bioethanol production in the potential saline—Alkali land of northwest China. J. Clean. Prod. 2022, 349, 131476. [Google Scholar] [CrossRef]
  5. Sagervanshi, A.; Geilfus, C.M.; Kaiser, H.; Mühling, K.H. Alkali salt stress causes fast leaf apoplastic alkalinization together with shifts in ion and metabolite composition and transcription of key genes during the early adaptive response of Vicia faba L. Plant Sci. 2022, 319, 111253. [Google Scholar] [CrossRef]
  6. Yan, K.; Cui, J.X.; Zhi, Y.B.; Su, H.Y.; Yu, S.Y.; Zhou, S.W. Deciphering salt tolerance in tetraploid honeysuckle (Lonicera japonica Thunb.) from ion homeostasis, water balance and antioxidant defense. Plant Physiol. Biochem. 2023, 195, 266–274. [Google Scholar] [CrossRef]
  7. Zhang, X.Y.; Li, S.H.; Tang, T.; Liu, Y.D.; Muhammad, M.T.; Wang, C.; Meng, Z.Q.; Niu, J.X.; Yang, W.W.; Ma, J.J.; et al. Comparison of morphological, physiological, and related–gene expression responses to saline–alkali stress in eight apple rootstock genotypes. Sci. Hortic. 2022, 306, 111455. [Google Scholar] [CrossRef]
  8. Effler, R.S.; Goyer, R.A. Baldcypress and water tupelo sapling response to multiple stress agents and reforestation implications for Louisiana swamps. For. Ecol. Manag. 2006, 226, 330–340. [Google Scholar] [CrossRef]
  9. Zushi, K.; Higashijima, M. Correlation network analysis identified the key interactions of texture profiles with the sensory, physical, and organoleptic properties of cherry tomato cultivars grown under salt stress. Sci. Hortic. 2022, 293, 110754. [Google Scholar] [CrossRef]
  10. Wang, P.J.; Xu, Z.J.; Zhang, Y.; Ma, Y.B.; Yang, J.Y.; Zhou, F.; Gao, Y.; Li, G.B.; Hu, X.H. Over-expression of spermidine synthase 2 (SlSPDS2) in tomato plants improves saline–alkali stress tolerance by increasing endogenous polyamines content to regulate antioxidant enzyme system and ionic homeostasis. Plant Physiol. Biochem. 2022, 192, 172–185. [Google Scholar] [CrossRef]
  11. Shi, X.L.; Zhou, Y.F.; Zhao, X.H.; Guo, P.; Ren, J.Y.; Zhang, H.; Dong, Q.Q.; Zhang, Z.; Yu, H.Q.; Wan, S.B. Soil metagenome and metabolome of peanut intercropped with sorghum reveal a prominent role of carbohydrate metabolism in salt–stress response. Environ. Exp. Bot. 2023, 209, 105274. [Google Scholar] [CrossRef]
  12. Li, C.H.; Wan, Y.F.; Shang, X.L.; Fang, S.Z. Integration of transcriptomic and metabolomic analysis unveils the response mechanism of sugar metabolism in Cyclocarya paliurus seedlings subjected to PEG–induced drought stress. Plant Physiol. Biochem. 2023, 201, 107856. [Google Scholar] [CrossRef] [PubMed]
  13. Jiang, W.Q.; Li, N.; Zhang, D.P.; Meinhardt, L.; Cao, B.; Li, Y.J.; Song, L.H. Elevated temperature and drought stress significantly affect fruit quality and activity of anthocyanin–related enzymes in jujube (Ziziphus jujuba Mill. cv. ‘Lingwuchangzao’). PLoS ONE 2020, 15, e0241491. [Google Scholar] [CrossRef] [PubMed]
  14. Zhu, C.M.; Liu, Z.Y.; Chang, X.Y.; Zhang, Z.J.; Shi, W.C.; Zhang, Z.R.; Zhao, B.L. Analysis of the Alternative Splicing Events of Exogenousδ–Aminolevulinic Acid under NaCl Stress in Wild Jujube Seedlings. Forests 2022, 12, 2076. [Google Scholar] [CrossRef]
  15. Zhang, Z.; Xing, Y.; Ramakrishnan, M.; Chen, C.; Xie, F.; Hua, Q.; Chen, J.; Zhang, R.; Zhao, J.; Hu, G.; et al. Transcriptomics–based identification and characterization of genes related to sugar metabolism in ‘Hongshuijing’ pitaya. Hortic. Plant J. 2022, 8, 450–460. [Google Scholar] [CrossRef]
  16. Hao, Q.; Yang, L.; Fan, D.; Zeng, B.; Jin, J. The transcriptomic response to heat stress of a jujube (Ziziphus jujuba Mill.) cultivar is featured with changed expression of long noncoding RNAs. PLoS ONE 2021, 16, e0249663. [Google Scholar] [CrossRef]
  17. Zhao, J.; Li, S.; Xu, Y.; Ahmad, N.; Kuang, B.; Feng, M.; Wei, N.; Yang, X. The subgenome Saccharum spontaneum contributes to sugar accumulation in sugarcane as revealed by full–length transcriptomic analysis. J. Adv. Res. 2023. [Google Scholar] [CrossRef]
  18. Chen, X.; Chen, R.H.; Wang, Y.F.; Wu, C.Y.; Huang, J. Genome-Wide Identification of WRKY Transcription Factors in Chinese jujube (Ziziphus jujuba Mill.) and Their Involvement in Fruit Developing, Ripening, and Abiotic Stress. Genes 2019, 10, 360. [Google Scholar] [CrossRef]
  19. Wu, Z.; Li, H.; Wang, Y.D.; Yang, D.J.; Tan, H.J.; Zhan, Y.; Luo, Y.; Chen, G. Optimization extraction, structural features and antitumor activity of polysaccharides from Z. jujuba cv. Ruoqiangzao seeds. Int. J. Biol. Macromol. 2019, 135, 1151–1161. [Google Scholar] [CrossRef]
  20. Zhang, C.M.; Bian, Y.; Hou, S.H.; Li, X.G. Sugar transport played a more important role than sugar biosynthesis in fruit sugar accumulation during Chinese jujube domestication. Planta 2018, 248, 1187–1199. [Google Scholar] [CrossRef]
  21. Wang, L.N.; Chen, C.; He, R.J.; Cyren, M.R.; Mao, Q.Y.; Sun, P.L. Tree age and maturity stage affect reducing sugars, organic acids and minerals in Ziziphus jujuba Mill. cv. Huping fruits. J. Food Compos. Anal. 2023, 115, 105007. [Google Scholar] [CrossRef]
  22. Zhang, Y.; Zheng, L.H.; Li, M.Z.; Deng, X.L.; Ji, R.H. Predicting apple sugar content based on spectral characteristics of apple tree leaf in different phenological phases. Comput. Electron. Agric. 2015, 112, 20–27. [Google Scholar] [CrossRef]
  23. Liu, X.M.; Hu, C.X.; Liu, X.D.; Riaz, M.; Liu, Y.; Dong, Z.H.; Tan, Q.L.; Sun, X.S.; Wu, S.W.; Tan, Z.H. Effect of magnesium application on the fruit coloration and sugar accumulation of navel orange (Citrus sinensis Osb.). Sci. Hortic. 2022, 304, 111282. [Google Scholar] [CrossRef]
  24. Wu, B.H.; Quilot, B.; Génard, M.; Kervella, J.; Li, S.H. Changes in sugar and organic acid concentrations during fruit maturation in peaches, P. davidiana and hybrids as analyzed by principal component analysis. Sci. Hortic. 2005, 103, 429–439. [Google Scholar] [CrossRef]
  25. Yang, C.; Zhao, X.; Luo, Z.; Wang, L.; Liu, M.J. Genome-wide identification and expression profile analysis of SWEET genes in Chinese jujube. PeerJ 2023, 11, e14704. [Google Scholar] [CrossRef] [PubMed]
  26. Qing, H.G.; Wu, C.S.; Wang, M. Effect of Drying of Jujubes (Ziziphus jujuba Mill.) on the Contents of Sugars, Organic Acids, α-Tocopherol, β-Carotene, and Phenolic. J. Agric. Food Chem. 2012, 60, 9642–9648. [Google Scholar]
  27. Guo, S.; Duan, J.A.; Qian, D.W.; Tang, Y.P.; Wu, D.W.; Su, S.L.; Wang, H.Q.; Zhao, Y.N. Content variations of triterpenic acid, nucleoside, nucleobase, and sugar in jujube (Ziziphus jujuba) fruit during ripening. Food Chem. 2015, 167, 468–474. [Google Scholar] [CrossRef]
  28. Yamada, H.; Takimoto, S.; Toshinari, D.; Kataoka, K.; Habu, T. Effect of Seawater Irrigation on Water Relations and Fruit Quality in Potted Citrus Trees. Hortic. J. 2015, 84, 195–201. [Google Scholar] [CrossRef]
  29. Debouba, M.; Gouia, H.; Suzuki, A.; Ghorbel, M.H. NaCl stress effects on enzymes involved in nitrogen assimilation pathway in tomato “Lycopersicon esculentum” seedlings. J. Plant Physiol. 2006, 163, 1247–1258. [Google Scholar] [CrossRef]
  30. Galli, V.; Messias, R.S.; Perin, E.C.; Borowski, J.M.; Bamberg, A.L.; Rombaldi, C.V. Mild salt stress improves strawberry fruit quality. LWT 2016, 2016, 693–699. [Google Scholar] [CrossRef]
  31. Akrami, M.; Arzani, A. Inheritance of fruit yield and quality in melon (Cucumis melo L.) grown under feld salinity stress. Sci. Rep. 2019, 9, 7249. [Google Scholar] [CrossRef] [PubMed]
  32. Tao, H.X.; Sun, H.Q.; Wang, Y.F.; Wang, X.; Guo, Y.P. Effects of water stress on quality and sugar metabolism in ‘Gala’ apple fruit. Hortic. Plant J. 2023, 9, 60–72. [Google Scholar] [CrossRef]
  33. Yu, L.; Shao, X.F.; Wei, Y.Y.; Xu, F.; Wang, H.F. Sucrose degradation is regulated by 1–methycyclopropene treatment and is related to chilling tolerance in two peach cultivars. Postharvest Biol. Technol. 2017, 124, 25–34. [Google Scholar] [CrossRef]
  34. Kheir, A.; Ali, E.F.; He, Z.; Ali, O.A.M.; Feike, T. Recycling of sugar crop disposal to boost the adaptation of canola (Brassica napus L.) to abiotic stress through different climate zones. J. Environ. Manag. 2021, 281, 111881. [Google Scholar] [CrossRef] [PubMed]
  35. Kosar, F.; Akram, N.A.; Sadiq, M.; Al-Qurainy, F.; Ashraf, M. Trehalose: A Key Organic Osmolyte Effectively Involved in Plant Abiotic Stress Tolerance. J. Plant Growth Regul. 2019, 38, 606–618. [Google Scholar] [CrossRef]
  36. Tan, J.; Wang, X.J.; Wang, L.; Zhou, X.Q.; Liu, C.L.; Ge, J.L.; Bian, L.; Chen, S.Q. Transcriptomic responses to air exposure stress in coelomocytes of the sea cucumber, Apostichopus japonicus. Comp. Biochem. Physiol. Part D Genom. Proteom. 2022, 42, 100963. [Google Scholar] [CrossRef]
  37. Liang, Y.H.; Wang, S.S.; Zhao, C.H.; Ma, X.W.; Zhao, Y.Y.; Shao, J.; Li, Y.B.; Li, H.L.; Song, H.W.; Ma, H.; et al. Transcriptional regulation of bark freezing tolerance in apple (Malus domestica Borkh.). Hortic. Res. 2020, 7, 205. [Google Scholar] [CrossRef] [PubMed]
  38. Wang, Y.Z.; Dai, M.S.; Cai, D.Y.; Shi, Z.B. Proteome and transcriptome profile analysis reveals regulatory and stress–responsive networks in the russet fruit skin of sand pear. Hortic. Res. 2020, 7, 16. [Google Scholar] [CrossRef]
  39. Jia, X.M.; Zhu, Y.F.; Hu, Y.; Zhang, R.; Cheng, L.; Zhu, Z.L.; Zhao, T.; Zhang, X.Y.; Wang, Y.X. Integrated physiologic, proteomic, and metabolomic analyses of Malus halliana adaptation to saline–alkali stress. Hortic. Res. 2019, 6, 91. [Google Scholar] [CrossRef]
  40. Deng, C.H.; Zhang, Z.B.; Yan, G.R.; Wang, F.; Zhao, L.J.; Liu, N.; Abudukeyoumu, A.; Li, Y.S.; Wang, W.; Shi, S.B. Salt–responsive transcriptome analysis of triticale reveals candidate genes involved in the key metabolic pathway in response to salt stress. Sci. Rep. 2020, 10, 20669. [Google Scholar] [CrossRef]
  41. Guo, H.J.; Huang, Z.J.; Li, M.Q.; Hou, Z.N. Growth, ionic homeostasis, and physiological responses of cotton under different salt and alkali stresses. Sci. Rep. 2020, 10, 21844. [Google Scholar] [CrossRef] [PubMed]
  42. Huang, J.; Zhang, C.M.; Zhao, X.; Fei, Z.J.; Wan, K.K.; Zhang, Z.; Pang, X.M.; Yin, X.; Bai, Y.; Sun, X.Q.; et al. The Jujube Genome Provides Insights into Genome Evolution and the Domestication of Sweetness/Acidity Taste in Fruit Trees. PLoS Genet. 2016, 12, e1006433. [Google Scholar] [CrossRef] [PubMed]
  43. Liu, Z.J.; Zhao, P.C.; Cui, L.W.; Fang, J.G.; Jia, H.F. Over-expression of Gene FaASR Promotes Strawberry Fruit Coloring. Hortic. Plant J. 2015, 3, 147–154. [Google Scholar]
  44. Xu, W.J.; Wei, Y.Y.; Wang, X.X.; Han, P.P.; Chen, Y.; Xu, F.; Shao, X.F. Molecular cloning and expression analysis of hexokinase genes in peach fruit under postharvest disease stress. Postharvest Biol. Technol. 2021, 172, 111377. [Google Scholar] [CrossRef]
  45. Zhu, X.D.; Wang, M.Q.; Li, X.P.; Jiu, S.T.; Wang, C.; Fang, J.G. Genome–Wide Analysis of the Sucrose Synthase Gene Family in Grape (Vitis vinifera): Structure, Evolution, and Expression Profiles. Genes 2017, 8, 111. [Google Scholar] [CrossRef]
  46. Wang, Y.; Feng, Y.F.; Yan, M.; Yu, J.; Zhou, X.F.; Bao, J.K.; Zhang, Q.Q.; Wu, C.Y. Effect of Saline–Alkali Stress on Sugar Metabolism of Jujube Fruit. Horticulturae 2022, 8, 474. [Google Scholar] [CrossRef]
  47. Kenneth, J.L.; Thomas, D.S. Analysis of Relative Gene Expression Data Using RealTime Quantitative PCR and the 2−∆∆Ct Method. Methods 2001, 4, 402–408. [Google Scholar]
Figure 1. Phenotypic characteristics of jujube fruits under saline–alkali stress. CK: no saline–alkali stress treatment; LS: jujube fruits under low saline–alkali stress treatment; HS: jujube fruits under high-saline–alkali stress treatment; DAF: days after flowering. Horizontal row represents saline–alkali stress treatment, and vertical row represents the developmental stage.
Agronomy 13 02243 g001
Figure 2. Changes in sugar content in jujube fruit under salt–alkali stress at different development stages. Vertical bars are the mean ± SE (n = 3). Different letters above the bars indicate significant differences at the 0.05 level by Duncan’s multiple range test.
Agronomy 13 02243 g002
Figure 3. Correlation heat map (A) and cluster analysis diagram (B) of the samples.
Agronomy 13 02243 g003
Figure 4. The weighted co-expression network analysis results. (A) Selection of soft threshold: the scale-free network fitting index corresponds to different soft threshold R2 (the red line represents R2 = 0.85), and the average connection degree corresponds to different soft thresholds. (B) Gene cluster tree and module division of the gene co-expression network: the top is the cluster tree obtained from the gene cluster, the bottom cut the module according to the branch of the tree, and the same modules are represented in the same color. (C) Heatmap of the correlation between gene co-expression network modules and traits: the horizontal axis indicates the traits, whereas the vertical axis indicates the name of each module. The values in the grid indicate the correlation coefficient between the module and the trait. (D) Bubble diagram of Kyoto Encyclopedia of Genes and Genomes (KEGG) enrichment analysis of the “MEblue” module: ordinate represents KEGG entry, and abscissa represents enrichment. The size of the dots represents the number of genes enriched. The color of the dots indicates statistical significance. (E) Gene ontology (GO) enrichment bubble map of the “MEblue” module: the ordinate represents the number of enriched genes, and the abscissa represents the GO entry.
Agronomy 13 02243 g004
Figure 5. Co-expression network plot of core genes and sugar components. (AC) represent 85 DAF, 100 DAF, and 110 DAF, respectively. Co-expression network plot of core genes and sugar components. Blue to turquoise circles represent core genes, red to orange round rectangle represent sugar components, red lines represent positive regulation, and blue lines represent negative regulation. (D) Co-expression plots of sucrose and metabolic pathway genes. Red round rectangle represent sugar components, and green circles represent core genes.
Agronomy 13 02243 g005
Figure 6. Quantitative reverse transcription-polymerase chain reaction (qRT-PCR) validation of the genes. Y-axis on the left indicates the qRT-PCR expression data (bar graph), and the y-axis on the right indicates the RNA-seq data with FPKM value (line graph). X-axis represents the saline–alkali stress treatment. Vertical lines on the bar chart represent the standard deviation.
Agronomy 13 02243 g006
Table 1. The number of DEGs between different comparison groups.
GroupUpregulatedDownregulatedDEGs
60-DAF-CK_vs_LS17694270
70-DAF-CK_vs_LS3763100
85-DAF-CK_vs_LS221133
100-DAF-CK_vs_LS333164
110-DAF-CK_vs_LS343468
60-DAF-CK_vs_HS368244612
70-DAF-CK_vs_HS9960159
85-DAF-CK_vs_HS207176383
100-DAF-CK_vs_HS206197403
110-DAF-CK_vs_HS305434739
60-DAF-LS_vs_HS6965134
70-DAF-LS_vs_HS73126199
85-DAF-LS_vs_HS128230358
100-DAF-LS_vs_HS170220390
110-DAF-LS_vs_HS282262544
Disclaimer/Publisher’s Note: The statements, opinions and data contained in all publications are solely those of the individual author(s) and contributor(s) and not of MDPI and/or the editor(s). MDPI and/or the editor(s) disclaim responsibility for any injury to people or property resulting from any ideas, methods, instructions or products referred to in the content.

