Article

Elucidation of the Genetic Diversity within Some In Situ Shea Germplasm in Ghana

by
Wisdom Edem Anyomi
1,*,
Michael Teye Barnor
1,
John Saviour Yaw Eleblu
2,
Agyemang Danquah
2,
Silas Wintuma Avicor
3,
Kwadwo Ofori
2,
Iago Hale
4,
Francis Kwame Padi
3 and
Eric Yirenkyi Danquah
2
1
Cocoa Research Institute of Ghana, Bole Sub-Station, Bole P.O. Box BL 41, Ghana
2
West Africa Center for Crop Improvement, School of Agriculture, College of Basic and Applied Sciences, University of Ghana, Accra PMB 30, Ghana
3
Cocoa Research Institute of Ghana, New Tafo-Akim P.O. Box 8, Ghana
4
Department of Agriculture, Nutrition, and Food Systems, University of New Hampshire, Durham, NH 03824, USA
*
Author to whom correspondence should be addressed.
Agronomy 2023, 13(9), 2256; https://doi.org/10.3390/agronomy13092256
Submission received: 17 July 2023 / Revised: 10 August 2023 / Accepted: 17 August 2023 / Published: 28 August 2023

Abstract

:
Shea is an agroforestry tree species known primarily for its rich butter, which contains stearin and tocopherol, and has ultraviolet ray absorption property; it is used in cooking, body care and traditional medicines. This tree is, however, uncultivated and collection of its nuts by rural dwellers is threatened by increased urbanization with its accompanying land use pressure and the need for fuel wood for rural households. There is also increased demand for shea products worldwide necessitating the need for shea improvement strategies. At the apex of this improvement program lies the need for germplasm collection, characterization, conservation and utilization. In order to conserve elite shea materials amidst dwindling shea populations threatened by climate change, there is a need to develop shea germplasm banks based on the representation of genetic and phenotypic variation focusing on known traits. The objective of the study was to evaluate 282 shea accessions for germplasm conservation and to determine the genetic diversity of the collected materials to inform future collections and drive crop improvement strategies. Leaf traits were used to differentiate and group the selected materials. Leaf length ranged between 16.83 cm and 30.85 cm, and leaf blade length ranged between 12.28 cm and 20.68 cm. Petiole length varied between 5.53 cm and 10.2 cm and the blade to petiole ratio was from 1.41 to 2.69. Correlation studies revealed significant negative correlation between the latitude of collection and all leaf traits measured. There was significant positive correlation between blade length and petiole length (0.57), blade length and total leaf length (0.87) and petiole length and breadth (0.49). The collected materials were grouped at 90% into two, based on the morphological descriptors studied. Three different approaches were employed to genetically analyze the materials based on single nucleotide polymorphic markers (SNP). A phylogenetic tree was constructed based on the SNPs generated; this grouped the materials into three, with various subgroups. Principal coordinate analysis also produced three distinct groups with groupings not based on geographical area of collection. Discriminant analysis of principal components (DAPC) also confirmed three groupings. The genetic diversity of the collection was very low (Hs) = 0.0406, which is an indication of potential inbreeding within the shea populations. To conclude, there was higher variation within locations than between locations.

1. Introduction

Shea trees (Vitellaria paradoxa) naturally occur in a wide area in Ghana (latitude 8–10° N). Shea nuts contain stearin and form a very important source of oil in West Africa [1], where it is used mainly in cooking and for body care products. Internationally, it is a substitute for cocoa butter in the bakery industry, as well as in the manufacture of pharmaceuticals and cosmetics [2]. Growing wild, these trees have not been selected intentionally for cultivation, a few exceptions being naturally regenerated seedlings protected by indigenous farmers on their fields. The vast geographical distribution of shea trees provides a huge resource which needs to be evaluated and selected for germplasm conservation. Genetic erosion through urbanization, the need for firewood and charcoal for rural homes [3] and increased agricultural mechanization activities have been a major threat to the sustainability of the shea industry. Shea is a perennial tree species that produces hermaphrodite flowers, with the style slightly exerted outside the stamen whorl [4]. Bagging the flowers results in no fruit set, which is very indicative of outcrossing species. However, when pollens are picked from flowers on the same tree and used to pollinate stigmas on the same tree, fertilization and fruit set occurs, indicating that it is self-fertilizing (personal observation). Bees are the main pollinating agents of the species [5] and bats are implicated in their seed dispersal [6]. According to [7,8], shea is a diploid genome with a chromosome number of 2n (24).
To develop shea as an agricultural crop that could be managed by farmers on large-scale plantations, there is a need to collect germplasm resources. Germplasm collection and conservation is important for any crop improvement activity and for shea especially. This will ensure that as many shea resources are stored in gene banks for crop improvement purposes. Diversity studies aid in effective germplasm collection by removing duplications and ensuring judicious use of resources and also allow for the estimation of important genetic parameters like inbreeding and the level of heterozygosity in the collection. Earlier diversity studies of shea were based on micro populations with mainly morphological traits and few molecular markers, namely, single sequence repeats (SSRs) [9,10], random amplified polymorphic DNAs (RAPDs) [11], and isozymes [12].
A more informative molecular technique that is available is single nucleotide polymorphisms (SNPs). These are DNA-based techniques which involve a single base change in alleles encoding a gene, and they occur at a much more frequent rate than other techniques and can be found within coding and non-coding regions. Their effects can result in modified phenotypes or no change at all, as in silent mutations. Genotyping-by-sequencing (GBS) is a high-throughput technology offering a fast, effective and easy way of identifying polymorphism within organisms. Its wide genomic coverage ensures the identification of SNPs for various traits within organisms [13,14]. SNPs serve as good markers for genetic studies and crop improvement, often expressing as phenotypic traits such as response to stresses, flowering time and fruit traits [15]; they are very useful for differentiating germplasms and for mapping traits of interest. This method offers stability and immortal data as opposed to the agro-morphological methods that are highly affected by the environment [16].
The objective of this study was to evaluate the diversity within tagged shea trees covering all agro-ecologies within the shea belt of Ghana, using SNPs, to inform crop improvement strategies and germplasm collection and conservation methods.

2. Materials and Methods

2.1. Evaluated Genotypes and Study Area

Six regions, namely, the Upper East, North East, Northern, Upper West, Savanna and Volta regions of Ghana where tagged trees are located were involved in this research. The areas fall within the Sudan savanna which is characterized by uni-modal rainfall of about 1000 mm per year with low relative humidity during the Harmattan. The Guinea savanna also has a single rainfall season of about 1100 mm of rain but is more humid than the Sudan savanna. The transitional zone, with rainfall of about 1300 mm per year, has high relative humidity for most part of the year, and the coastal savanna has about 800 mm of rain, which is bi-modal annually. The Upper East, North East, Northern, Upper West and Savanna Regions are located in the northern part of Ghana and constitute the main shea belt of the country. The Volta region, however, remains an unexplored shea population. Adaklu, Mafe-Adidome and Juapong host some large populations of shea in the Volta region. A total of two hundred and eighty-two (282) shea germplasms were evaluated.

2.2. Data Collection

Ten fully matured leaves without any physical or insect damage were harvested from each tree for the morphological assessment. Data on leaf blade length, total leaf length, petiole length and leaf width were recorded with the aid of a ruler.

2.2.1. Sampling of Leaves for Genotyping-by-Sequencing

Diversity Arrays Technology Sequencing (DArT-seq) was used in genotyping the materials. A total number of 282 shea germplasms were sent for sequencing using cut leaf disc samples. Leaf discs were prepared by cutting eight small round leaf discs out of the leaf samples, these were placed into sampling tubes provided by the Diversity Array company, after which silica gel was placed on the sample and labeled. The cutter was cleaned with 70% ethanol after working on each specimen.

2.2.2. Sequencing

Four reduction complexity methods were tested using Diversity Arrays Technology Pty Ltd. when developing the method for Vitellaria paradoxa, after which the PstI-MseI procedure was chosen. DNA materials were subjected to digestion and ligation as per the protocol of [17], however; one PstI-compatible adaptor was replaced by two dissimilar adaptors resulting in two overhangs of restriction enzyme (RE). The PstI-compatible adapter has an attachment sequence for Illumina flow cell, a primer sequence to enable sequencing and “staggered” barcode with variable length, which resembles the one used in [13]. It also had a reverse adapter positioned within the flow cell attachment section and an MseI-compatible overhang sequence. Mixed fragments of (PstI-MseI) were amplified under the standard thermal cycle conditions of a polymerase chain reaction (PCR).
An equal amount of DNA-amplified product from 96 wells was bulked after PCR and applied to c-Bot (Illumina) bridge. Sequencing was performed using the Illumina Hiseq2500 platform and 77 cycles were run for the sequencing read. The generated sequences were prepared using DArT proprietary analytical systems. Poor sequences were filtered by applying stringent screening on fastq files generated; this process was performed in the barcode region. About 2,500,000 sequences per barcode were used for calling markers. Any observed sequences that were deemed identical were collapsed into “fastqcoll files”. The fastqcoll files were “groomed” using DArT PL’s algorithm, correcting low base quality from singleton tags to a correct base using the collapsed tags with multiple members as a template. The “groomed” fastqcoll files were used in the secondary pipeline for DArT PL’s proprietary SNP and SilicoDArT (presence/absence of restriction fragments in representation) calling algorithms (DArTsoft14). To call SNP, DArTsoft14 was used. Every library with tags was involved in the clustering, which was based on a C++ algorithm within DArT PL with a threshold of 3. Calling quality was assured by high average read depth per locus.

2.3. Data Analysis

Descriptive statistics, principal component analysis and clustering were performed on phenotypic traits using XLSTAT 2020.5.1.1050 and R software version 4.1.0.
The DArtseq sequence data received were analyzed using the dartR package in R [18]. This holds the data in a special matrix called ‘genlight’ objects for data analysis using R commands in adegenet [18,19].

3. Results

3.1. Morphological

All leaf traits studied showed considerable variations. Leaf blade length ranged from 12.28 cm to 20.68 cm with a mean of 14.89; similarly, leaf length ranged between 18.63 cm and 30.85 cm with an average of 22.33 (Table 1).

3.2. Multivariate Analysis

3.2.1. Correlation among Traits

Pearson correlation revealed that the latitude from which materials were collected was significantly correlated with all traits measured (Table 2). Latitude was negatively correlated with all traits but blade to petiole ratio. Blade length was positively highly correlated with total length (0.87) and petiole length (0.57). Petiole length was also significantly correlated with leaf breadth and petiole to blade ratio (−0.67). Leaf breadth was also positively correlated with total leaf length (p < 0.05, 0.41).

3.2.2. Genotype-Trait Association

The principal component biplot shows the relationship between the measured traits and the locations from which the materials were collected. The first two components contributed to 85.1% of the observed variations within the germplasm (Table 3). Blade length, petiole length, breadth and total leaf length were traits that were positively correlated, whereas blade to petiole ratio was negatively correlated with the PC1. Petiole length and breadth were negatively correlated to PC2, blade length and total leaf length, and blade to petiole ratios were positively correlated to PC2.
Blade length, petiole length and total leaf length contributed most to the variations expressed by PC1 and blade to petiole ratio and blade length contributed to the majority of variation accounted for by PC2. On PC2, petiole length and breadth were negatively correlated, but all other traits were positively correlated.
Comparing the relationship between traits and the location of germplasm collection, it was observed that the locations associated with the first two PCs indicated that materials from Zang, Bole, Kintampo, Kebiesu, Tamale, Saronoase and Tingoli were associated with blade length and total leaf length. Accessions from Volta, Tusani, Gbungbaliga, Busunu, Wariebogu, Chache and Damongo were associated with petiole length and leaf breadth. Materials from Navrongo, Binduri, Paga, Bawku, Garu, Funsi and Wellembele were associated with leaf blade to petiole ratio, and materials from Gulumpe, Lawra, Wa, Loagri, Nandom and Fufulso were not actively associated with any specific traits (Figure 1a).
A dendrogram was constructed using leaf morphological data, based on agglomerative hierarchical clustering using UPGMA (Figure 1b). This separated the germplasm into two main clusters (“A” and “B”) at 90%. Major cluster “A” was further separated at 40% into two more clusters. Similarly, major cluster “B” was also divided at 70% into two sub clusters. At 65%, two more clusters were formed, and finally another cluster separation was formed at 60%, generating the two clusters with the largest group populations. Materials from Hamile and Nandom clustered together; similarly, materials from Saronoase and Zang, and Chiranda and Lawra also clustered together.
The group A cluster seems to be composed of materials from drier parts of the country where there is lower moisture and relative humidity for long spells of the year. They seem to have average leaf blade length of 14 cm and blade width smaller than the population average, that is, a medium-length blade with a smaller width. This group also possessed a smaller petiole length. Group B materials are clustered from areas with fairly higher relative humidity and precipitation compared to the first group. Zang and Saronoase clustered separately from the rest; their leaf parameters indicate that they were the largest.

3.3. Single Nucleotide Polymorphism Analysis

Two hundred and eighty-two genotypes (282) were taken from specific populations nationwide and sent for sequencing. The populations studied covered 34 communities in Ghana (Figure 2) and ranged from a single tree per population to 54 trees per population.
A total of 12,103 loci involving 263 genotypes were covered after the sequencing, which generated 94,985 SNPs with 26.76% missing data. Generally, the call rate per locus ranged from 0.18 to 1.0. (Figure 3A); however, the average was 0.73. A series of filtering steps were performed to improve the quality of the final SNPs for analysis. The first was filtering by SNP call rate, with 95% as the threshold; this resulted in call rates between 0.94 and 1.0 (Figure 3B). All monomorphic loci were removed, and the results were filtered for trimmed sequence tags using a hamming distance of less than 0.25; this resulted in 12,101 binary SNPs for the remaining 239 diploid genotypes.

3.4. Diversity and Genetic Relationship

The genetic parameters of the population are summarized in Table 4. The heterozygosity within the materials (Ho) was 0.034, the genetic diversity (Hs) was 0.0406, the fixation index was 0.0022, and the population differentiation was 0.0001.
Although the observed heterozygosity in the populations was about 0.034, the expected heterozygosity ranged from 0.015 to 0.03 (Figure 3C). Busunu, Chiranda, Fufulso, Kintampo, Kukua, Loagri, Navrongo, Saronoase, Tingoli, Tusani and Zang had higher observed heterozygosity than expected heterozygosity (Supplementary Figure S1).
Clustering was based on inter-population Euclidean distance involving 12,103 loci with a minimum distance of 5.01, a maximum of 18.78, and an average distance of 16.84 (Figure 3D).
A phylogenetic tree constructed based on the Euclidean distance calculation using neighbor-joining clustering had 34 tips and 32 internal nodes. Three branches were obtained. The first branch consisted of five locations with two sub-branches. The first sub-branch had only one location, Lawra, and the other sub-branch had four locations, Tamale, Bawku, Diani and Binduri. The next branch, which is in the middle, consisted of eight locations with two main sub-branches. The first sub-branch consisted of seven locations separated into three sub-units. The second sub-branch consisted of only Paga. The third main branch consisted of twenty-one locations separated into two main sub-branches with many other peripheral branches. Walewale and Wellembele, Gulumpe, Nandom and Kebiesu, Kukua, Saronoase, Chiranda and Kintampo were all sub-branches within the third main branch (Figure 4).

3.5. Multivariate Analysis

The first 10 principal components (PC) were deemed to have contributed most to the observed genotypic diversity (Supplementary Figure S2) and were used in the principal coordinate analysis (PCoA). The SNPs contributed from 1.5% to 0.4% of the total variation observed in a total of 100 PCs. More than eighty eigenvalues were also observed to have contributed to the total variations (Supplementary Figure S3) with a contribution between 1.7% and 0.5% of the observed variations.
The PCoA biplot showed that the first two components cumulatively contributed to 3.1% of the observed variations (Figure 5), with the first component alone contributing 1.7%. The germplasm formed three main clusters; the first two clusters were closer together and the third was widely separated from them. Materials within clusters were more closely related than those outside the clusters. Materials from Bole, Busunu, Funsi, Garu, Paga, Wa, Zang, Loagri, Kukua and Bawku were closely related, whereas materials from Damongo, Wellembele, Walewale and Gbungbaliga were further apart from the others. Materials from Volta, Tusani, Tingoli, Chache, Kadelso and Kintampo fell between the two main clusters.

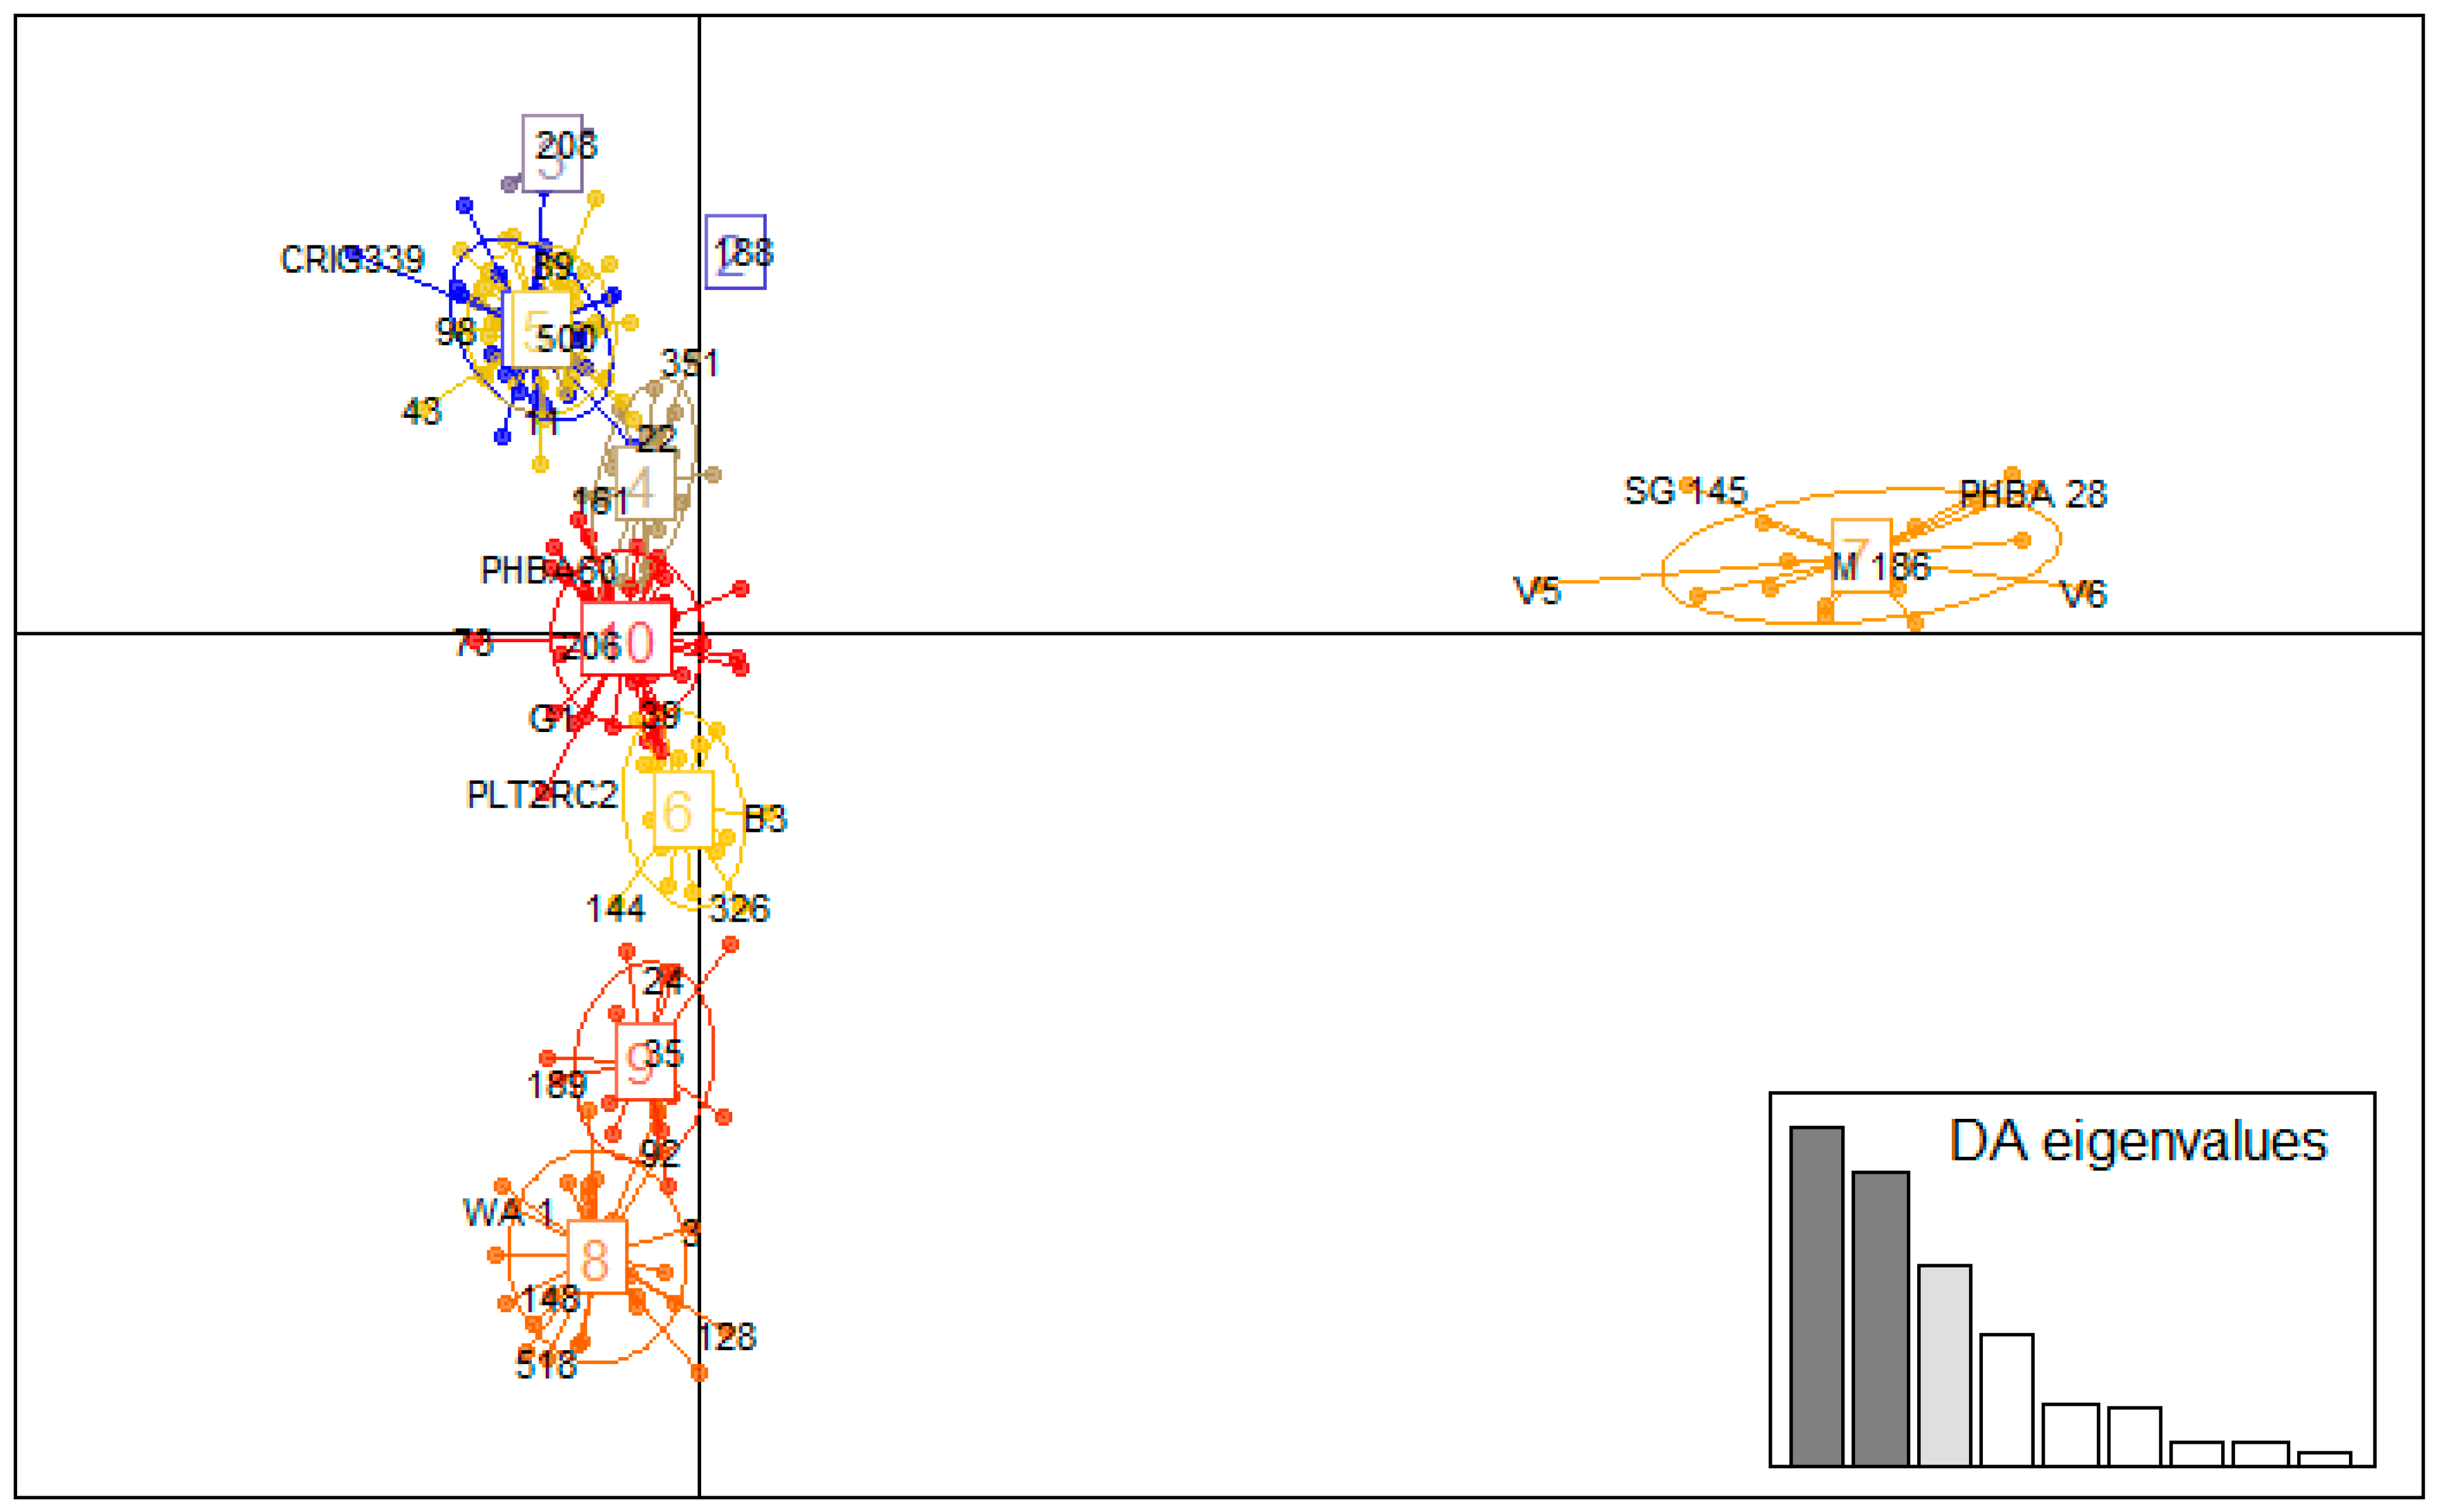
Genetic Clustering of Germplasms Using DAPC

Discriminant analysis of principal components (DAPC) was based on a kinship matrix (K = 3), which was obtained from the Bayesian Information Criterion (BIC) value (Supplementary Figure S3). Two discriminant axis (DA) values were retained for the analysis. Three main clusters were observed (Figure 6 and Supplementary Figure S4) in individuals from different locations showing close genetic relationships. The two largest clusters occurred around the axis of separations whereas the third was further from them. The first major cluster comprised CRIG339, CRIG98, CRIG43, CRIG500, CRIG11, CRIG89, CRIG189 and CRIG35, the second cluster also consisted of CRIG144, B3, CRIG326, CRIG206, CRIG188, PHBA60, CRIG161 and CRIG39, and the third cluster included SG145, V5, M186, V6 and PHBA28.
There were individuals which did not fall into any of the distinct categories and which shared similarities with two groups; these materials included CRIG208, CRIG128, WA1, CRIG148 and CRIG518. All three clusters had several subclusters.

4. Discussion

All leaf traits measured showed variations similar to those reported in [20,21,22]. The range and spread of leaf traits in our results was higher than reported in [20], which had a lower range for lamina length and lamina breadth but a higher range for petiole length in all locations studied. In [12], a lower leaf lamina range between 9.2 and 22.5 cm was observed, as well as a low petiole length from 3.4 to 13.1 cm and low lamina width from 2.8 to 8.2 cm for some Ghanaian shea accessions. On the other hand, ref. [21] reported a wider range for leaf length (from 15.08 to 33.31 cm) and petiole length (from 2.82 to 10.78 cm) compared to our results.
The strong negative correlation between latitude and leaf traits reported in this study was also observed in [21] in East African shea species. The researchers observed significant negative correlation between latitude and leaf length (−0.325 ***) and leaf width (−0.248 **) and petiole length (−0.244 **) as in our results. However, although there was no significant correlation between leaf parameter and longitude in our study, they reported significant correlation between traits and longitude in their collection. Their cluster analysis led to three main groups, whereas ours led to two. On the other hand, ref. [22] found longitude to be significantly correlated to leaf length (−0.61 ***) and width (0.53 ***), but latitude was only significantly negatively correlated to leaf length (−0.34 *).
Although leaf blade length was highly significantly correlated to total leaf length (0.87) and moderately correlated to petiole length (0.57) in our study, ref. [20] reported high correlation (0.92) between lamina length and peduncle length, and between fruit width and peduncle length (0.52), and the researchers were able to discriminate their materials into four groups using morphological descriptors.
The correlation between latitude and leaf parameters is a reflection of environmental conditions across the country. As we move from Volta (lat, 0.135), which is in the southern part of Ghana, to Lawra (lat, −2.893), which is in the drier northern hemisphere, conditions of drought and moisture stress increase. Leaf size may be adapting to better withstand the drier nature of these areas. In addition to dryness, the southern regions have two rainfall seasons, whereas the northern regions have a single rain season with almost six months of drought in some places. Leaf parameters in plants normally reduce as a way of minimizing water lost, and petioles, in this case, are elongated to allow for greater interception of sunlight. This may explain why all leaf parameters were highly significantly correlated with the latitude of the locations.
The genotype-traits association revealed that most traits were highly correlated with locations that have better precipitation and relative humidity. Most of the drier areas such Binduri, Bawku, Funsi, Paga, Loagri and Garu did not cluster with any specific traits. Similar observations occurred through the cluster analysis. Group “A” consisted mostly of material from very arid areas with a smaller total leaf size, whereas group “B” contained accessions from relatively humid areas with a larger leaf size. These two results indicate that the separation of materials is determined by environmental conditions. The leaf traits measured have evolved to tolerate the weather conditions of their environments.
The filtered SNP markers were of high quality, in terms of call rates (0.94 to 1.0), and highly reproducible (1.0). The genetic diversity of the population was low (Hs = 0.0406), with a fixation index of 0.0022 and heterozygosity of 0.034, all indicating a possibility of inbreeding. Generally, the observed heterozygosity was lower than the expected heterozygosity (Figure 5C) except for in locations with a low sample size (one to four samples per location) (Supplementary Figure S1). Inbreeding is likely the reason for such behavior in a population [23].
The Euclidean distance of the population showed that materials were within a smaller genetic range (from 15 to 18) and, consequently, were very close to each other. This was confirmed by the genetic analysis, using the phylogenetic tree and the PCoA, both of which produced three main clusters with several subclusters.
According to the DAPC results, group one members (Supplementary Figure S4) consisted of genotypes with varied characteristics. CRIG148, CRIG518 and SG145 are small and short trees whereas CRIG208, Wa1, CRIG128 are medium-sized trees. SG145, CRIG148 and Wa1 have an open canopy structure; however, CRIG128, CRIG518 and CRIG208 have closed canopies. CRIG148 and Wa1 produce medium-sized fruits, whereas CRIG128, CRIG518, CRIG208 and SG145 produce large fruits. The materials also vary in their flowering times. SG145 produces flowers around November-December, whereas CRIG208 does so in January. CRIG148, CRIG518, CRIG128 and Wa1 produce their flowers later in February.
The second group also contained materials with diverse behavior; CRIG98, CRIG189 flower around February, whereas CRIG43 and CRIG500 do so around March, CRIG339 in January and CRIG11 in December. CRIG339 and CRIG98 produce small-sized fruits; however, CRIG11 and CRIG189 produce very large fruits. The size of the CRIG500 tree is small, whereas CRIG43 is huge.
The last group consisted of CRIG326, CRIG206, CRIG161 and CRIG39 which are medium-sized trees; B3 is, however, a small tree and CRIG144 is small and dwarfish, whereas CRIG188 is a large tree. CRIG144, CRIG206 and CRIG188 produce very large fruits. B3, CRIG326, CRIG161 and CRIG39, on the other hand, produce medium-sized fruits. All trees in this group have open canopies except CRIG39, which has a closed canopy. These sub-divisions within the main groups indicate some intragroup diversity which offers a huge potential for crop improvement [24].
The phylogenetic tree also had three main branches, with each branch producing numerous sub-branches; the closeness of locations on this tree does not follow actual geographical proximity. For instance, accessions from Bole and Volta were closely related according to the phylogenetic tree, but their actual geographic distance is very wide. Similarly, shea accessions from Lawra seem to be genetically closer to those from Bawku than the ones from Navrongo, which is very far from Lawra. This pattern is consistent with the results based on PCoA and DAPC. The materials were clustered independently of the location of their origin, further suggesting that the traits are not geo-localized or restricted to specific regions; however, this raises questions on how the species originated and is distributed over the entire belt.

5. Conclusions

The Ghanaian shea genetic resources studied had wide variations within locations and narrow variations across geographically distant locations. It is important to expand collections within micro populations in order to capture all the possible variations in traits of importance and have a better representation of any given geographical location. Expanding the collection will ensure that all variations are captured for conservation and will enhance utilization of the shea genetic resources available to prevent loss as a result of genetic erosion, which is expected to worsen with climate change. It is therefore suggested that locations that have lower representation should be resampled and added to the gene bank and an extensive phenotyping including stability analysis of yield be considered.

Supplementary Materials

The following supporting information can be downloaded at: https://www.mdpi.com/article/10.3390/agronomy13092256/s1, Table S1: Observed and Expected heterozygosity within each population. Figure S1: PCA scree plot of important SNPs. Figure S2: PCoA Scree plot showing percent contribution of each SNP. Figure S3: BIC plot showing the number of clusters within the germplasm. Figure S4: Clusters of germplasm studied by DAPC.

Author Contributions

Conceptualization, W.E.A., M.T.B., I.H. and A.D.; Funding acquisition, I.H., F.K.P., E.Y.D. and A.D.; Investigation, W.E.A. and M.T.B.; Methodology, W.E.A., K.O. and M.B; Analysis, W.E.A. and J.S.Y.E.; Writing original draft, W.E.A.; Writing—review and editing, W.E.A., J.S.Y.E. and S.W.A. All authors have read and agreed to the published version of the manuscript.

Funding

Funding for this research was from the National Science Foundation of the United States of America (Award number: 1543942), the West Africa Centre for Crop Improvement and Cocoa Research Institute of Ghana.

Data Availability Statement

The datasets generated during and/or analyzed during the current study are available from the corresponding author on request.

Acknowledgments

We are thankful to Samuel Antwi, for his immense contributions in the laboratory towards the success of this work. The staff and drivers that assisted in traveling across the country are duly acknowledged.

Conflicts of Interest

The authors declare no conflict of interest.

References

  1. Maranz, S.; Wiesman, Z. Influence of climate on the tocopherol content of shea butter. J. Agric. Food Chem. 2004, 52, 2934–2937. [Google Scholar] [CrossRef] [PubMed]
  2. Lovett, P.N. The shea butter Industry expanding in West Africa. Inform 2005, 16, 273–275. [Google Scholar]
  3. Abbiw, D.K. Useful Plants of Ghana: West African Uses of Wild and Cultivated Plants; Intermediate Technology Publications: London, UK; The Royal Botanic Gardens, Kew: London, UK, 1990; pp. 66–67. [Google Scholar]
  4. Yidana, J.A. Pollination in Shea Trees; Ghana Annual Report 1992/93; Cocoa Research Institute: Bole, Ghana, 1994. [Google Scholar]
  5. Stout, J.C.; Nombre, I.; de Bruijn, B.; Delaney, A.; Doke, D.A.; Gyimah, T.; Kamano, F.; Kelly, R.; Lovett, P.; Marshall, E.; et al. Insect pollination improves yield of shea (Vitellaria paradoxa subsp. paradoxa) in the agroforestry parklands of West Africa. J. Pollinat. Ecol. 2018, 22, 11–20. [Google Scholar] [CrossRef]
  6. Jaeger, P. Note provisoire sur le role des chauves-souris dans la dissemination des fruits du karite (Butyrospermum parkii Kot.). Bull. Inst. Fr. Afr. Noire Ser. A Sci. Nat. 1962, 24, 113–115. [Google Scholar]
  7. Miège, J. Nombres chromosomiques et répartition géographique de quelques plantes tropicales et équatoriales. Rev. Cytol. Biol. Végétales Bot. 1954, 15, 312–348. [Google Scholar]
  8. Johnson, M. Cytology. In The Genera of Sapotaceae; Pennington, T.D., Ed.; Royal Botanic Gardens, Kew: London, UK, 1991; pp. 15–22. [Google Scholar]
  9. Gwali, S.; Vaillant, A.; Nakabonge, G.; Okullo, J.B.; Eilu, G.; Muchugi, A.; Bouvet, J.-M. Genetic diversity in shea tree (Vitellaria paradoxa subspecies nilotica) ethno-varieties in Uganda assessed with microsatellite markers. For. Trees Livelihoods 2014, 24, 163–175. [Google Scholar] [CrossRef]
  10. Allal, F.; Sanou, H.; Millet, L. Past climate changes explain the phylogeography of Vitellaria paradoxa over Africa. Heredity 2011, 107, 174–186. [Google Scholar] [CrossRef]
  11. Bouvet, J.M.; Fontaine, C.; Sanou, H.; Cardi, C. An analysis of the pattern of genetic variation in Vitellaria paradoxa using RAPD markers. Agrofor. Syst. 2004, 60, 61–69. [Google Scholar] [CrossRef]
  12. Lovett, P.N.; Haq, N. Diversity of the Sheanut tree (Vitellaria paradoxa C.F. Gaertn.) in Ghana. Genet. Resour. Crop. Evol. 2000, 47, 293–304. [Google Scholar] [CrossRef]
  13. Elshire, R.J.; Glaubitz, J.C.; Sun, Q.; Poland, J.A.; Kawamoto, K.; Buckler, E.S.; Mitchell, S.E. A robust, simple genotyping-by-sequencing (GBS) approach for high diversity species. PLoS ONE 2011, 6, e19379. [Google Scholar] [CrossRef]
  14. Poland, J.A.; Brown, P.J.; Sorrells, M.E.; Jannink, J.L. Development of high-density genetic maps for barley and wheat using a novel two-enzyme genotyping-by-sequencing approach. PLoS ONE 2012, 7, e32253. [Google Scholar] [CrossRef]
  15. Huq, M.A.; Akter, S.; Jung, Y.J.; Nou, I.S.; Cho, Y.G.; Kang, K.K. Identification of functional SNPs in genes and their effects on plant phenotypes. J. Plant Biotechnol. 2016, 43, 1–11. [Google Scholar] [CrossRef]
  16. Bacilieri, R.; Ducousso, A.; Kremer, A. Comparison of morphological characters and molecular markers for the analysis of hybridization in sessile and pedunculate oak. Sciences 1996, 53, 79–91. [Google Scholar] [CrossRef]
  17. Kilian, A.; Wenzl, P.; Huttner, E.; Carling, J.; Xia, L.; Blois, H. Diversity arrays technology: A generic genome profiling technology on open platforms. Methods Mol. Biol. 2012, 888, 67–89. [Google Scholar] [PubMed]
  18. Jombart, T. adegenet: A R package for the multivariate analysis of genetic markers. Bioinformatics 2008, 24, 1403–1405. [Google Scholar] [CrossRef] [PubMed]
  19. Jombart, T.; Ahmed, I. Adegenet 1.3-1, new tools for the analysis of genome-wide SNP data. Bioinformatics 2011, 27, 3070–3071. [Google Scholar] [CrossRef]
  20. Djekota, C.; Diouf, D.; Sane, S.; Mbaye, M.S.; Noba, K. Morphological characterization of shea tree (Vitellaria paradoxa subsp. paradoxa) populations in the region of Mandoul in Chad. Int. J. Biodivers. Conserv. 2014, 6, 184–193. [Google Scholar] [CrossRef]
  21. Gwali, S.; Nakabonge, G.; Okullo, J.B.L.; Eilu, G.; Nyeko, P.; Vuzi, P. Morphological variation among shea tree (Vitellaria paradoxa subsp. nilotica) ‘ethnovarieties’ in Uganda. Genet. Resour. Crop. Evol. 2012, 59, 1883–1898. [Google Scholar] [CrossRef]
  22. Sanou, H.; Picard, N.; Lovett, P.N.; Dembélé, M.; Korbo, A.; Diarisso, D.; Bouvet, J.M. Phenotypic variation of agromorphological traits of the shea tree, Vitellaria paradoxa C.F. Gaertn., in Mali. Genetic Resour. Crop Evol. 2006, 53, 145–161. [Google Scholar] [CrossRef]
  23. Xiong, H.; Shi, A.; Mou, B.; Qin, J.; Motes, D.; Lu, W. Genetic Diversity and Population Structure of Cowpea (Vigna unguiculata L. Walp). PLoS ONE 2016, 11, e0160941. [Google Scholar] [CrossRef]
  24. Teklehaimanot, Z. Exploiting the potential of indigenous agroforestry trees: Parkia biglobosa and Vitellaria paradoxa in sub-Saharan Africa. New Vistas Agrofor. 2004, 1, 207–220. [Google Scholar]
Figure 1. Principal component analysis biplot (a) and cluster dendrogram from hierarchical clustering (b).
Agronomy 13 02256 g001
Figure 2. Distribution of genotypes selected for further studies.
Agronomy 13 02256 g002
Figure 3. SNP call rate by locus (A), SNP call rate by individual (B), heterozygosity within the populations (C) and population Euclidean distance of the genotypes (D) of the studied germplasms.
Agronomy 13 02256 g003aAgronomy 13 02256 g003b
Figure 4. Phylogenetic tree of the populations.
Agronomy 13 02256 g004
Figure 5. PCoA biplots of first two components generated with SNPs.
Agronomy 13 02256 g005
Figure 6. Genetic diversity clusters by DAPC.
Agronomy 13 02256 g006
Table 1. Distribution of leaf traits studied.
VariableMinimumMaximumMeanStd. Deviation
Blade length (cm)12.2820.6814.891.83
Blade width (cm)4.179.215.100.93
Total Length (cm)18.6330.8522.332.70
Petiole length (cm)5.5310.207.411.16
BTPR (cm)1.412.692.070.27
BTPR = leaf blade to petiole ratio.
Table 2. Pairwise Pearson correlation matrix between the seven traits measured.
LatitudeLongitudeBlade LengthPetiole LengthBreadthTotal Length
longitude−0.11
Blade length−0.47 **0.34
Petiole length−0.82 ***−0.010.57 ***
Breadth−0.45 **0.090.270.49 **
Total Length−0.64 ***0.270.87 ***0.78 ***0.41 *
Blade To Petiole ratio0.55 ***0.39 *0.21−0.67 ***−0.33−0.14
* p < 0.05; ** p < 0.01; and *** p < 0.001.
Table 3. Correlation, quality of representation (Cos2) and contribution of each trait with principal components.
Leaf ParametersCorrelationCos2Contribution
Dim.1Dim.2Dim.1Dim.2Dim.1Dim.2
Blade length0.7580.6310.5750.39820.05528.606
Petiole length0.933−0.2520.8710.06330.3924.560
Breadth0.632−0.2610.3990.06813.9234.915
Total leaf length0.9140.3240.8360.10529.1687.547
Blade to petiole ratio−0.4300.8690.1850.7566.46154.372
Table 4. Summary of genetic variation within the studied populations.
HoHsHtDstHtpDstpFstFstpFisDest
0.03410.04060.04070.00010.04070.00010.00220.00230.16160.0001
Ho = heterozygosity, HS = genetic diversity, Ht = total genetic diversity, Htp = corrected Ht, Dst = gene diversity among samples, Dstp = corrected Dst, Fis = inbreeding coefficient, Dest = genetic differentiation, Fst = fixation index, Fstp-corrected Fst.
Disclaimer/Publisher’s Note: The statements, opinions and data contained in all publications are solely those of the individual author(s) and contributor(s) and not of MDPI and/or the editor(s). MDPI and/or the editor(s) disclaim responsibility for any injury to people or property resulting from any ideas, methods, instructions or products referred to in the content.

