


Contributions of Ammonia-Oxidizing Archaea and Bacteria to Nitrous Oxide Production in Intensive Greenhouse Vegetable Fields

 ,
, 
Abstract
:1. Introduction
2. Materials and Methods
2.1. Soil Collection and Preparations
2.2. Soil Microcosm Construction and Incubation
2.3. Soil Analyses and N2O Measurements
2.4. Soil DNA Extraction and qPCR Analysis
2.5. Calculations and Statistical Analysis
3. Results
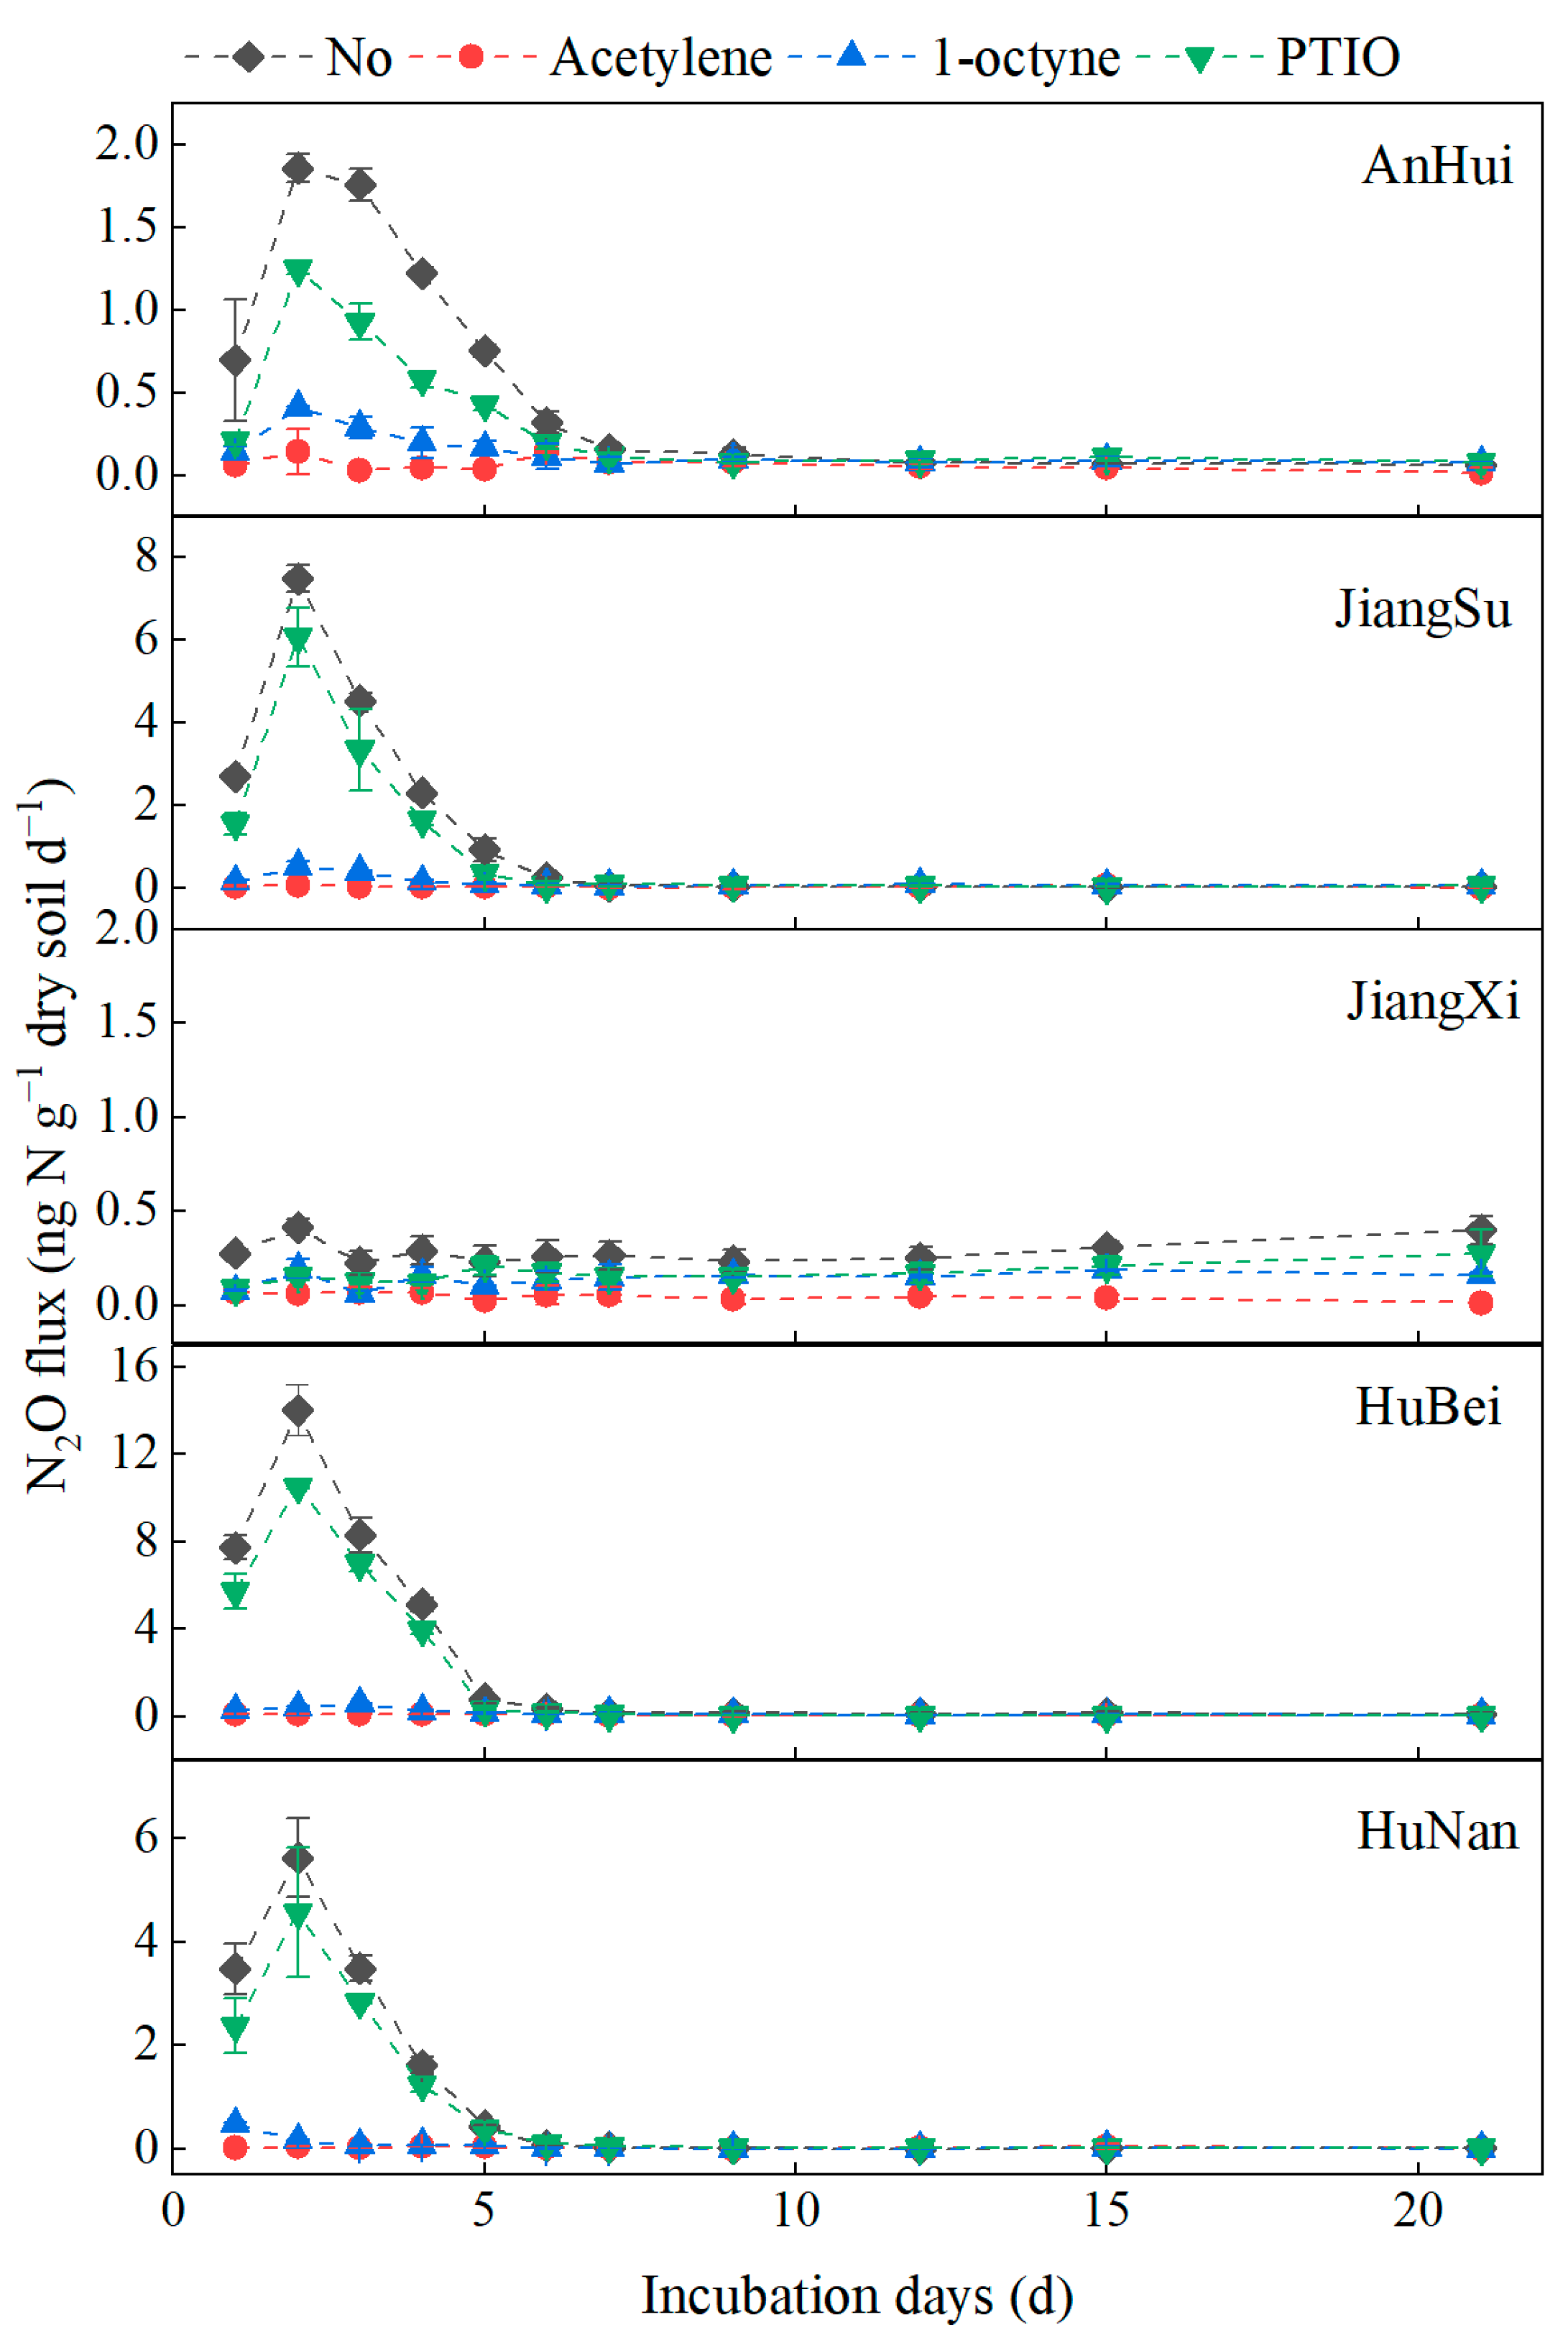
3.1. N2O Fluxes
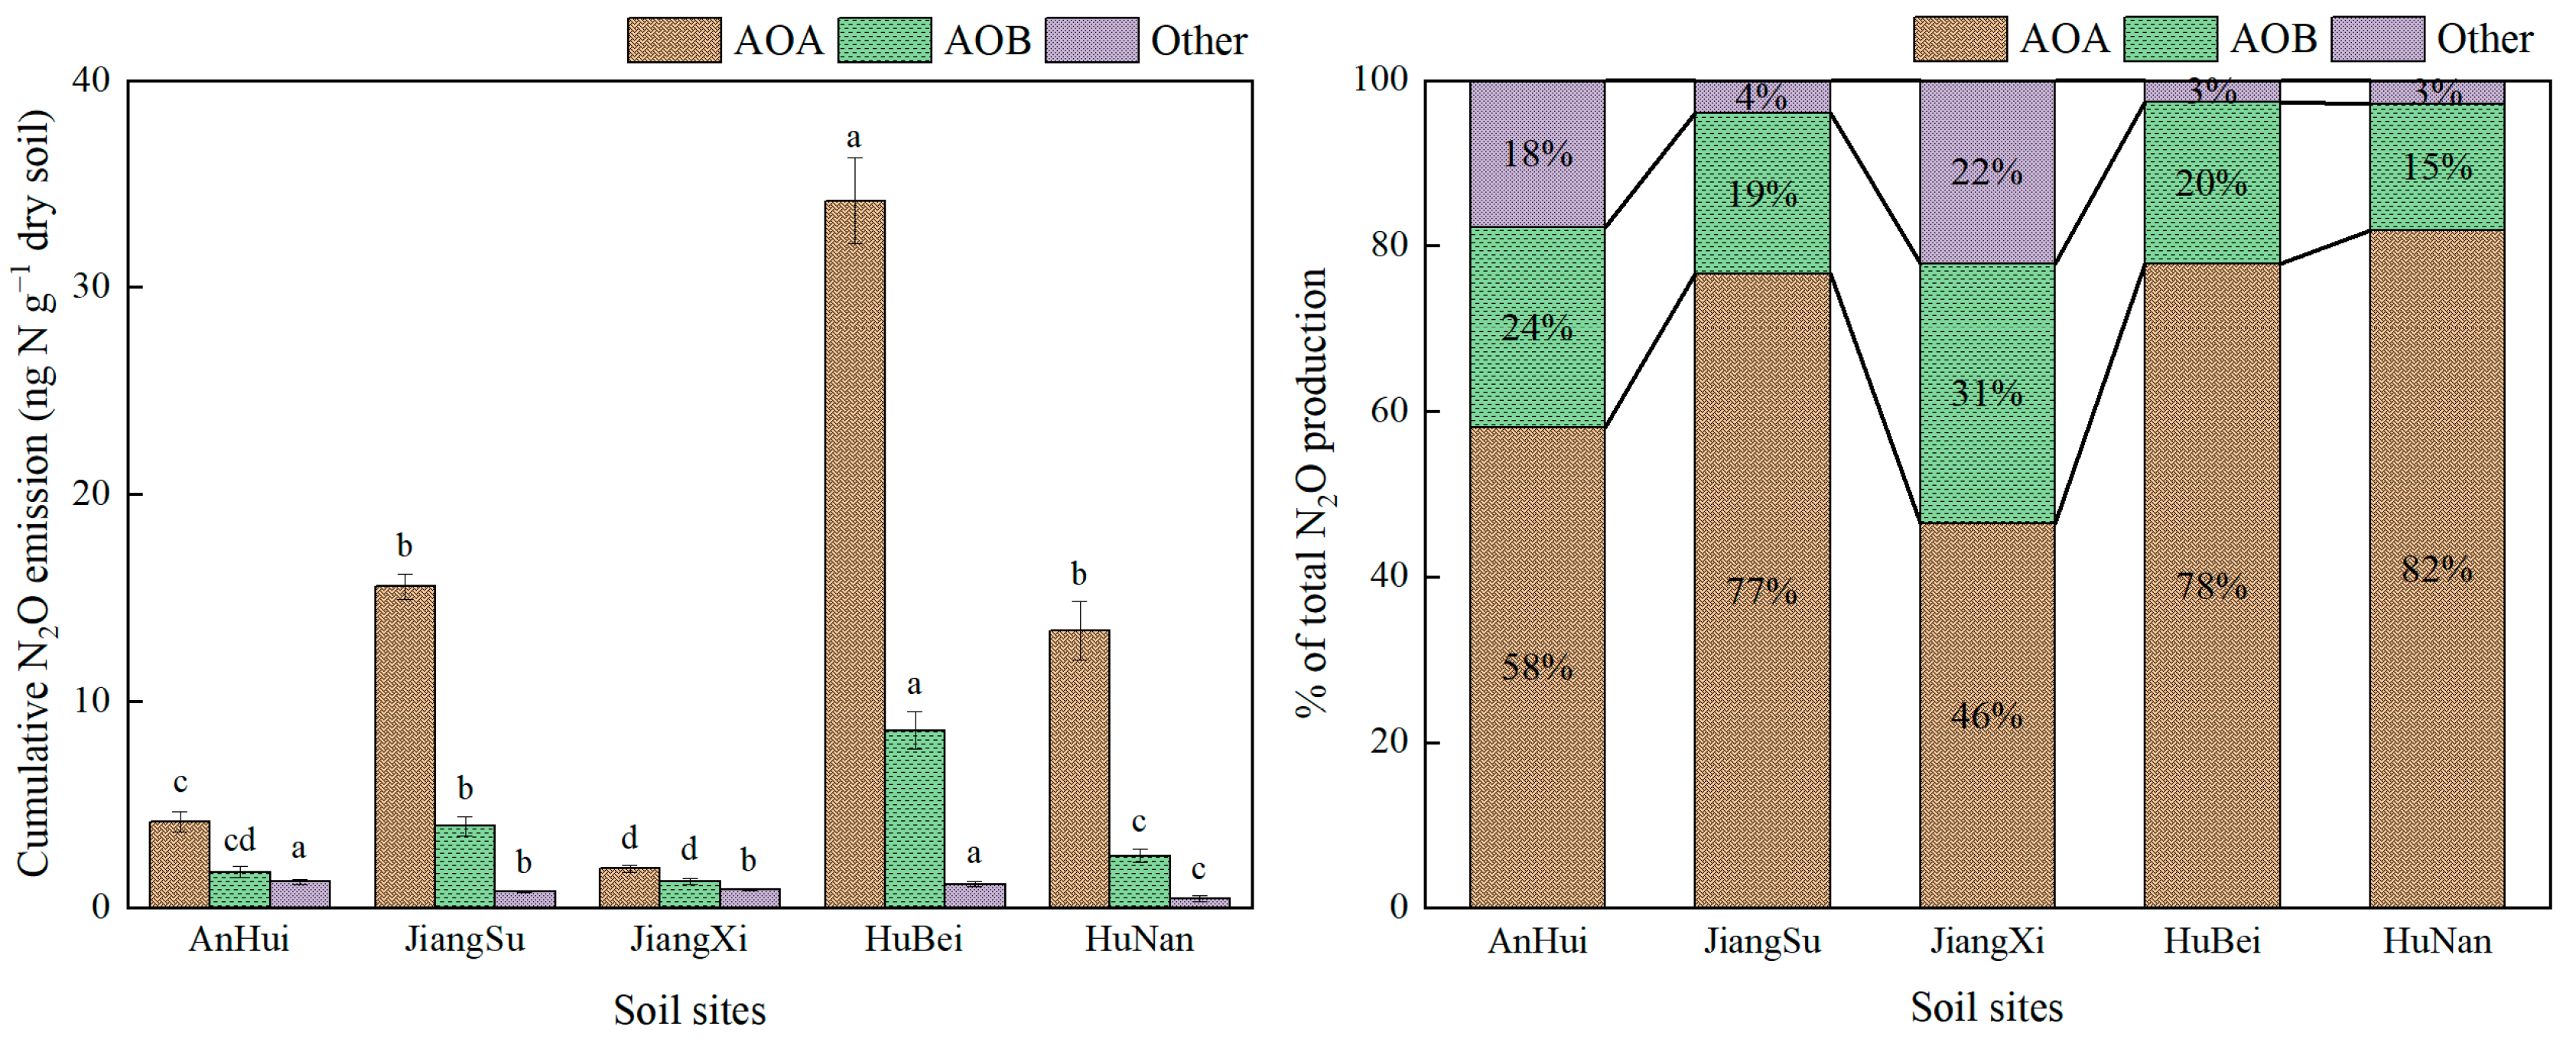
3.2. N2O Emission Derived by AOA and AOB
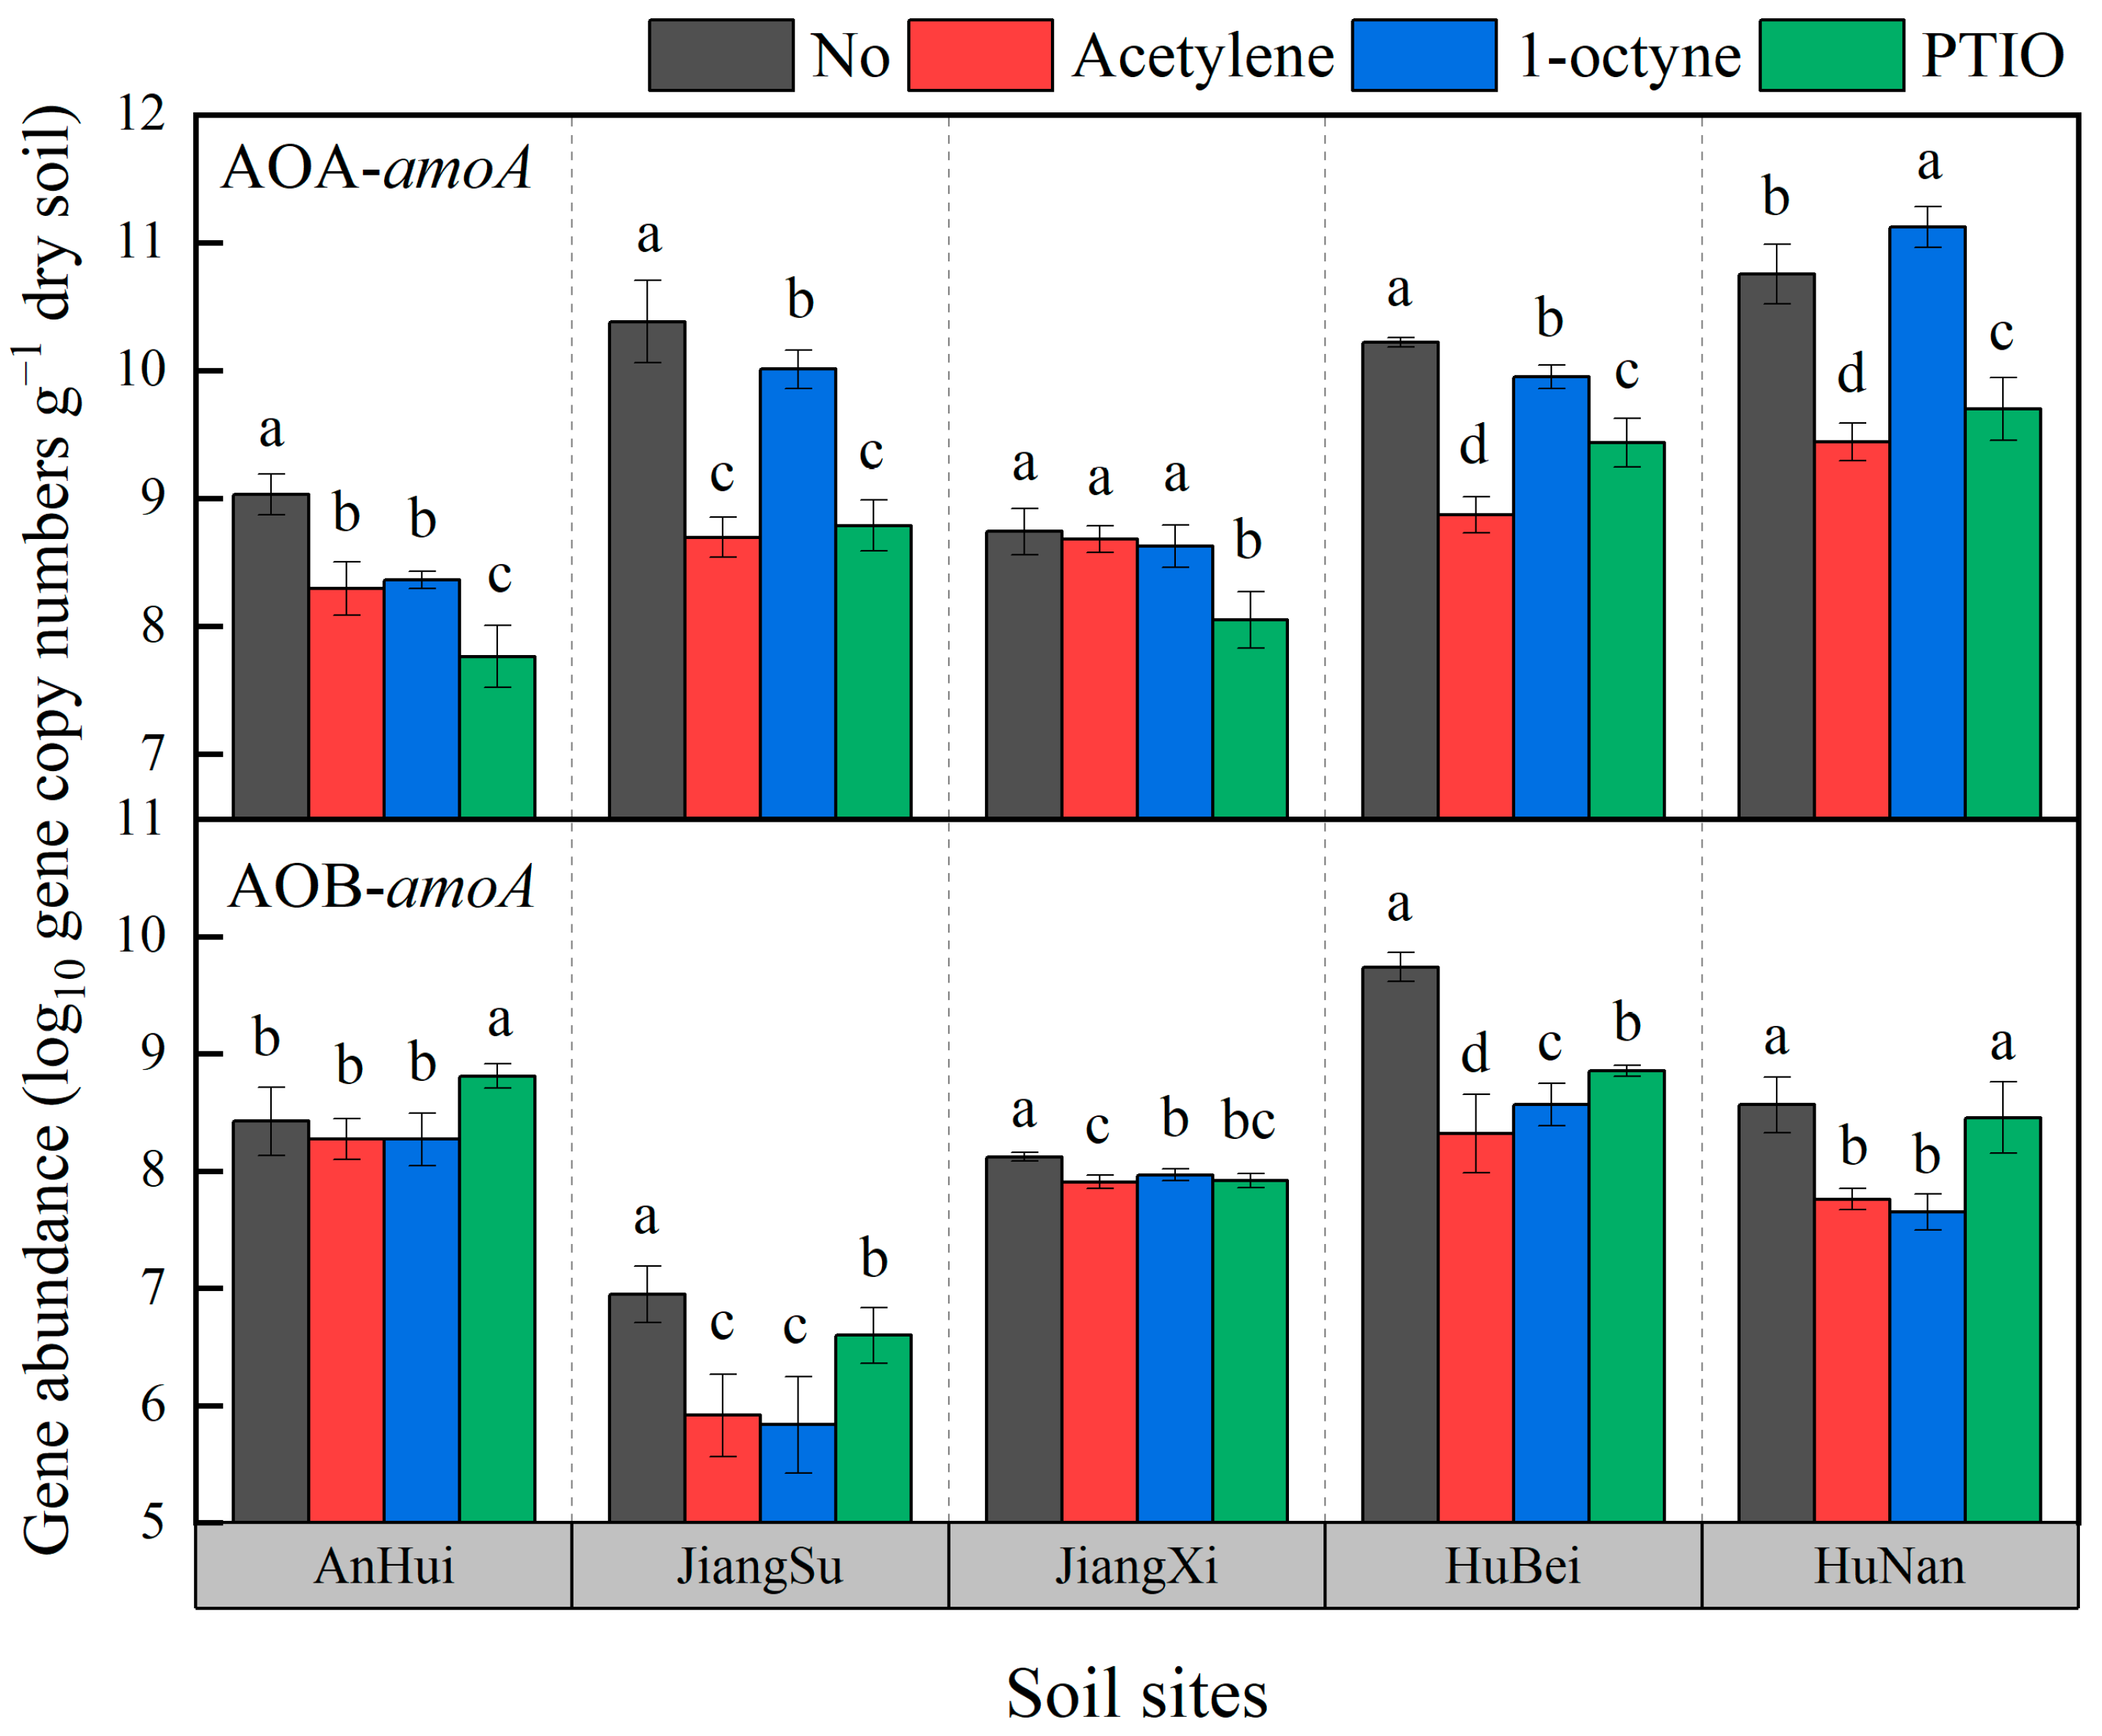
3.3. Abundance of AOA-amoA and AOB-amoA Genes
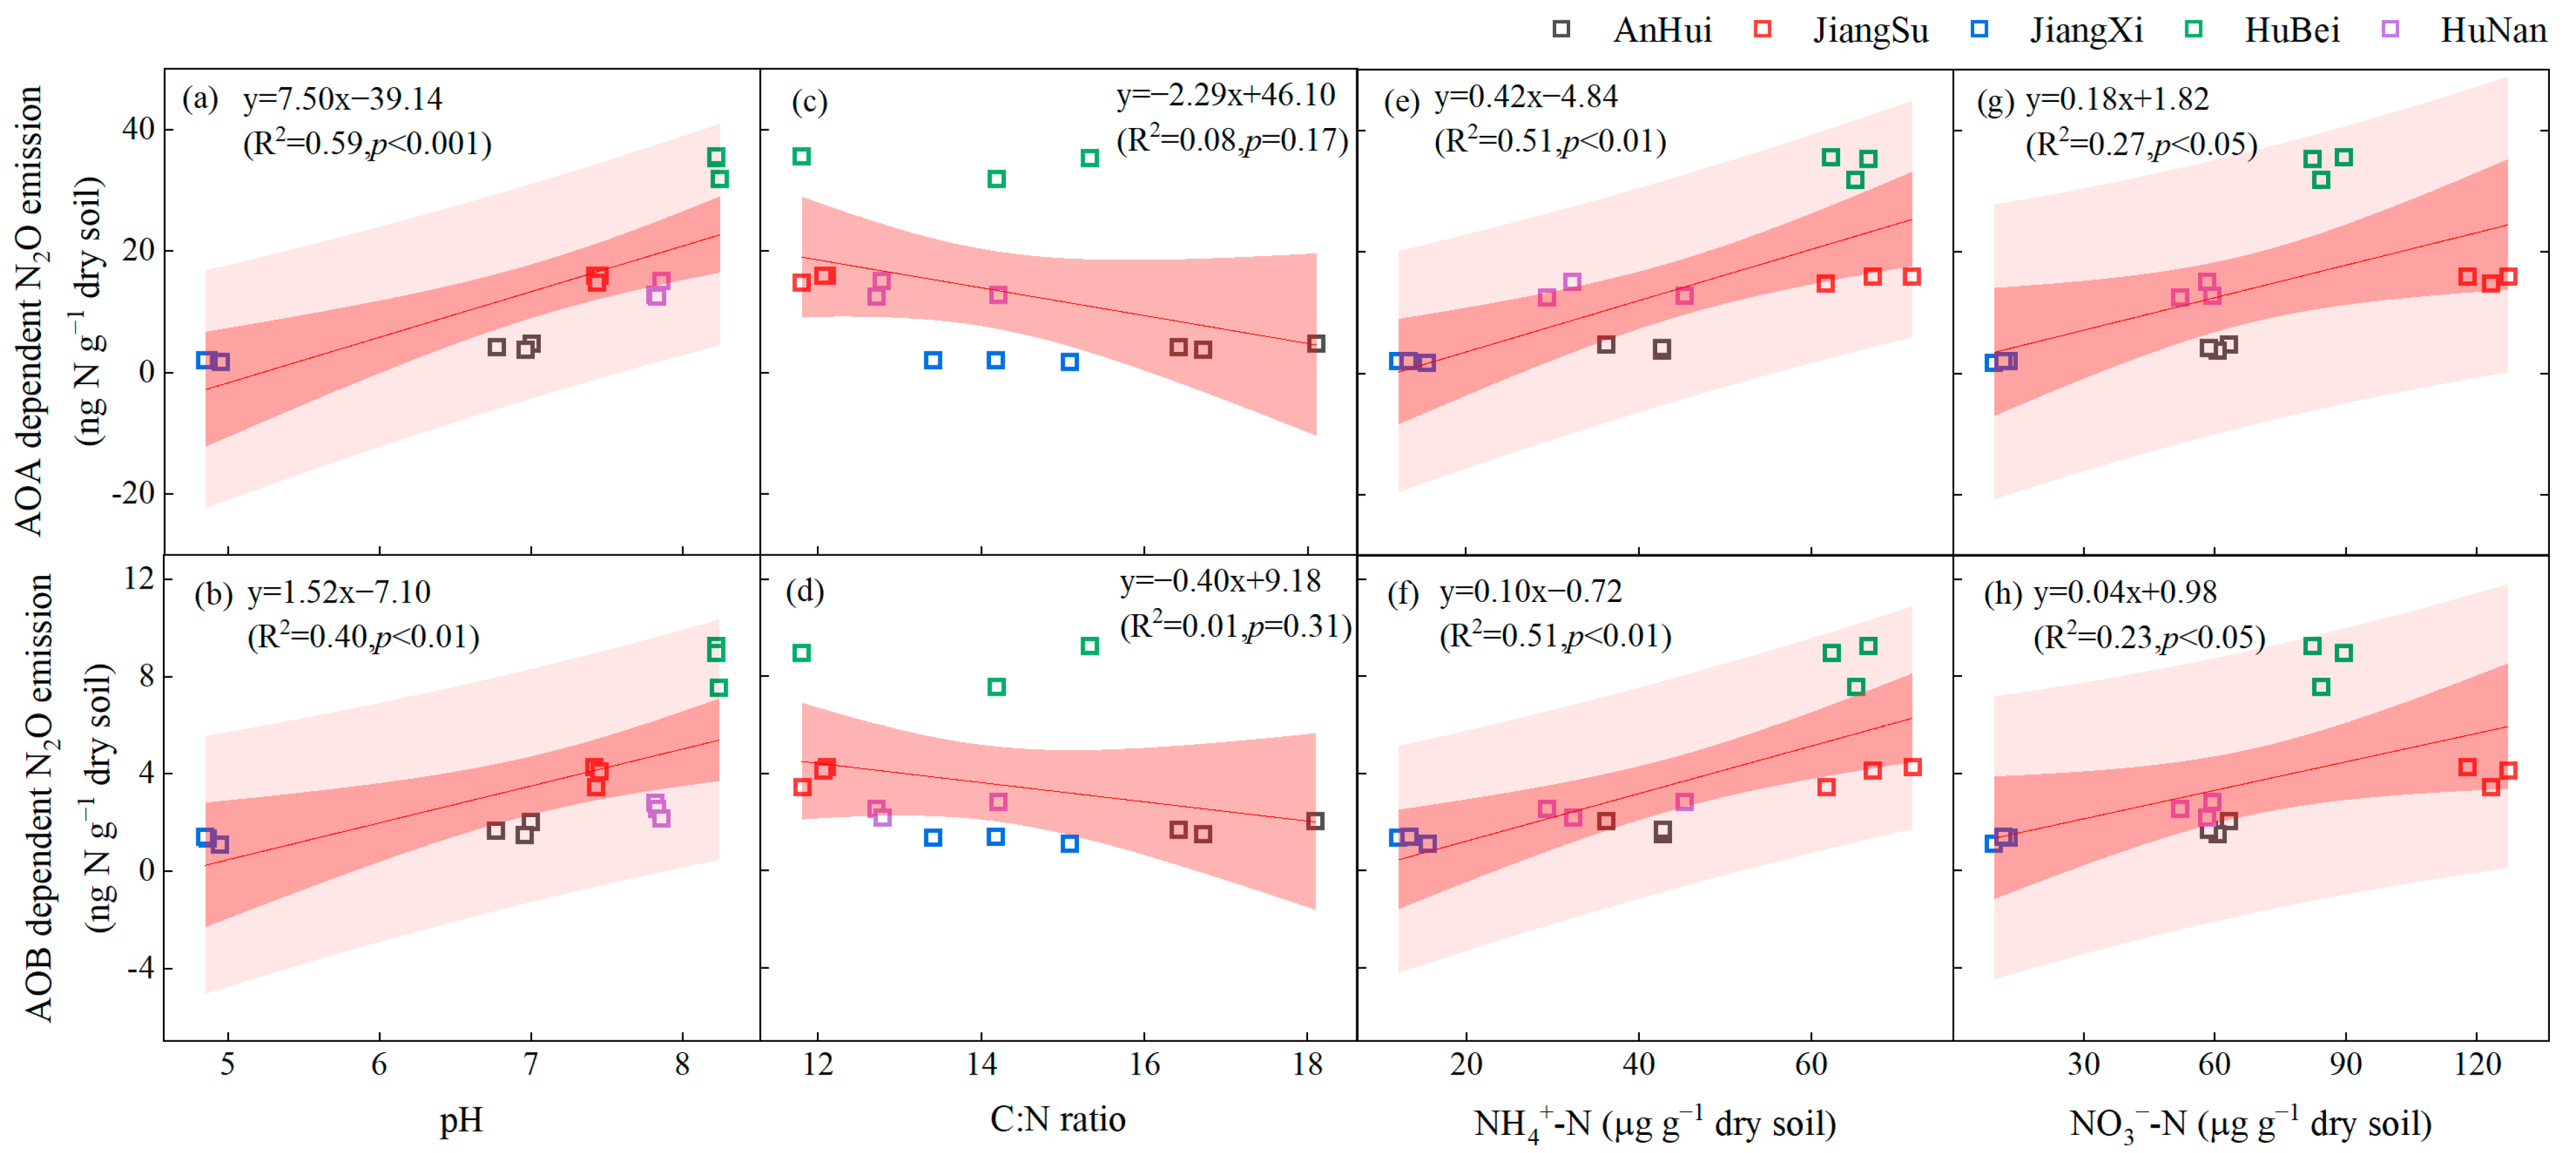
3.4. Correlation between N2O Production of AOA and AOB and Soil Properties
4. Discussion
4.1. Relative Importance of AOA and AOB in N2O Emissions
4.2. N2O Production Affected by Soil Properties
5. Conclusions
Author Contributions
Funding
Data Availability Statement
Conflicts of Interest
References
- Li, L.; Zhao, C.; Chen, Q.; Liu, T.; Li, L.; Liu, X.; Wang, X. Study on microbial community structure and soil nitrogen accumulation in greenhouse vegetable fields with different planting years. Agronomy 2022, 12, 1911. [Google Scholar] [CrossRef]
- Zhong, W.; Bian, B.; Gao, N.; Min, J.; Shi, W.; Lin, X.; Shen, W. Nitrogen fertilization induced changes in ammonia oxidation are attributable mostly to bacteria rather than archaea in greenhouse based high N input vegetable soil. Soil Biol. Biochem. 2016, 93, 150–159. [Google Scholar] [CrossRef]
- Duan, P.; Wu, Z.; Zhang, Q.; Fan, C.; Xiong, Z. Thermodynamic responses of ammonia-oxidizing archaea and bacteria explain N2O production from greenhouse vegetable soils. Soil Biol. Biochem. 2018, 120, 37–47. [Google Scholar] [CrossRef]
- Min, J.; Zhao, X.; Shi, W.; Xing, G.; Zhu, Z. Nitrogen balance and loss in a greenhouse vegetable system in southeastern China. Pedosphere 2011, 21, 464–472. [Google Scholar] [CrossRef]
- Tian, H.; Xu, R.; Canadell, J.G.; Thompson, R.L.; Winiwarter, W.; Suntharalingam, P.; Davidson, E.A.; Ciais, P.; Jackson, R.B.; Janssens-Maenhout, G.; et al. A comprehensive quantification of global nitrous oxide sources and sinks. Nature 2020, 586, 248–256. [Google Scholar] [CrossRef]
- Guo, J.H.; Liu, X.J.; Zhang, Y.; Shen, J.L.; Han, W.X.; Zhang, W.F.; Christie, P.; Goulding, K.W.T.; Vitousek, P.M.; Zhang, F.S. Significant Acidification in Major Chinese Croplands. Science 2010, 327, 1008–1010. [Google Scholar] [CrossRef]
- Homyak, P.M.; Kamiyama, M.; Sickman, J.O.; Schimel, J.P. Acidity and organic matter promote abiotic nitric oxide production in drying soils. Glob. Chang. Biol. 2017, 23, 1735–1747. [Google Scholar] [CrossRef]
- Jansen-Willems, A.B.; Lanigan, G.J.; Clough, T.J.; Andresen, L.C.; Müller, C. Long-term elevation of temperature affects organic N turnover and associated N2O emissions in a permanent grassland soil. SOIL 2016, 2, 601–614. [Google Scholar] [CrossRef]
- Duan, P.; Zhou, J.; Feng, L.; Jansen-Willems, A.B.; Xiong, Z. Pathways and controls of N2O production in greenhouse vegetable production soils. Biol. Fertil. Soils 2019, 55, 285–297. [Google Scholar] [CrossRef]
- Gödde, M.; Conrad, R. Immediate and adaptational temperature effects on nitric oxide production and nitrous oxide release from nitrification and denitrification in two soils. Biol. Fertil. Soils 1999, 30, 33–40. [Google Scholar] [CrossRef]
- Beeckman, F.; Motte, H.; Beeckman, T. Nitrification in agricultural soils: Impact, actors and mitigation. Curr. Opin. Biotechnol. 2018, 50, 166–173. [Google Scholar] [CrossRef]
- Hink, L.; Nicol, G.W.; Prosser, J.I. Archaea produce lower yields of N2O than bacteria during aerobic ammonia oxidation in soil. Environ. Microbiol. 2017, 19, 4829–4837. [Google Scholar] [CrossRef] [PubMed]
- Wang, Q.; Zhang, L.; Shen, J.; Du, S.; Han, L.; He, J. Nitrogen fertiliser-induced changes in N2O emissions are attributed more to ammonia-oxidising bacteria rather than archaea as revealed using 1-octyne and acetylene inhibitors in two arable soils. Biol. Fertil. Soils 2016, 52, 1163–1171. [Google Scholar] [CrossRef]
- Giguere, A.T.; Taylor, A.E.; Suwa, Y.; Myrold, D.D.; Bottomley, P.J. Uncoupling of ammonia oxidation from nitrite oxidation: Impact upon nitrous oxide production in non-cropped Oregon soils. Soil Biol. Biochem. 2017, 104, 30–38. [Google Scholar] [CrossRef]
- Yao, H.; Campbell, C.D.; Chapman, S.J.; Freitag, T.E.; Nicol, G.W.; Singh, B.K. Multi-factorial drivers of ammonia oxidizer communities: Evidence from a national soil survey. Environ. Microbiol. 2013, 15, 2545–2556. [Google Scholar] [CrossRef] [PubMed]
- Taylor, A.E.; Zeglin, L.H.; Wanzek, T.A.; Myrold, D.D.; Bottomley, P.J. Dynamics of ammonia-oxidizing archaea and bacteria populations and contributions to soil nitrification potentials. ISME J. 2012, 6, 2024–2032. [Google Scholar] [CrossRef]
- Gubry-Rangin, C.; Novotnik, B.; Mandič-Mulec, I.; Nicol, G.W.; Prosser, J.I. Temperature responses of soil ammonia-oxidising archaea depend on pH. Soil Biol. Biochem. 2017, 106, 61–68. [Google Scholar] [CrossRef]
- Szukics, U.; Abell, G.; Hödl, V.; Mitter, B.; Sessitsch, A.; Hackl, E.; Zechmeister-Boltenstern, S. Nitrifiers and Denitrifiers Respond Rapidly to Changed Moisture and Increasing Temperature in a Pristine Forest Soil. FEMS Microbiol. Ecol. 2010, 72, 395–406. [Google Scholar] [CrossRef]
- Taylor, A.E.; Giguere, A.T.; Zoebelein, C.M.; Myrold, D.D.; Bottomley, P.J. Modeling of soil nitrification responses to temperature reveals thermodynamic differences between ammonia-oxidizing activity of archaea and bacteria. ISME J. 2017, 11, 896–908. [Google Scholar] [CrossRef]
- Zhang, J.; Li, H.; Deng, J.; Wang, L. Assessing impacts of nitrogen management on nitrous oxide emissions and nitrate leaching from greenhouse vegetable systems using a biogeochemical model. Geoderma 2021, 382, 114701. [Google Scholar] [CrossRef]
- He, J.; Shen, J.; Zhang, L.; Zhu, Y.; Zheng, Y.; Xu, M.; Di, H. Quantitative analyses of the abundance and composition of ammonia-oxidizing bacteria and ammonia-oxidizing archaea of a Chinese upland red soil under long-term fertilization practices. Environ. Microbiol. 2007, 9, 2364–2374. [Google Scholar] [CrossRef] [PubMed]
- Segal, L.M.; Miller, D.N.; McGhee, R.P.; Loecke, T.D.; Cook, K.L.; Shapiro, C.A.; Drijber, R.A. Bacterial and archaeal ammonia oxidizers respond differently to long-term tillage and fertilizer management at a continuous maize site. Soil Tillage Res. 2017, 168, 110–117. [Google Scholar] [CrossRef]
- Wang, X.; Han, C.; Zhang, J.; Huang, Q.; Deng, H.; Deng, Y.; Zhong, W. Long-term fertilization effects on active ammonia oxidizers in an acidic upland soil in China. Soil Biol. Biochem. 2015, 84, 28–37. [Google Scholar] [CrossRef]
- Duan, P.; Zhang, Q.; Xiong, Z. Temperature decouples ammonia and nitrite oxidation in greenhouse vegetable soils. Sci. Total Environ. 2020, 733, 139391. [Google Scholar] [CrossRef] [PubMed]
- Sauder, L.A.; Albertsen, M.; Engel, K.; Schwarz, J.; Nielsen, P.H.; Wagner, M.; Neufeld, J.D. Cultivation and characterization of Candidatus Nitrosocosmicus exaquare, an ammonia-oxidizing archaeon from a municipal wastewater treatment system. ISME J. 2017, 11, 1142–1157. [Google Scholar] [CrossRef]
- Taylor, A.E.; Vajrala, N.; Giguere, A.T.; Gitelman, A.I.; Arp, D.J.; Myrold, D.D.; Sayavedra-Soto, L.; Bottomley, P.J. Use of Aliphaticn-Alkynes to discriminate soil nitrification activities of ammonia-oxidizing archaea and bacteria. Appl. Environ. Microbiol. 2013, 79, 6544–6551. [Google Scholar] [CrossRef]
- Fan, C.; Zhang, W.; Chen, X.; Li, N.; Li, W.; Wang, Q.; Duan, P.; Chen, M. Residual effects of four-year amendments of organic material on N2O production driven by ammonia-oxidizing archaea and bacteria in a tropical vegetable soil. Sci. Total Environ. 2021, 781, 146746. [Google Scholar] [CrossRef]
- Zhang, X.; Duan, P.; Wu, Z.; Xiong, Z. Aged biochar stimulated ammonia-oxidizing archaea and bacteria-derived N2O and NO production in an acidic vegetable soil. Sci. Total Environ. 2019, 687, 433–440. [Google Scholar] [CrossRef]
- Wu, Z.; Zhang, X.; Dong, Y.; Li, B.; Xiong, Z. Biochar amendment reduced greenhouse gas intensities in the rice-wheat rotation system: Six-year field observation and meta-analysis. Agric. For. Meteorol. 2019, 278, 107625. [Google Scholar] [CrossRef]
- Wu, Z.; Zhang, X.; Dong, Y.; Xu, X.; Xiong, Z. Microbial explanations for field-aged biochar mitigating greenhouse gas emissions during a rice-growing season. Environ. Sci. Pollut. Res. 2018, 25, 31307–31317. [Google Scholar] [CrossRef]
- Harter, J.; Krause, H.; Schuettler, S.; Ruser, R.; Fromme, M.; Scholten, T.; Kappler, A.; Behrens, S. Linking N2O emissions from biochar-amended soil to the structure and function of the N-cycling microbial community. ISME J. 2014, 8, 660–674. [Google Scholar] [CrossRef] [PubMed]
- Li, J.; Sang, C.; Yang, J.; Qu, L.; Xia, Z.; Hao, S.; Jiang, P.; Wang, X.; He, H.; Wang, C. Stoichiometric imbalance and microbial community regulate microbial elements use efficiencies under nitrogen addition. Soil Biol. Biochem. 2021, 156, 108207. [Google Scholar] [CrossRef]
- Zou, W.; Lang, M.; Zhang, L.; Liu, B.; Chen, X. Ammonia-oxidizing bacteria rather than ammonia-oxidizing archaea dominate nitrification in a nitrogen-fertilized calcareous soil. Sci. Total Environ. 2022, 811, 151402. [Google Scholar] [CrossRef]
- Hu, H.; Xu, Z.; He, J. Chapter six–Ammonia-oxidizing archaea play a predominant role in acid soil nitrification. In Advances in Agronomy; Sparks, D.L., Ed.; Academic Press: Cambridge, MA, USA, 2014; Volume 125, pp. 261–302. [Google Scholar]
- Ouyang, Y.; Norton, J.M.; Stark, J.M. Ammonium availability and temperature control contributions of ammonia oxidizing bacteria and archaea to nitrification in an agricultural soil. Soil Biol. Biochem. 2017, 113, 161–172. [Google Scholar] [CrossRef]
- Cayuela, M.L.; van Zwieten, L.; Singh, B.P.; Jeffery, S.; Roig, A.; Sánchez-Monedero, M.A. Biochar’s role in mitigating soil nitrous oxide emissions: A review and meta-analysis. Agric. Ecosyst. Environ. 2014, 191, 5–16. [Google Scholar] [CrossRef]
- Li, Y.; Hu, S.; Chen, J.; Müller, K.; Li, Y.; Fu, W.; Lin, Z.; Wang, H. Effects of biochar application in forest ecosystems on soil properties and greenhouse gas emissions: A review. J. Soils Sediments 2018, 18, 546–563. [Google Scholar] [CrossRef]
- Guo, J.; Ling, N.; Chen, H.; Zhu, C.; Kong, Y.; Wang, M.; Shen, Q.; Guo, S. Distinct drivers of activity, abundance, diversity and composition of ammonia-oxidizers: Evidence from a long-term field experiment. Soil Biol. Biochem. 2017, 115, 403–414. [Google Scholar] [CrossRef]
- Xu, H.; Wang, X.; Li, H.; Yao, H.; Su, J.; Zhu, Y. Biochar impacts soil microbial community composition and nitrogen cycling in an acidic soil planted with rape. Environ. Sci. Technol. 2014, 48, 9391–9399. [Google Scholar] [CrossRef]
- Meinhardt, K.A.; Stopnisek, N.; Pannu, M.W.; Strand, S.E.; Fransen, S.C.; Casciotti, K.L.; Stahl, D.A. Ammonia-oxidizing bacteria are the primary N2O producers in an ammonia-oxidizing archaea dominated alkaline agricultural soil. Environ. Microbiol. 2018, 20, 2195–2206. [Google Scholar] [CrossRef]
- Zhang, Y.; Hwarari, D.; Yang, Y.; Huo, A.; Wang, J.; Yang, L. Biochar-induced mitigation potential of greenhouse gas emissions was enhanced under high soil nitrogen availability in intensively-irrigated vegetable cropping systems. Agronomy 2022, 12, 2249. [Google Scholar] [CrossRef]
- Han, Z.; Wang, J.; Xu, P.; Sun, Z.; Ji, C.; Li, S.; Wu, S.; Liu, S.; Zou, J. Greater nitrous and nitric oxide emissions from the soil between rows than under the canopy in subtropical tea plantations. Geoderma 2021, 398, 115105. [Google Scholar] [CrossRef]

| Sites | Sand (%) | Silt (%) | Clay (%) | SOC (g kg−1) | TN (g kg−1) | C/N Ratio | NH4+-N (mg kg−1) | NO3−-N (mg kg−1) | pH (1:5) |
|---|---|---|---|---|---|---|---|---|---|
| AnHui | 20.4 | 42.8 | 36.8 | 16.60 ± 2.36 b | 0.97 ± 0.12 c | 17.08 ± 0.90 a | 40.56 ± 3.74 b | 60.84 ± 2.27 c | 6.91 ± 0.12 d |
| JiangSu | 43.8 | 40.9 | 15.3 | 21.95 ± 0.44 a | 1.83 ± 0.12 a | 12.00 ± 0.16 b | 66.83 ± 4.99 a | 122.79 ± 4.62 a | 7.43 ± 0.02 c |
| JiangXi | 22.6 | 37.2 | 40.2 | 7.51 ± 0.07 c | 0.53 ± 0.03 d | 14.23 ± 0.84 b | 13.66 ± 1.70 c | 11.26 ± 1.63 d | 4.89 ± 0.05 e |
| HuBei | 42.3 | 34.1 | 23.6 | 9.11 ± 0.23 c | 0.67 ± 0.07 d | 13.78 ± 1.80 b | 35.67 ± 8.50 a | 56.52 ± 3.98 b | 8.23 ± 0.01 a |
| HuNan | 24.2 | 51.5 | 28.3 | 20.61 ± 0.06 a | 1.56 ± 0.09 b | 13.24 ± 0.84 b | 64.69 ± 2.19 b | 85.47 ± 3.69 c | 7.84 ± 0.02 b |
Disclaimer/Publisher’s Note: The statements, opinions and data contained in all publications are solely those of the individual author(s) and contributor(s) and not of MDPI and/or the editor(s). MDPI and/or the editor(s) disclaim responsibility for any injury to people or property resulting from any ideas, methods, instructions or products referred to in the content. |
© 2023 by the authors. Licensee MDPI, Basel, Switzerland. This article is an open access article distributed under the terms and conditions of the Creative Commons Attribution (CC BY) license (https://creativecommons.org/licenses/by/4.0/).
Share and Cite
Dong, Y.; Xu, X.; Zhang, J.; Jiao, Y.; Wang, B.; Wang, C.; Xiong, Z. Contributions of Ammonia-Oxidizing Archaea and Bacteria to Nitrous Oxide Production in Intensive Greenhouse Vegetable Fields. Agronomy 2023, 13, 2420. https://doi.org/10.3390/agronomy13092420
Dong Y, Xu X, Zhang J, Jiao Y, Wang B, Wang C, Xiong Z. Contributions of Ammonia-Oxidizing Archaea and Bacteria to Nitrous Oxide Production in Intensive Greenhouse Vegetable Fields. Agronomy. 2023; 13(9):2420. https://doi.org/10.3390/agronomy13092420
Chicago/Turabian StyleDong, Yubing, Xintong Xu, Junqian Zhang, Ying Jiao, Bingxue Wang, Chenyuan Wang, and Zhengqin Xiong. 2023. "Contributions of Ammonia-Oxidizing Archaea and Bacteria to Nitrous Oxide Production in Intensive Greenhouse Vegetable Fields" Agronomy 13, no. 9: 2420. https://doi.org/10.3390/agronomy13092420
APA StyleDong, Y., Xu, X., Zhang, J., Jiao, Y., Wang, B., Wang, C., & Xiong, Z. (2023). Contributions of Ammonia-Oxidizing Archaea and Bacteria to Nitrous Oxide Production in Intensive Greenhouse Vegetable Fields. Agronomy, 13(9), 2420. https://doi.org/10.3390/agronomy13092420