Abstract
This article addresses the challenges of water scarcity and climate change faced by cotton cultivation in the Xinjiang region of China. In response, a precise irrigation model based on reinforcement learning and the crop model DSSAT is proposed. The experimental site chosen for this study is Changji City in northwest China’s Xinjiang province. Integrating the cotton model, CSM-CROPGRO, from the DSSAT model with reinforcement learning algorithms, a decision system was developed to provide accurate irrigation strategies that maximize cotton yield. The experimental results demonstrated that our approach significantly improved cotton yield and, compared to genetic algorithms, reduced water consumption while increasing production. This provides a better solution for developing cotton cultivation in the Xinjiang region. Additionally, we analyzed the differences in irrigation strategies among different decision scenarios, and the results showed that the reinforcement learning method achieved higher yields in water application trends during different periods. This research offers new ideas and methods for improving cotton-crop-management decisions. The study’s focus on maximizing cotton yield while reducing water usage aligns with the sustainable management of water resources and the need for agricultural adaptation to changing climate conditions. It highlights the potential of reinforcement learning methods in improving irrigation decision-making and their applicability in addressing water scarcity challenges. This research contributes to the advancement of cotton crop management and provides valuable insights for agricultural decision-makers in the Xinjiang region and beyond.
1. Introduction
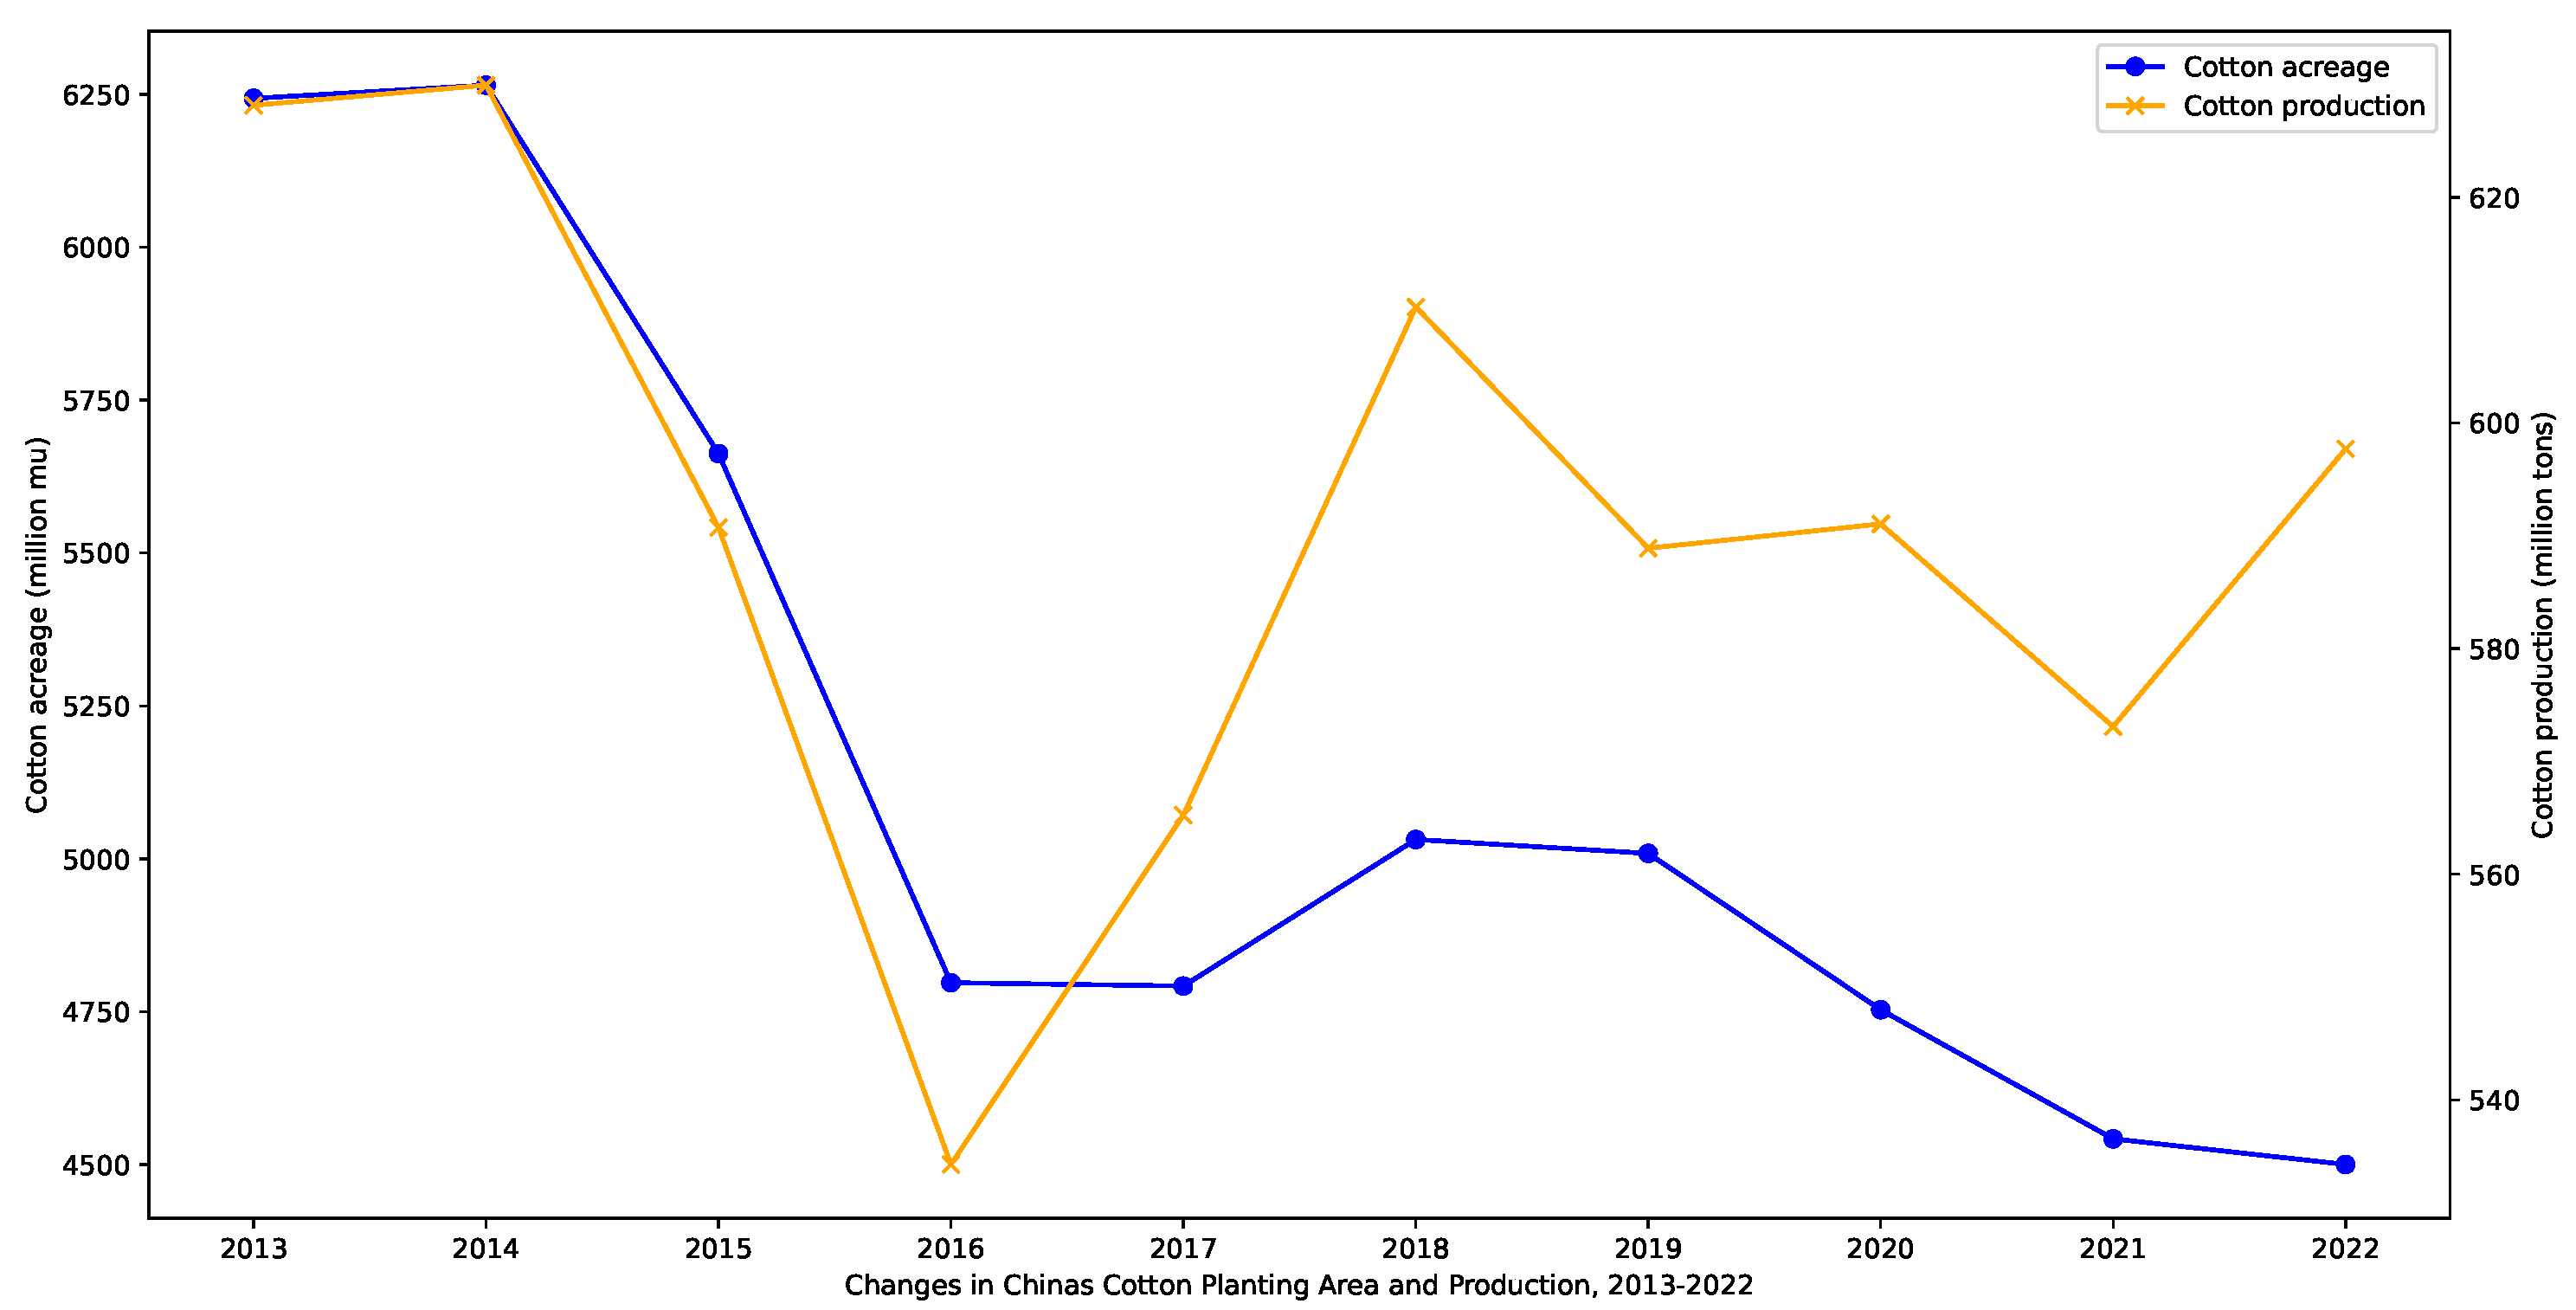
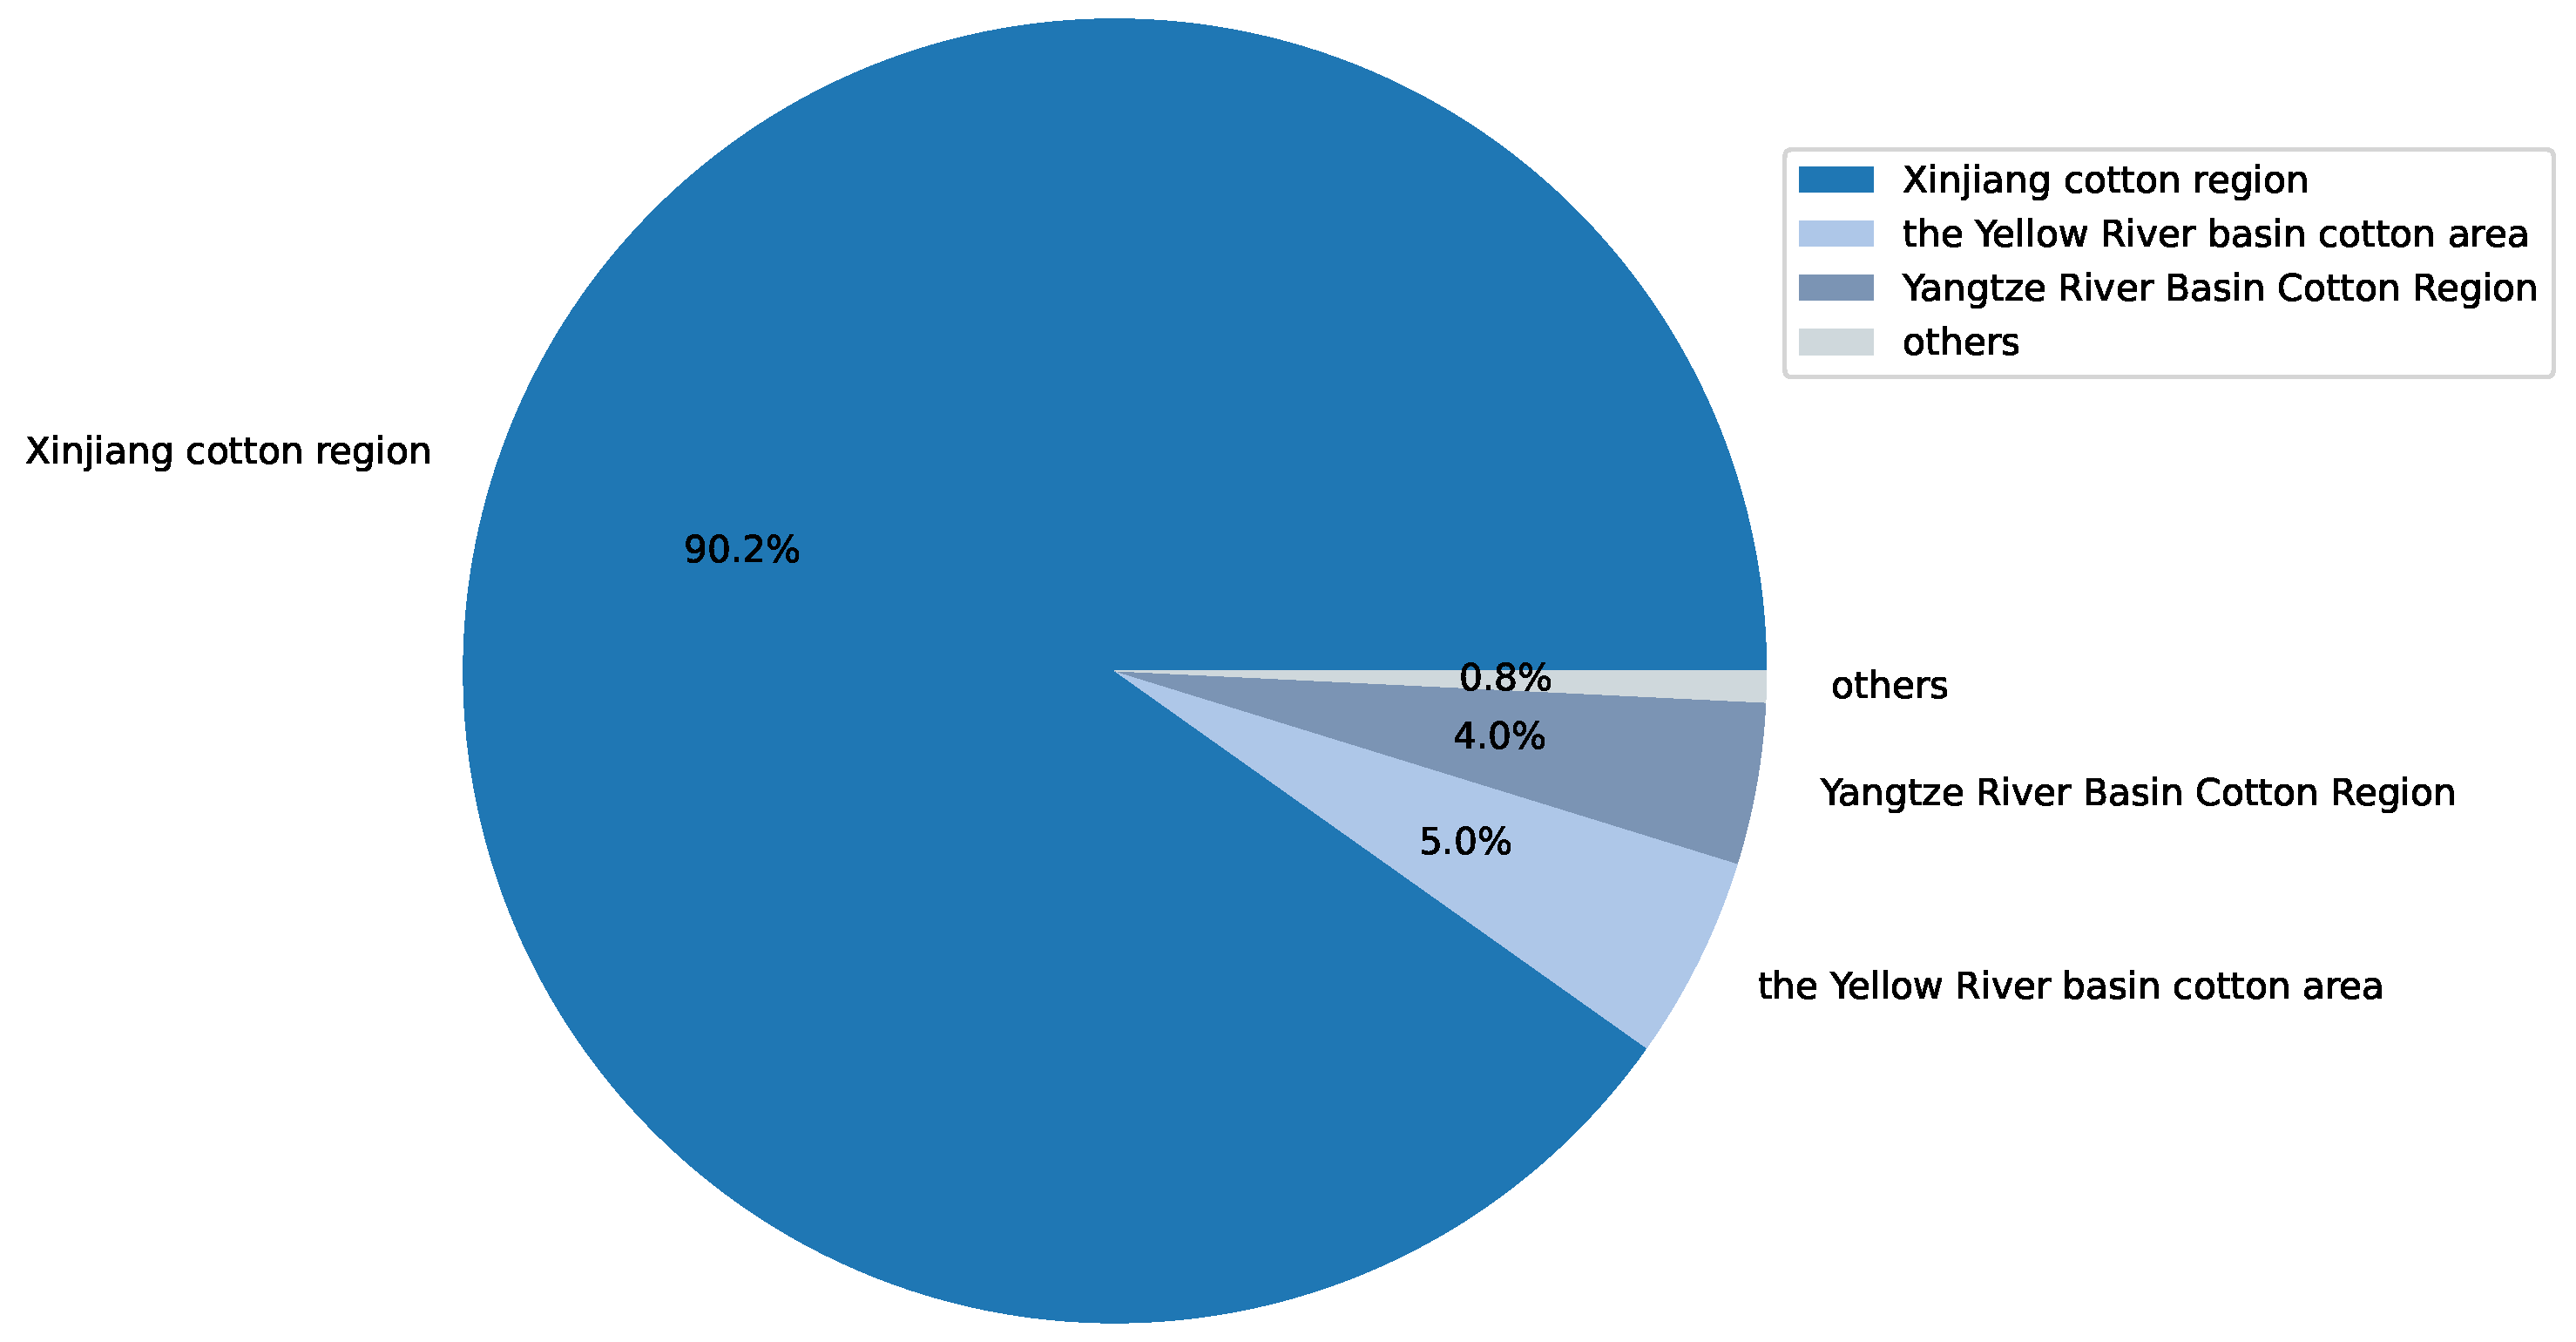
Cotton is an important economic crop, with China, India, the United States, and Brazil being the top four cotton-producing countries. Figure 1 illustrates the global cotton production and end-of-season stocks for the major cotton-producing countries in the 2022/2023 season. As a significant economic crop in China, cotton has been extensively cultivated. However, in recent years, cotton cultivation in China has faced difficulties in management. It has been greatly influenced by climate and planting techniques, resulting in a decline in both cotton acreage and yield, as shown in Figure 2. Among the cotton production regions in China, the Xinjiang region holds a crucial position. As shown in Figure 3, in 2022, Xinjiang accounted for 90.20% of China’s cotton production. As a drought-prone region, the sustainable production of cotton in Xinjiang is severely threatened by future climate change and water scarcity [1,2,3]. Therefore, this article focused on improving water use efficiency (WUE) and the economic benefits of cotton production in Xinjiang.
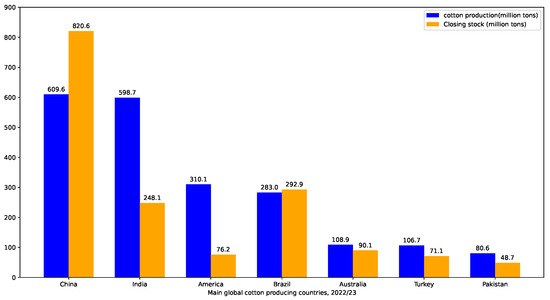
Figure 1.
Worlds’ cotton acreage and production, 2013–2022.
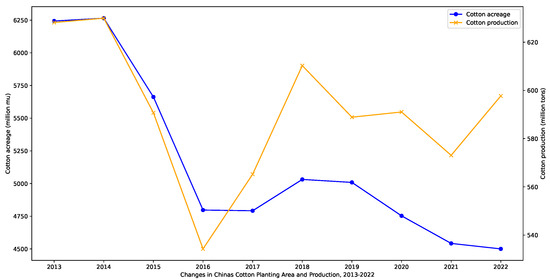
Figure 2.
Average cotton production and stocks in major cotton-producing countries, 2022–2023.
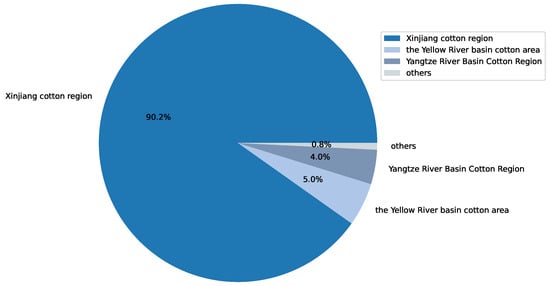
Figure 3.
Production of major cotton producing regions in China in 2022.
The decision system is an integral part of intelligent irrigation planning, as traditional cotton-crop-management strategies fail to estimate crop yield accurately. The current decision-making techniques lack specialized knowledge, resulting in subpar outcomes [4]. Inefficient water utilization plagues traditional irrigation methods, while the exorbitant costs associated with implementing and maintaining existing technologies act as formidable barriers, impeding their adoption among small-scale farmers [5]. However, combining reinforcement learning with the DSSAT crop model can enhance decision-making through more-accurate and -efficient means [6]. The ultimate decision-making system can provide precise irrigation strategies and predict crop yield, improving cotton-crop-management decisions.
Crop models integrate various aspects of agricultural production systems and can serve as alternative methods for irrigation scheduling. Thorp et al. [7] developed a precise agriculture DSS prototype called Apollo using the Decision Support System for Agrotechnology Transfer (DSSAT) crop growth model. Similarly, a two-level optimization model incorporating the SWAP-EPIC agricultural, hydrological model was developed to maximize the WUE and economic returns of irrigation systems [8]. While the direct application of crop models to irrigation management and decision-making is rare, Thorp et al. [9] reported that the CSM-CROPGRO-Cotton model can provide appropriate seasonal irrigation management advice. Crop models have also been used as simulation tools to address various research issues related to irrigation management under subsurface drip irrigation [10]. This article innovatively combined reinforcement learning with the DSSAT crop model to propose a precise irrigation model for cotton.
This study utilized reinforcement learning in conjunction with the crop growth model DSSAT to develop a decision-making system that focuses explicitly on the relationship between irrigation and yield. The system provides precise irrigation strategies based on yield as the critical reward. The rest of this article is organized as follows: Section 2 introduces the related work; Section 3 describes the methodology used in the model; Section 4 presents and analyzes the results of the model’s operation; Section 5 summarizes the research findings of this article.
2. Materials and Methods
2.1. Related Work
Improving crop productivity is crucial for agriculture to meet the rapidly growing demand resulting from population growth. To enhance crop productivity, there is an urgent need to transition from manual methods to automated approaches [11]. In agriculture, the soil, moisture, and temperature data received significantly impact the quality of crops [12]. Traditional irrigation requires a large amount of water, so effective water utilization can enhance agricultural yield [13]. Furthermore, high attention from farmers is necessary to ensure that crops receive the required amount of water, as both water scarcity and excess can damage crops [14]. “Irrigation automation” is one of the pressing technologies to address the issue of excessive water use and improve agriculture [15].
Simulation models have gained interest as decision support systems for managing and assessing crop water usage and production. The Environmental Policy Integrated Climate (EPIC) model was utilized to evaluate its applicability as a decision support tool for irrigation management of cotton and maize in the conditions of South Texas [16]. McCarthy et al. [17] described the implementation of a Model Predictive Control (MPC) methodology for feedback control of irrigation through a model-based irrigation strategy using the “VARIwise” irrigation control simulation framework. Developing and evaluating deficit irrigation strategies for the region could potentially conserve water while maintaining cotton yields. The Decision Support System for Agrotechnology Transfer (DSSAT) Cropping System Model (CSM) CROPGRO-Cotton was extensively tested and employed to evaluate various deficit irrigation strategies for this region [18]. The CROPGRO-Cotton module within the Cropping System Model (CSM) distributed with the DSSAT was assessed for the THP region using measured data from cotton water use efficiency experiments conducted at Halfway over a four-year period (2010–2013) [2]. Liu et al. (2017) [19] aimed to evaluate the performance of the RZWQM2 model in simulating soil moisture content and crop production in a highly arid area, as well as develop an optimal irrigation strategy based on model-simulated crop water stress. Confidence in the reliability of these models can be increased if they provide improved in-season management recommendations that are explicitly tested in the field [9]. Two significant enhancements to the model’s evapotranspiration (ET) routines were evaluated: (1) the inclusion of the ASCE Standardized Reference Evapotranspiration Equation to properly calculate grass and alfalfa reference ET using the most-recent standards and (2) the incorporation of the FAO-56 dual-crop coefficient approach for potential ET determination, which combines an evaporative coefficient (Ke) for potential evaporation with a dynamic basal crop coefficient (Kcb) for potential transpiration based on the simulated leaf area index [20]. Cotton growth stages considered in these studies include: (i) germination and seedling emergence (GS1), (ii) squaring (GS2), (iii) flower initiation/early bloom (GS3), (iv) peak bloom (GS4), and (v) cutout, late bloom, and boll-opening stage (GS5) [21]. The CERES-Sorghum and CROPGRO-Cotton modules of the DSSAT were evaluated using data from cotton–sorghum rotation experiments conducted at Halfway, Texas, over a nine-year period (2006–2014) [22]. The study conducted by Kothari et al. (2021) [23] aimed to assess the impacts of climate change on cotton yield and irrigation water use, as well as evaluate six ideotypes for adaptation.
Decision-making in the agricultural field is a part of real-world decision problems, which often involve complexity. Utilizing reinforcement learning is a promising approach to address such complex problems. Quah et al. (2005) [24] formulated a pattern-classification problem as a reinforcement learning problem. Ramesh et al. (2012) [25] discussed the application of the Modified Non-Dominated Sorting Genetic Algorithm-II (MNSGA-II) to the multi-objective Reactive Power Planning (RPP) problem. Khalili-Damghani et al. (2012) [26] proposed an integrated multi-objective framework for project portfolio selection considering both profit and risk objectives. Yicong et al. (2018) [27] outlined how to handle multiple objectives in decision theoretic planning and reinforcement learning algorithms. This approach identifies a unique Pareto solution that best reflects the decision-maker’s preferences using weighting factors generated through well-known MADM methods such as SWING, SMART, AHP, and TRADE OFF [28]. Zhang et al. (2019) [29] proposed a hybrid optimization approach (M-BGV) that combines the multi-objective artificial bee colony (MOABC), best–worst (BW) method, grey relational analysis (GRA), and Visekriterijumsko kompromisno rangiranje (VIKOR) to solve the structural optimization problem for energy-absorbing structures in train collisions. The study by Piasecki et al. (2020) [30] aimed to develop a practical method for prioritizing indoor air pollutants based on technical, economic, and health aspects in the Indoor Air Quality model (IAQ). Yu et al. (2021) [31] applied a deep reinforcement learning algorithm to achieve online decision-making. Xu et al. (2021) [32] constructed a multi-indicator emergency-risk-assessment method that considers the evacuation speed of different population types and health consequences caused by various risk components. Saad et al. (2011) [33] introduced a new application of hesitant fuzzy sets in real-life modeling.
Building upon the existing literature, the objective of this study was to strive for greater efficiency in agricultural systems. However, for demanding crops, in particular cotton, more effort is needed in the practice of smart agriculture. Cotton crops are widely cultivated and affected by various pests, including the devastating pest aphids due to unfavorable environmental conditions. The proposed research suggests that additional work is required to achieve optimal climate conditions for cotton crops through smart irrigation systems while conserving water and electricity. Compared to other methods, the following solutions focus on achieving smart agriculture with lower complexity.
2.2. Study Region
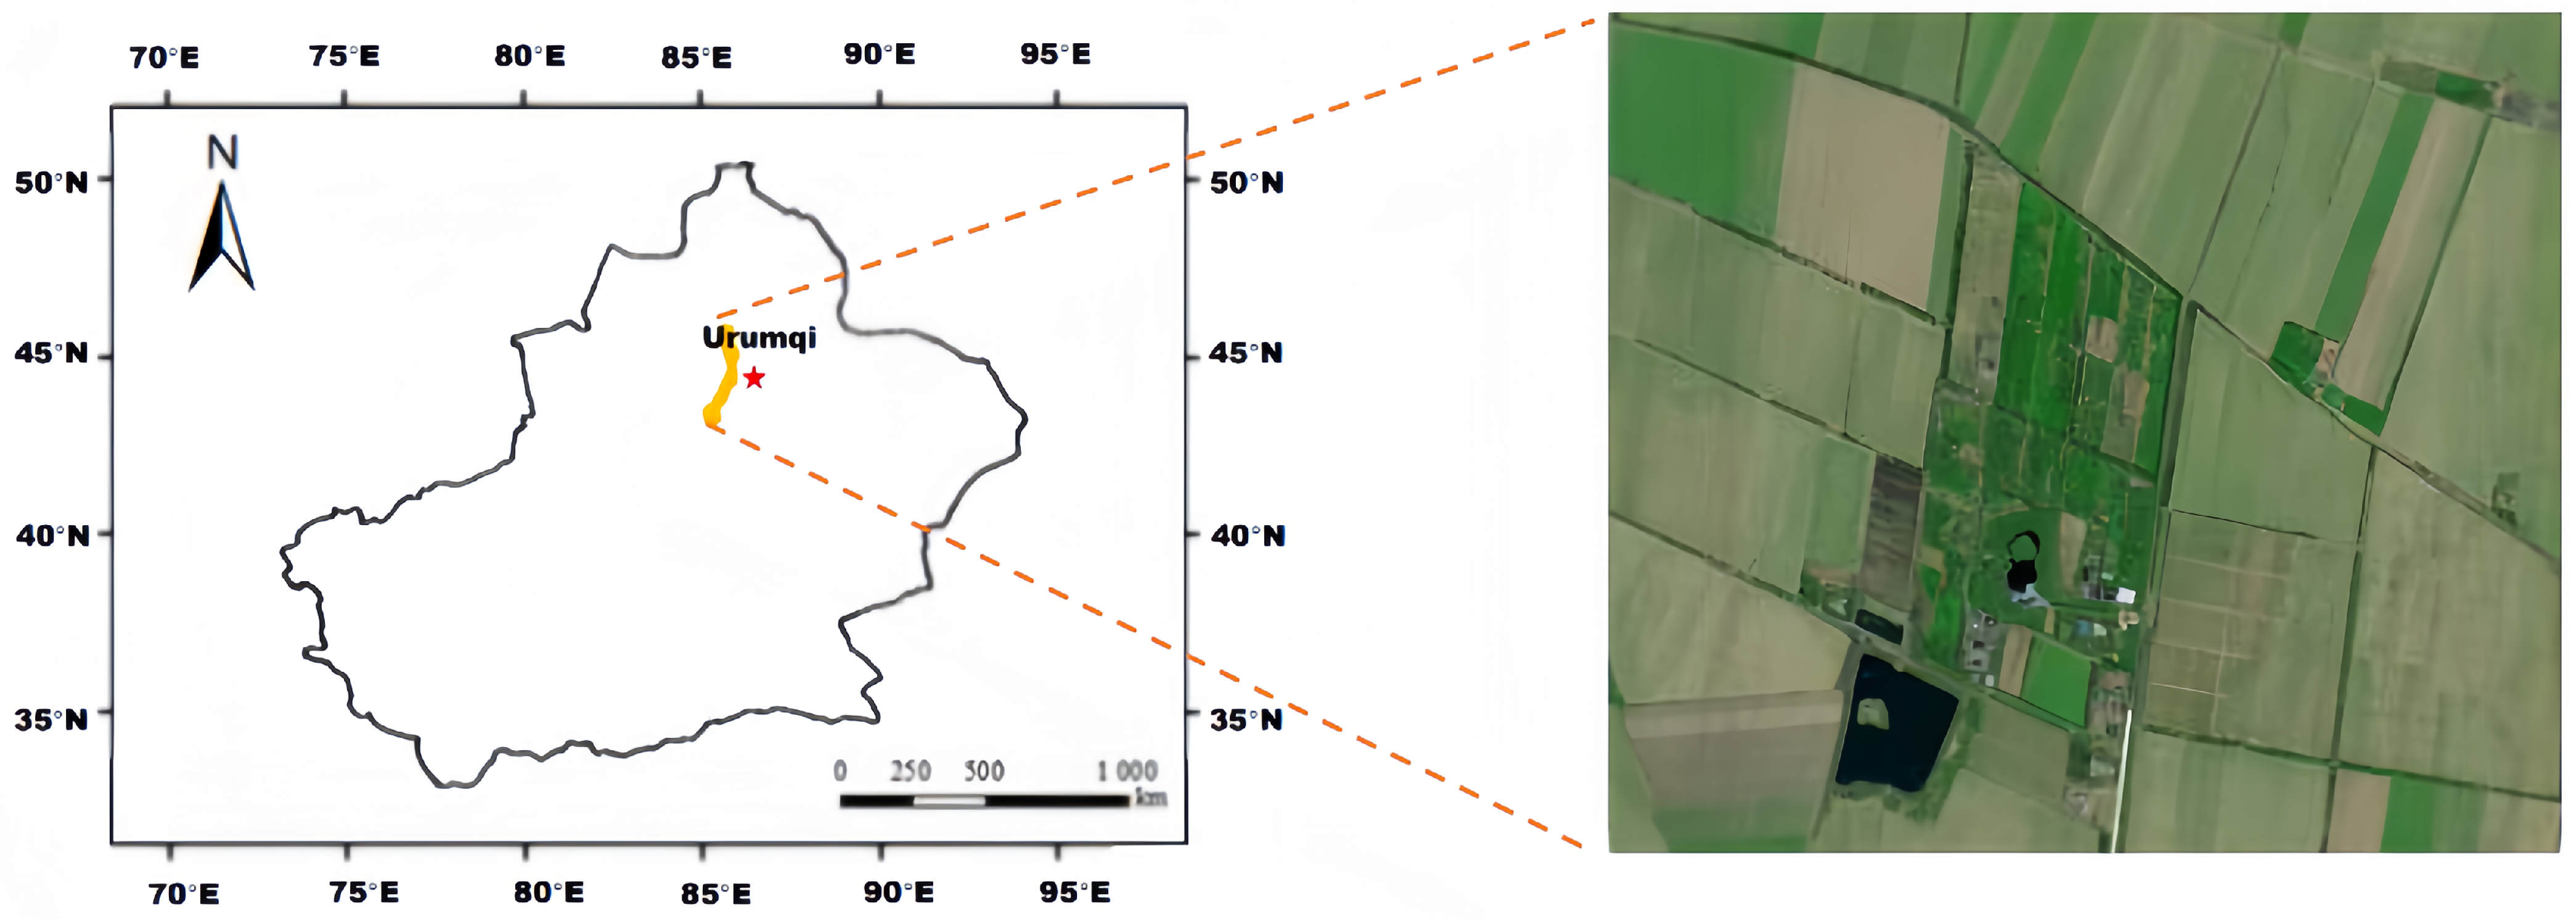
We selected a farm located in Changji City, Xinjiang, China, as our experimental field (87°30′ N–87°31′ N, 44°23′ E–44°22′ E; Figure 4). From 2020 to 2022, the daily minimum temperature in the region ranged from −26.6 °C to 41.4 °C. The average annual precipitation was 137.0 mm, with an average annual temperature of 17.52 °C. Glacial meltwater and groundwater serve as the primary sources of irrigation water for cotton cultivation in this region. The predominant soil type in the area is sandy soil. The sandy soil composition has implications for water retention and drainage, making it crucial to implement precise irrigation strategies to maximize water utilization and minimize water loss through percolation or runoff.

Figure 4.
Geographic location of selected experimental sites, Changji, Xinjiang, Northwest China.
To evaluate the performance of the smart irrigation system, we compared it with a traditional irrigation method commonly used in the region. The traditional method relies on farmers’ experience and manual observations to determine irrigation timing and amounts. By comparing the two approaches, we aimed to assess the efficiency gains and potential water savings achieved by implementing smart irrigation technologies. The results of our study will contribute to the advancement of smart agriculture practices, particularly in water-scarce regions like Xinjiang. By optimizing irrigation management based on real-time data and crop water requirements, we aimed to enhance water use efficiency, increase crop yield, and minimize the environmental impacts associated with excess water application.
2.3. Solar Radiation, Temperature, and Rainfall
The DSSAT model requires three types of data: climate data, soil data, and crop data. In this study, climate data were primarily obtained from data.cma.cn (accessed on 2 November 2023). As for soil data, they are provided within the software. Regarding the crop data, we initially employed the inherent crop data sourced from the DSSAT software. Subsequently, we fine-tuned the variety parameters to align closely with the actual crop varieties cultivated in tandem with our authentic field experiments. Notably, our comprehensive crop parameters are meticulously presented in the accompanying Table 1.

Table 1.
Genetic parameter data and range of varieties.
These climate data parameters are crucial for accurately simulating crop growth and yield predictions using the DSSAT model. The model takes into account the temperature range, solar radiation availability, and precipitation patterns to estimate crop water requirements, photosynthesis rates, and overall crop performance. By integrating these data inputs, the model can assist in decision-making related to crop management practices.
2.4. Soil Data
In our investigation, the incorporation of precise soil data holds immense significance in refining the model predictions and formulating efficient irrigation strategies. To achieve this, we conducted rigorous field experiments while harnessing data acquired from NASA GES DISC (https://ldas.gsfc.nasa.gov/gldas/, accessed on 2 November 2023), which serves as a valuable source of soil-related information (Table 2). An examination of the dataset revealed that the Xinjiang region predominantly exhibits a sandy soil composition. Therefore, it becomes imperative to emphasize the maximization of water resource utilization in this particular region.
Table 2.
Soil data from the experimental site.
2.5. DSSAT Model Description
The Decision Support System for Agrotechnology Transfer (DSSAT) is an application software program that consists of crop simulation models for over 42 different crops (as of version 4.7.5) and a suite of tools to facilitate the effective use of these models. These tools include database management programs for soil, weather, crop management, and experimental data, as well as utilities and application interfaces. The crop simulation models simulate the growth, development, and yield of crops based on the dynamic relationships among soil, plants, and the atmosphere [34,35,36]. In this study, the CSM-CROPGRO-Cotton model, incorporated within the DSSAT shell [18,37], was used to investigate the impact of climate change on cotton yield. Furthermore, the model was utilized to optimize production strategies, providing a simulated farming environment, make usage of reinforcement learning algorithms, and develop tailored solutions for improving cotton yield in the Changji region of Xinjiang, China, while ensuring precise irrigation practices.
The DSSAT software (version 48), with its comprehensive crop simulation capabilities, enables researchers to study the complex interactions between climate variables and crop performance. By utilizing the CSM-CROPGRO model specifically for cotton, the study aimed to assess the potential effects of climate change on cotton production. This model considered various factors such as temperature, rainfall, solar radiation, and soil characteristics to simulate cotton growth, development, and ultimately, yield. By analyzing the model outputs under different climate scenarios, researchers can gain insights into the potential impacts of climate change on cotton production in the region.
Moreover, the DSSAT software provides a valuable platform for optimizing production strategies. By integrating the CSM-CROPGRO-Cotton model, researchers can simulate different management practices, including irrigation scheduling, fertilizer application, and crop rotation, to identify the most-effective strategies for increasing cotton yield. The software allows for exploring various scenarios and evaluating their potential outcomes, providing valuable guidance for decision-making in agricultural management.
2.6. Experimental Design
We conducted real field experiments in the cotton fields at Huaxing Farm, located in Changji, Xinjiang. Three sets of irrigation strategies were developed and implemented. The primary focus of our study was the assessment of cotton seed yield, which served as the ultimate observation index. Additionally, we diligently recorded the amount of water applied throughout the irrigation cycle. Detailed information regarding the experimental setups can be found in the accompanying Table 3.
Table 3.
Irrigation strategies for real field experiments.
Three points were selected for each irrigation treatment plot during the yield estimation. A total of 9 measurement points were selected for the 3 irrigation treatments in this experiment. The yield per acre was determined using the following formula based on the measured sample yield:
In the formula, represents the theoretical yield per mu (kg/mu) of a certain treatment calculated through sample estimation, where i represents the code for different irrigation treatments. The observed yields of real field experiments are shown in Table 4.
Table 4.
Field observation seed cotton yield results’ and simulated yield results’ data.
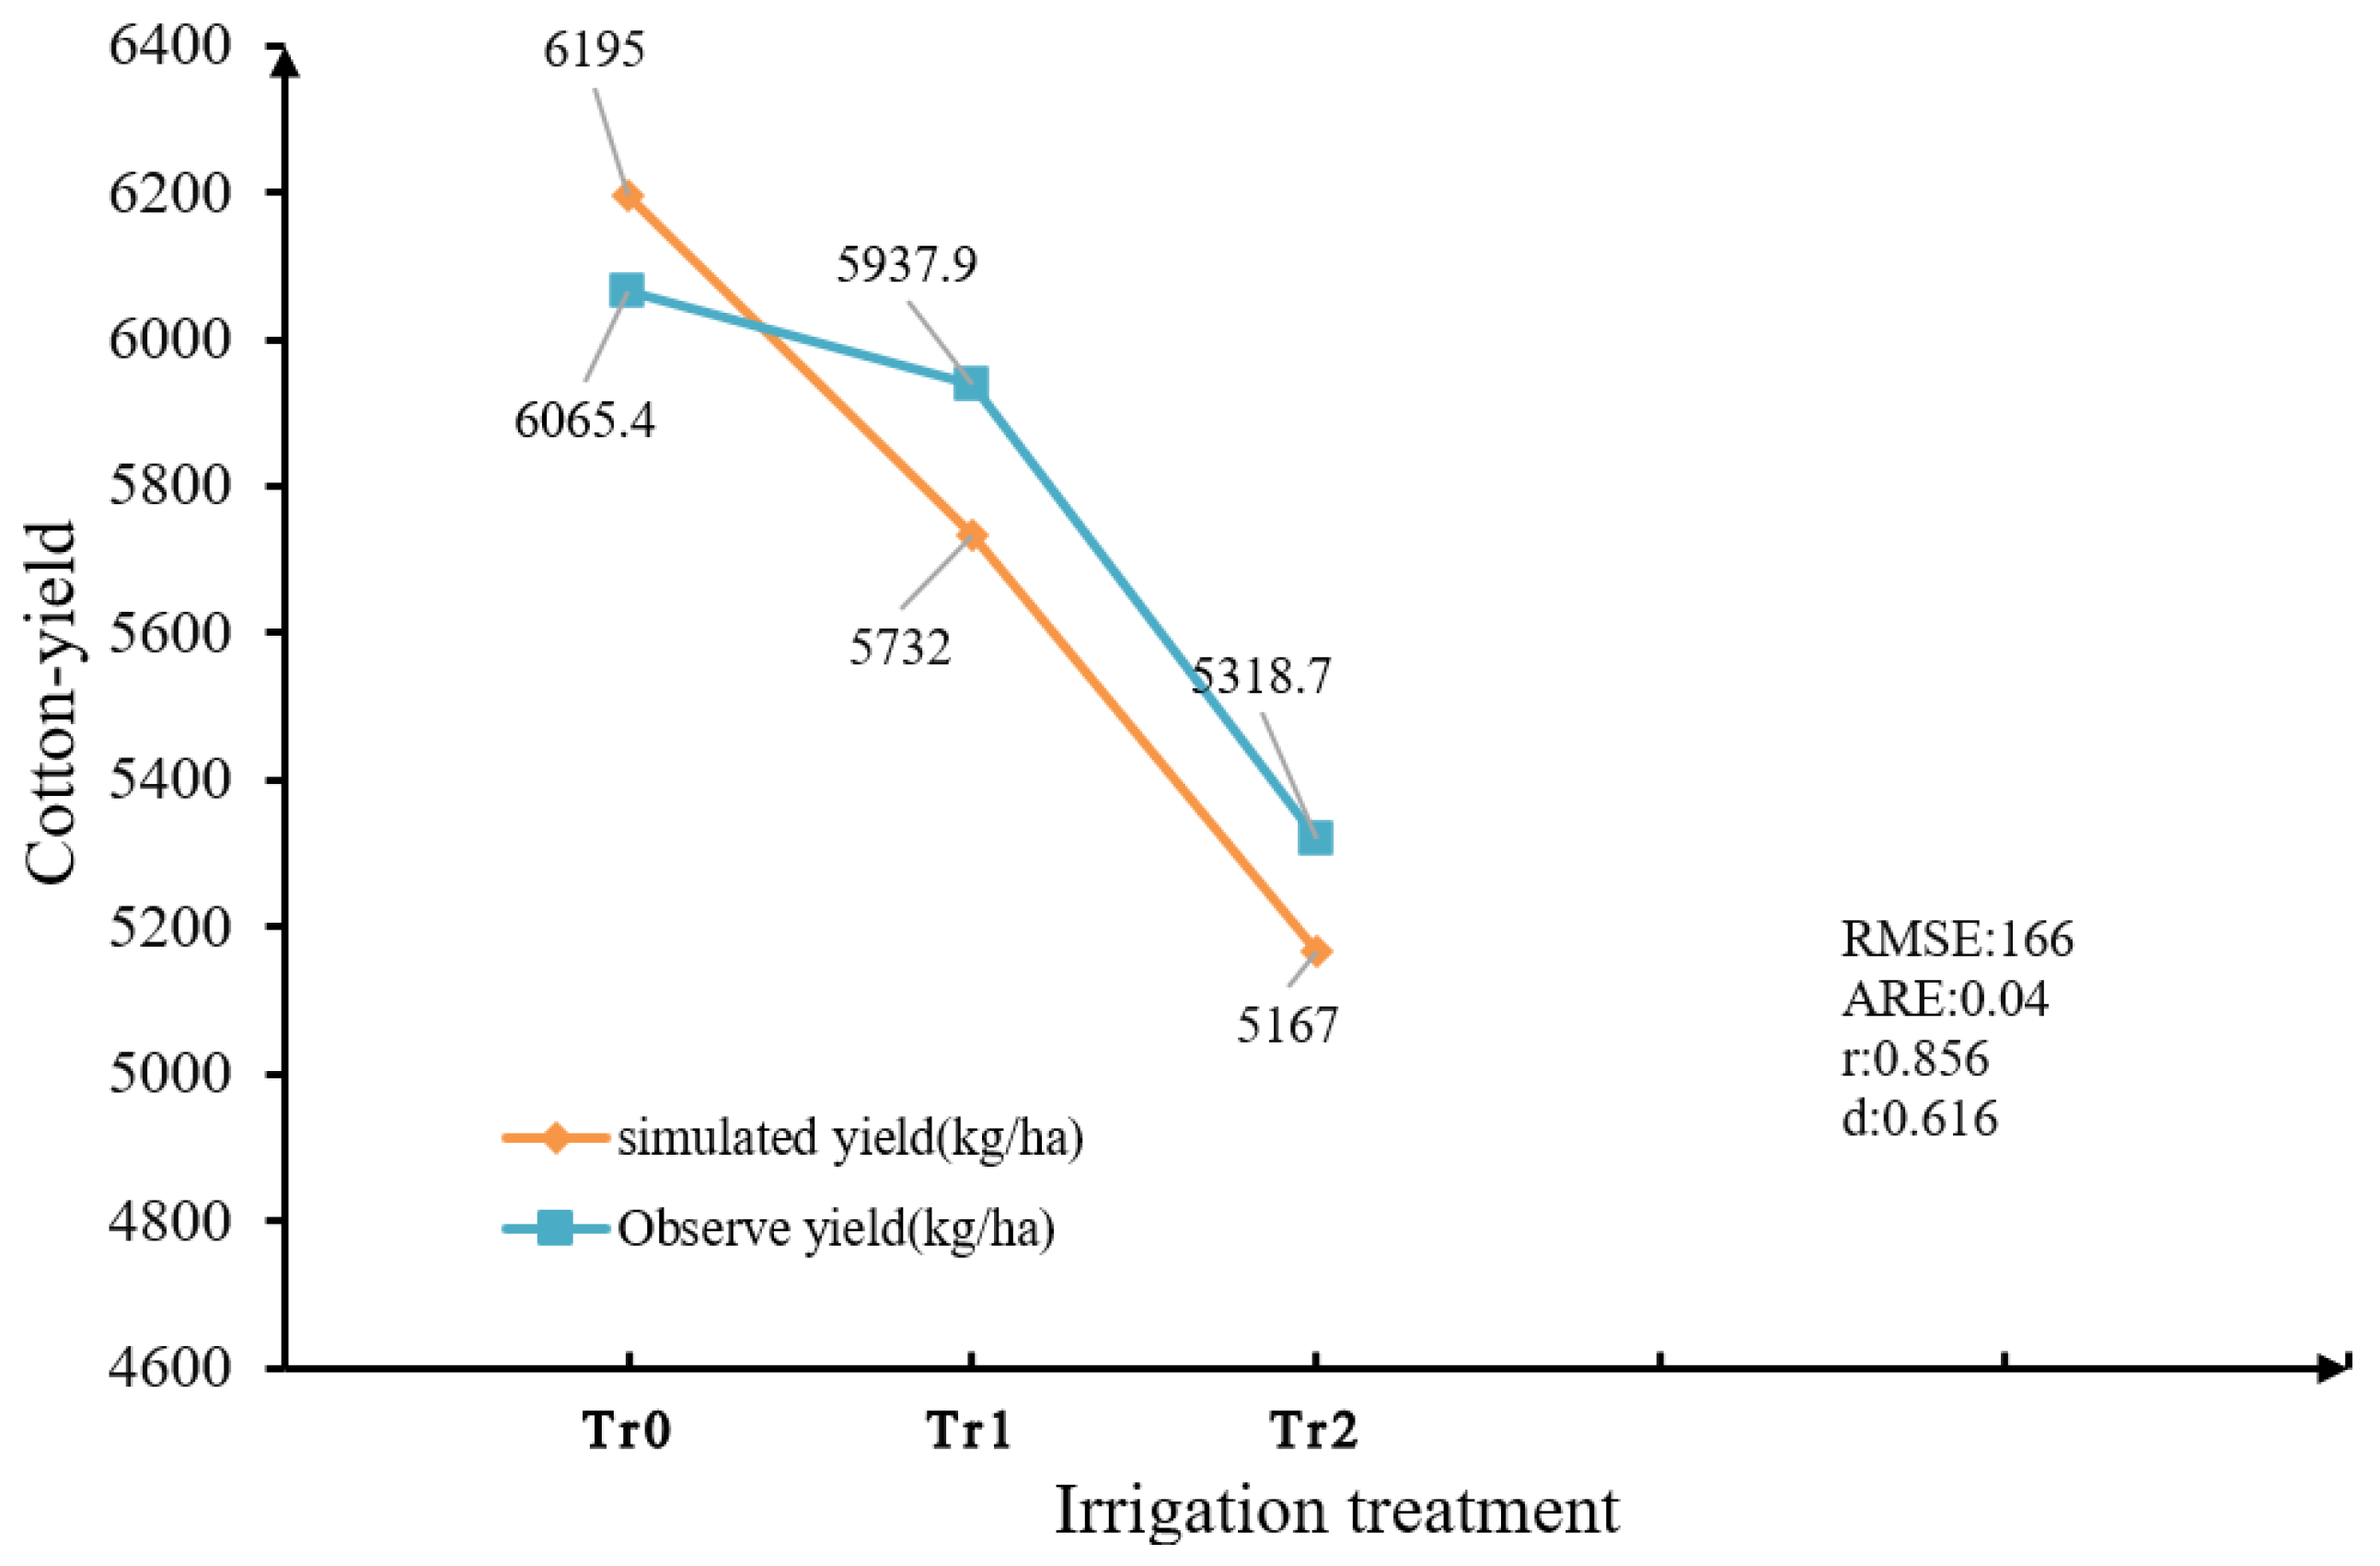
Before using reinforcement learning to optimize irrigation decisions, it is necessary to assess the accuracy of the calibrated CSM-CROPGRO-Cotton model through simulation. The basic approach involved comparing the simulated values with the actual measurements from the year 2023 using statistical methods. The main statistical metrics used for evaluation were the root-mean-squared error (), normalized root-mean-squared error (), absolute error (), absolute relative error (), coefficient of determination (), and index of agreement (d). In this study, the performance of the DSSAT model was evaluated using the above metrics for aboveground cotton yield and the leaf area index (), based on measurements from fields planted with “Zhongmian 113” in April 2023 and harvested in October 2023. The evaluation metrics were calculated using the following formulas.
In the above formulas, n represents the number of observations, represents the simulated values from the DSSAT model, represents the actual observed values from field experiments with deficit irrigation, and represents the mean of the observed values. stands for the absolute relative error, which measures the average relative difference between the observed values and the model or estimation values, indicating the average proportion of the model’s prediction error relative to the observed values. represents the root-mean-squared error, which measures the average difference between the observed values and the model or estimation values, indicating the standard deviation of the model’s prediction error. is the normalized root-mean-squared error, used to compare the model fitting error of datasets with different scales or ranges. It normalizes the value with respect to the data range, making comparisons between different datasets more comparable.
A lower indicates better predictive accuracy of the model. When validating the CSM-CROPGRO-Cotton model, the can be used to assess the model’s accuracy in predicting the yield and LAI. A lower value suggests that the model has good robustness in predicting these indicators. The coefficient of determination, denoted as , measures the degree of the linear relationship between the model and observed data. A higher value indicates a better fit of the model to the yield and LAI data. In the CSM-CROPGRO-Cotton model, was used to evaluate the model’s explanatory power for the yield and LAI, where a higher value signifies a better ability to explain and fit the observed data. The index of agreement, represented by d, measures the consistency between the model’s predictions and observed data, taking into account both the bias and variability of the predictions. In the CSM-CROPGRO-Cotton model, the index of agreement was used to assess the model’s consistency in predicting the yield and LAI. A higher value indicates that the model can generate stable and consistent predictions, demonstrating good robustness. When d > 0.65, this indicates a good simulation performance, and when , the results can be considered acceptable. For the , values greater than 10% are considered good, values between 20% and 30% indicate moderate model performance, and values above 30% are considered poor.
As shown in Figure 5, the calculated for yield was 166, the was 0.04, the was 0.856, and d was 0.0616. The results, with , , and , indicated that the model simulation results were good.
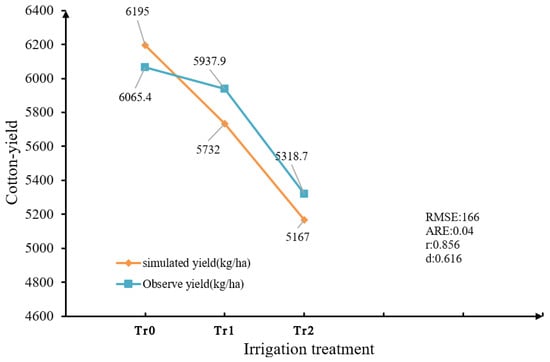
Figure 5.
Simulated yield and observation results.
The values of the , , and d demonstrated good robustness when validating the CSM-CROPGRO-Cotton model, indicating its suitability for cotton simulation experiments. Therefore, it can be concluded that the DSSAT model with calibrated parameters can be used for yield prediction in the Huaxing area of Changji. Simultaneously, we employed the calibrated DSSAT model as the interactive environment for reinforcement learning, facilitating experimental comparisons.
2.7. Reinforcement Learning Model
To achieve optimal yield by obtaining more-precise irrigation strategies, we employed a reinforcement learning approach in combination with the DSSAT model to select the best irrigation strategy. The general framework diagram of our model is shown in Figure 6.
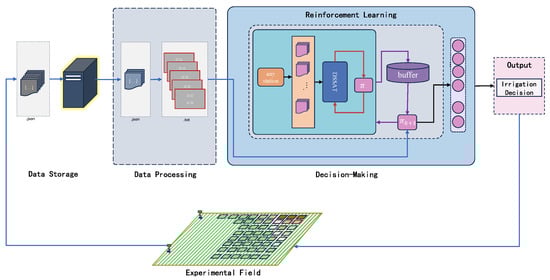
Figure 6.
The modeling framework we adopted realizes closed-loop control throughout the entire process from data acquisition to the output strategy.
Reinforcement learning is a machine learning technique that utilizes an agent’s interactions with the environment to learn and adapt its behavior over time. By employing this approach in conjunction with the DSSAT model, we aimed to optimize irrigation practices and maximize crop yield. We show the specific structure of the reinforcement learning in Figure 7.
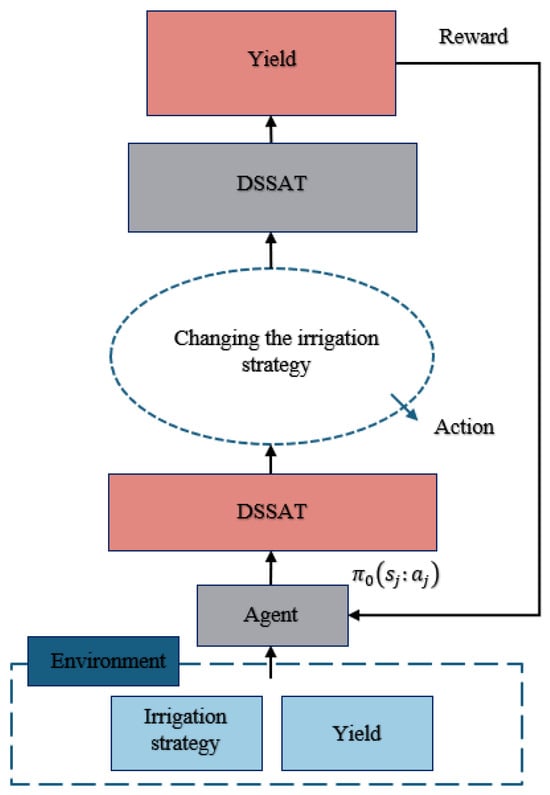
Figure 7.
Detailed structure of the reinforcement learning model.
The DSSAT model, as mentioned earlier, is a powerful tool for simulating crop growth and development based on various environmental factors. By integrating reinforcement learning algorithms with the DSSAT model, we created a framework to identify the most-effective irrigation strategies for optimizing crop production.
Through a continuous iterative process, the reinforcement learning agent interacted with the simulated farming environment provided by the DSSAT model. It learned from the feedback it received based on the performance of different irrigation strategies and adjusted its decision-making accordingly. This adaptive learning process allowed the agent to discover the irrigation strategies that led to the highest crop yields.
By combining the computational power of the DSSAT model with the decision-making capabilities of reinforcement learning, we aimed to overcome the challenges of finding the optimal irrigation strategy in a complex and dynamic agricultural system. The DSSAT model provided the necessary crop growth simulations and environmental data, while the reinforcement learning algorithms enabled the agent to explore and exploit the irrigation space efficiently.
The ultimate goal of this approach was to identify the irrigation strategy that maximizes crop yield while minimizing water usage and other resource inputs. By leveraging the capabilities of reinforcement learning and the rich simulation environment provided by the DSSAT model, we aimed to contribute to the development of sustainable agricultural practices that optimize yield and resource utilization.
It is worth noting that the success of this approach relies on the accuracy and reliability of the DSSAT model in simulating crop growth and the availability of quality environmental data. Careful validation and calibration of the model outputs are essential to ensure the robustness and generalizability of the selected irrigation strategies.
2.7.1. State
Our reinforcement learning approach maintains a series of environmental states, denoted as , encapsulating the irrigation strategies and corresponding crop yields at each state. These states serve as crucial inputs for the intelligent agent to make informed decisions. We designed as a vector, denoted as , which concatenates two key features. The first feature is the vector representation of the irrigation strategy. In this study, we utilized a greedy algorithm to optimize the irrigation strategy at each step, which serves as the first input feature. The second feature is the yield obtained under the current irrigation strategy.
The reinforcement learning agent learns from these environmental states and their associated features to determine the most-effective irrigation strategy for maximizing crop yield. By considering the vector representation of the irrigation strategy and the corresponding yield, the agent can evaluate the performance of different strategies and adjust its decision-making accordingly.
The vector representation captures essential aspects of the irrigation strategy, incorporating relevant parameters such as water application rates, frequency, and timing. This representation allows the agent to consider the multidimensional nature of the irrigation strategy and explore a diverse range of possible actions.
Furthermore, the yield obtained under the current irrigation strategy serves as a critical feedback signal for the reinforcement learning agent. By assessing the crop yield achieved in each environmental state, the agent can learn to associate different irrigation strategies with their corresponding outcomes and adapt its behavior accordingly.
It is important to note that our reinforcement learning approach leverages the strengths of both exploration and exploitation. Initially, the agent explores various irrigation strategies to gather information about their performance. As the learning process progresses, the agent gradually shifts towards exploiting the knowledge gained, favoring the irrigation strategies that have yielded higher crop yields in previous states. We show the details of our designed state vector in Table 5.
Table 5.
Example state vectors, wherein the vectors in the first dimension represent the date of irrigation and the yield and the second dimension demonstrates the irrigation strategy and the corresponding yield.
Through this iterative process of exploration and exploitation, the reinforcement learning agent aims to converge on the optimal irrigation strategy that maximizes crop yield while considering the limitations and constraints of the farming system.
2.7.2. Action
Our approach updates the irrigation strategy at each reinforcement learning step. Based on local cotton farming experience, we define an irrigation cycle of 7 days, covering the entire growth period of cotton. At the i-th step, the agent modifies the current irrigation strategy, starting from selecting irrigation data for the i-th irrigation event. The irrigation selection at each node is denoted as . We updated the reward after each batch and retained the irrigation strategy at the current i-th position. The policy function determines the distribution over actions in a given state. The trainable parameters in the policy function are represented as . We show the details of our action part of the algorithm design in Algorithm 1.
| Algorithm 1 Max Yield Irrigation Optimization |
| Description: This algorithm aims to optimize the irrigation strategy by applying a greedy approach to maximize the yield for each period within a 20-period irrigation cycle. Input: initial irrigation strategy—initial irrigation strategy consisting of 20 irrigation periods and corresponding yield Output: Optimized irrigation strategy—the irrigation strategy that maximizes yield for each period Pseudo-code: Function Optimize Max Yield Irrigation (initial irrigation strategy): Initialize state vector to initial irrigation strategy Repeat the following process for 20 cycles: For each period in state vector: max yield = 0 best irrigation amount = 0 For each possible irrigation amount in current period: Calculate yield for the current irrigation amount If yield > max yield: max yield = yield best irrigation amount = current irrigation amount Update irrigation amount for the current period to best Irrigation amount Return the optimized irrigation strategy for maximum yield |
By updating the irrigation strategy at each reinforcement learning step, our approach allows for adaptive decision-making based on the local cotton planting experience. The irrigation cycle of 7 days ensures that the irrigation strategy covers the entire growth period of cotton, considering the varying water requirements at different stages.
To modify the irrigation data, the agent explores different irrigation choices from the i-th irrigation event onward. The irrigation selection at each node, denoted as , ranges from 10 to 110, representing the amount of water applied during the irrigation event. This range allows for flexibility in adjusting the irrigation intensity based on the specific needs of the cotton crop.
Furthermore, we updated the reward after each batch, providing feedback to the agent on the performance of different irrigation strategies. This reward update helps the agent learn to associate specific irrigation choices with their resulting effects on crop yield. By optimizing the reward, the agent can adapt its decision-making to select irrigation strategies that lead to higher yields.
Throughout the learning process, the current irrigation strategy at the i-th position is retained, ensuring that the agent builds upon previous knowledge and avoids discarding potentially valuable information. This retention mechanism enables the agent to leverage its learning from previous steps and make incremental improvements to the irrigation strategy over time.
The policy function is responsible for determining the distribution over actions in a given state. The trainable parameters in the policy function allow the agent to adapt its decision-making based on the observed states and rewards. By adjusting these parameters through the reinforcement learning process, the agent can learn to select irrigation strategies that maximize crop yield.
2.7.3. Reward
To ensure that the final decision on the irrigation strategy maximizes cotton yield, we selected the output harvest-weighted average mean yield (HWAMS) from the DSSAT model as the reward signal. We define a batch of training instances as , represented as , where b denotes the batch ID and m represents the batch size. For each instance (), we constructed a state vector for each irrigation strategy and sample actions based on the policy .
The choice of reward signal is crucial in reinforcement learning to guide the agent toward the desired objective. In this case, we aimed to maximize cotton yield, and thus, we utilized the HWAMS output from the DSSAT model as the reward signal. HWAMS provides an aggregated measure of yield, taking into account various factors such as growth stages, environmental conditions, and irrigation practices. By using HWAMS as a reward, we incentivized the agent to explore and learn irrigation strategies that lead to higher cotton yields.
To facilitate the learning process, we organized the training data into batches. Each batch, denoted as , consisted of a sequence of instances . The batch size, represented by m, determines the number of instances in each batch. Batching the data helps stabilize the learning process and allows for more-efficient computation.
For each instance within a batch, we constructed a state vector for each irrigation strategy considered. The state vector captures relevant information about the current state, such as soil moisture levels, weather conditions, and crop growth stage. This information is crucial for the agent to make informed decisions regarding the irrigation strategy.
Based on the policy function , we sampled actions for each state vector . The policy function, parameterized by , determines the probability distribution over actions given a specific state. By sampling actions from this distribution, the agent explores different irrigation choices and learns the consequences of its actions through the obtained rewards.
3. Results
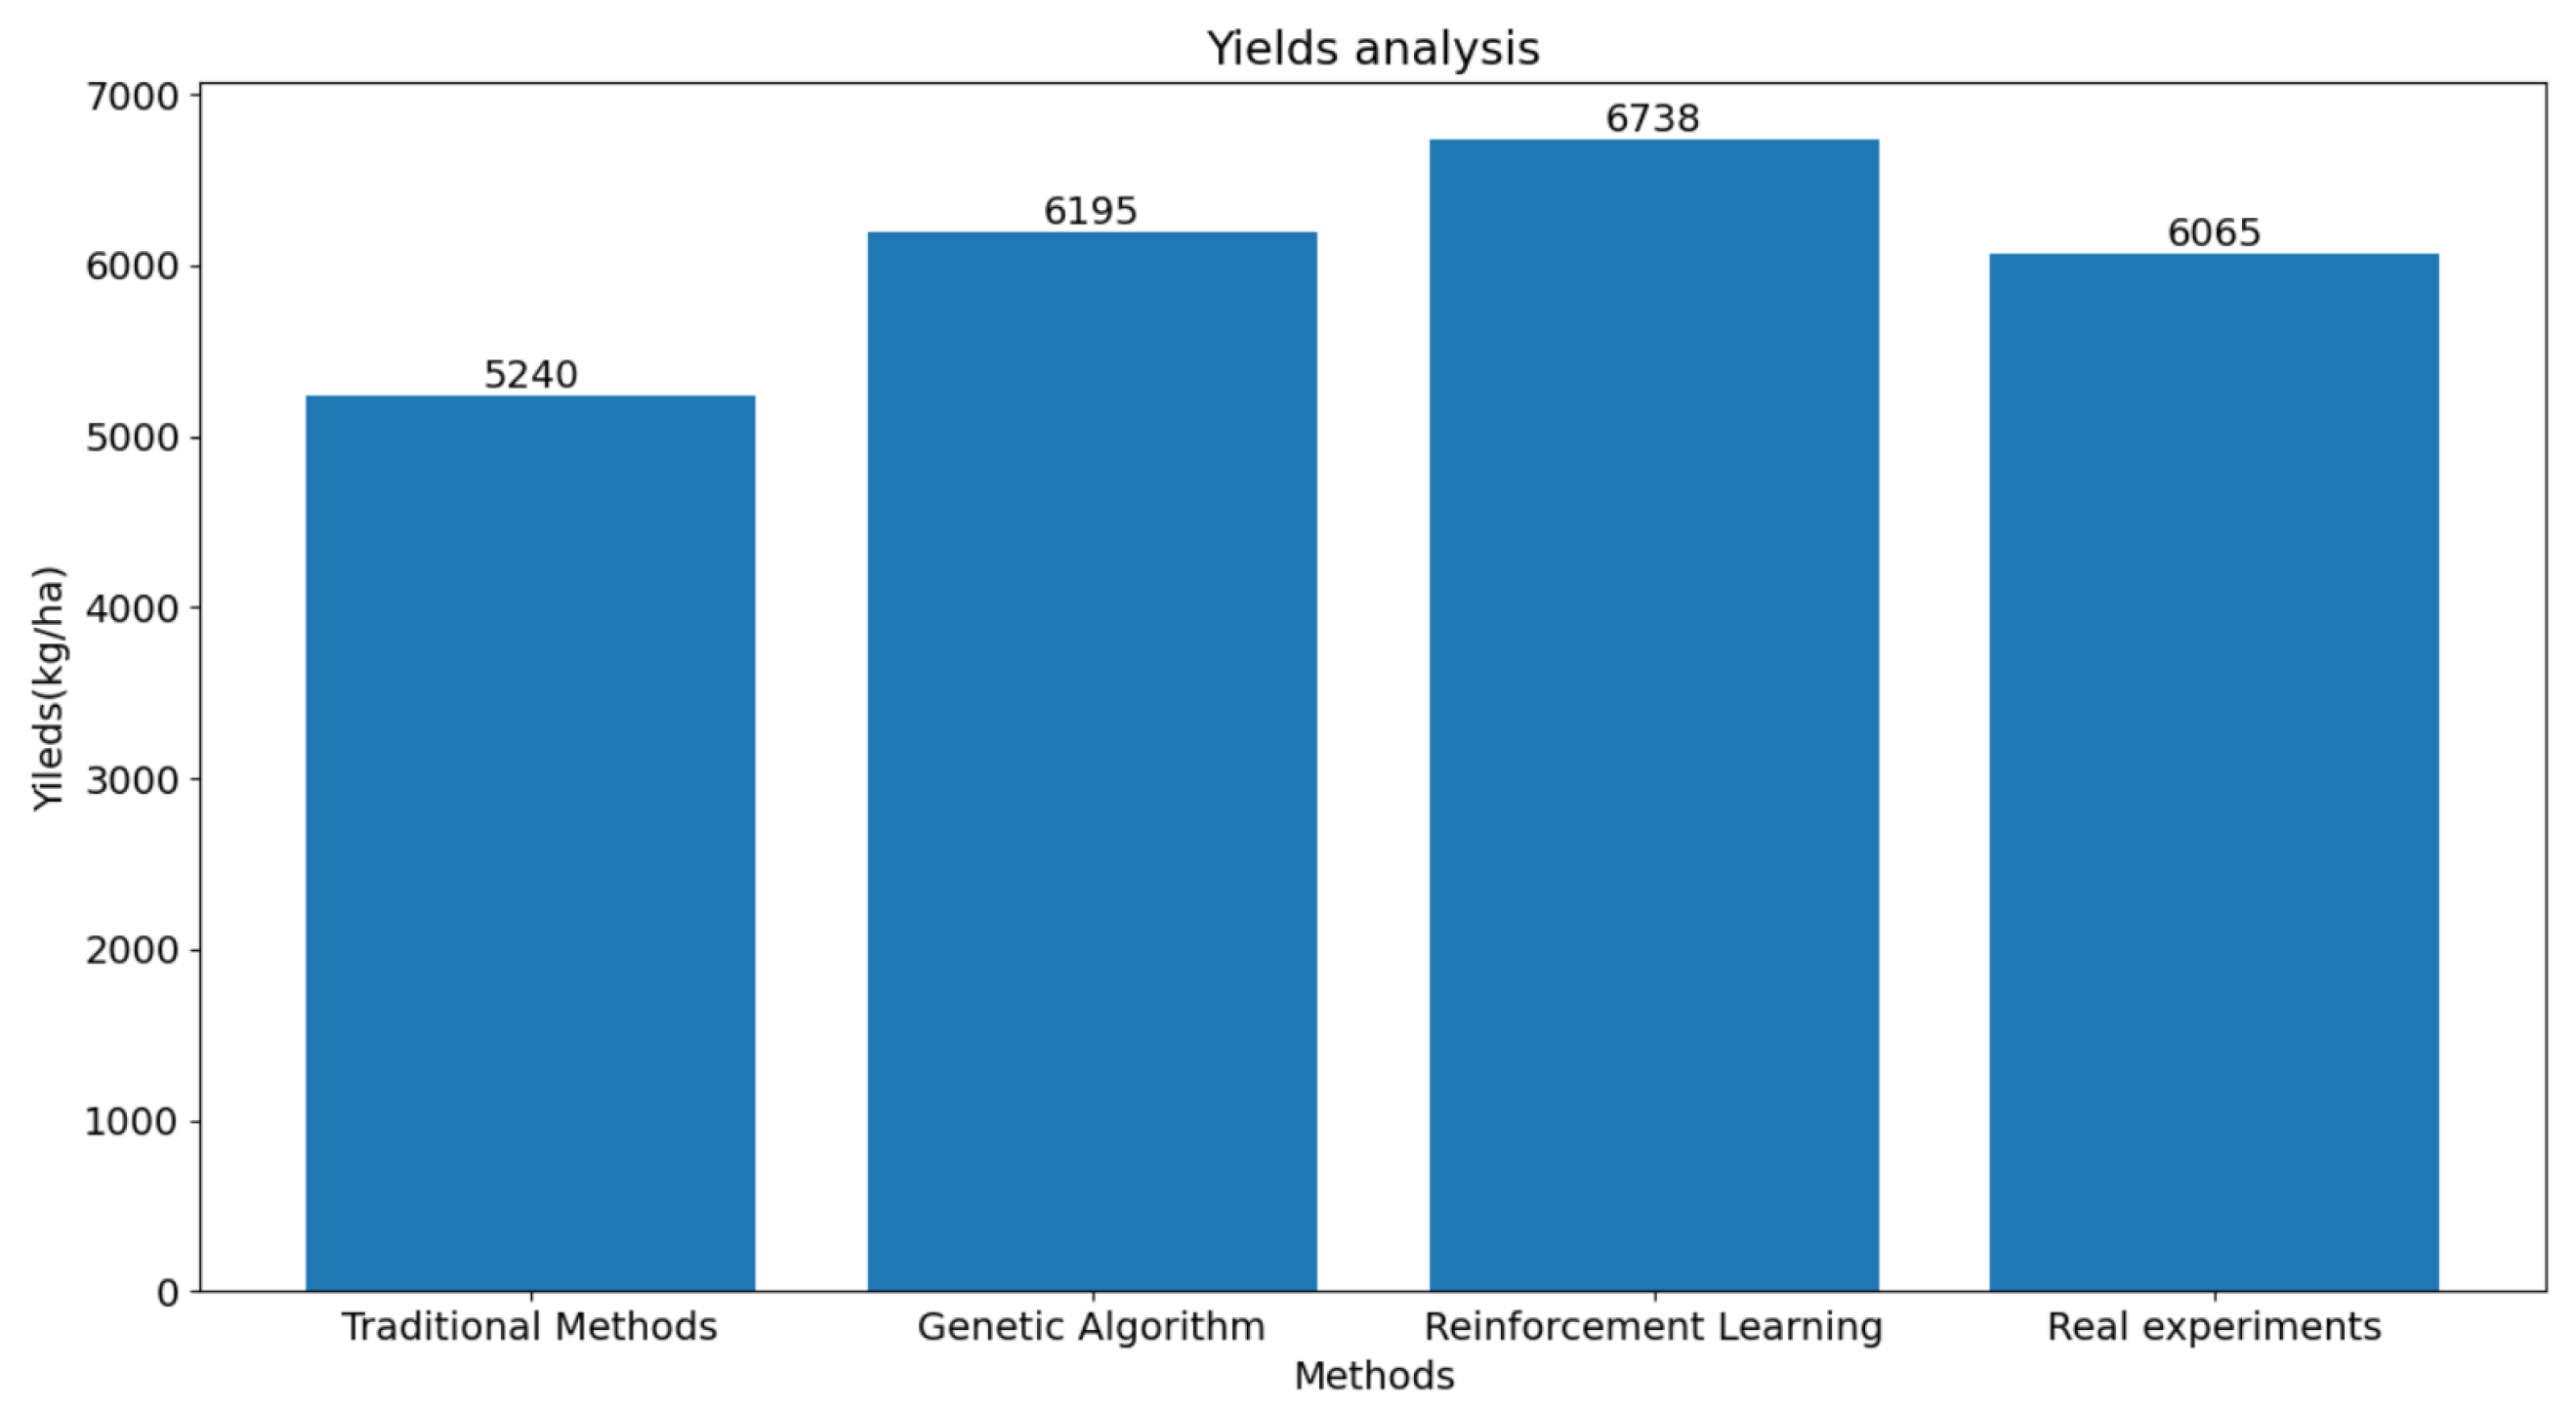
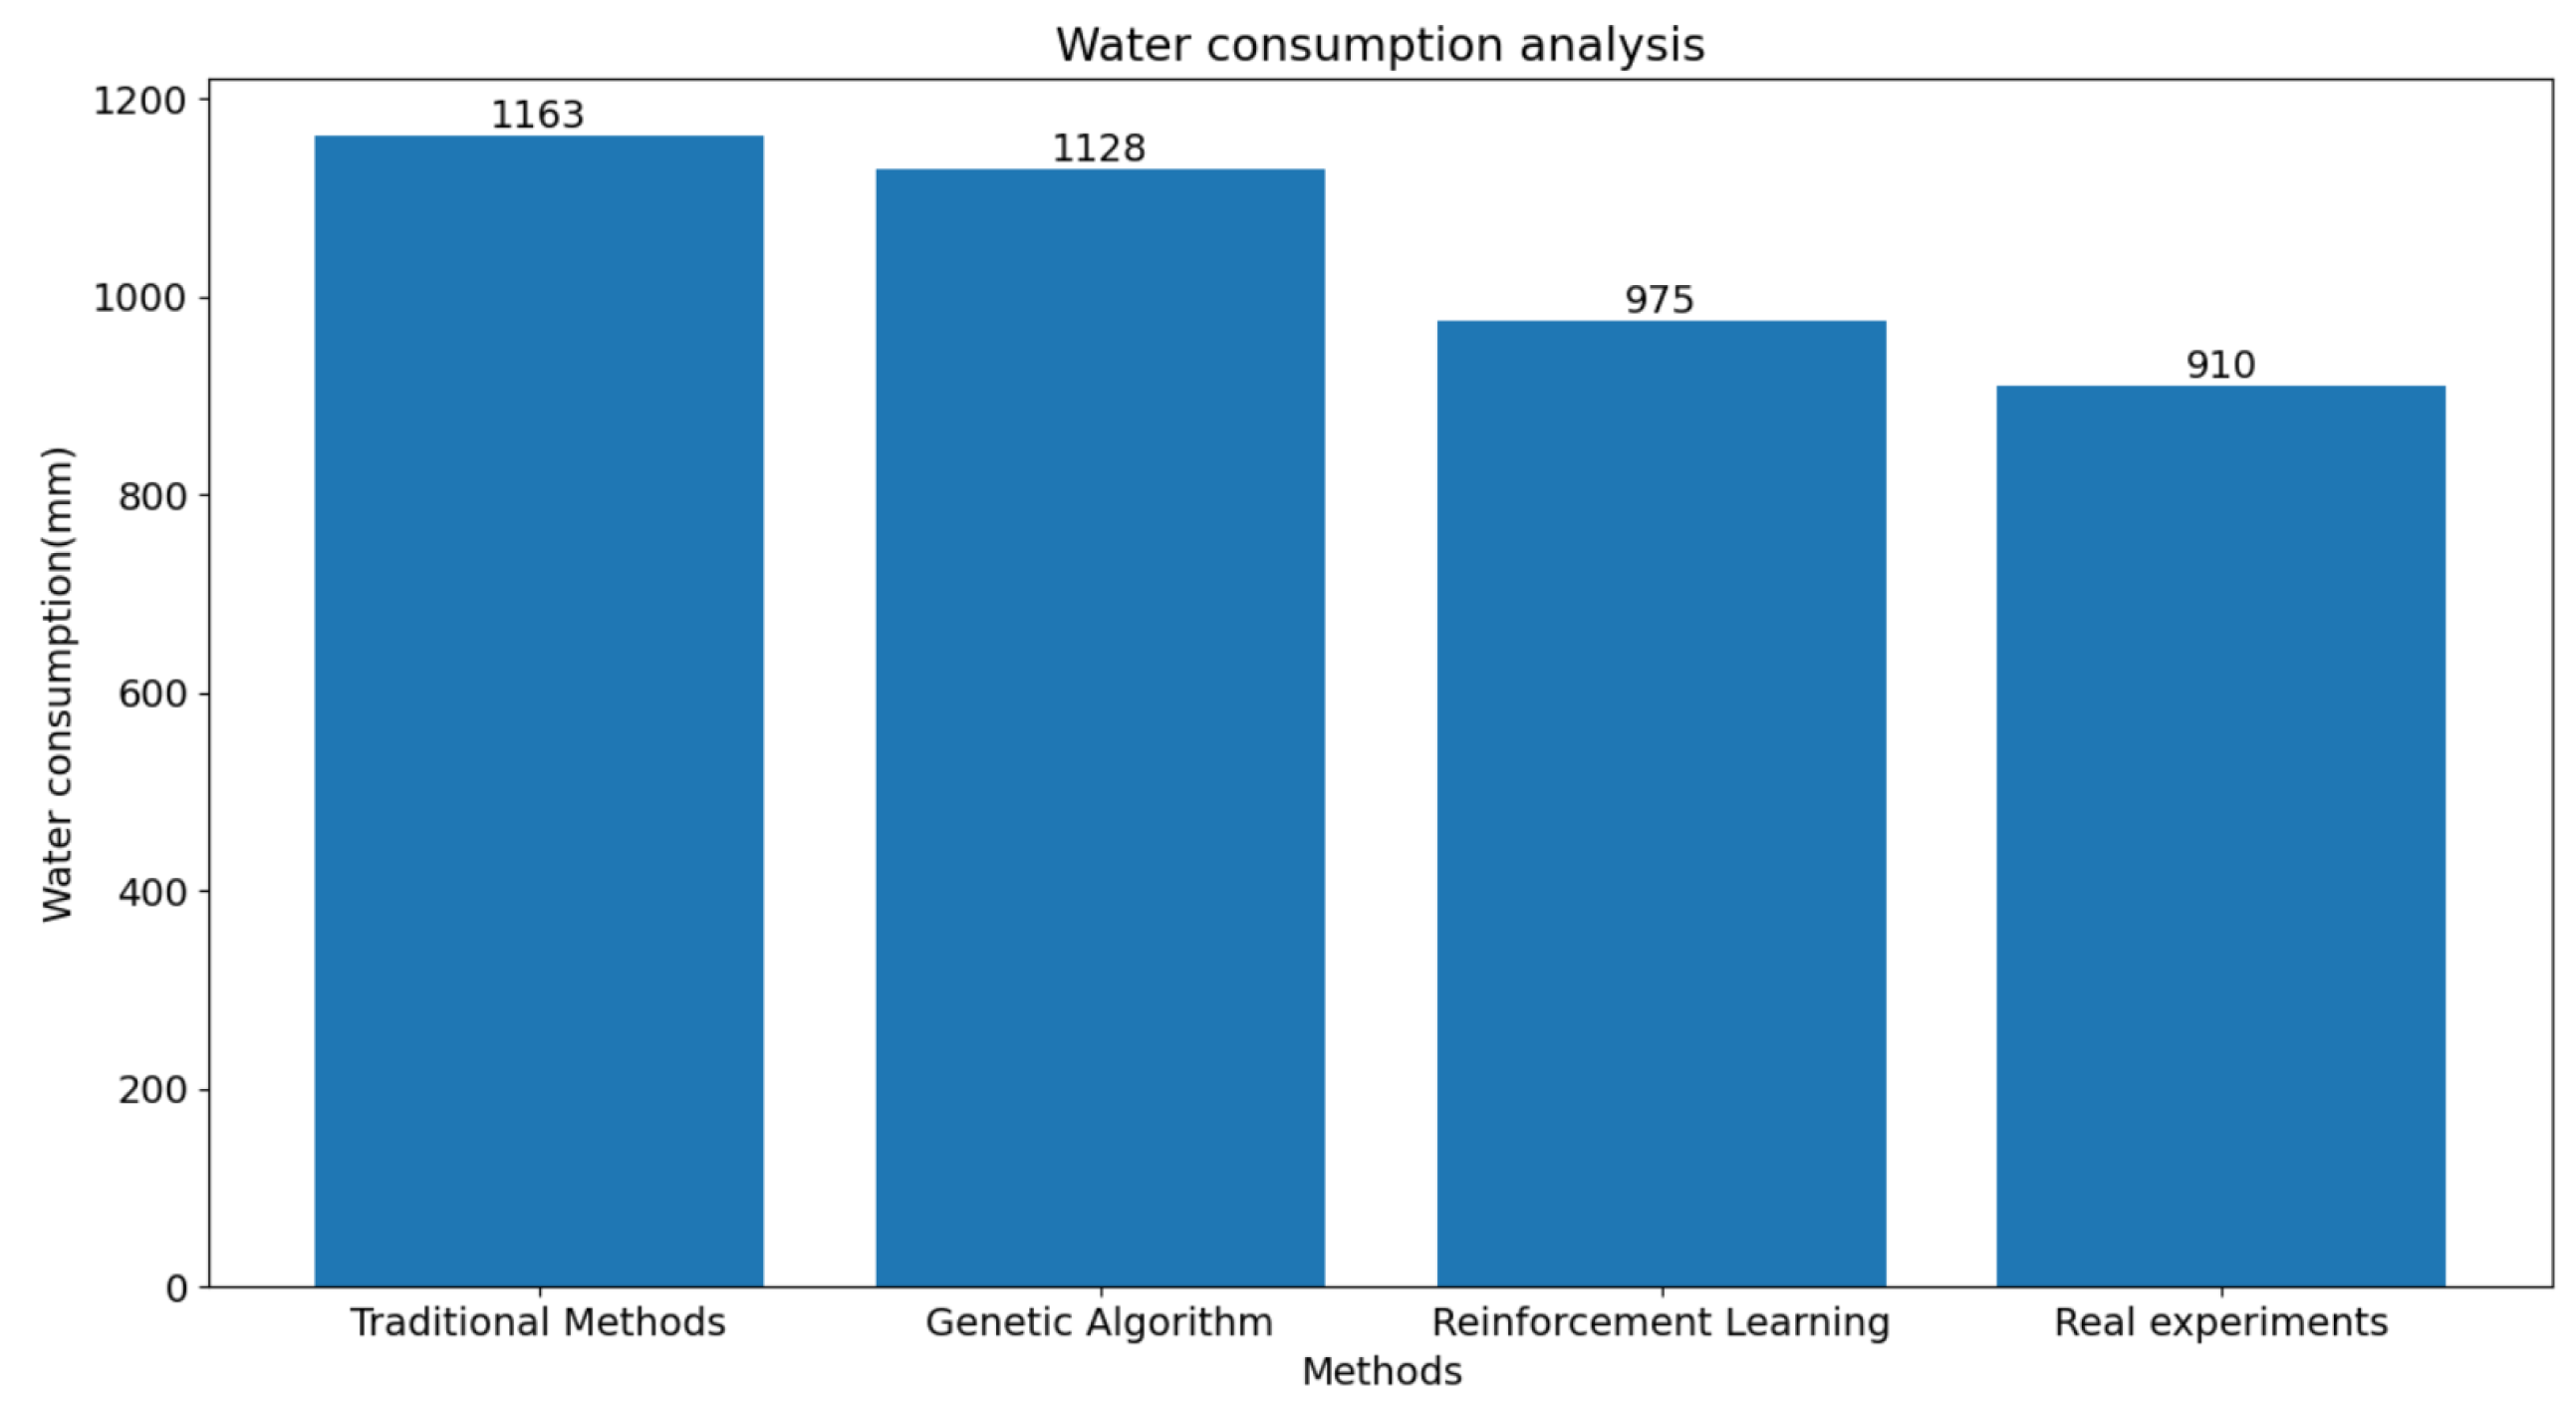
This study compared the experimental results of irrigation experiments conducted in Changji City. We compared the cotton yield and water consumption obtained from the proposed reinforcement learning algorithm with those from genetic algorithms, traditional irrigation strategies, and real experiments in a field. The results are presented in Table 6 and Figure 8 and Figure 9. It is evident from the results that our method effectively improved the cotton yield and reduced the water consumption compared to genetic algorithms. Moreover, it can be concluded from the data in Table 6 that we achieved the best results in terms of water usage per kilogram of cotton yield, which is of great significance for cotton production in the Xinjiang region.
Table 6.
Comparison of irrigation and crop yields for four algorithms.
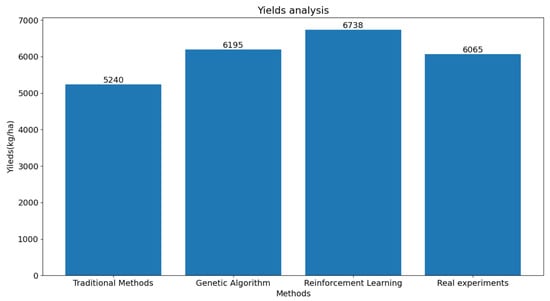
Figure 8.
Yield comparison of the four methods.
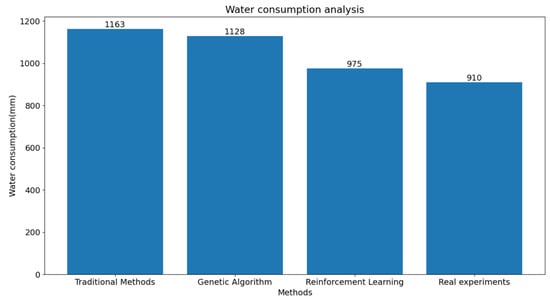
Figure 9.
Comparison of watering amounts for the four methods.
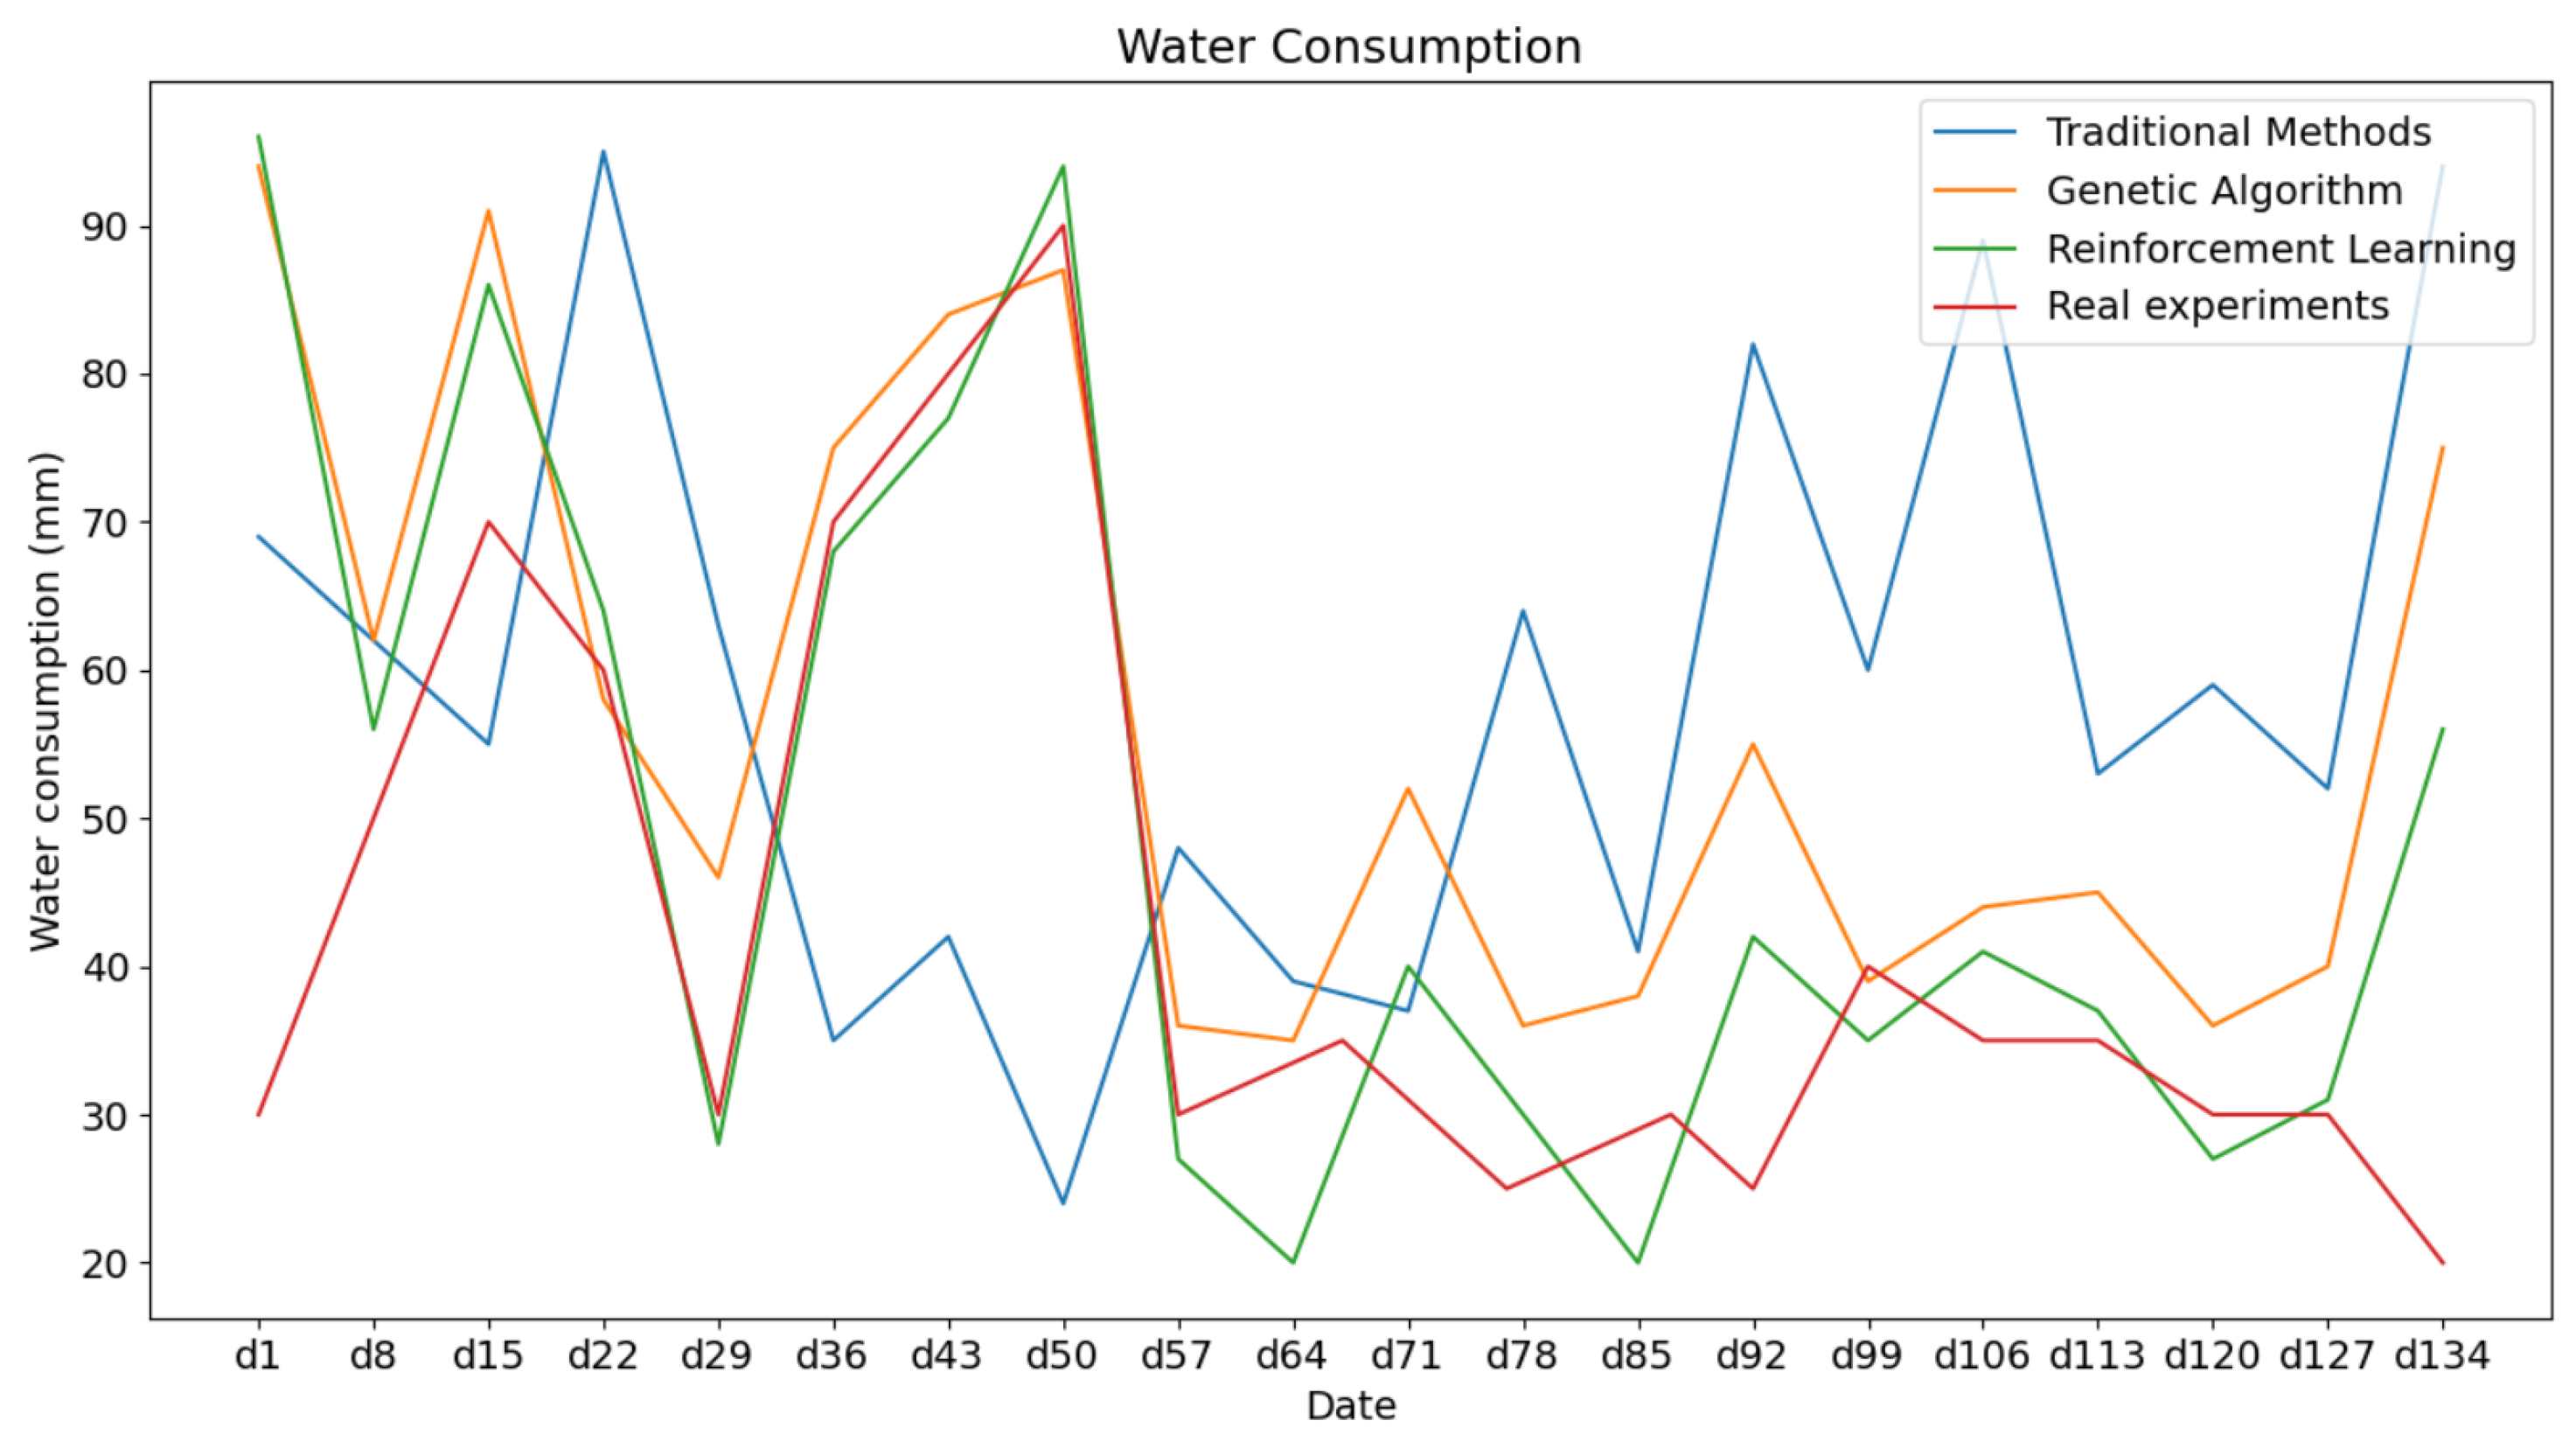
Furthermore, we analyzed the differences in irrigation decision-making and irrigation strategies among the four decision-making approaches (see Figure 10). It can be observed that the four approaches exhibited similar irrigation trends during different stages of cotton growth, including the seedling stage, growth stage, flowering stage, and boll-setting stage. This indicated that, even with the use of reinforcement learning methods for optimization, the water requirements of crops have not changed. In other words, our approach simply makes irrigation decisions more reasonable and adapted to the current soil environment and growth stage of the crops. Moreover, due to the optimization and adjustments made by reinforcement learning based on yield, this means that, at each irrigation time step, the model is able to provide the optimal watering choice for both the current yield and the final production. Such an algorithm helps us achieve higher yields while effectively conserving water resources.
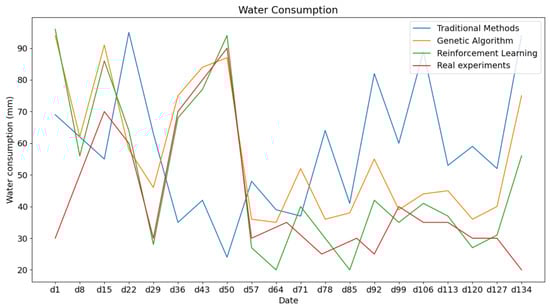
Figure 10.
Comparison of four methods of full-growth cycle irrigation strategies.
4. Discussion
By comparing the proposed reinforcement learning algorithm with other irrigation strategies, we demonstrated the superiority of our approach in terms of both cotton yield and water consumption. The results provided valuable insights for optimizing irrigation practices in the cotton industry, particularly in the Xinjiang region.
In the process of agricultural operations, soil conditions and weather play crucial roles in influencing crop growth and yield. Different crops have varying water requirements at different stages of growth, and traditional irrigation strategies rely on subjective assessments of soil and weather conditions, which can be imprecise. Reinforcement learning, however, has the ability to formulate optimal irrigation strategies based on these specific needs and key data obtained from high-precision sensors, providing more-adaptive decision-making solutions. Moreover, traditional agricultural practices often focus on immediate decisions that favor plant growth, making it challenging to consider future states. By integrating reinforcement learning with the DSSAT software, it becomes possible to make decisions based on current conditions that are conducive to maximizing final yield. Consequently, this approach enables optimal watering while achieving the goal of maximizing yield under current circumstances.
It is noteworthy that the findings presented in this study were derived from the particular circumstances and experimental site situated in Changji City. To ascertain the wider applicability of the proposed methodology across diverse regions and varying environmental contexts, additional research and validation endeavors are imperative. Moreover, the integration of variables like pest management within the decision-making framework has the potential to bolster the efficacy and sustainability of irrigation strategies. A persistent pursuit of investigating and refining these approaches will undoubtedly propel the progress of precision agriculture, fostering the sustainable cultivation of cotton for future generations.
5. Conclusions
This study addressed the challenges faced by cotton cultivation, including water scarcity and the impact of climate change. To tackle these challenges, we propose a precision irrigation model based on reinforcement learning and the crop model DSSAT. By combining the CSM-CROPGRO model within the DSSAT and reinforcement learning algorithms, we developed a decision system aimed at providing precise irrigation strategies to maximize cotton yield.
In Xinjiang region, an important cotton-production area, climate change and water scarcity pose serious threats. This research focused on improving the precision of irrigation strategies in Xinjiang and enhancing the economic benefits of cotton production. To achieve this, we employed reinforcement learning combined with the DSSAT model to select optimal irrigation strategies and optimize cotton yield. The experimental results and analysis of the model demonstrated significant improvements in cotton yield compared to traditional irrigation strategies and genetic algorithms, while also reducing water consumption. Furthermore, an analysis of the irrigation strategies employed by the four decision-making approaches revealed that reinforcement learning, with yield as a critical feedback signal, effectively achieved higher yields.
The proposed approach has room for further development. It can be enhanced by optimizing reinforcement learning algorithms and incorporating deep reinforcement learning methods to better adapt to the climate and water resource characteristics of Xinjiang. Offline reinforcement learning methods can also be explored to expedite decision-making processes. Additionally, the application of this model to the irrigation management of other crops can optimize the entire agricultural production system.
This study presented an innovative approach to addressing management issues in cotton cultivation in Xinjiang and offers new insights into decision support systems in agriculture. With further research and implementation, this model holds the potential to make significant contributions to the sustainability and efficiency of agricultural production.
Author Contributions
Conceptualization, Y.C. and L.H.; methodology, Y.C.; software, Y.C. and Z.H.; validation, Y.C., L.H. and Z.Y.; formal analysis, Y.C. and Z.Y.; investigation, Y.C.; resources, Y.C.; data curation, Y.C.; writing—original draft preparation, Y.C.; writing—review and editing, Y.C. and W.S.; visualization, Y.C.; supervision, Y.C.; project administration, Y.C.; funding acquisition, L.H. All authors have read and agreed to the published version of the manuscript.
Funding
This research was funded by National Key R&D Program of China (2022ZD0115801).
Data Availability Statement
Due to the requirements of the program, we will not disclose our dataset for the time being.
Conflicts of Interest
The authors declare no conflict of interest. The funders had no role in the design of the study; in the collection, analyses, or interpretation of data; in the writing of the manuscript; or in the decision to publish the results.
References
- Yang, Y.; Yang, Y.; Han, S.; Macadam, I.; Liu, D.L. Prediction of cotton yield and water demand under climate change and future adaptation measures. Agric. Water Manag. 2014, 144, 42–53. [Google Scholar] [CrossRef]
- Adhikari, P.; Ale, S.; Bordovsky, J.P.; Thorp, K.R.; Barnes, E.M. Simulating future climate change impacts on seed cotton yield in the Texas High Plains using the CSM-CROPGRO-Cotton model. Agric. Water Manag. 2016, 164, 317–330. [Google Scholar] [CrossRef]
- Chen, X.; Qi, Z.; Gui, D.; Gu, Z.; Ma, L.; Zeng, F.; Li, L. Simulating impacts of climate change on cotton yield and water requirement using RZWQM2. Agric. Water Manag. 2019, 222, 231–241. [Google Scholar] [CrossRef]
- Asmaa, M.; Elpiniki, P.; Konstantinos, K.; Tajjeeddine, R. Exploring Precision Farming Scenarios Using Fuzzy Cognitive Maps. Sustainability 2017, 9, 1241. [Google Scholar]
- Parrazales, R.U.; Álvarez, M.T.Z.; Cruz, K.A.A.; Orozco, R.P.; Muoz, J.L.F. Implementation of a Fuzzy Logic Controller for the Irrigation of Rose Cultivation in Mexico. Agriculture 2021, 11, 576. [Google Scholar] [CrossRef]
- Hunt, M.L.; Blackburn, G.A.; Carrasco, L.; Redhead, J.W.; Rowland, C.S. High resolution wheat yield mapping using Sentinel-2. Remote Sens. Environ. Interdiscip. J. 2019, 233, 111410. [Google Scholar] [CrossRef]
- Thorp, K.R.; DeJonge, K.C.; Kaleita, A.L.; Batchelor, W.D.; Paz, J.O. Methodology for the use of DSSAT models for precision agriculture decision support. Comput. Electron. Agric. 2008, 64, 276–285. [Google Scholar] [CrossRef]
- Jiang, Y.; Xu, X.; Huang, Q.; Huo, Z.; Huang, G. Optimizing regional irrigation water use by integrating a two-level optimization model and an agro-hydrological model. Agric. Water Manag. 2016, 178, 76–88. [Google Scholar] [CrossRef]
- Thorp, K.R.; Hunsaker, D.J.; Bronson, K.F.; Pedro, A.S.; Barnes, E.M. Cotton Irrigation Scheduling Using a Crop Growth Model and FAO-56 Methods: Field and Simulation Studies. Trans. ASABE 2017, 60, 2023–2039. [Google Scholar] [CrossRef]
- Kisekka, I.; Aguilar, J.P.; Rogers, D.H.; Holman, J.; O’Brien, D.M.; Klocke, N. Assessing deficit irrigation strategies for corn using simulation. Trans. ASAE Am. Soc. Agric. Eng. 2016, 59, 303–317. [Google Scholar]
- Pandian, P.S.; Parthiban, R.M.; Giri, S.S. Automation in Agriculture: An Innovative Approach. Int. J. Eng. Res. Technol. 2015, 4, 133–136. [Google Scholar]
- Zhang, X.; Wang, H.; Wang, B.; Wang, L.; Zhang, Q.; Zhang, X.; Zhang, W.; Zhang, L.; Zhang, Y.; Zhang, J.; et al. Agricultural drought over water-scarce Central Asia aggravated by internal climate variability. Nat. Geosci. 2021, 14, 737–742. [Google Scholar]
- Zhang, Y.; Li, Y.; Chen, S.; Han, X. An intelligent irrigation system based on wireless sensor networks and cloud computing. IEEE Access 2020, 8, 14880–14888. [Google Scholar]
- Zeng, Z.; Chen, J.; Gong, D. An intelligent irrigation system based on IoT and deep learning for agricultural sustainability. Sustainability 2019, 11, 624. [Google Scholar]
- Fang, Q.; Ma, L.; Green, T.R. Impacts of climate change on irrigation water requirements in the Columbia River Basin. J. Am. Water Resour. Assoc. 2013, 49, 1054–1071. [Google Scholar]
- Ko, J. Using EPIC Simulation Model to Manage Irrigated Crops. In Proceedings of the ASA-CSSA-SSA 2007 International Annual Meetings, New Orleans, LA, USA, 4–8 November 2007. [Google Scholar]
- Mccarthy, A.C.; Hancock, N.H.; Raine, S.R. Simulation of irrigation control strategies for cotton using Model Predictive Control within the VARIwise simulation framework. Comput. Electron. Agric. 2014, 101, 135–147. [Google Scholar] [CrossRef]
- Modala, N.R.; Ale, S.; Rajan, N.; Munster, C.; Barnes, E. Evaluation of the CSM-CROPGRO-Cotton model for the Texas rolling plains region and simulation of deficit irrigation strategies for increasing water use efficiency. Trans. ASABE 2015, 58, 685–696. [Google Scholar]
- Liu, C.; Qi, Z.; Gu, Z.; Gui, D.; Zeng, F. Optimizing Irrigation Rates for Cotton Production in an Extremely Arid Area Using RZWQM2-Simulated Water Stress. Trans. ASABE 2017, 60, 2041–2052. [Google Scholar] [CrossRef]
- Dejonge, K.C.; Thorp, K.R. Implementing Standardized Reference Evapotranspiration and Dual Crop Coefficient Approach in the DSSAT Cropping System Model. Trans. ASABE 2017, 60, 1965–1981. [Google Scholar] [CrossRef]
- Himanshu, S.K.; Ale, S.; Bordovsky, J.; Darapuneni, M. Evaluation of crop-growth-stage-based deficit irrigation strategies for cotton production in the Southern High Plains. Agric. Water Manag. 2019, 225, 105782. [Google Scholar] [CrossRef]
- Kothari, K.; Ale, S.; Bordovsky, J.P.; Thorp, K.R.; Porter, D.O.; Munster, C.L. Simulation of efficient irrigation management strategies for grain sorghum production over different climate variability classes. Agric. Syst. 2019, 170, 49–62. [Google Scholar] [CrossRef]
- Kothari, K.; Ale, S.; Bordovsky, J.; Munster, C.; Singh, V.; Nielsen-Gammon, J.; Hoogenboom, G. Potential genotype-based climate change adaptation strategies for sustaining cotton production in the Texas High Plains: A simulation study. Field Crops Res. 2021, 271, 108261. [Google Scholar] [CrossRef]
- Quah, K.H.; Quek, C.; Leedham, G. Reinforcement learning combined with a fuzzy adaptive learning control network (FALCON-R) for pattern classification. Pattern Recognit. 2005, 38, 513–526. [Google Scholar] [CrossRef]
- Ramesh, S.; Kannan, S.; Baskar, S. Application of Modified NSGA-II Algorithm to Multi-Objective Reactive Power Planning; Elsevier Science Publishers B.V.: Amsterdam, The Netherlands, 2012. [Google Scholar]
- Khalili-Damghani, K.; Tavana, M.; Sadi-Nezhad, S. An integrated multi-objective framework for solving multi-period project selection problems. Appl. Math. Comput. 2012, 219, 3122–3138. [Google Scholar] [CrossRef]
- Yicong, G.; Yixiong, F.; Qirui, W.; Hao, Z.; Jianrong, T. Multiobjective Decision Making: Theory and Methodology; Courier Dover Publications: Mineola, NY, USA, 2008; pp. 712–725. [Google Scholar]
- Wheeler, J.; Paez, M.A.; Guillen-Gosalbez, G.; Mele, F.D. Combining multi-attribute decision-making methods with multi-objective optimization in the design of biomass supply chains. Comput. Chem. Eng. Int. J. Comput. Appl. Chem. Eng. 2018, 113, 11–31. [Google Scholar] [CrossRef]
- Zhang, G.; Li, Z. A hybrid multi-objective optimization approach for energy-absorbing structures in train collisions. Inf. Sci. Int. J. 2019, 481, 491–506. [Google Scholar] [CrossRef]
- Piasecki, M.; Kostyrko, K. Development of Weighting Scheme for Indoor Air Quality Model Using A Multi-Attribute Decision Making Method. Energies 2020, 13, 3120. [Google Scholar]
- Yu, Y.; Tang, J.; Huang, J.; Zhang, X.; So, D.K.C.; Wong, K.K. Multi-Objective Optimization for UAV-Assisted Wireless Powered IoT Networks Based on Extended DDPG Algorithm. IEEE Trans. Commun. 2021, 69, 6361–6374. [Google Scholar] [CrossRef]
- Xu, W.; Meisalhi, S. Dynamic emergency route planning for major chemical accidents: Models and application. Saf. Sci. 2021, 135, 73–103. [Google Scholar] [CrossRef]
- Saad, O.M.; Biltagy, M.S.; Farag, T.B. An algorithm for multi objective integer nonlinear fractional programming problem under fuzziness. Gen. Math. Notes 2011, 1, 207–220. [Google Scholar]
- Jones, J.; Hoogenboom, G.; Porter, C.; Boote, K.; Batchelor, W.; Hunt, L.; Wilkens, P.; Singh, U.; Gijsman, A.; Ritchie, J. The DSSAT cropping system model. Eur. J. Agron. 2003, 18, 235–265. [Google Scholar] [CrossRef]
- Hoogenboom, G.; Porter, C.H.; Boote, K.J.; Shelia, V.; Jones, J.W. The DSSAT crop modeling ecosystem. In Advances in Crop Modelling for a Sustainable Agriculture; Burleigh Dodds Science Publishing: Sawston, UK, 2019. [Google Scholar]
- Sarkar, R. Decision Support Systems for Agrotechnology Transfer; Springer: Amsterdam, The Netherlands, 2012. [Google Scholar]
- Adhikari, P.; Gowda, P.H.; Marek, G.W.; Brauer, D.K.; Kisekka, I.; Northup, B.; Rocateli, A. Calibration and Validation of CSM-CROPGRO-Cotton Model Using Lysimeter Data in the Texas High Plains. J. Contemp. Water Res. Educ. 2017, 162, 61–78. [Google Scholar] [CrossRef]


Disclaimer/Publisher’s Note: The statements, opinions and data contained in all publications are solely those of the individual author(s) and contributor(s) and not of MDPI and/or the editor(s). MDPI and/or the editor(s) disclaim responsibility for any injury to people or property resulting from any ideas, methods, instructions or products referred to in the content. |
© 2023 by the authors. Licensee MDPI, Basel, Switzerland. This article is an open access article distributed under the terms and conditions of the Creative Commons Attribution (CC BY) license (https://creativecommons.org/licenses/by/4.0/).