Article

Comparative Study on the Effects of Different Soil Improvement Methods in Blueberry Soil

1
College of Horticulture, Jilin Agricultural University, Changchun 130118, China
2
College of Resources and Environment, Jilin Agricultural University, Changchun 130118, China
3
Key Laboratory of Soil Resource Sustainable Utilization for Jilin Province Commodity Grain Bases, Changchun 130118, China
4
College of Soil Tillage Institute, Baicheng Academy of Agricultural Sciences, Baicheng 137099, China
*
Author to whom correspondence should be addressed.
These authors contributed equally to this work.
Agronomy 2024, 14(1), 125; https://doi.org/10.3390/agronomy14010125
Submission received: 21 November 2023 / Revised: 22 December 2023 / Accepted: 29 December 2023 / Published: 3 January 2024
(This article belongs to the Section Horticultural and Floricultural Crops)

Abstract

:
Soil improvement methods can result in changes in the microbial community in blueberry soil. Bacterial communities play an important role in soil fertilizer and plant nutrient acquisition. In this study, the response of microbial community composition, microbial function, and the nitrogen (N) cycle to different improvement methods was analyzed using high-throughput sequencing to investigate the best soil improvement method from a microbial perspective. The results showed that the highest microbial diversity was observed in the treatment involving peat combined with mushroom bran (T2), followed by the peat combined with acidified rice husk (T2) both in the rhizosphere and roots. The dominant phyla were Proteobacteria and Actinobacteria both in the blueberry rhizosphere soil and roots. Interestingly, Acidobacterium and Paludibaculum, belonging to the Acidobacteria phylum, exhibited the most significant influence and were most predominant in the T2 treatment rhizosphere soil. The T2 treatment promoted the growth of N fixation functional bacteria both in the rhizosphere soil and roots. At the module level, the T2 treatment enhanced N fixation and suppressed the assimilatory and dissimilatory nitrate reduction reactions, denitrification, and nitrification in the blueberry rhizosphere. Additionally, the T2 treatment increased the abundance of root endophytic microbes involved in N fixation. Overall, our findings suggest that the addition of peat combined with acidified rice husk is the optimal soil improvement method for blueberry cultivation.

1. Introduction

Blueberries (Vaccinium corymbosum) of the family Ericaceae, known as the “king of berries”, have rich nutritional value and medical care functions [1,2,3]. Blueberries were introduced to China in 1989 [4] and experienced rapid growth in both planting area and yield [5]. However, blueberry cultivation faces various challenges due to its strict requirements for soil conditions [6]. Therefore, studying soil improvement methods for blueberry cultivation is crucial for enhancing yield and quality and promoting the development of the blueberry industry.
Blueberries require high soil organic matter to support their normal growth and development. Additionally, maintaining a suitable pH level in the soil, typically between 4.5 and 5.5, is essential for blueberry growth [7]. However, most of the soil environment in China does not meet these conditions [8]. To address these issues, many researchers have conducted extensive studies on soil improvement technologies aimed at enhancing soil’s physical and chemical properties, microbial environment, fertility, and water retention capacity [5,9,10,11,12]. Currently, the common soil improvement materials include sulfur, peat, rice husk (straw), and mushroom bran [13,14]. A previous study has shown that acidic fertilizers such as aluminum sulfate, sulfur powder, and ferrous sulfate are commonly used to reduce soil pH, with sulfur powder being the most stable and long-lasting option [15]. However, the long-term application of sulfur decreases the number of soil microorganisms [16]. Peat, containing a large amount of organic matter, provides nutrients for blueberry growth [17]. In blueberry cultivation, it can also improve the soil aggregate structure and make the soil loose, and has strong water and nitrogen absorption, thus promoting the growth and development of blueberry plants [18]. In addition, peat contains a lot of organic acids that can reduce soil pH levels [19]. Rice husk powder, rich in carbohydrates, can be metabolized by microorganisms under specific conditions, converting them into organic acid [20]. Mushroom bran, abundant in organic matter and acidic substances such as lactic acid and acetic acid, can reduce the soil pH value after decomposition [21]. Previous studies have concluded that mushroom bran significantly enhances plant growth and dry matter accumulation and production [22,23]. However, the long-term application of mushroom bran may lead to nutrient deficiency in the soil. At present, research comparing different soil improvement methods is lacking, and the optimal method for blueberry growth has not been identified.
Bacterial communities play an important role in soil health and plant nutrient acquisition [24]. The structure and biodiversity of bacterial populations can largely reflect the status of and changes in soil fertility [25]. Particularly, the interaction between microorganisms and blueberries is vital for the growth of blueberry plants, especially in rhizosphere soil where microbial diversity is higher compared to other soil regions [26]. On one hand, microorganisms can promote the growth of blueberries by improving soil structure and soil fertility; on the other hand, blueberries also provide a habitat and nutrients for microorganisms, establishing a mutually beneficial and symbiotic relationship [5,26,27]. Furthermore, endophytes are microorganisms, primarily fungi, and bacteria that exist within the tissues of plants in a symbiotic relationship. These endophytes reside within plants’ intercellular spaces, vascular systems, or within the cells themselves, and manage to coexist with their host plants without causing any harm. These endophytes can enhance mineral absorption and provide metabolites, such as the hormones necessary for plant growth, thus improving the stress resistance of plants [28,29]. Previous studies have shown that Proteobacteria, Acidobacteria, and Bacteroidetes are the dominant bacterial phyla in blueberry soil, and soil organic matter affects the composition of soil microbial communities and promotes the production of amino acid metabolites in blueberry soil [30]. In recent years, extensive research has been conducted on the plant growth-promoting rhizobacteria (PGPR), a diverse group of bacteria found in soil, renowned for their multifaceted roles in enhancing plant growth, improving nutrient uptake, and conferring resistance to various biotic and abiotic stresses [31,32]. A lot of studies have concluded that PGPR influence various plant hormones such as 3-acetic acid (IAA), gibberellins, cytokinins, and abscisic acid [33,34]. In addition, several bacteria involved in the N cycle, including Magnetospirillum, Herbaspirillum, Burkholderia, Azospira, Rhodopseudomonas, Bradyrhizobium, Pseudomonas, Azospirillum, Klebsiella, Pantoea, Rhizobium, Sphingomonas, and Ottowia, have been identified [35,36,37,38]. Therefore, it is of great significance to study and understand the influence mechanism of microorganisms on blueberry growth.
However, there are few reports on the changes in the blueberry plant rhizosphere soil community environment after soil improvement, especially on the effect of changes in rhizosphere and endophytic bacterial community diversity and metabolism function. Hence, the response of microbial community composition, microbial function, and the N cycle (including the functional bacteria and N cycle at the module level) was analyzed herein by using high-throughput sequencing. The aims were as follows: (i) to explore the effects of different soil improvement methods on bacterial community composition, structure, and function; (ii) to explore the response of the N cycle to different soil improvement methods; (iii) to investigate the best soil improvement method from a microbial perspective. Through meticulous microbial research, a deeper comprehension of the mechanisms underpinning soil amelioration at the micro level can be attained. Such insights are pivotal for the advancement of more sophisticated and efficacious soil improvement techniques.

2. Materials and Methods

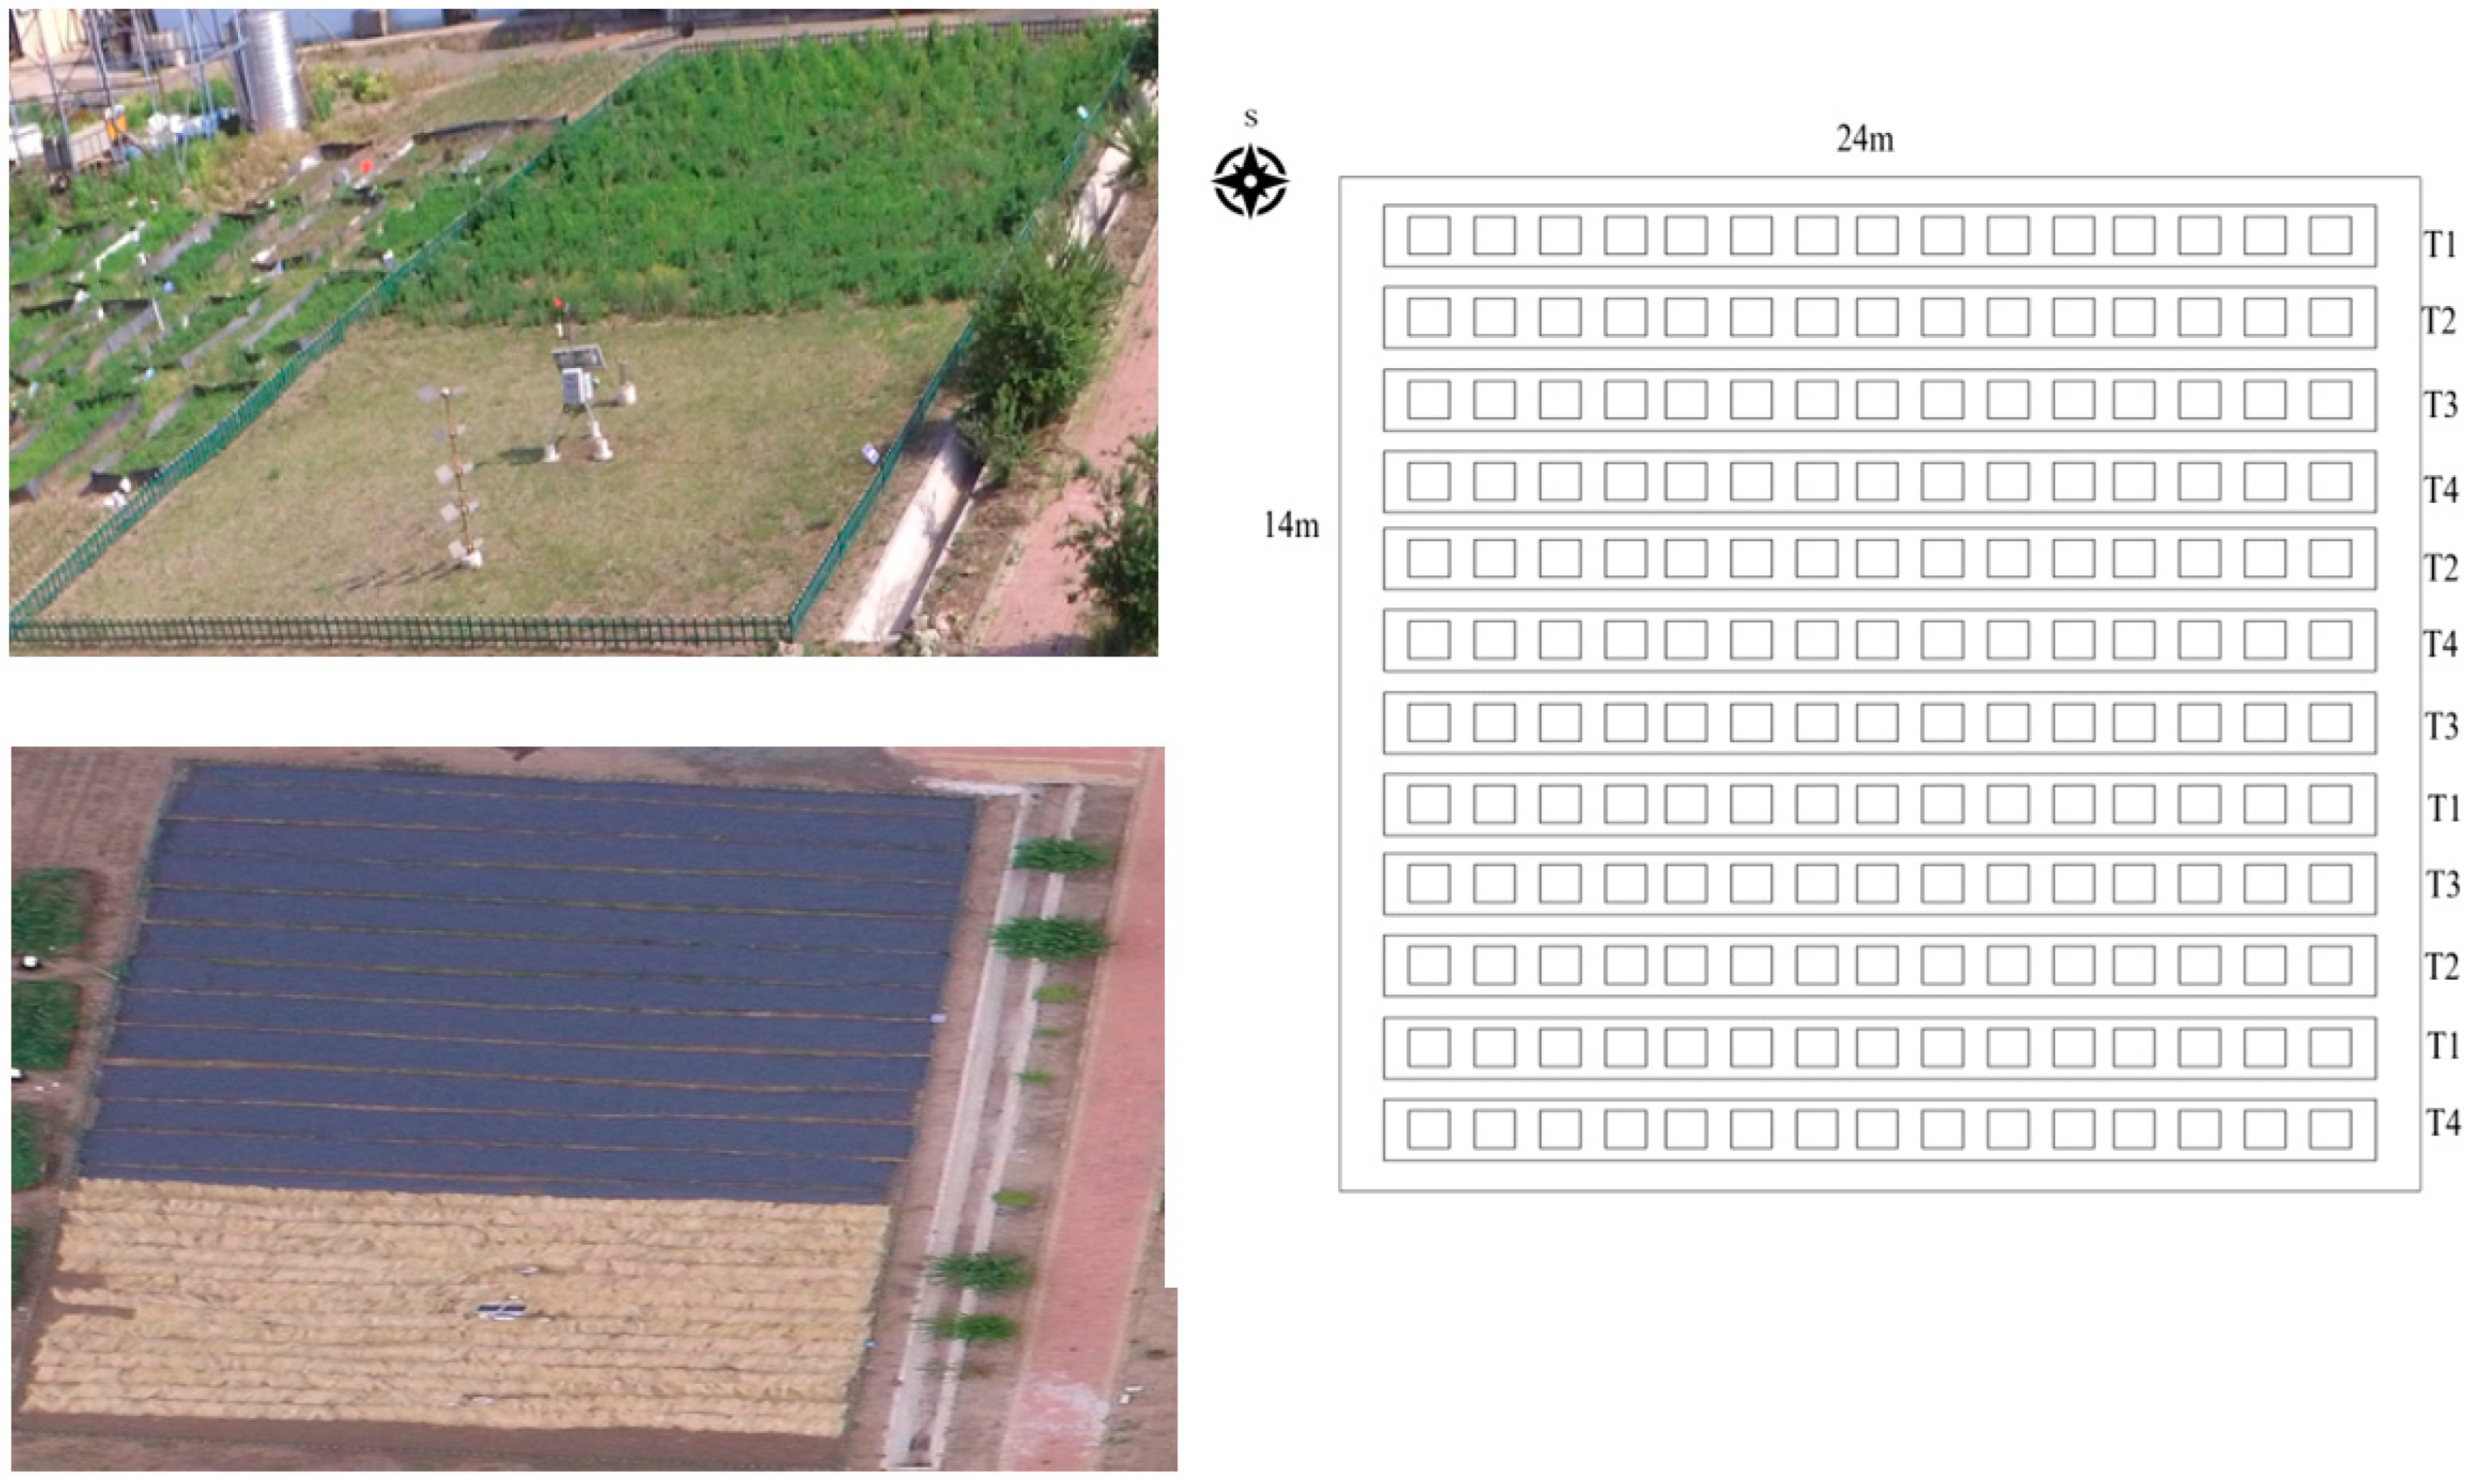
2.1. Experimental Design

Samples were collected from the soil and water conservation experimental field of Jilin Agricultural University in June 2022, located in Changchun City, Jilin Province (E 125°24′55″, N 43°48′34″). The average annual temperature was 4.8 °C, with an accumulated temperature of 2880 °C ≥ 10 °C; the frost-free period was 140–155 days; and the annual average rainfall was 579 mm. The majority of the rainfall occurred from June to September each year, accounting for about 70% of the annual precipitation. The area of the experimental plot was 336 m2, and the soil type of the experimental plot was meadow black soil. The plot soil pH was 6.3, and the content of soil organic matter (SOM) was 2.81%. The experiment started in June 2021, and the cultivation object was a 2-year-old semi-high bush blueberry (Vaccinium corymbosum L. variety ‘Northland’). Four treatments, including peat combined with sulfur (T1), peat combined with acidified rice husk (T2), mushroom bran (T3), and peat combined with mushroom bran (T4), were implemented with three replicates per treatment on a total of 12 plots, and these amendments were incorporated into the soil two weeks before the planting of blueberries. The dosages of materials used for each treatment are reported in Table A1. The row spacing was 1.5 m × 2.0 m, the planting holes measured 35 cm × 35 cm × 40 cm, and the experiment plot area was 336 m2. A field plot photograph is shown in Figure A1. The rhizosphere soil (0–40 cm) was collected in polyethylene bags by shaking the roots until the non-adhering soil fell off. Roots, separated from the soil, were superficially disinfected using 70% alcohol for 1 min, and then, with sodium hypochlorite 3% for 1.30 min, and finally, rinsed with sterile distilled water. Soil pH was measured by a pH meter, SOM was determined by a TOC analyzer, Total N (TN) was measured using the Kjeldahl method, and available phosphorus (AP) and available potassium (AK) were measured using the 0.5 mol/L NaHCO3 method and NH4CO3 method, respectively [39]. The soil properties following the implementation of soil improvement measures are presented in Table A2. The content of SOM significantly increased after soil improvement, while the soil pH showed a significant decrease under the T1 and T2 treatments, with no significant reduction in the T3 and T4 treatments.

2.2. Sequencing

Total genomic DNA was isolated from 0.25 g of rhizosphere soil and 5 g of root samples using a PowerSoil® DNA Isolation kit (allwegene Technology Company, Beijing, China) according to the manufacturer’s instructions. The bacterial community was analyzed using 16S rDNA amplicon sequencing. The V3–V4 region of the 16S rDNA gene was targeted for sequencing. Overlapping paired reads from paired-end sequencing were merged into a single sequence using Pandaseq Software (2.0). Sequences with low quality (containing an ambiguous base ‘N’ > 3, and an average base quality score < 20) were filtered out. Finally, the length of the reads ranged from 220 to 500 bp.

2.3. Data Analysis

An analysis of variance (ANOVA) was used to analyze the differences among means, followed by a least significant different (LSD) test. Spearman’s test method was used to perform correlation network analysis on the top 20 genera based on the absolute abundance of all samples. p-values greater than 0.05 and correlation values less than 0.6 were excluded from the analysis. The similarities and differences in bacterial community composition between berry rhizosphere and roots among the four soil improvement methods were described using a tree branch structure. PICUSt (Phylogenetic Investigation of Communities by Reconstruction of Unobserved States 2.0) software was used to predict the function of 16s high-throughput sequencing data, and information from the KEGG database was compared to obtain the N cycle at the module level.

3. Results

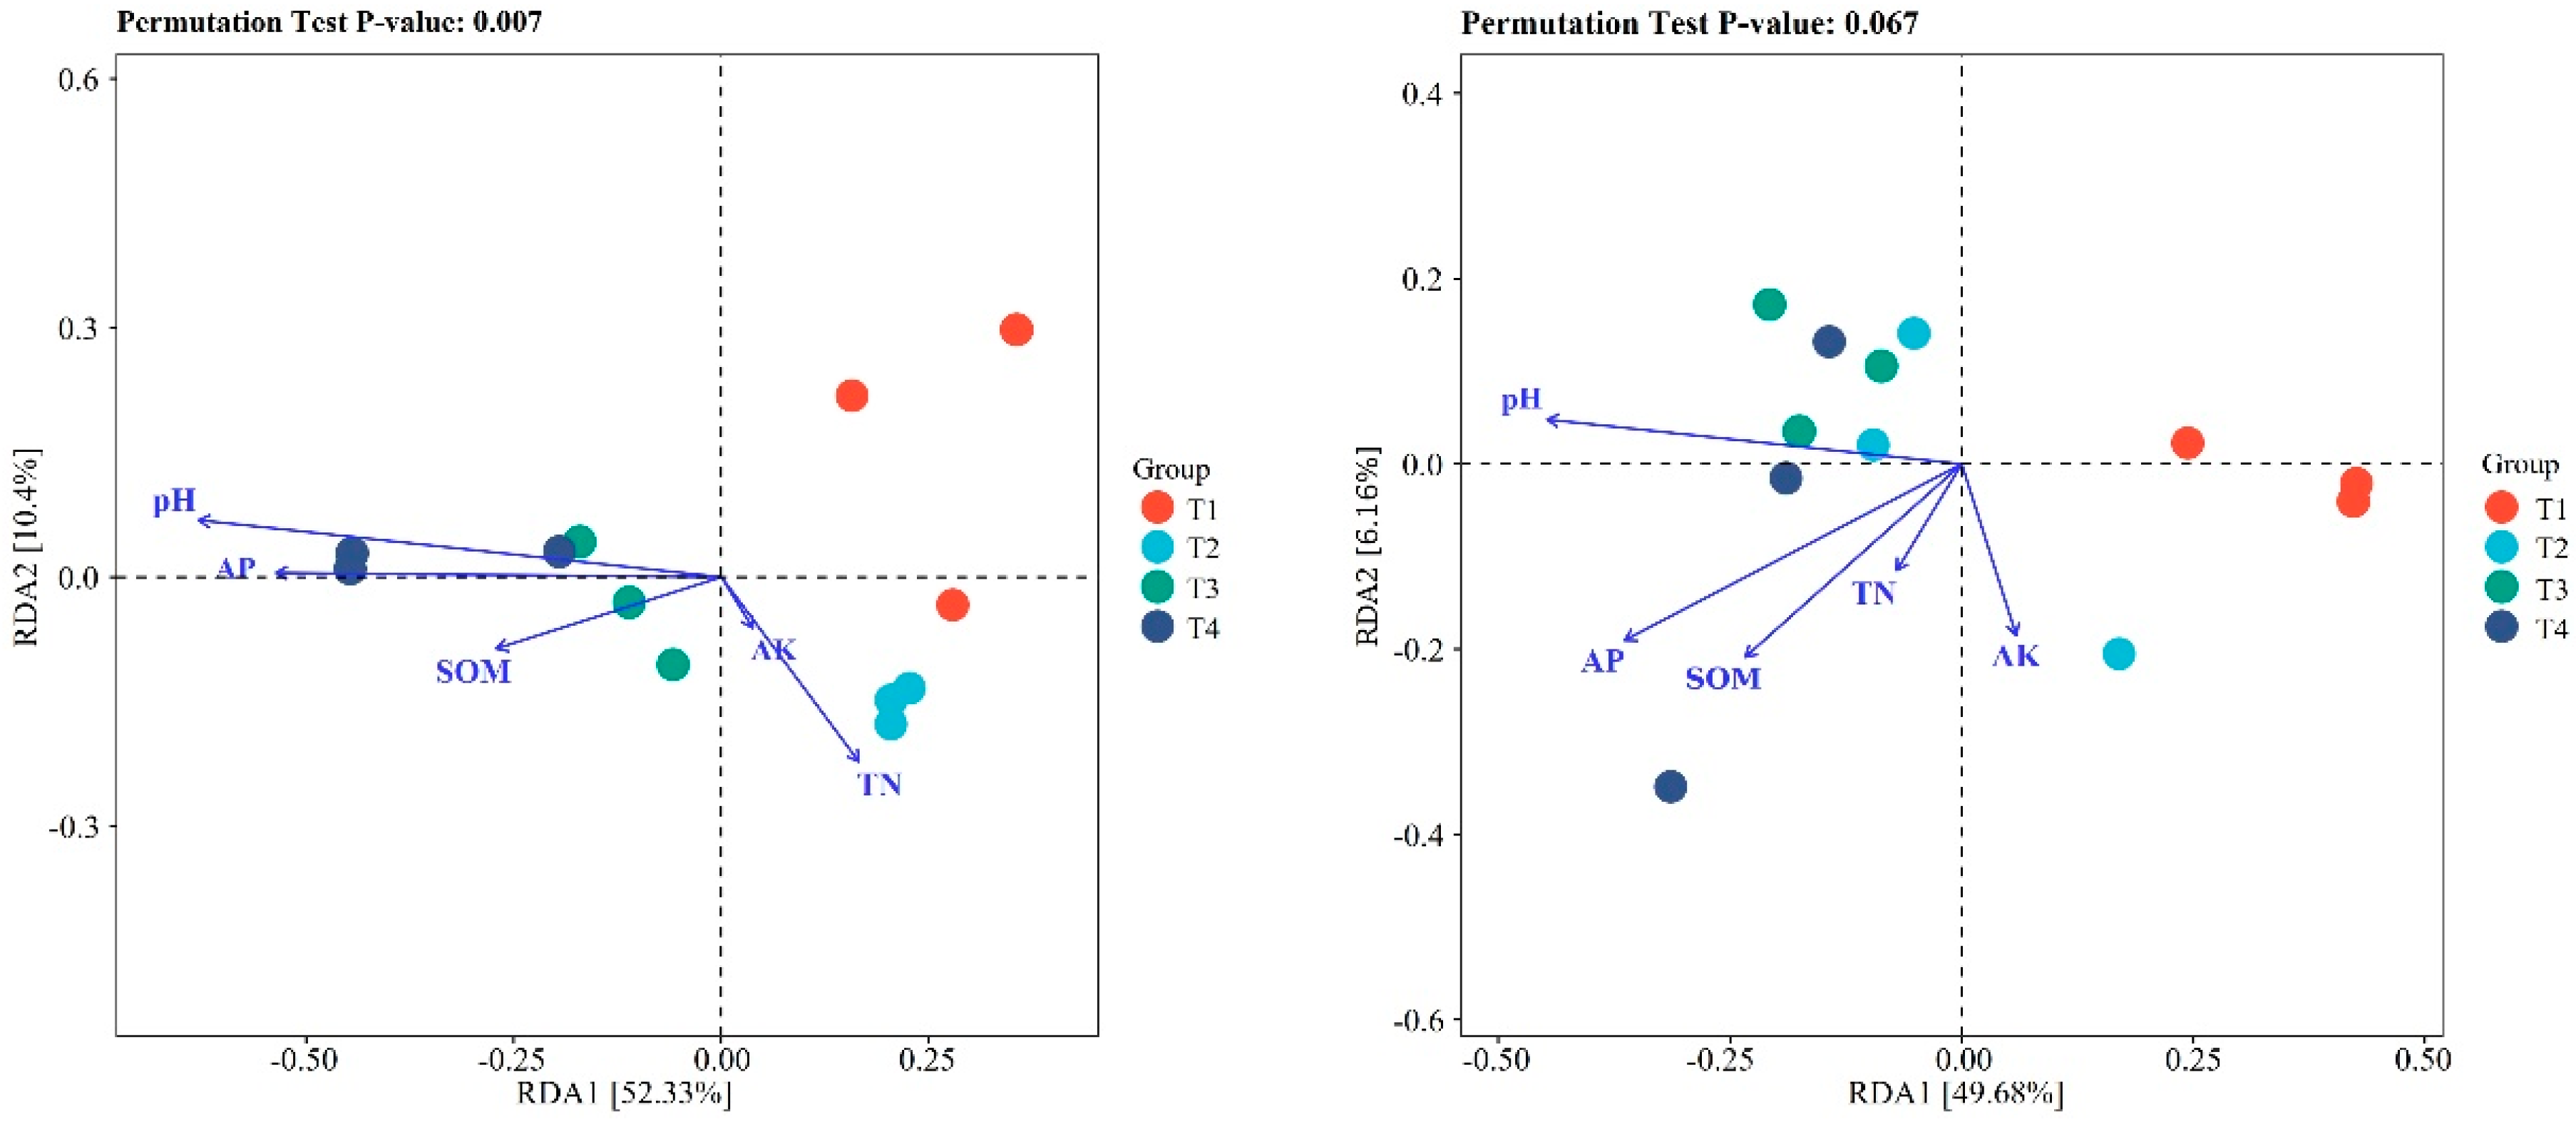
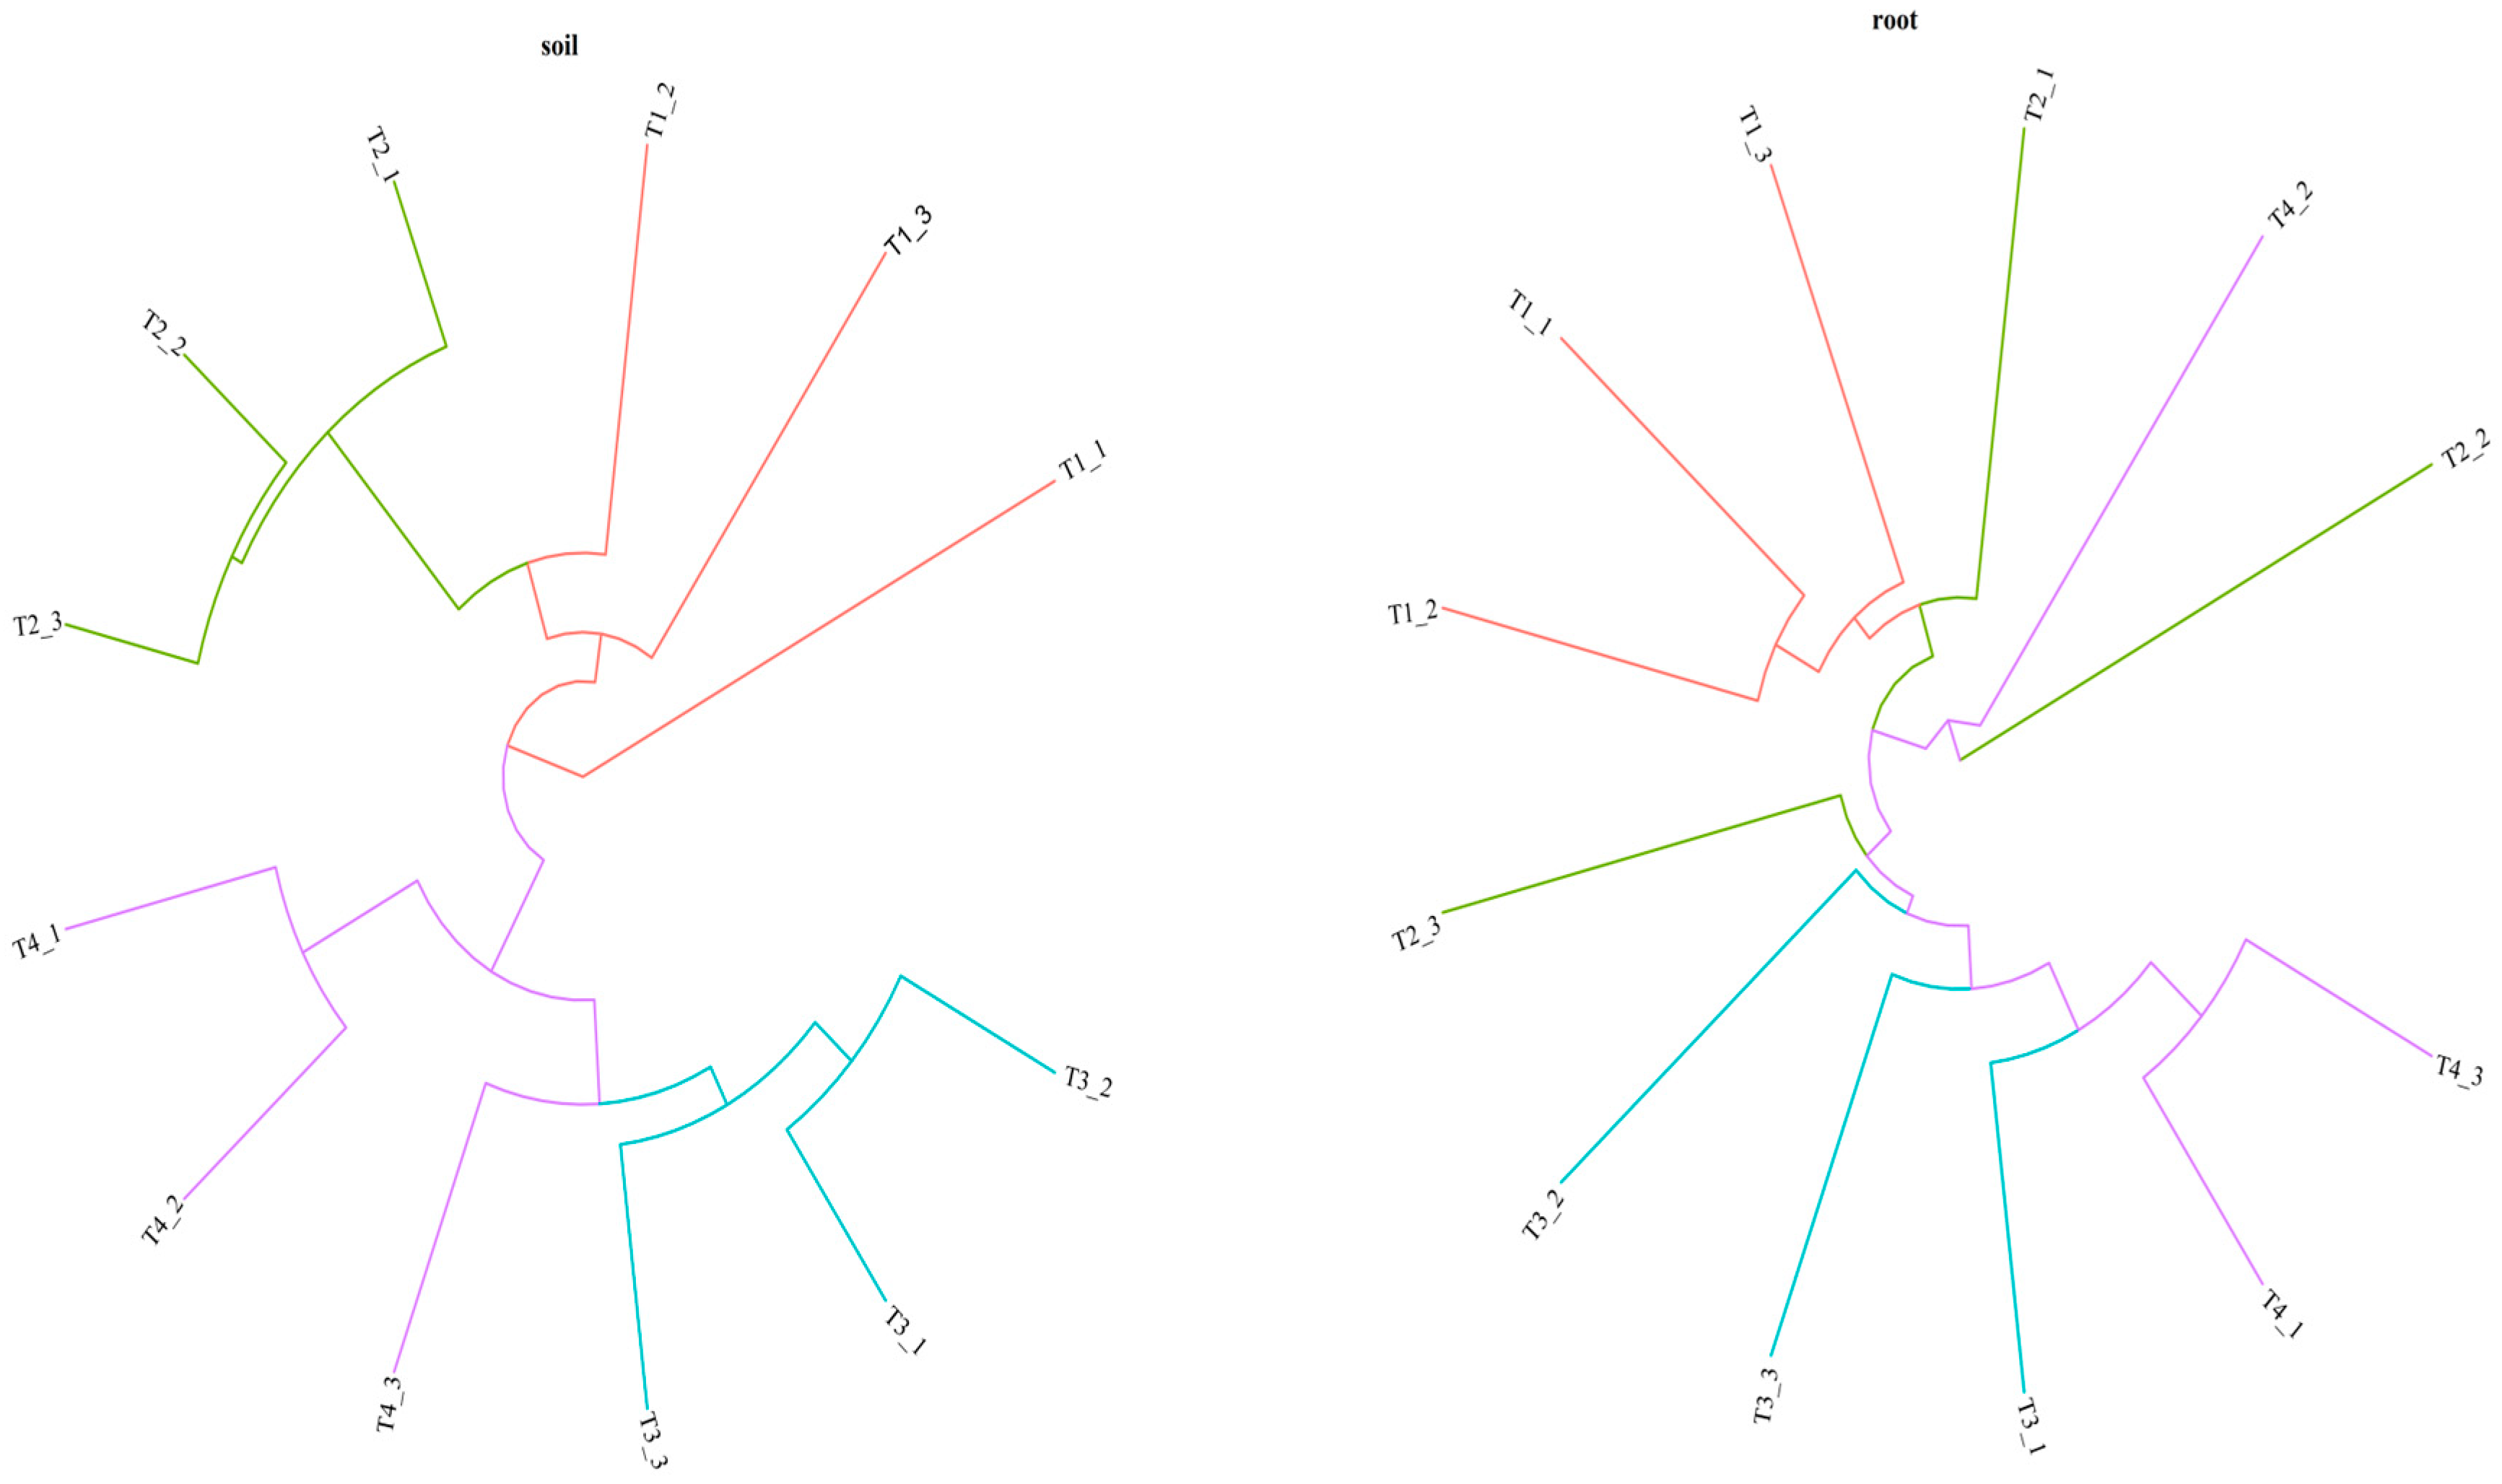
3.1. Bacterial Community Diversity and Composition

In total, 78,225 and 8767 operational taxonomic units (OTUs) were obtained from the berry rhizosphere soil and roots after 16s rDNA high-throughput sequencing. Regardless of whether they were in the berry rhizosphere soil or roots, the highest number of OTUs was found in the T4 treatment, followed by the T2 treatment. In addition, the alpha diversity of the soil bacterial community was analyzed. The results revealed that the Chao 1 index and PD whole tree were highest in the T4 treatment, followed by the T2 treatment. These findings were consistent with the results obtained from the analysis of the root samples. On the other hand, the Shannon and Simpson indices were the lowest in the T1 treatment in the blueberry rhizosphere soil, but there was no significant difference among the blueberry root samples (Table 1).
In terms of phyla, a total of 36 were identified in the berry rhizosphere soil. The dominant phylum was Proteobacteria (36.02–45.38%), followed by Actinobacteria (13.01–29.42%) and Acidobacteria (11.84–21.29%). Notably, significant changes were observed in the abundance of Proteobacteria, Actinobacteria, Acidobacteria, Chloroflexi, and Nitrospirae under the four soil improvement methods. The relative abundance of Proteobacteria and Chloroflexi was higher in the T4 treatment compared to the other treatments, while the lowest abundance of Actinobacteria was found in the T4 treatment. Additionally, the T1 treatment increased the relative abundance of Actinobacteria, but decreased Acidobacteria and Nitrospirae. Furthermore, the T2 treatment resulted in an increase in the abundance of Acidobacteria and Elusimicrobia. In terms of blueberry root sample, a total of 29 phyla were identified. The dominant phylum was Proteobacteria, with the highest relative abundance observed in the T1 treatment (95.06%). This was followed by Actinobacteria (2.96–14.04%), which showed the highest relative abundance in the T1 treatment. No significant changes were observed among the relative abundance of other phyla under the four treatments (Figure 1).
The dominant genus in the blueberry rhizosphere soil varied under the four soil improvement methods. The highest relative abundances of Gaiella (7.21%) and Acidobacterium (6.67%) were observed in the T1 and T2 treatments, respectively. Vicinamibacter was the dominant genus in the T3 (7.11%) and T4 (9.70%) treatments. The correlation network analysis revealed that Acidobacterium and Paludibaculum, both belonging to Acidobacteria, had the strongest correlation with nine other bacteria at the genus level. This was followed by Edaphobacter and Gaiella, which exhibited strong correlations with eight and seven genera, respectively (Figure 2). In blueberry roots, significant changes were observed in the relative abundance of genera under the four improvement methods. The dominant genus in the T1 treatment was Pantoea, with a relative abundance of 37.17%. Pseudomonas was the dominant genus in the T2, T3, and T4 treatments, with the highest relative abundance in the T4 treatment (55.27%). The correlation network analysis revealed that Mycobacterium, belonging to Proteobacteria, had a significant correlation with nine other genera. In addition, Pantoea, Pseudomonas, Streptomyces, and Acidibacter exhibited significant correlations with five genera (Figure 2).
Furthermore, the correlation between soil physical–chemical properties and the top 20 genera was analyzed. The results indicated that the soil physical–chemical properties were significantly correlated with the bacterial community in blueberry rhizosphere soil (p = 0.007), but with only a weak correlation with the bacterial community in blueberry root samples (p = 0.067). Therein, pH had the highest influence on the soil bacterial community, whereas SOM had the highest influence on the root bacterial community (Figure A2). Cluster analysis showed that the improved blueberry soils could be classified into two categories; T1 and T2 were grouped together, whereas T3 and T4 were grouped together. However, the classification characteristics of microorganisms in blueberry roots were not distinct, and only the T1 and T3 treatments are divided into different categories. The differences within the other treatments were greater than the differences observed between groups, which further supports the findings shown in Figure 1. Interestingly, the four soil improvement methods had no significant effects on the endophytic microbial community in blueberry roots (Figure 3).

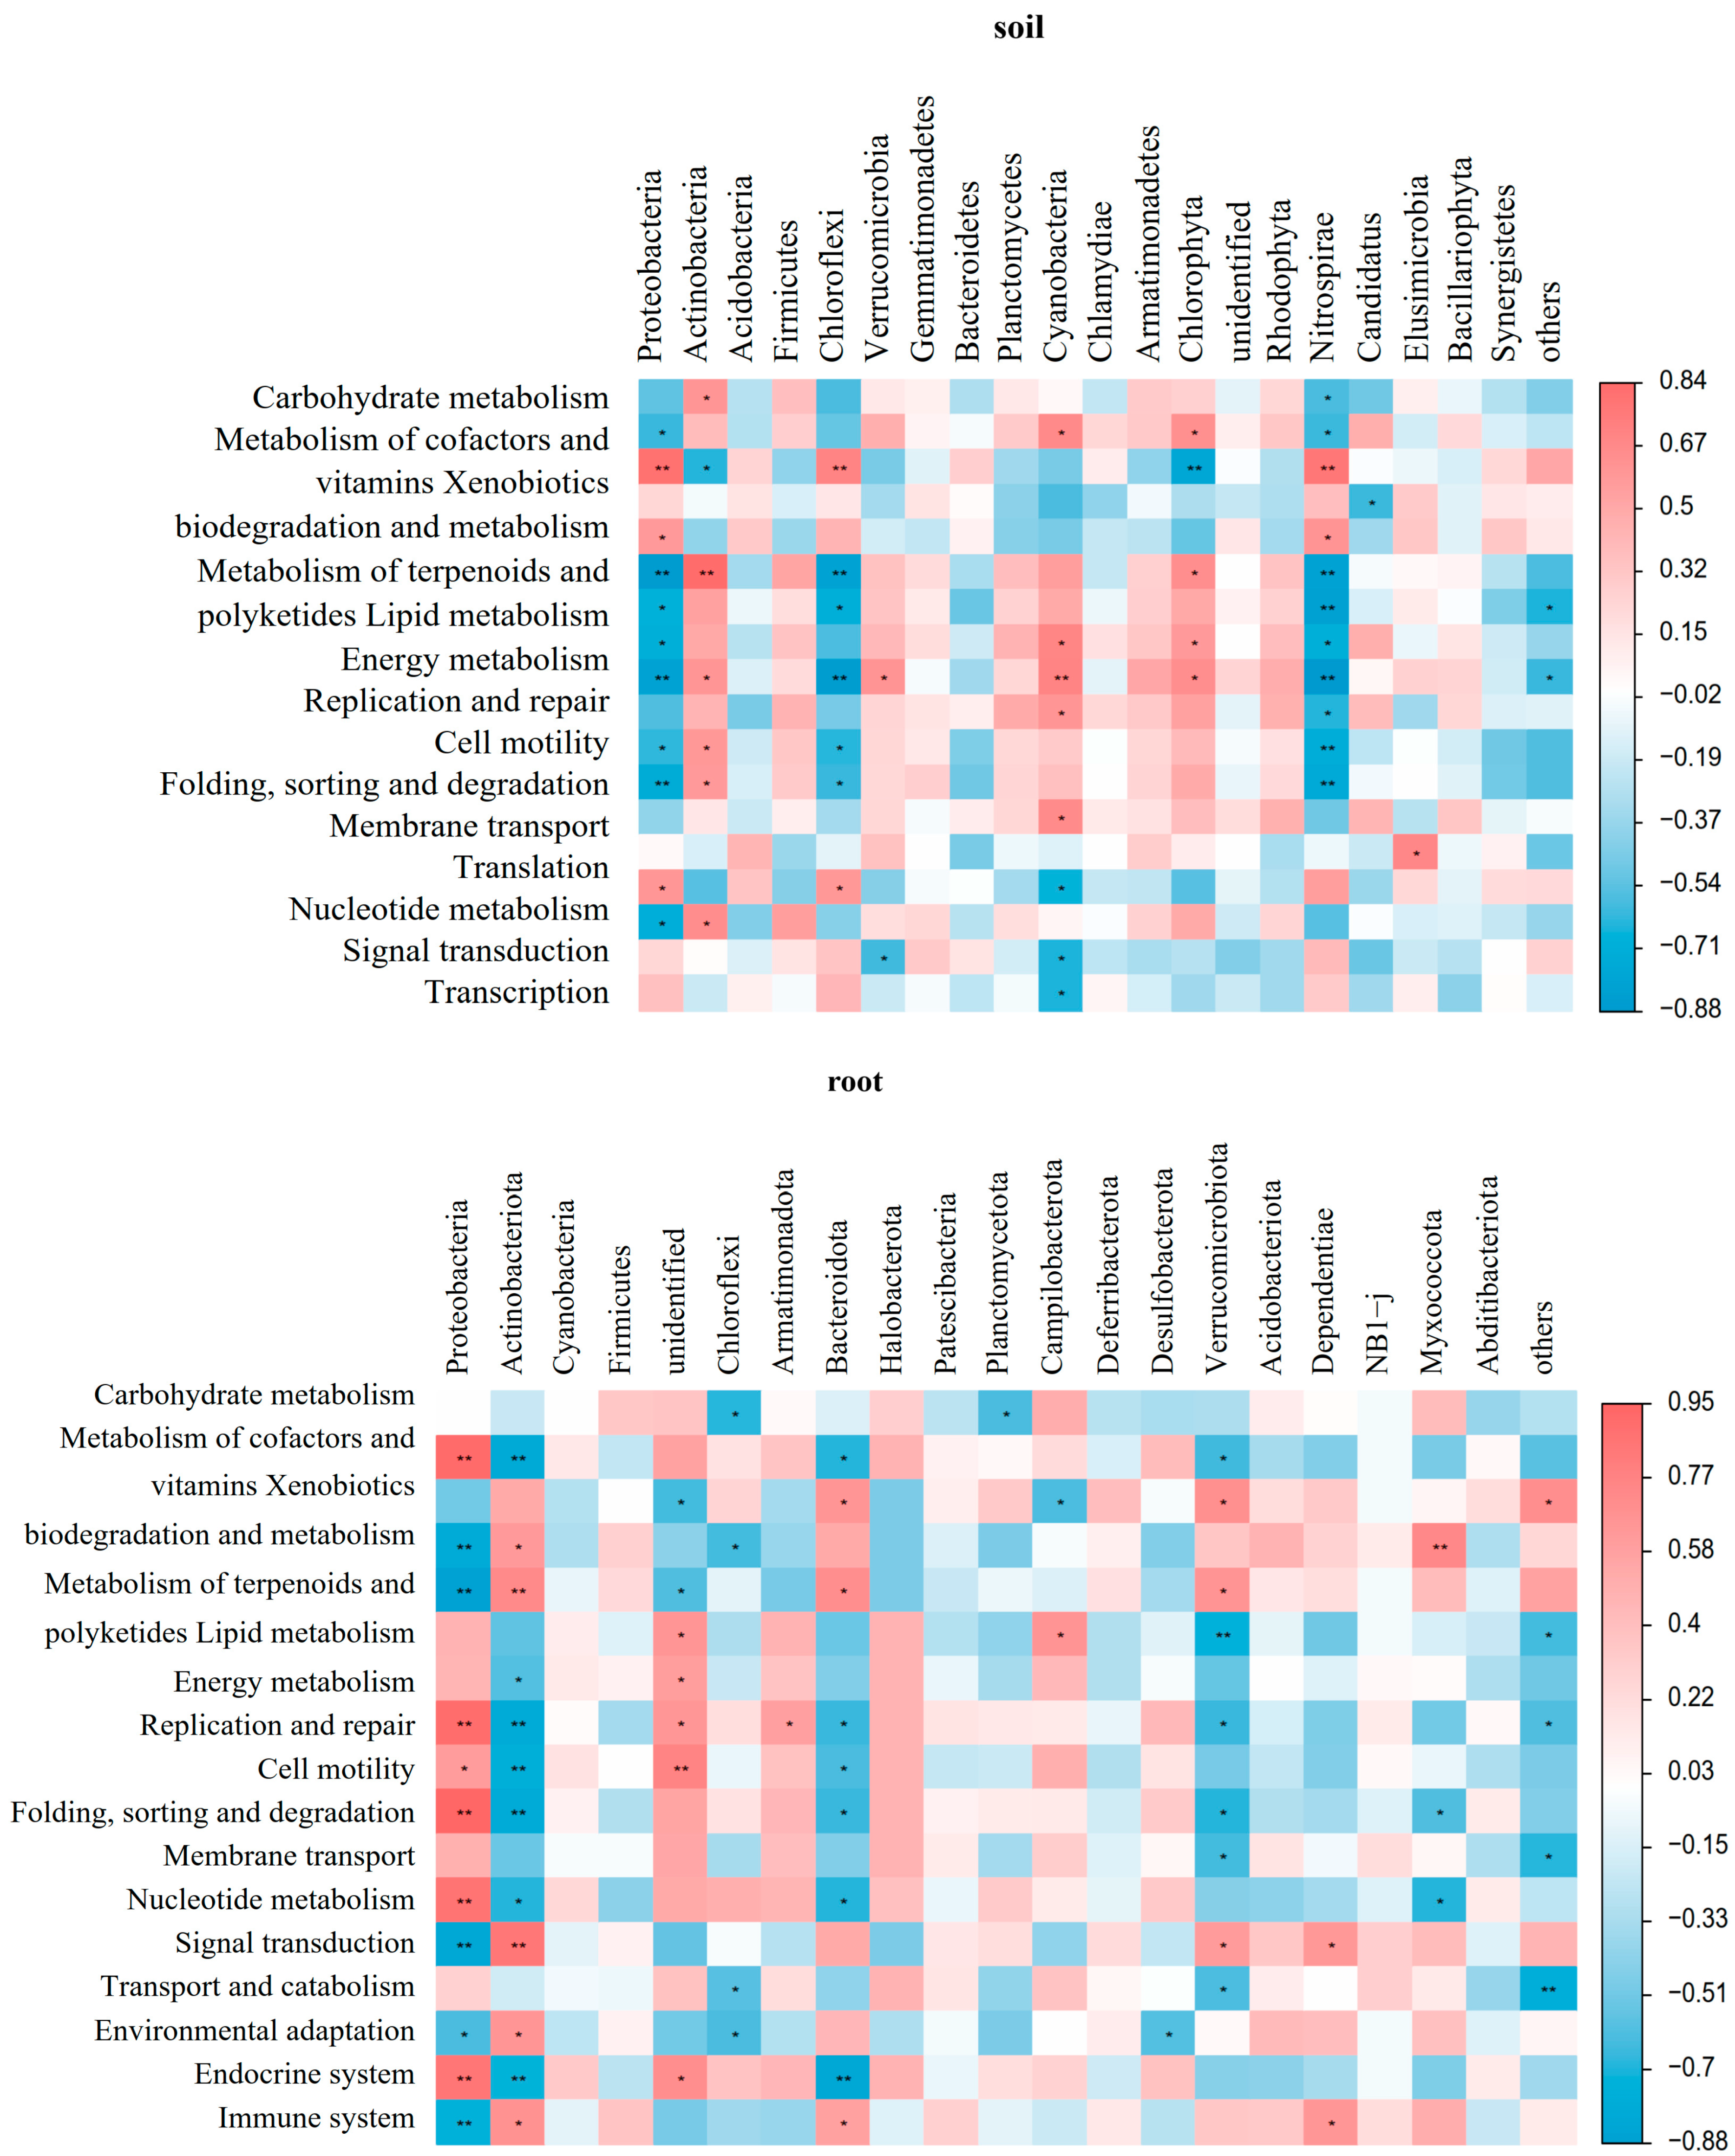
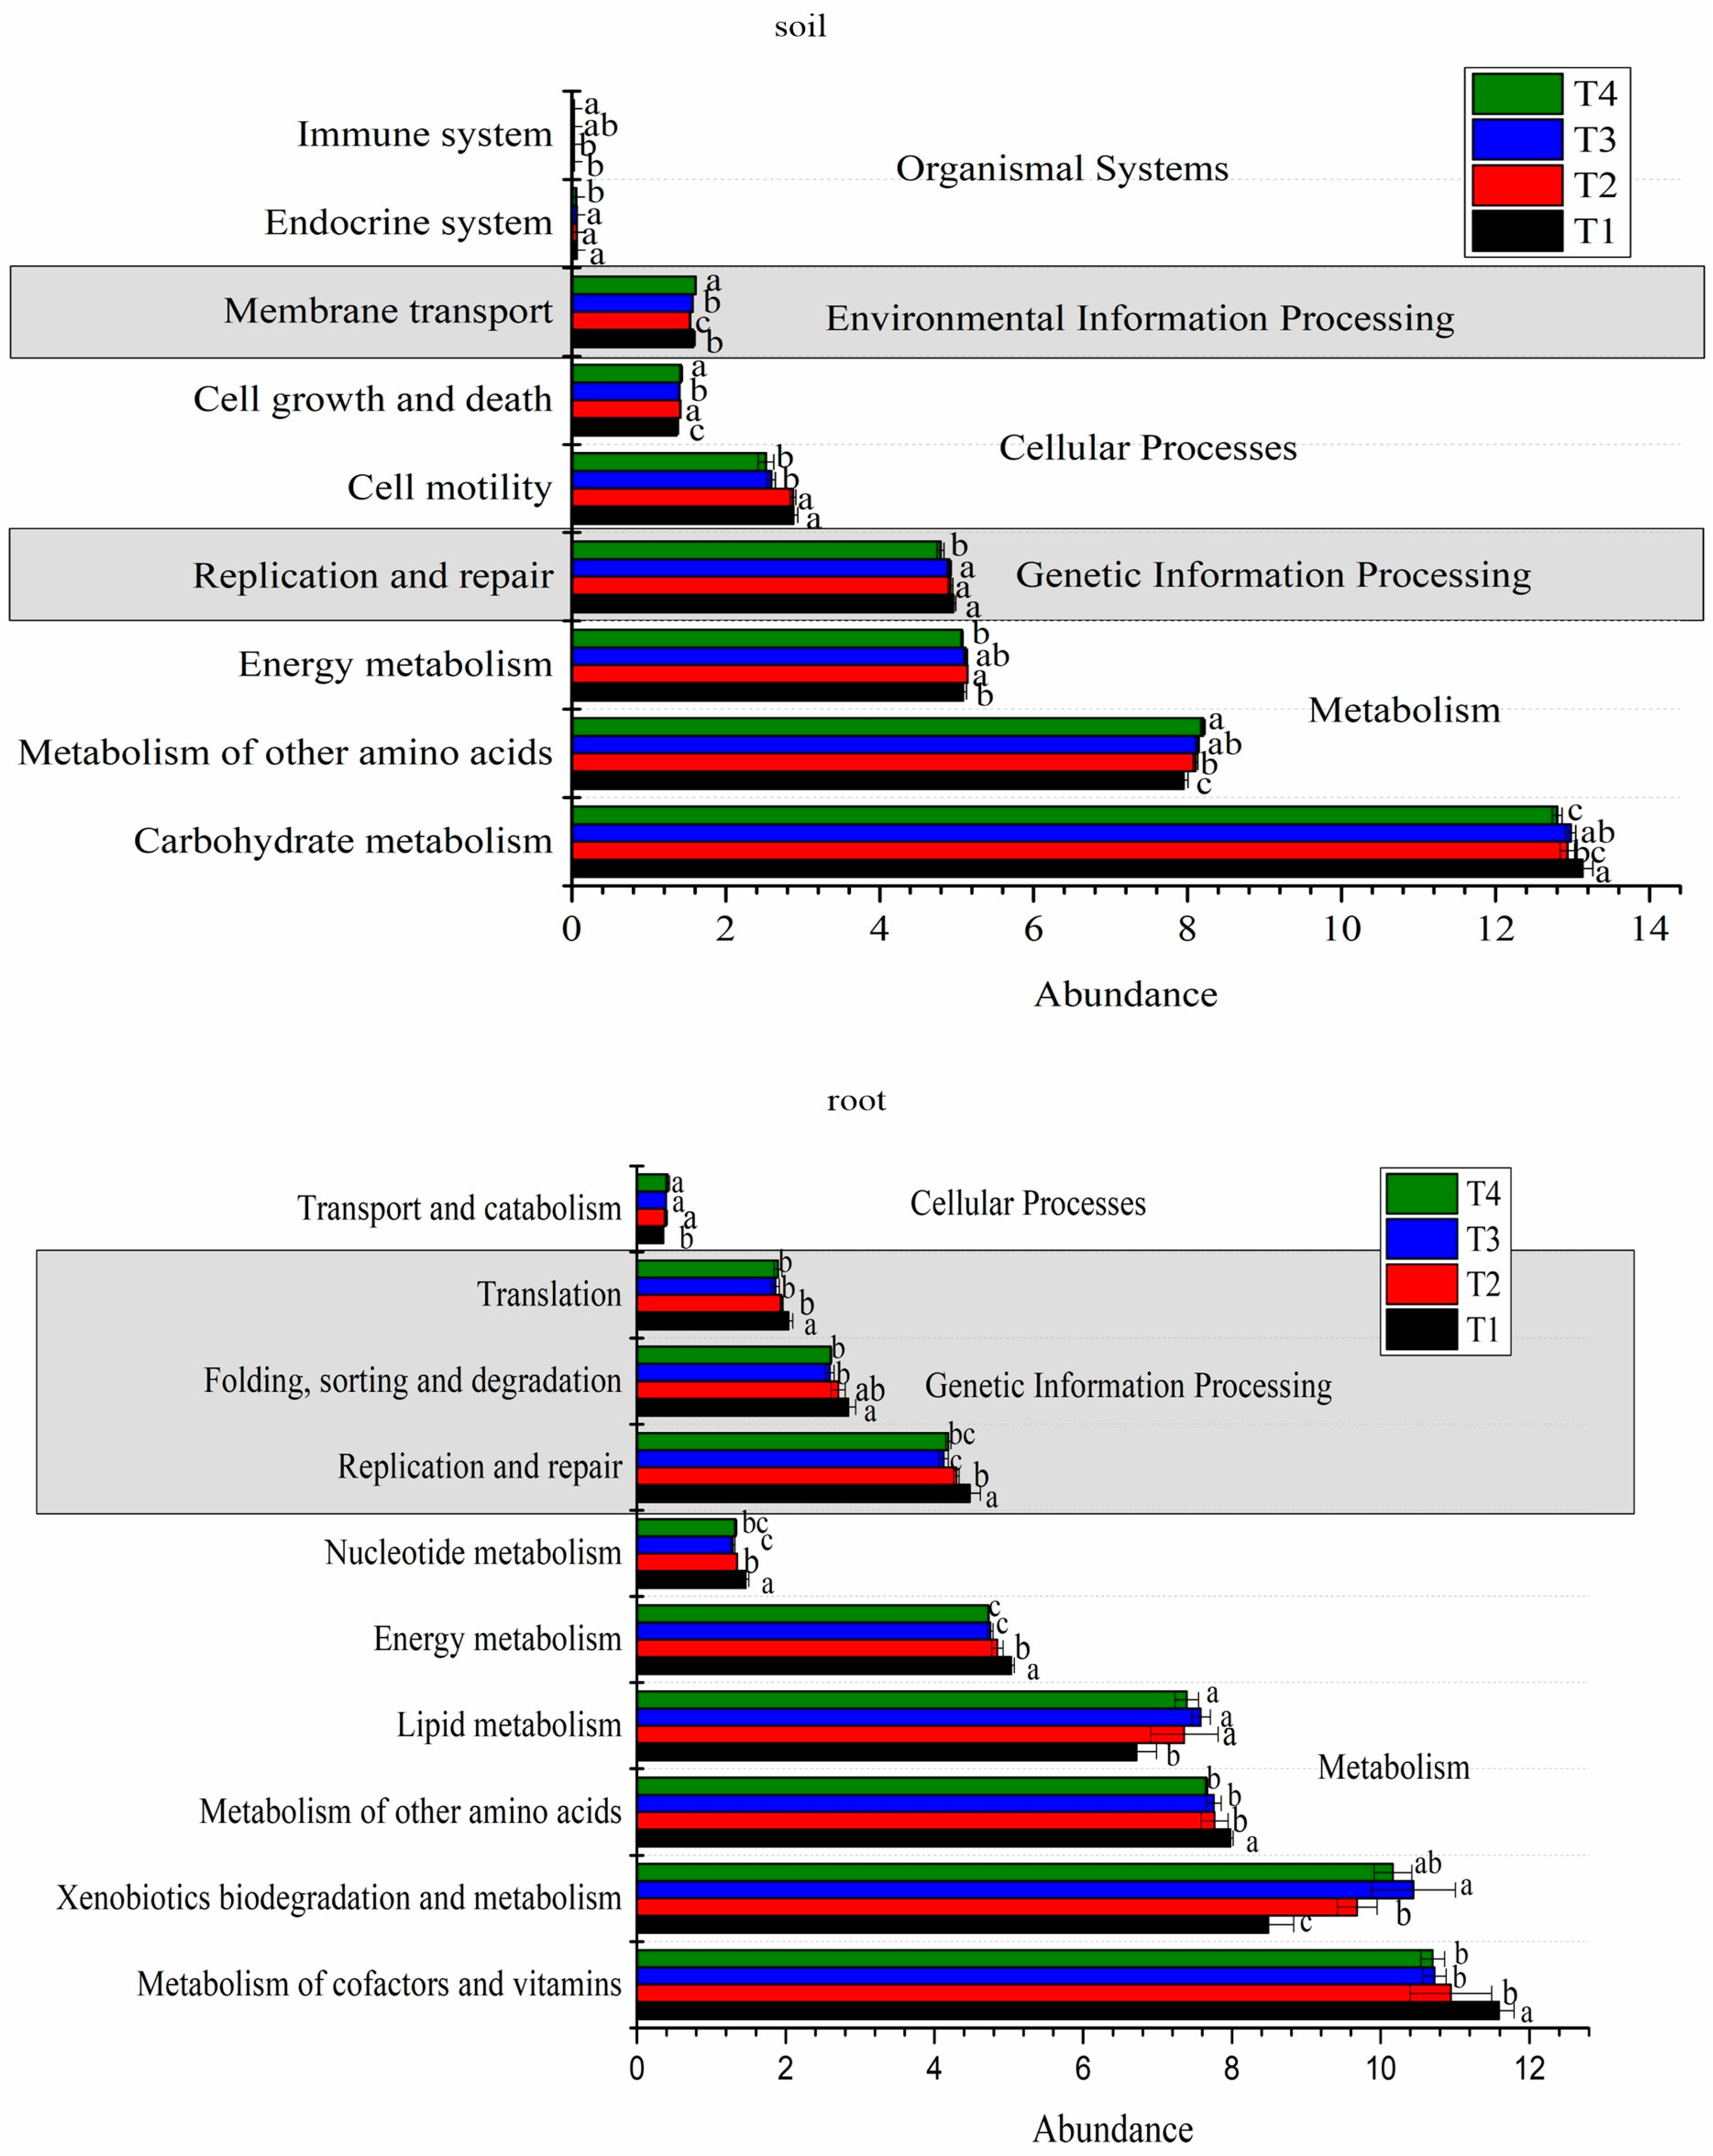
3.2. Impact of Different Soil Improvement Methods on Microbial Function in the Rhizosphere and Roots of Blueberry

In this study, the effects of different soil improvement methods on microbial function were analyzed in blueberry rhizosphere soil and roots. The results showed that carbohydrate metabolism and amino acid metabolism were the primary pathways involved in the metabolic processes in the blueberry rhizosphere soil. Interestingly, carbohydrate metabolism significantly varied among different treatments, with the highest abundance observed in the T1 treatment and the lowest in the T4 treatment. The opposite trend was observed for the metabolism of the other amino acids’ energy metabolism, which showed the highest abundance in the T4 treatment. Furthermore, the T2 treatment showed significant improvement in energy metabolism.
Regarding genetic information processing, the highest relative abundance pathway was replication and repair, accounting for 4.79–4.92% of the total. This pathway displayed the lowest abundance in the T4 treatment. In terms of cellular processes, cell motility was the dominant pathway, with higher abundance observed in the T1 and T2 treatments compared to the T3 and T4 treatments. Conversely, the relative abundance of the cell growth and death pathways was the lowest in the T1 treatment. As for environmental information processes, the membrane transport pathway exhibited the highest relative abundance, which increased under the T4 treatment. In addition, the dominant pathway was environmental adaptation, accounting for 0.16%. Moreover, the T4 treatment increased the abundance of the immune system while decreasing the endocrine system (Figure 4, Table A3).
Similar to the rhizosphere soil, the dominant pathways in the blueberry roots were also related to carbohydrate metabolism and amino acid metabolism, with no significant changes observed among the different treatments. However, some specific pathways showed higher activity levels in the T1 treatment compared to the other treatments. These pathways included the metabolism of cofactors and vitamins; the metabolism of other amino acids; energy metabolism and nucleotide metabolism in metabolic processes; and the replication and repair, folding, sorting, and degradation and translation pathways in genetic information processing. In addition, the T1 treatment significantly decreased the abundance of the transport and catabolism and the xenobiotics biodegradation and metabolism pathways (Figure 4, Table A3).
In order to further analyze the effect of bacterial function on soil properties, the correlation between metabolism pathways and soil physical–chemical properties was analyzed using a heatmap. In the blueberry rhizosphere soil, soil pH and total nitrogen (TN) showed a significant negative correlation with carbohydrate metabolism and cell motility, while exhibiting a positive correlation with the metabolism of cofactors and vitamins, xenobiotics biodegradation and metabolism, nucleotide metabolism, and folding, sorting and degradation (p < 0.05). SOM showed a positive correlation with carbohydrate metabolism, cell motility, and replication and repair, and a negative correlation with nucleotide metabolism, folding, sorting and degradation, translation, and transcription (p < 0.05). In addition, available phosphorus (AP) and available potassium (AK) exhibited strong correlations with transport and catabolism and cellular community–prokaryotes (p < 0.05). In blueberry roots, xenobiotics biodegradation and metabolism; energy metabolism; replication and repair; folding, sorting, and degradation; translation; and nucleotide metabolism displayed significant negative correlations with soil pH and TN (p < 0.05), while showing a positive correlation with SOM (p < 0.01). AP showed a negative correlation with xenobiotics biodegradation and metabolism and with lipid metabolism, but had a positive correlation with replication and repair, glycan biosynthesis and metabolism, translation, nucleotide metabolism, and environmental adaptation (p < 0.05) (Figure 5).

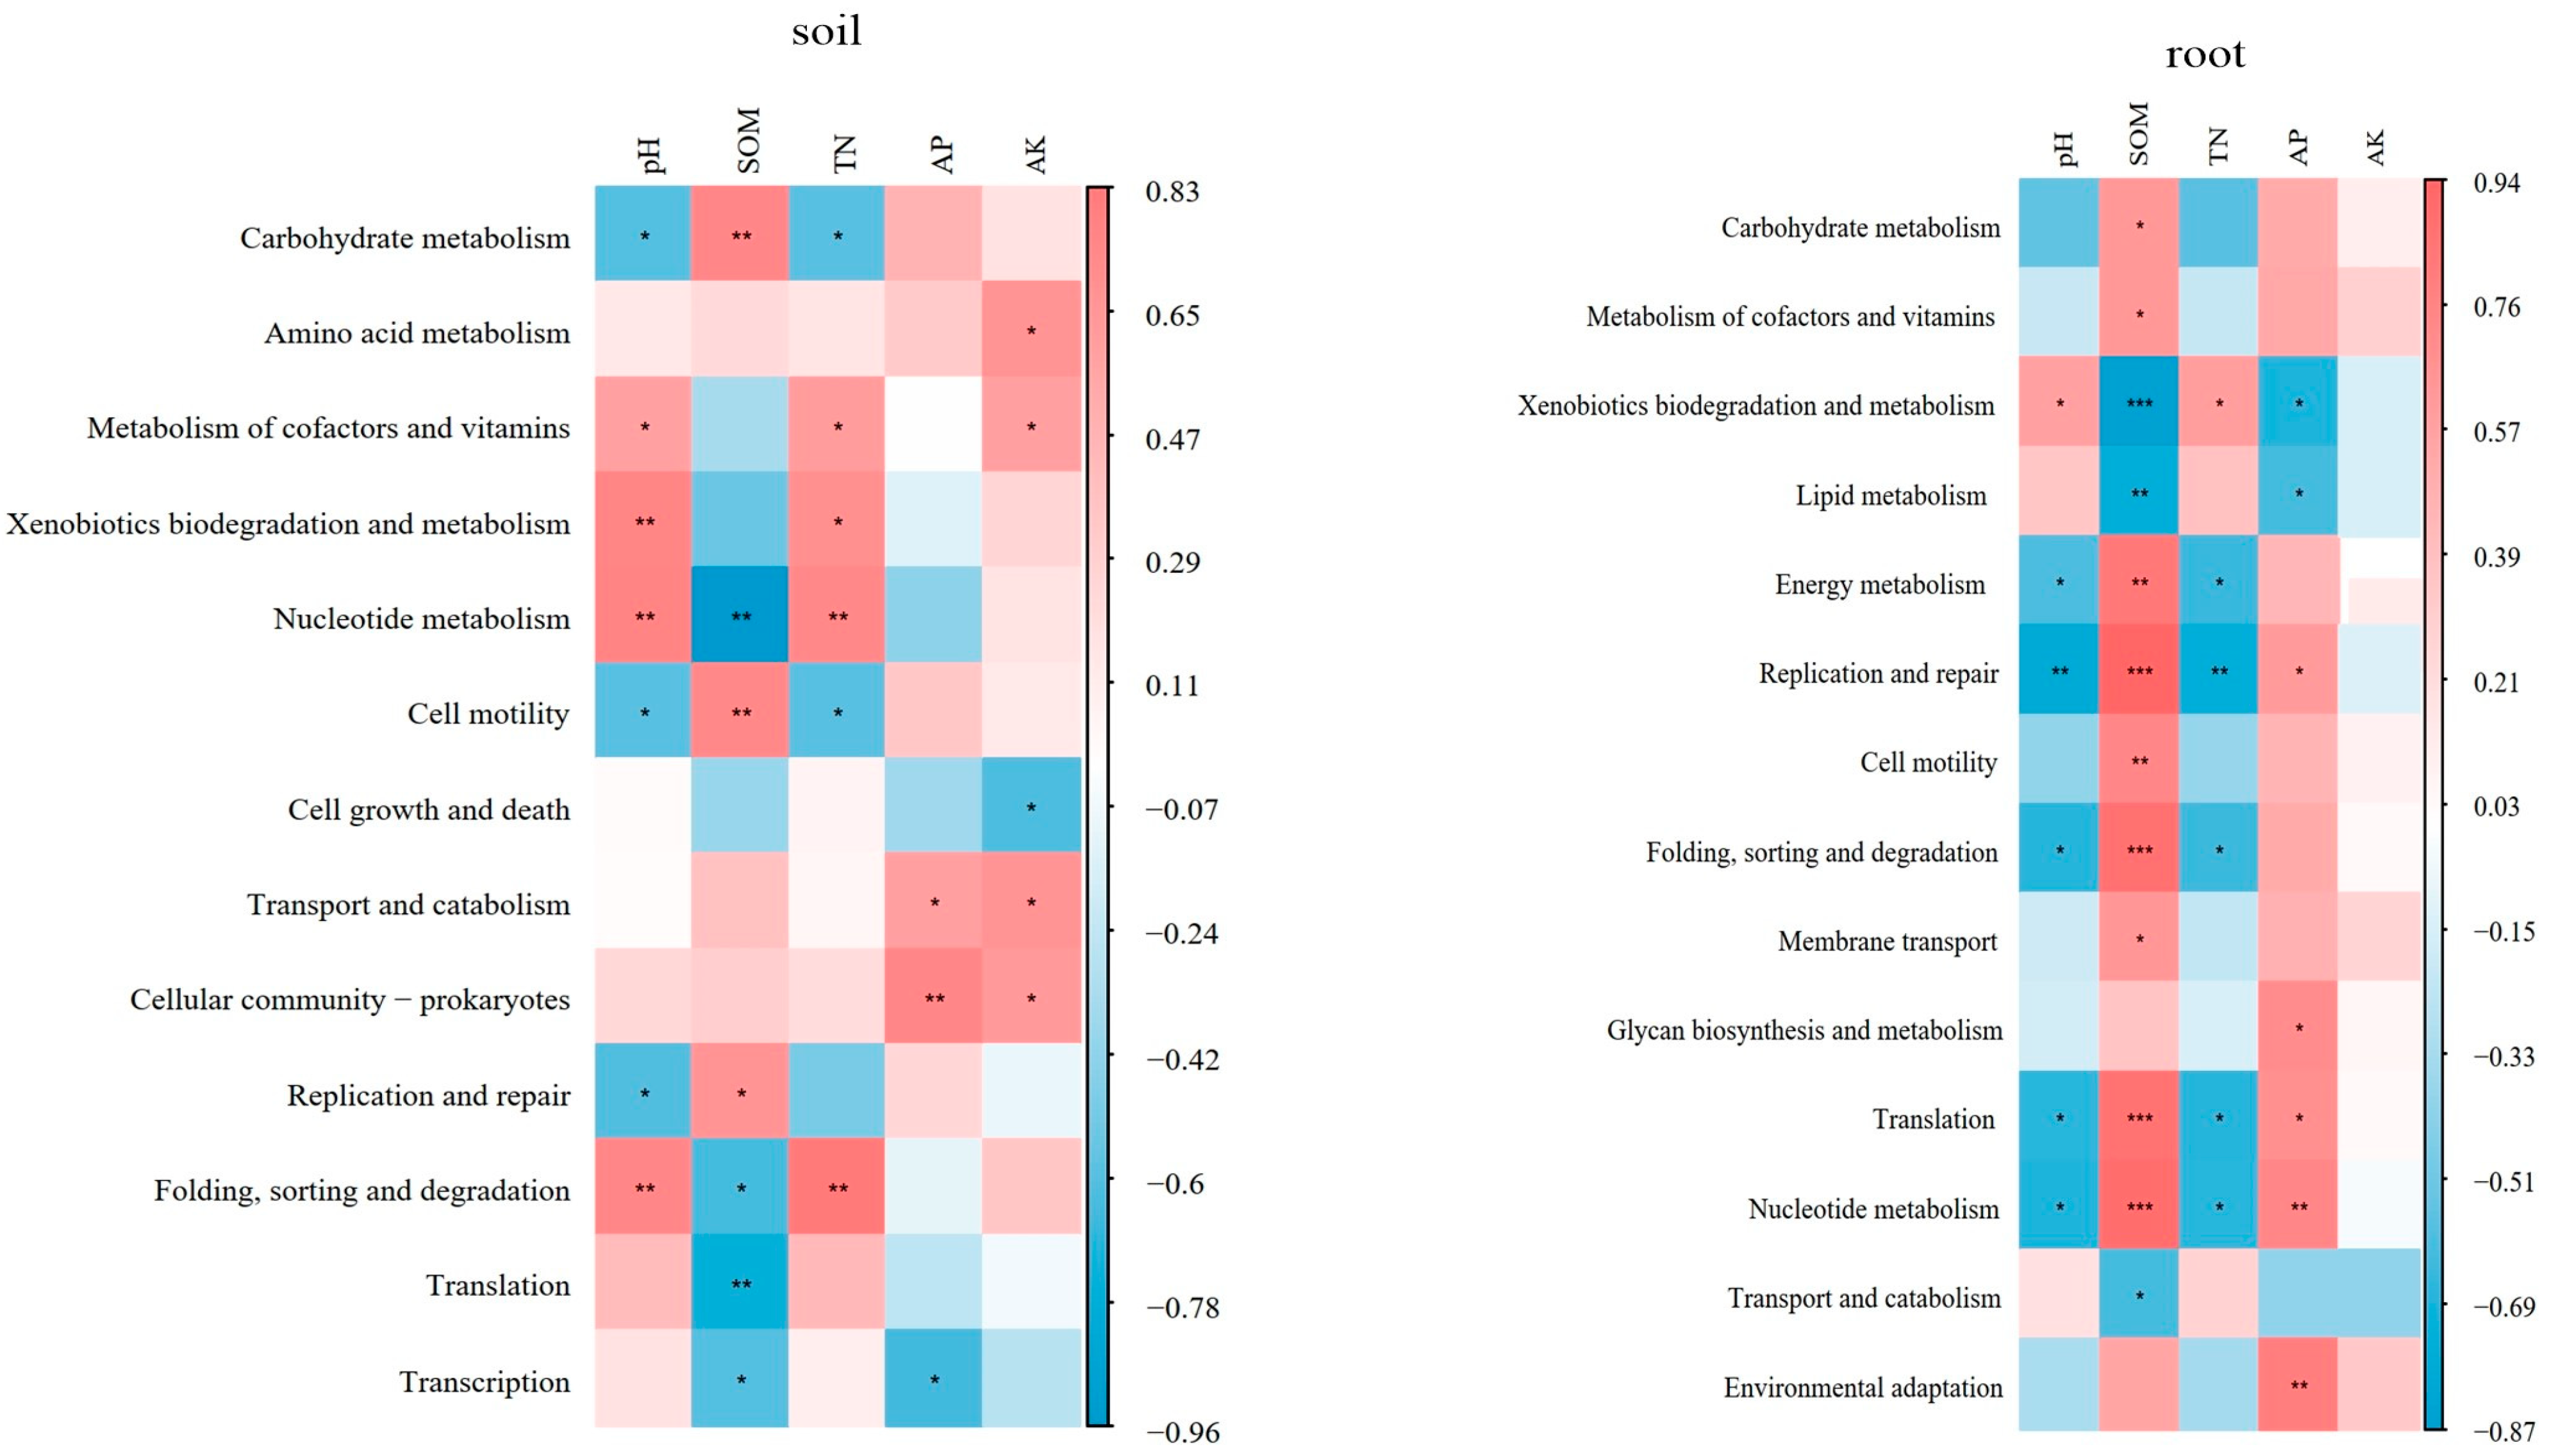
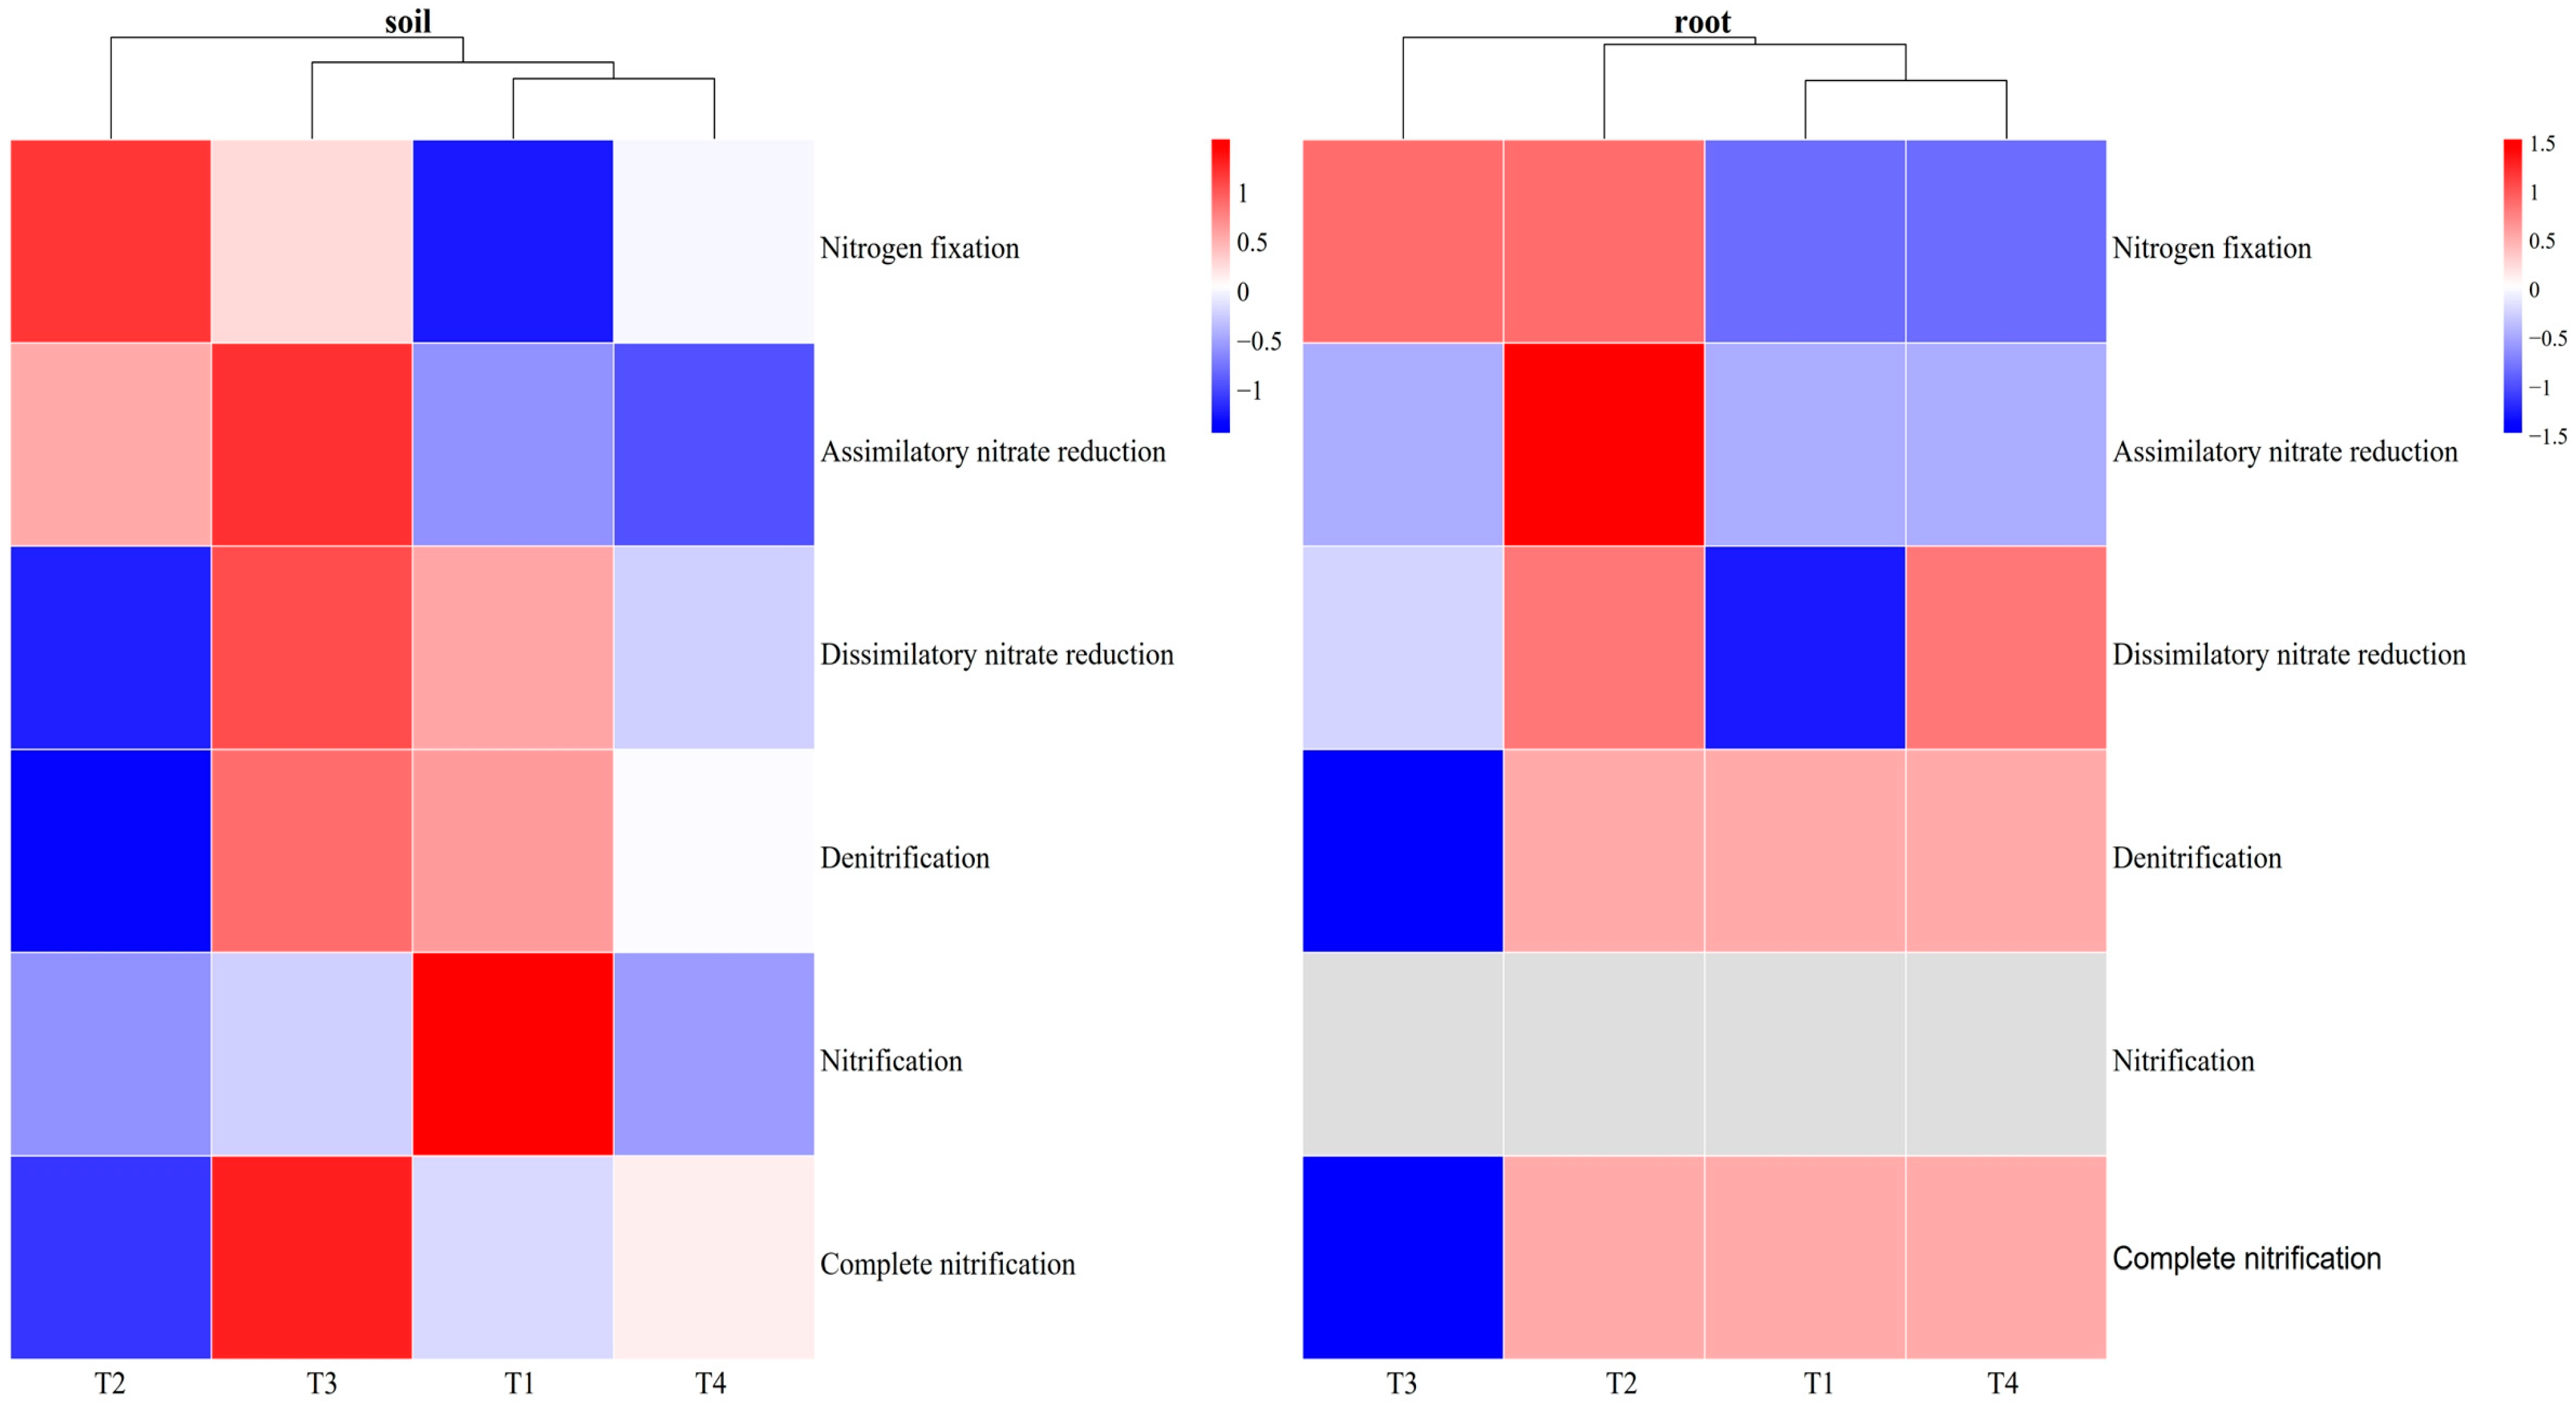
3.3. Functional Bacteria and Modules Involved in the N Cycle

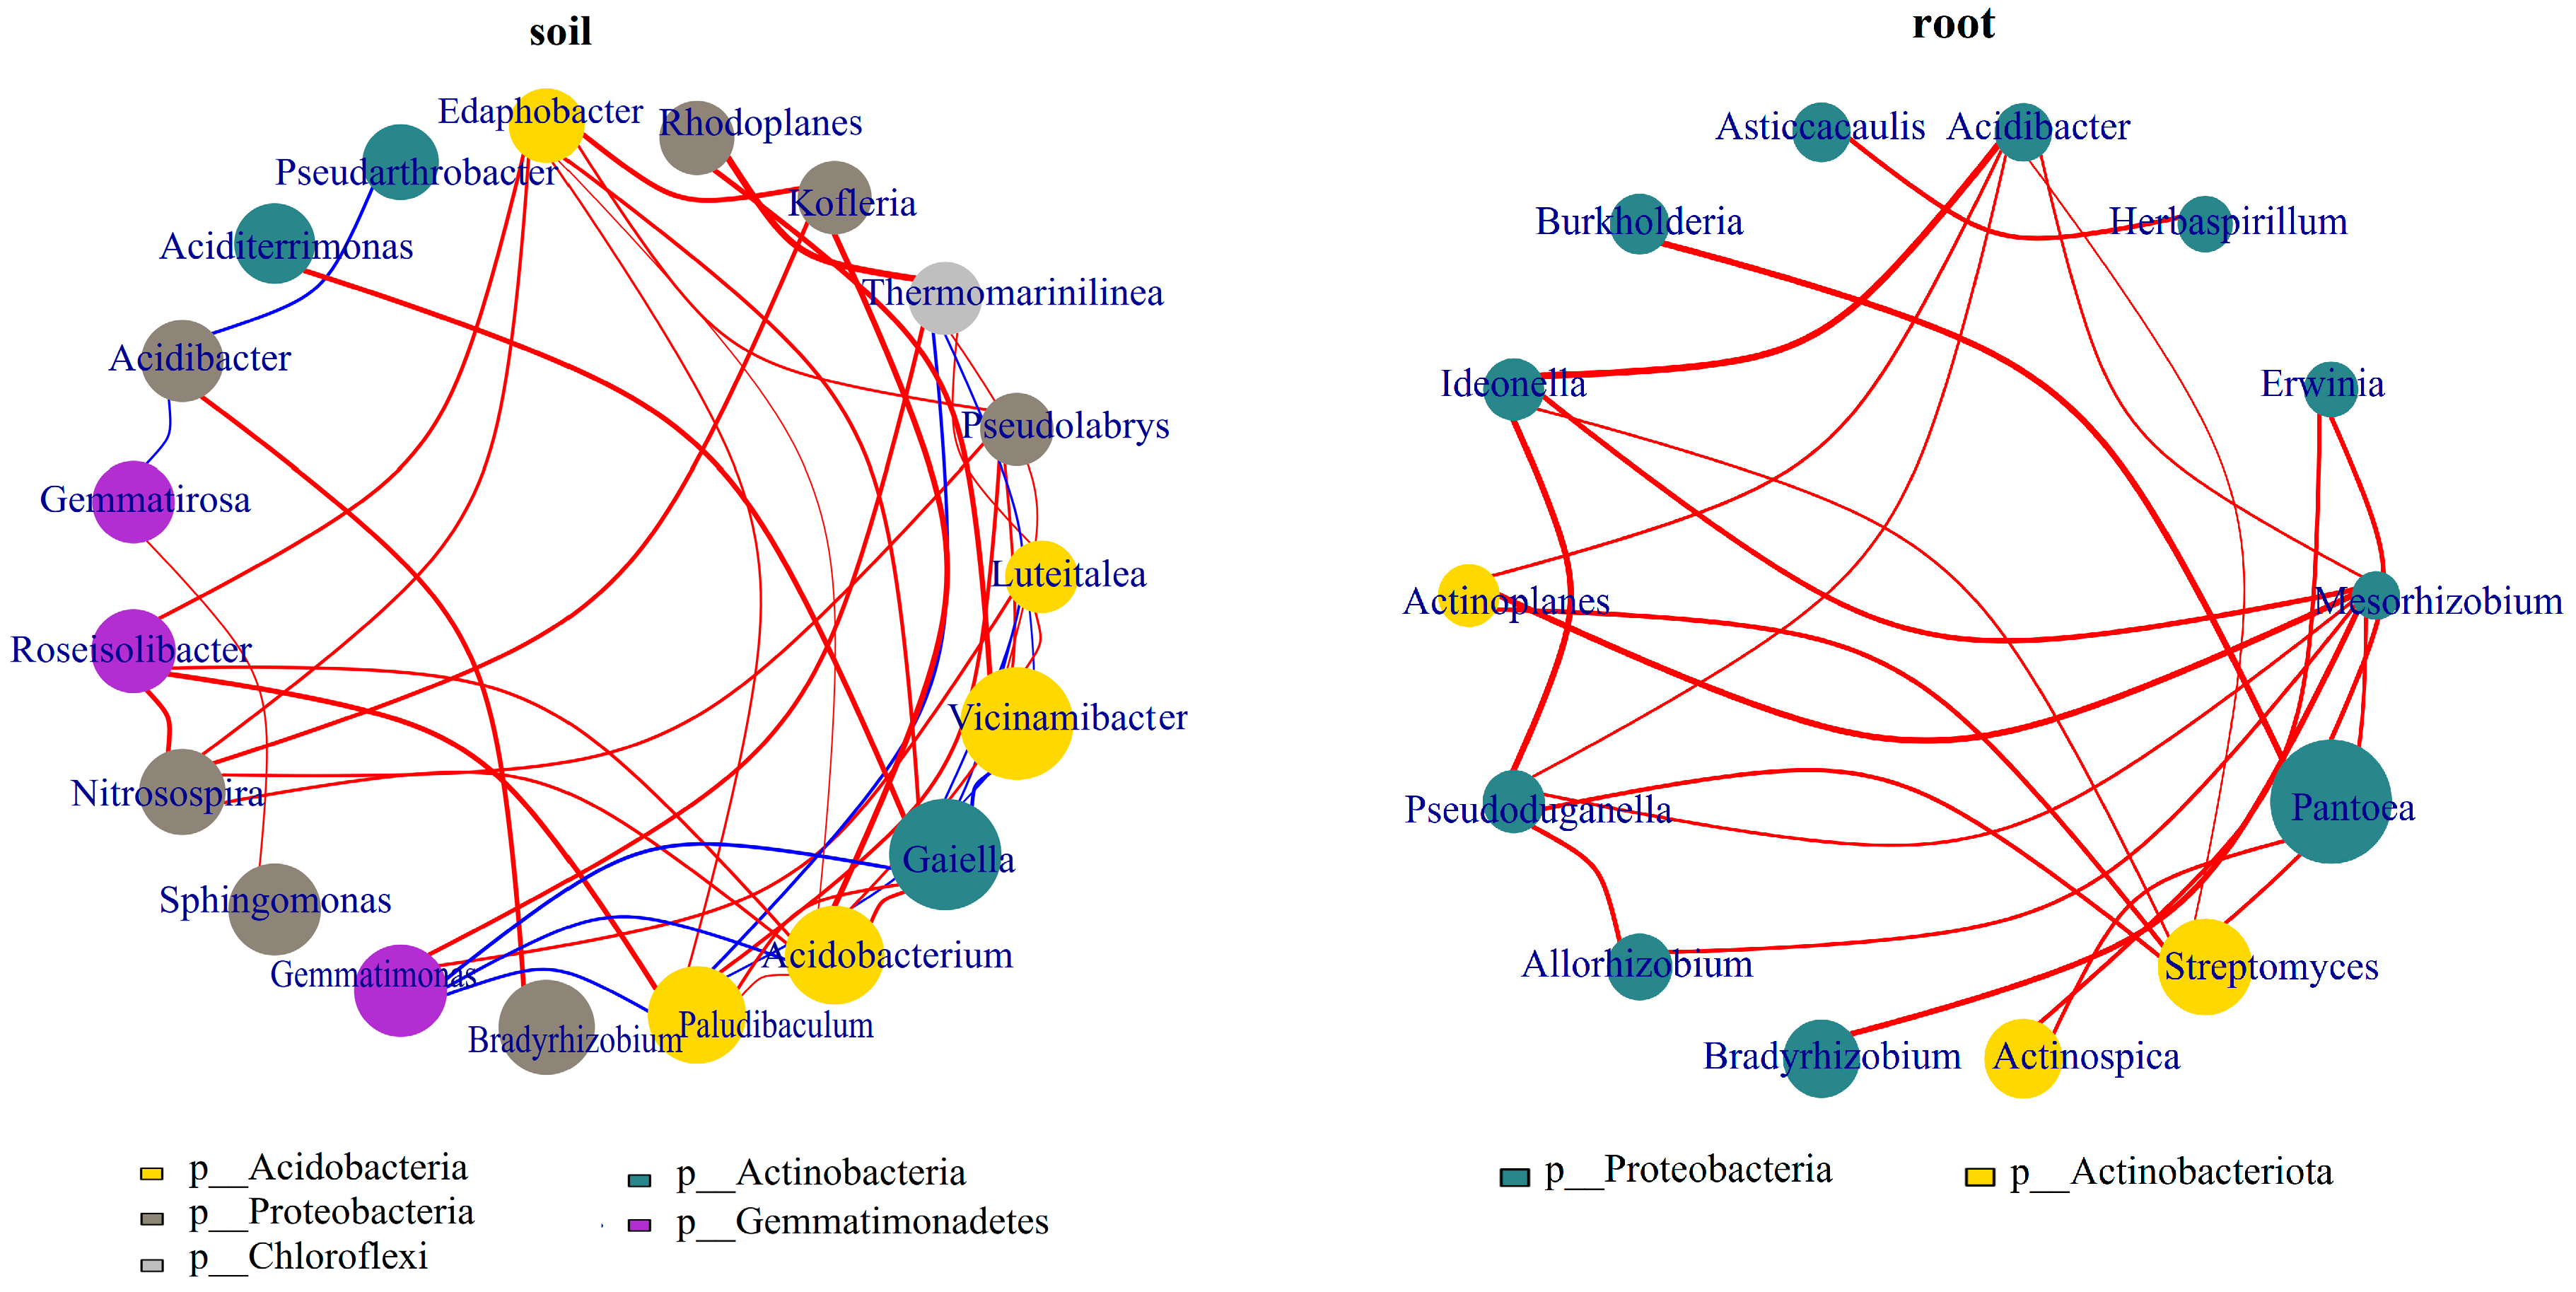
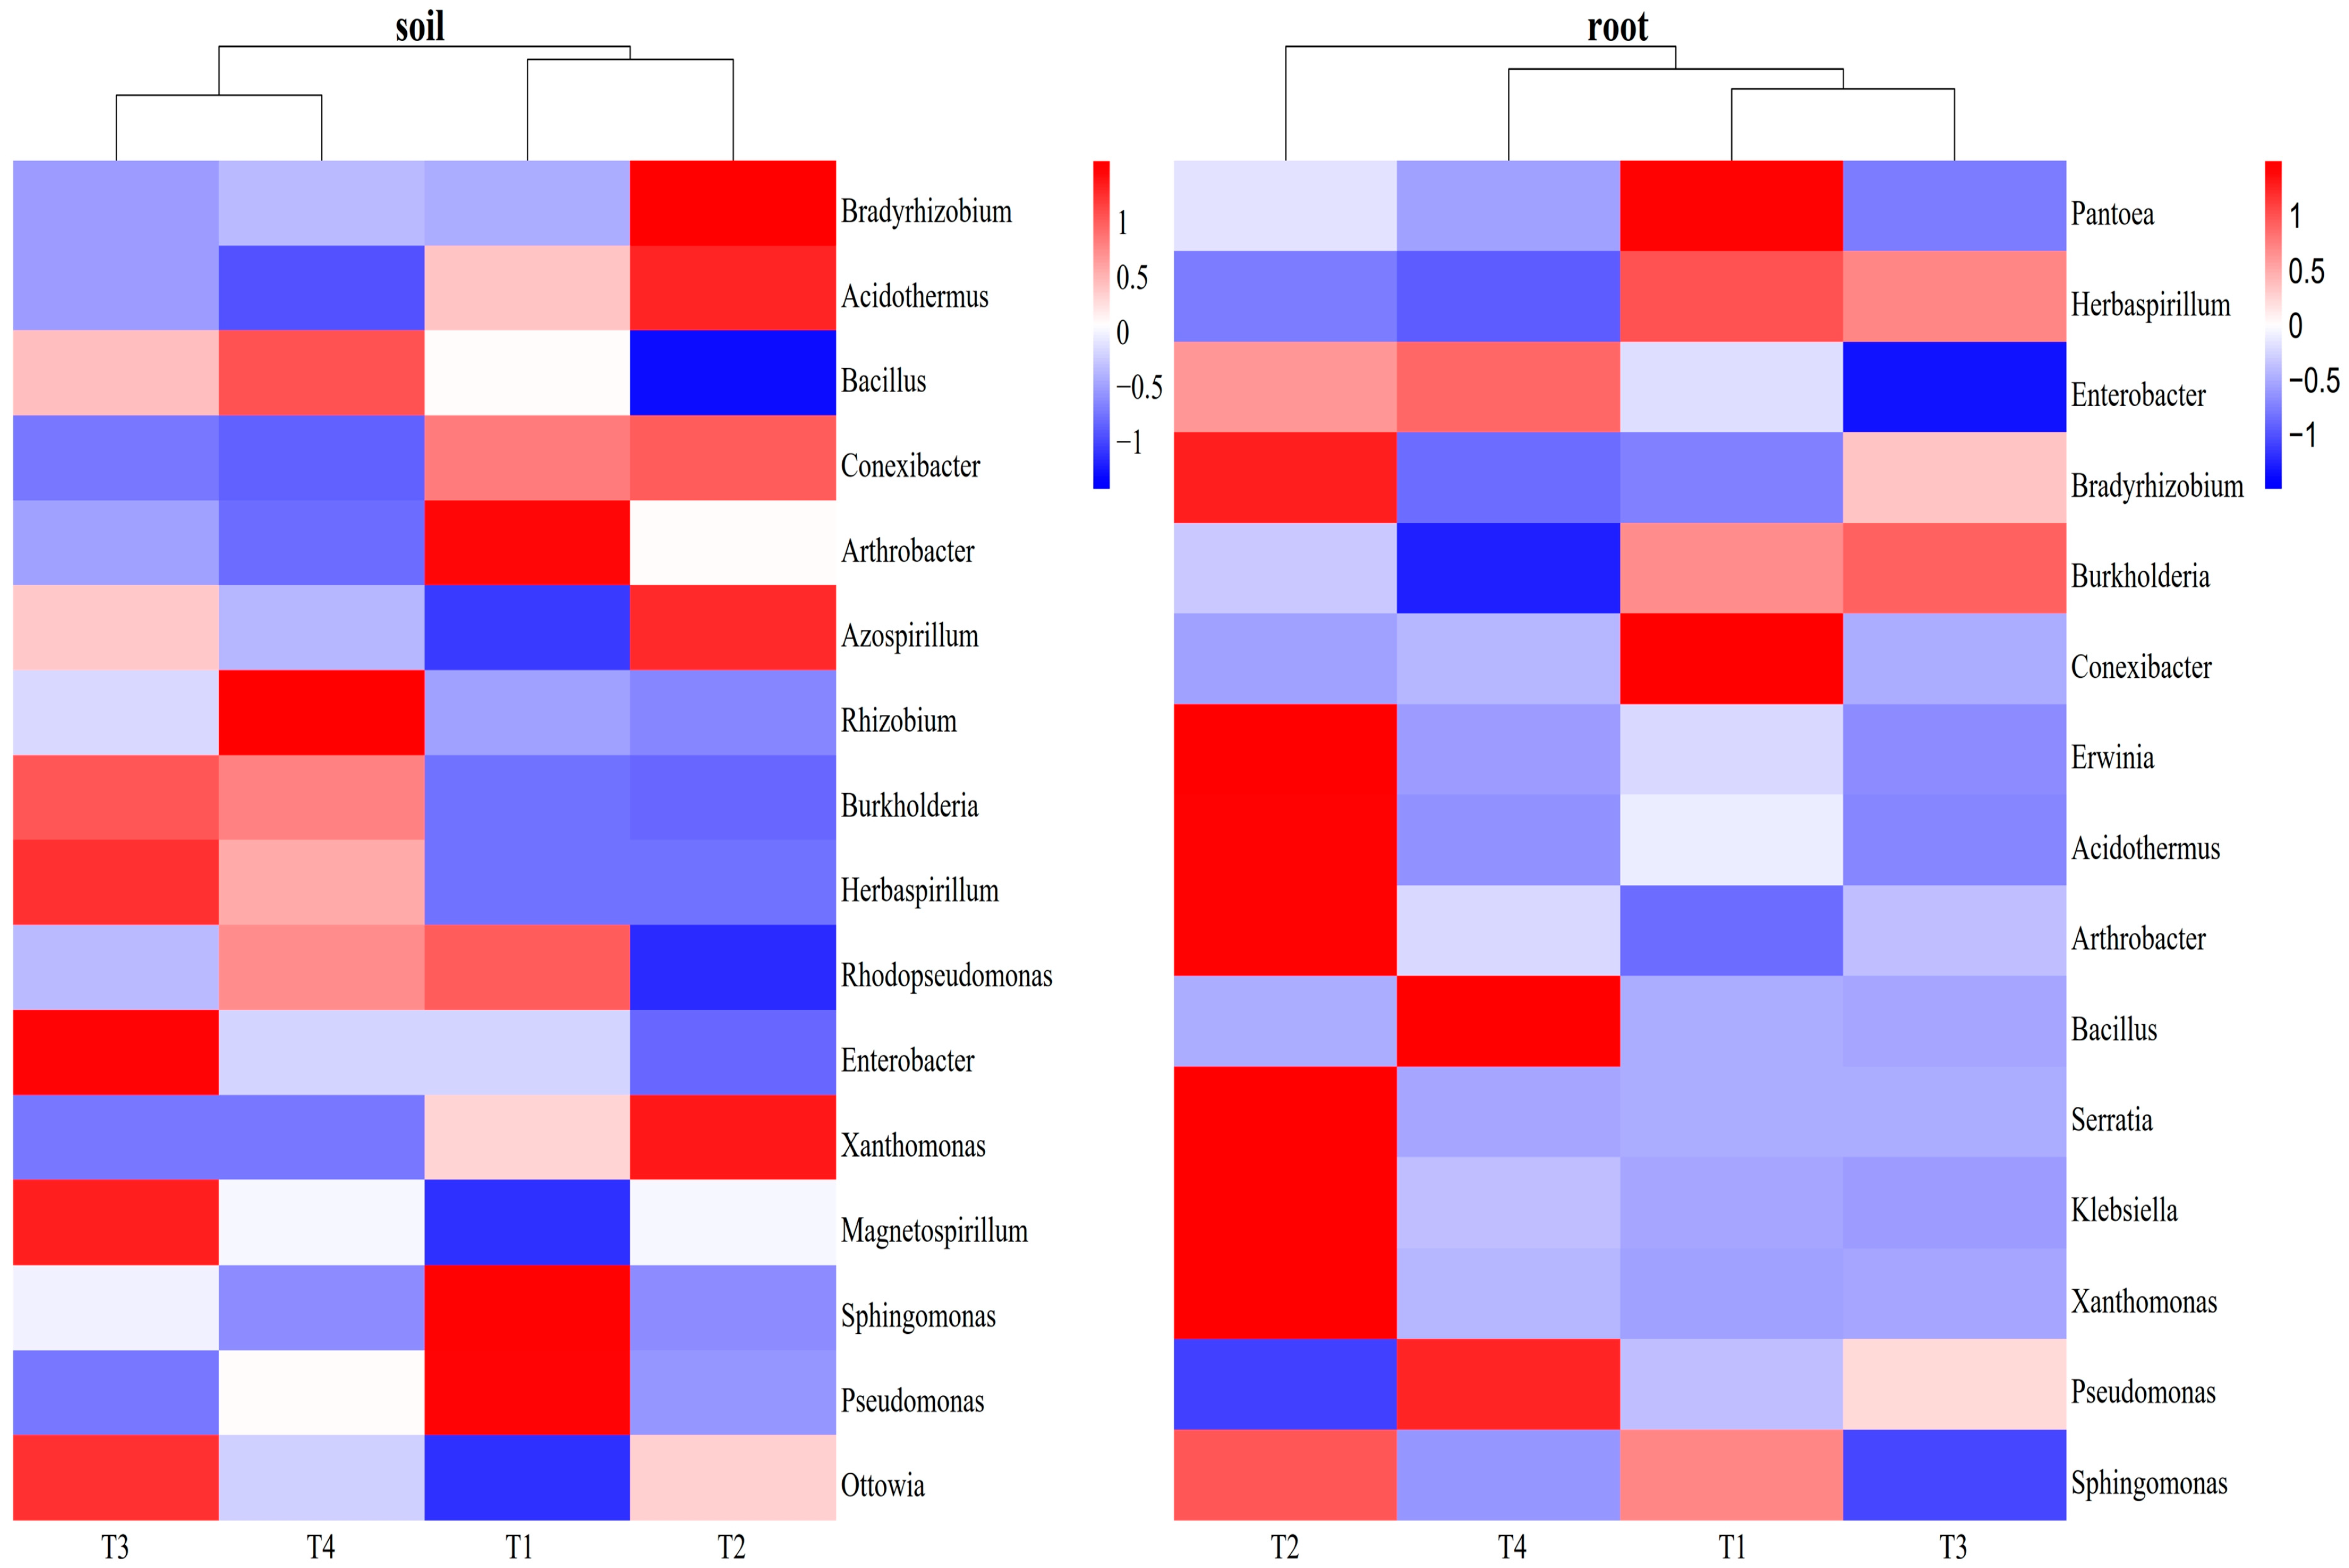
3.3.1. Influences of Soil Improvement on Functional Bacteria in Blueberry Rhizosphere Soil and Roots

There were a total of 13 bacteria involved in the N fixation pathway in the blueberry rhizosphere soil. The dominant genus among these bacteria was Bradyrhizobium, accounting for 2.43–3.33%, followed by Acidothermus (0.58–1.29%). These two genera showed the highest abundance under the T2 treatment. Bacillus (0.24–1.07%) and Rhizobium (0.03–0.40%) exhibited the highest relative abundance in the T4 treatment and the lowest in T2 treatment. The T2 treatment also increased the abundance of Azospirillum. In blueberry roots, 13 bacteria related to N fixation were identified. The dominant genus among these bacteria was Pantoea (2.17–37.17%), which reached its highest abundance in the T1 treatment. Herbaspirillum and Bradyrhizobium also showed significant differences among the four treatments. Interestingly, both Sphingomonas and Pseudomonas, which are involved in nitrification and denitrification, were found both in the rhizosphere soil and roots. However, Sphingomonas (1.74–4.52%) and Pseudomonas (28.58–55.27%) were the dominant genera in the rhizosphere soil and roots, respectively (Figure 2). Correlation analysis revealed that soil pH and TN displayed significant positive relations with Burkholderia, Bacillus, Rhizobium, and Herbaspirillum in the blueberry rhizosphere soil, as well as Pseudomonas in the roots. Moreover, pH and TN exhibited negative associations with Pantoea and Sphingomonas in the roots. In addition, SOM showed an opposite effect compared to pH and TN. It demonstrated a significant negative influence on Burkholderia, Rhizobium, Herbaspirillum, Magnetospirillum, and Ottowia in the blueberry rhizosphere soil, but a positive effect on Pantoea and Sphingomonas in the roots. Furthermore, AP displayed a positive correlation with Pseudomonas in the soil and Pantoea in the roots, while having a negative correlation with Azospirillum and Ottowia in the rhizosphere soil (Figure 6, Table A4).

3.3.2. The Effect of Soil Improvement on N Cycle at the Module Level in Blueberry Rhizosphere Soil and Roots

In order to further analyze the influence of different improvement methods on the N cycle, N metabolism at the module level was analyzed. This includes processes such as N fixation, degradation, nitrification and denitrification, assimilatory nitrate reduction (ANRA) and dissimilatory nitrate reduction (DNRA), and complete nitrification. In blueberry rhizosphere soil, the dominant metabolism pathway in the N cycle was DNRA (0.27%), followed by denitrification (0.12%) and ANRA (0.11%). The T2 treatment had a significant impact on the N cycle compared to the other treatments, enhancing microbial N fixation while decreasing microbial DNRA, denitrification, and complete nitrification. The abundance of ANRA, DNRA, denitrification, and complete nitrification was highest in the T3 treatment. The T1 treatment increased nitrification but decreased N fixation, while the T4 treatment had the lowest abundance of ANRA. In the blueberry roots, DNRA was also the dominant pathway in the N cycle (0.37%), with higher abundance in the T2 and T4 treatments and lower abundance in the T1 treatment. Denitrification (0.11%) and ANRA (0.09%) were the next most abundant pathways, with the highest relative abundance in the T2 treatment. N fixation was more abundant in the T2 and T3 treatments than in the T1 and T4 treatments (Figure 7).
The nitrogen metabolism pathways in the blueberry rhizosphere were significantly related to soil properties. DNRA showed a significant positive correlation with pH, TN, and AK (p < 0.05). AK also had a significant influence on nitrification and denitrification, with denitrification strongly correlated with soil pH and TN (p < 0.05). In addition, complete nitrification showed a significant correlation with pH, SOM, TN, and AK (p < 0.05). The correlation between the N metabolism pathway in the blueberry roots and soil properties was weaker than that observed in the rhizosphere soil. However, there was still a significant correlation between DNRA and AK, as well as complete nitrification and SOM (p < 0.05). N fixation showed a strong correlation with AP (p < 0.01) (Table 2).

4. Discussion

4.1. Differences in Microbial Community Diversity and Structure in Blueberry Rhizosphere and Roots under Different Soil Improvement Methods

Blueberry plants thrive in moist, acidic, and high-organic-matter soil with good aeration and drainage [40]. Therefore, applying peat, mushroom bran, rice husk, and sulfur to the soil can adjust soil pH, increase organic matter, and improve soil permeability, thereby creating optimal growing conditions for blueberry plants. These applications promote the growth and development of blueberries and increase fruit yield and quality. In this paper, peat and acidified rice husk resulted in the lowest soil pH value (5.53), followed by the peat and sulfur treatment (5.76). Although mushroom bran is an acidic substance by nature, it did not decrease the pH level of blueberry rhizosphere soil (the pH in T3 and T4 was 6.15 and 6.13, respectively) (Table A2). Previous studies have shown that blueberry prefers soil conditions with low pH (4.4–5.5), and soil pH impacts the plant’s growth and development, including its photosynthetic characteristics, root development, and fruit quality, by affecting the blueberry plant’s N absorption and utilization efficiency, and amino acid synthesis [8,41]. Plant height, the main basal diameter, and the biomass dry weight of the leaf, stem, and roots was found to decrease with increasing soil pH [42,43]. Therefore, the T2 treatment, which resulted in the lowest pH value, is the most effective for this species. A previous study showed that the suitable soil organic matter content for blueberry growth is 8–12%. And all treatments, except T3, had organic matter content higher than 8.50% (Table A2), which is suitable for blueberry growth [44]. Peat has an organic matter content higher than 30%, so its application effectively increases soil organic matter content. In this experiment, T1 treatment had significantly higher SOM content than the other treatments (9.35%), due to the application of a larger amount of peat. Different soil improvement methods have significant effects on soil pH and nutrient content, so these changes in physical and chemical properties are bound to have a certain impact on soil microorganisms. Consequently, it is possible to consider acidified rice husks as an alternative to sulfur for improving blueberry soil in practical production.
Soil microbes play a crucial role in the soil ecosystem, influencing plant life forms, community functioning, and nutrient cycling [45,46]. In this paper, the quantity and diversity of soil microbes were observed to be highest in the T4 treatment and the lowest in T1 (Table 1). This could be attributed to the significant interaction between the diversity and composition of rhizosphere bacterial communities and soil pH and SOM [47]. The physical and chemical properties in the T4 treatment resulted in more favorable conditions for most microbial activities. Whereas the T1 treatment had the highest SOM, the pH was not suitable for microorganisms that decompose organic matter [48]. Endophytic bacteria are closely related with plants, and reside in living plant tissue without causing symptoms of disease [49]. In this paper, the number of endophytic bacterial communities was the highest in the T4 treatment, and the lowest in T1 treatment. A previous study has confirmed that most endophytic bacteria migrate from the rhizosphere soil [50], and the highest number of OTUs and greatest diversity in the blueberry rhizosphere soil were observed in the T4 treatment, while the lowest were observed in the T1 treatment. There were no significant differences in the Shannon and Simpson indices among the different treatments in blueberry roots. This might be because the diversity of endophytic bacterial communities was also influenced by plant genotype [51].
Proteobacteria, Actinobacteria, and Acidobacteria were identified as dominant phyla in the soil microbial community (Figure 1), consistent with major trends observed in dominant bacteria in forest ecosystems [52,53]. The relative abundance of Proteobacteria, Actinobacteria, and Acidobacteria was the highest in the T4, T1, and T2 treatments, respectively. This might be because different soil improvement methods changed the soil properties and indirectly influenced the soil microbial community (Figure A2). Similarly, in the blueberry root endophyte bacterial community, Proteobacteria and Actinobacteria were also the dominant phyla. And the highest relative abundance of Proteobacteria and Actinobacteria was observed in the T1 and T4 treatments. This again confirms that endophytic microorganisms migrate from the soil. The community composition of the bacterial community at the genus level differed among different soil improvement methods in the blueberry rhizosphere soil. Mycobacterium, a well-known PGPR which produces indole-3-acetic acid (IAA) to promote plant growth and seed germination, exhibited the highest relative abundance in the T4 treatment. Gaiella and Acidobacterium were the dominant genera in the T1 and T2 treatments, respectively, while Vicinamibacter dominated in the T3 and T4 treatments (Figure 2). This might be because soil pH had a significant influence on the bacterial community of blueberry rhizosphere soil (Figure A2). In addition, the network analysis demonstrated that Acidobacteria was the main factor, and the cluster analysis showed that the T1 and T2 treatments were clustered into one category, and the T3 and T4 treatments were clustered into another category. These results showed that pH was the main factor affecting the microbial community in blueberry rhizosphere soil.

4.2. The Function of Microbial Community in Blueberry Rhizosphere Soil and Roots

Functional prediction indicated that bacterial metabolism in the blueberry rhizosphere was found to primarily involve carbohydrate metabolism, amino acid metabolism, replication and repair, cell motility, the membrane transport pathway, and environmental adaptation (Table A3), and these findings were consistent with previous studies [40,52]. In this paper, different soil improvement methods had varying effects on microbial metabolism. For example, carbohydrate metabolism significantly differed among the treatments, with the highest found in the T1 treatment and the lowest in the T4 treatment. Carbohydrate metabolism was associated with Actinobacteria, Firmicutes, and Chlorophyta, with the highest abundance in the T1 treatment and the lowest in the T4 treatment. In addition, carbohydrate metabolism also had a significant negative correlation with soil pH and TN, and a positive correlation with SOM (Figure 4 and Figure A3). And the T2 treatment increased the abundance of energy metabolism, because it promoted the abundance of Acidobacteria and Elusimicrobia, which were associated with energy metabolism (Figure A3). The function of blueberry rhizosphere microbes was significantly correlated with soil properties, which was reported in a previous study [6].
In blueberry roots, the dominant pathways were consistent with those observed in the rhizosphere soil, and these pathways did not show significant changes among the different treatments (Table A3). These results confirmed that different soil improvement methods did not alter the dominant function of endophytic microbes. However, most pathways were influenced by the T1 treatment due to the significant correlation between endophytic microbial function and SOM, which could provide a carbon source for microbial development [54,55]. The SOM content in the T1 treatment was significantly higher than that in the other treatments. In addition, Proteobacteria and Actinobacteria were involved in most pathways, and their relative abundance differed from those observed in other treatments (Figure 1 and Figure A3).

4.3. Effects of Different Soil Improvement Methods on N Cycle

N is crucial for plant growth and development, influencing processes such as plant protein synthesis, cell division, and photosynthesis [56,57,58]. Previous studies have confirmed that PGPR can benefit saffron growers by enhancing corm growth, increasing stigma and biomass yield, as well as elevating the levels of secondary metabolites [31,59]. In this paper, the effects of different soil improvement methods on N fixation functional bacteria were investigated. And the T2 treatment had a notably positive influence on the majority of N fixation function bacteria both in the blueberry rhizosphere soil and roots. In the blueberry rhizosphere soil, Bradyrhizobium was found to be the dominant N fixation bacteria, and its abundance was higher in the T2 treatment compared to the other treatments. Additionally, the T2 treatment promoted the relative abundance of Conexibacter and Acidothermus, which had been reported to contribute to the host’s health and stress resistance through sulfate shuttle and cellulolytic activity, in addition to their ability to fix N [47]. Moreover, the T2 treatment was also found to facilitate N fixation through Xanthomonas in both the blueberry rhizosphere soil and roots. In blueberry roots, the T2 treatment exhibited the highest relative abundance of N fixation functional bacteria, including Bradyrhizobium, Arthrobacter, Erwinia, Acidothermus, Serratia, and Klebsiella (Figure 6). These bacteria also positively influenced root development and nutrient availability through IAA and siderophore production, which promoted root hair development and enhanced plant stress resistance [60,61]. Moreover, these bacteria played a role in mobilizing inorganic phosphorus in the soil [62,63,64]. The T2 treatment stood out from the other treatments as it also promoted the growth of PGPR, mainly thanks to the addition of rice husk into the blueberry soil. A previous study confirmed that rice husk is rich in bioactive compounds such as phenolic acids and flavonoids, which have various biological effects and can benefit plant growth [65]. Furthermore, the addition of rice husks improves soil aeration and promotes microbial growth and development [66,67,68]. In this paper, compared to the other treatments, the T2 treatment promoted the N fixation functional microbial community in both the blueberry rhizosphere soil and root endophytes. This suggests that the acidified application of rice husks is more beneficial for microbial activity during blueberry growth and development, while also enhancing microbial N fixation ability. Additionally, the acidified application of rice husks influenced the PGPR, while the addition of mushroom chaff affected it differently. The T3 treatment increased the relative abundance of Burholderia and Herbaspirillum, which were the lowest in the T2 treatment in both the blueberry rhizosphere soil and roots. This might be because Burholderia and Herbaspirillum were the diazotrophic bacteria [69], and the TN content was the highest in the T3 treatment. In blueberry roots, Pantoea was the dominant N fixation functional bacteria, and its relative abundance was the highest in the T1 treatment, which had the highest SOM content. A previous study concluded that high organic matter can promote the growth of microorganisms [70,71]. Pantoea was the main dominant endophytic bacteria, and had a significant positive correlation with soil SOM and a negative correlation with pH and TN (Table A4).
At the module level, similar results were obtained, with the relative abundance of the N fixation module being the highest in the T2 treatment in the blueberry rhizosphere soil. Additionally, the T2 treatment led to a decrease in microbial DNRA, denitrification, and complete nitrification (Figure 7). This suggests that the addition of acidified rice husk can increase the content of nitrogen in soil and reduce nitrate leaching loss and N2O emission. These findings are consistent with those of previous studies [72,73,74]. In contrast, the single application of mushroom bran promoted ANRA, DNRA, denitrification, and complete nitrification. These metabolic processes were significantly positively correlated with soil pH and AK, which were the highest in the T3 treatment. Furthermore, the T1 treatment promoted nitrification, and significantly increased the nitrate content. This could be attributed to the presence of Sphingomonas and Pseudonocardia, which are involved in nitrification and exhibited the highest relative abundance in the T1 treatment. In blueberry roots, the T2 treatment had a greater impact on the N cycle compared with the other treatments, including N fixation, ANRA, DNRA, denitrification, and complete nitrification. This indicates that the addition of acidified rice husk can promote N metabolism in blueberry root endophytic microorganisms. In addition, the T3 treatment exerted a different effect on the N cycle in the rhizosphere compared to the roots. In the blueberry roots, the T3 treatment decreased the relative abundance of denitrification and complete nitrification. Although both rice husk and mushroom bran could increase microbial activity, they had different effects on the N cycle. These two soil improvement methods could induce changes in soil properties and plant secondary metabolism. Therefore, we concluded that the addition of acidified rice husk can promote microbial N fixation and reduce the greenhouse gas emission from the blueberry rhizosphere soil. In blueberry roots, the addition of acidified rice husk enhances N metabolism.

5. Conclusions

In this paper, the SOM content was increased after soil improvement. The T2 treatment created optimal conditions for blueberry cultivation by adjusting the rhizosphere soil pH to 5.53. The application of different substances was found to have varying effects on the number and diversity of microorganisms in the blueberry rhizosphere soil and root system. Specifically, the T4 treatment resulted in the highest number and diversity of microorganisms, followed by the T2 treatment, while the T1 treatment had the lowest microbial populations. In the rhizosphere soil, the dominant phyla were identified to be Proteobacteria and Actinobacteria, with the highest relative abundance of Proteobacteria in the T4 treatment and Actinobacteria in the T1 treatment. This trend was reversed in the roots. The T2 treatment significantly influenced Acidobacteria in the rhizosphere soil, where its relative abundance was higher compared to the other treatments. Additionally, correlation network analysis revealed that Acidobacterium and Paludibaculum, both belonging to the Acidobacteria phylum, had the most significant influence on the microbial community structure in the rhizosphere soil. In the blueberry roots, the most influential genus was Mycobacterium, with its highest relative abundance observed in the T4 treatment. Furthermore, pH and SOM were found to have the most significant influence on the bacterial communities in the rhizosphere soil and roots, respectively.
Different soil improvement methods did not change the main functions of microbes, but altered the relative abundance of most functions. In the rhizosphere soil, carbohydrate metabolism was the highest in the T1 treatment, while it was lowest in the T4 treatment. The T2 treatment promoted the abundance of energy metabolism, cellular motility, and functions related to cell growth and death. In the blueberry roots, most changes were observed with the T1 treatment. The dominant nitrogen fixation functional bacteria were Bradyrhizobium and Acidothermus, with the highest relative abundance observed in the T2 treatment in the rhizosphere soil. Moreover, the T2 treatment also had the highest number and relative abundance of nitrogen fixation functional bacteria in the blueberry roots. Additionally, the T2 treatment had the highest relative abundance of nitrogen fixation modules and the lowest abundance of ANRA, DNRA, denitrification, and complete nitrification processes in the blueberry rhizosphere soil.
In summary, it is recommended to use a combination of peat and acidified rice husk for the optimal improvement of soil for blueberry cultivation. However, this paper only compared the effects of different soil improvement methods on blueberry rhizosphere soil and root endophytic microbial communities. The effects on above-ground plant changes and yield under these four improvement methods need further analysis.

Author Contributions

Conceptualization, S.L. and L.W.; methodology, D.W., Q.L. and C.W.; software, Y.L., D.W. and C.W.; resources, S.L. and L.W.; data curation, Y.L.; writing—original draft preparation, Y.L. and S.L.; writing—review and editing, Y.L. and S.L.; visualization, S.L.; supervision, Q.L. and C.W.; project administration, S.L.; funding acquisition, S.L. and L.W. All authors have read and agreed to the published version of the manuscript.

Funding

This work received funding from the Natural Science Foundation of Jilin Province (20210101100JC), Changchun Science and Technology Bureau Project (21ZGN10), Jilin province science and technology development plan project (20200402083NC), and Jingyu County Science and Technology Development Plan Project (XBJ202208).

Data Availability Statement

The data presented in this study are available in the article.

Acknowledgments

We thank Jialu Sun for conducting soil collection and sample pretreatment.

Conflicts of Interest

The authors declare no conflict of interest.

Appendix A

Table A1. Dosage of materials used for each treatment kg/cm3.
PeatSulfurRice HuskMushroom Bran
T11.470.0200
T21.4700.020
T30001.53
T40.74000.77
Table A2. The soil properties after soil improvement.
pHSOM %TN g/kgAP g/kgAK g/kg
5.73 ± 0.01 c9.35 ± 0.38 a3.99 ± 0.11 bc33.60 ± 4.90 a152.53 ± 3.00 a
5.53 ± 0.01 d8.77 ± 0.13 b3.89 ± 0.05 c23.33 ± 2.02 b118.80 ± 6.45 c
6.15 ± 0.00 a7.87 ± 0.06 c4.32 ± 0.01 a23.07 ± 3.05 b154.27 ± 6.72 a
6.13 ± 0.00 b8.61 ± 0.01 b4.12 ± 0.11 b24.20 ± 2.10 b139.00 ± 3.00 b
Note: Data are shown for a total 12 samples from 4 treatments; the lower-case letters ‘a’, ‘b’, ‘c’, and ‘d’ indicate a significant difference (p < 0.05) among different samples for each treatment.
Table A3. The top metabolism pathways in blueberry rhizosphere soil and roots.
SoilT1T2T3T4
Carbohydrate metabolism13.13 ± 0.13 a12.93 ± 0.10 bc12.98 ± 0.06 ab12.80 ± 0.06 c
Amino acid metabolism13.01 ± 0.14 a12.90 ± 0.09 a12.96 ± 0.08 a12.92 ± 0.02 a
Replication and repair4.96 ± 0.03 a4.92 ± 0.03 a4.91 ± 0.03 a4.79 ± 0.04 b
Cell motility2.88 ± 0.06 a2.87 ± 0.04 a2.59 ± 0.05 b2.52 ± 0.10 b
Membrane transport1.57 ± 0.03 b1.54 ± 0.01 c1.57 ± 0.00 b1.61 ± 0.01 a
Environmental adaptation0.16 ± 0.00 a0.16 ± 0.00 a0.16 ± 0.00 a0.16 ± 0.00 a
rootT1T2T3T4
Carbohydrate metabolism13.22 ± 0.36 a13.11 ± 0.27 a12.71 ± 0.27 a12.81 ± 0.24 a
Amino acid metabolism13.31 ± 0.39 a13.53 ± 0.33 a13.88 ± 0.33 a13.19 ± 0.24 a
Replication and repair4.48 ± 0.04 a4.29 ± 0.06 a4.12 ± 0.06 a4.46 ± 0.04 a
Cell motility3.99 ± 0.46 a3.59 ± 0.15 a3.53 ± 0.15 a3.83 ± 0.41 a
Membrane transport2.76 ± 0.27 a2.36 ± 0.11 a2.38 ± 0.11 a2.50 ± 0.16 a
Environmental adaptation0.19 ± 0.01 a0.16 ± 0.02 a0.15 ± 0.02 a0.29 ± 0.00 a
Note: Data are shown for a total 12 samples from 4 treatments; the lower-case letters ‘a’, ‘b’, and ‘c’ indicate a significant difference (p < 0.05) among different samples for each treatment.
Table A4. The correlation coefficients between soil physical–chemical properties and bacterial community in blueberry rhizosphere soil and roots.
pHSOMTNAPAK
soil
Bradyrhizobium−0.580.15−0.54−0.29−0.54
Burkholderia0.81 **−0.76 **0.82 **−0.200.20
Bacillus0.63 *−0.340.510.010.22
Azospirillum−0.20−0.39−0.13−0.63 *−0.54
Rhizobium0.77 **−0.59 *0.68 *−0.090.29
Herbaspirillum0.88 **−0.81 **0.88 **−0.310.34
Rhodopseudomonas0.240.180.170.540.44
Magnetospirillum0.48−0.72 **0.56−0.37−0.02
Enterobacter0.33−0.320.18−0.280.30
Arthrobacter−0.500.62 *−0.460.300.11
Xanthomonas−0.570.25−0.44−0.16−0.41
Klebsiella0.110.18−0.050.500.71 **
Conexibacter−0.72 **0.57−0.63 *0.17−0.20
Acidothermus−0.69 *0.60 *−0.540.34−0.24
Sphingomonas0.260.270.190.480.74 **
Pseudomonas−0.020.500.060.87 **0.55
Ottowia0.37−0.63 *0.50−0.63 *−0.13
root
Pantoea−0.78 **0.97 **−0.77 **0.59 *−0.13
Burkholderia0.40−0.170.420.080.66 *
Bradyrhizobium−0.39−0.01−0.32−0.46−0.30
Herbaspirillum−0.030.27−0.050.340.37
Bacillus0.01−0.160.07−0.26−0.56
Enterobacter−0.530.31−0.54−0.26−0.82 **
Erwinia−0.98 **0.77 **−0.95 **0.10−0.59 *
Serratia−0.550.22−0.058 *−0.45−0.38
Arthrobacter−0.25−0.34−0.21−0.55−0.59 *
Xanthomonas−0.29−0.01−0.17−0.46−0.76 **
Klebsiella−0.360.25−0.37−0.32−0.49
Conexibacter0.080.420.030.230.40
Acidothermus−0.570.19−0.550.05−0.36
Pseudomonas0.72 **−0.550.69 *−0.100.11
Sphingomonas−0.87 **0.83 **−0.76 **0.29−0.51
Note: ‘*’ indicates a significant correlation with p < 0.05 and ‘**’ with p < 0.01 by using the Spearman method (n = 12).
Figure A1. A photograph of the study plot.
Agronomy 14 00125 g0a1
Figure A2. The correlation between soil physical−chemical properties and microbial communities in blueberry rhizosphere soil and roots using redundancy analysis.
Agronomy 14 00125 g0a2
Figure A3. The correlation between metabolism pathways and bacterial phyla. ‘*’ indicates a significant correlation with p < 0.05 and ‘**’ with p < 0.01 by using the Spearman method (n = 12).
Agronomy 14 00125 g0a3

References

  1. Delpino, F.M.; Figueiredo, L.M.; Gonçalves da Silva, T.; Flores, T.R. Effects of blueberry and cranberry on type 2 diabetes parameters in individuals with or without diabetes: A systematic review and meta-analysis of randomized clinical trials. Nutr. Metab. Cardiovas. 2022, 32, 1093–1109. [Google Scholar] [CrossRef]
  2. Basu, A.; Feng, D.; Planinic, P.; Ebersole, J.L.; Lyons, T.J.; Alexander, J.M. Dietary blueberry and soluble fiber supplementation reduces risk of gestational diabetes in women with obesity in a randomized controlled trial. J. Nutr. 2021, 151, 1128–1138. [Google Scholar] [CrossRef]
  3. Stote, K.S.; Wilson, M.M.; Hallenbeck, D.; Thomas, K.; Rourke, J.M.; Sweeney, M.I.; Gottschall-Pass, K.T.; Gosmanov, A.R. Effect of blueberry consumption on cardiometabolic health parameters in men with type 2 diabetes: An 8-week, double-blind, randomized, placebo-controlled trial. Curr. Dev. Nutr. 2020, 4, nzaa030. [Google Scholar] [CrossRef]
  4. Liu, F.; Li, S.; Gao, J.; Cheng, K.; Yuan, F. Changes of terpenoids and other volatiles during alcoholic fermentation of blueberry wines made from two southern highbush cultivars. Lebensm.-Wiss. Technol. 2019, 109, 233–240. [Google Scholar] [CrossRef]
  5. He, L.; Jing, G.; Zhao, N.; Lu, Q.; Zhang, Z.; Chen, Z.; Huang, B.; Ding, X. Soil nutrients and the responses of microbial community structure to pine bark and vinegar residues in blueberry cultivation. Appl. Soil. Ecol. 2023, 189, 104907. [Google Scholar] [CrossRef]
  6. Chen, S.; Zhu, Y.; Shao, T.; Long, X.; Gao, X.; Zhou, Z. Relationship between rhizosphere soil properties and disease severity in highbush blueberry (Vaccinium corymbosum). Appl. Soil. Ecol. 2019, 137, 187–194. [Google Scholar] [CrossRef]
  7. Chen, J.; Ren, R.; Wang, H.; Luo, T.; Yao, X.; Zhang, Z.; Hu, K. Effect of Lou soil pH change on selenium forms and availability. Northwest. Geol. 2020, 53, 254–260. [Google Scholar] [CrossRef]
  8. Xu, J.; Fang, Y.; Tavakkoli, E.; Pan, X.; Liao, F.; Chen, W.; Guo, W. Preferential ammonium: Nitrate ratio of blueberry is regulated by nitrogen transport and reduction systems. Sci. Hortic. 2021, 288, 110345. [Google Scholar] [CrossRef]
  9. Zeng, Q.; Jiang, Y.; Wei, J.; Yu, H. Common problems in the process of blueberry cultivation-soil organic matter improvement is not in place. Fruit Grower’s Friend 2017, 6, 25–26. [Google Scholar]
  10. Wei, H.; Li, G.; Ding, Q. Common problems and solutions of blueberry planting soil management. Fruit Grower’s Friend 2014, 10, 19. [Google Scholar] [CrossRef]
  11. Gagnon, B.; Simard, R.R.; Lalande, R.; Lafond, J. Improvement of soil properties and fruit yield of native lowbush blueberry by papermill sludge addition. Can. J. Soil. Sci. 2003, 83, 1–9. [Google Scholar] [CrossRef]
  12. Naghman, R.; Bhatti, M.T.; Najabat, Z.; Hyder, S.; Rizvi, Z.F.; Gondal, A.S.; Zafar, Z.; Malik, S.; Iqbal, R.; Hafeez, A.; et al. Organic amendments: A natural way to suppress phytopathogens: A sustainable approach to go green. Turk. J. Agric. For. 2023, 47, 602–622. [Google Scholar] [CrossRef]
  13. Ma, Y.; Guo, C.; Xu, C. Progress in research on function, utilization and organic cultivation of blueberry. J. JLIT 2009, 25, 49–54. [Google Scholar]
  14. Sun, J.; Dong, L.; Xu, G.; Shao, H. Effects of furfural and it biocha additions on physcial-chemical characteristics of a sline soil. J. Agro-Environ. Sci. 2014, 33, 532–538. [Google Scholar]
  15. Zhou, X.; Tang, Z.; Bai, H.; Li, J.; Mo, L. Research status and prospect of soil environment on blueberry plant growth and development. J. JLNU 2019, 40, 100–105. [Google Scholar]
  16. Liu, Y.; Li, H. Research on Blueberry Cultivation for Soil Improvement in Shaanxi. SXFST 2019, 47, 48–51. [Google Scholar]
  17. Ochmian, I.; Malinowski, R.; Kubus, M.; Malinowska, K.; Sotek, Z.; Racek, M. The feasibility of growing highbush blueberry (V. corymbosum L.) on loamy calcic soil with the use of organic substrates. Sci. Hortic. 2019, 257, 108690. [Google Scholar] [CrossRef]
  18. Kang, B. Effects of Mixed Application of Natural Soil Improvement Materials and PAM on Soil Physcial and Chemical Properties. Master’s Thesis, Northweat A&F University, Xianyang, China, 2014. [Google Scholar]
  19. Dymov, A.A.; Gorbach, N.M.; Goncharova, N.N.; Karpenko, L.V.; Gabov, D.N.; Kutyavin, I.N.; Startsev, V.V.; Mazur, A.S.; Grodnitskaya, I.D. Holocene and recent fires influence on soil organic matter, microbiological and physico-chemical properties of peats in the European North-East of Russia. Catena 2022, 217, 106449. [Google Scholar] [CrossRef]
  20. Tian, X. Effects of Soil Compaction on Sulfur Metabolism of Yong Apple Tree and Improvement of Rice Husk Biochar. Master’s Thesis, Shandong Agriculture University, Tai’an, China, 2023. [Google Scholar]
  21. Chen, H. Research on the Recycle Unilization of Spent Mushroom Substrates. Master’s Thesis, Chinese Academy of Agricultural Sciences, Beijing, China, 2009. [Google Scholar]
  22. Chen, Y.; Xie, Y.; Zhou, H.; Chen, F.; Liu, Y.; Chen, Q. Effects of different organic materials mulching on jasmine flower and its soil. Mod. Horticult. 2022, 45, 10–11. [Google Scholar]
  23. Lin, B. Effecting of spent mushroom sunstrates (SMS) and biogas residue on improving navel orange production and its fruit quality. Fujian J. Agric. Sci. 2006, 21, 293–295. [Google Scholar] [CrossRef]
  24. Yurgel, S.N.; Douglas, G.M.; Dusault, A.; Percival, D.; Langille, M.G.I. Dissecting community structure in wild blueberry root and soil microbiome. Front. Microbiol. 2018, 9, 1187. [Google Scholar] [CrossRef] [PubMed]
  25. Jia, J.; Zhang, J.; Li, Y.; Koziol, L.; Podzikowski, L.; Delgado-Baquerizo, M.; Wang, G.; Zhang, J. Relationships between soil biodiversity and multifunctionality in croplands depend on salinity and organic matter. Geoderma 2023, 429, 116273. [Google Scholar] [CrossRef]
  26. Guo, X.; Wan, Y.; Shakeel, M.; Wang, D.; Xiao, L. Effect of mycorrhizal fungi inoculation on bacterial diversity, community structure and fruit yield of blueberry. Rhizosphere 2021, 19, 100360. [Google Scholar] [CrossRef]
  27. Zhou, D.; Sun, R.; Zhu, W.; Shi, Y.; Ni, S.; Wu, C.; Li, T. Impact of dielectric barrier discharge cold plasma on the quality and phenolic metabolism in blueberries based on metabonomic analysis. Postharvest Biol. Technol. 2023, 197, 112208. [Google Scholar] [CrossRef]
  28. Wang, Y.; Zhao, M.; Zheng, H. Research progress on plant endophytic nitrogen-fixing bacteria and their nitrogen fixation mechanism. Mod. Horticult. 2022, 12, 17–26. [Google Scholar] [CrossRef]
  29. Orozco-Mosqueda, M.d.C.; Santoyo, G. Plant-microbial endophytes interactions: Scrutinizing their beneficial mechanisms from genomic explorations. Curr. Plant Biol. 2021, 25, 100189. [Google Scholar] [CrossRef]
  30. Tan, Y.; Wang, J.; He, Y.; Yu, X.; Chen, S.; Penttinen, P.; Liu, S.; Yang, Y.; Zhao, K.; Zou, L. Organic fertilizers shape soil microbial communities and increase soil amino acid metabolites content in a blueberry orchard. Microb. Ecol. 2022, 85, 234–246. [Google Scholar] [CrossRef]
  31. Chamkhi, I.; Sbabou, L.; Aurag, J. Improved growth and quality of saffron (Crocus sativus L.) in the field conditions through inoculation with selected native plant growth-promoting rhizobacteria (PGPR). Ind. Crop Prod. 2023, 197, 116606. [Google Scholar] [CrossRef]
  32. Khan, A.; Bano, A.; Khan, R.A.; Khan, N. Role of PGPR in suppressing the growth of Macrophomina phaseolina by regulating antioxidant enzymes and secondary metabolites in Vigna radiata (L.) R. Wilczek. S. Afr. J. Bot. 2023, 158, 443–451. [Google Scholar] [CrossRef]
  33. Castillo, P.; Molina, R.; Andrade, A.; Vigliocco, A.; Alemano, S.; Cassán, F.D. Phytohormones and other plant growth regulators produced by PGPR: The genus Azospirillum. In Handbook for Azospirillum; Springer International Publishing: Cham, Switzerland, 2015; pp. 115–138. [Google Scholar] [CrossRef]
  34. Khan, A.L.; Halo, B.A.; Elyassi, A.; Ali, S.; Al-Hosni, K.; Hussain, J.; Al-Harrasi, A.; Lee, I.-J. Indole acetic acid and ACC deaminase from endophytic bacteria improves the growth of Solanum lycopersicum. Electron. J. Biotechnol. 2016, 21, 58–64. [Google Scholar] [CrossRef]
  35. Gou, Z.; Zheng, H.; He, Z.; Su, Y.; Chen, S.; Chen, H.; Chen, G.; Ma, N.L.; Sun, Y. The combined action of biochar and nitrogen-fixing bacteria on microbial and enzymatic activities of soil N cycling. Environ. Pollut. 2023, 317, 120790. [Google Scholar] [CrossRef] [PubMed]
  36. Shi, M.; Zhao, X.; Zhu, L.; Wu, J.; Mohamed, T.A.; Zhang, X.; Chen, X.; Zhao, Y.; Wei, Z. Elucidating the negative effect of denitrification on aromatic humic substance formation during sludge aerobic fermentation. J. Hazard. Mater. 2020, 388, 122086. [Google Scholar] [CrossRef] [PubMed]
  37. Wang, K.; Wu, Y.; Wang, Z.; Wang, W.; Ren, N. Insight into effects of electro-dewatering pretreatment on nitrous oxide emission involved in related functional genes in sewage sludge composting. Bioresour. Technol. 2018, 265, 25–32. [Google Scholar] [CrossRef] [PubMed]
  38. Zainudin, M.H.; Mustapha, N.A.; Maeda, T.; Ramli, N.; Sakai, K.; Hassan, M. Biochar enhanced the nitrifying and denitrifying bacterial communities during the composting of poultry manure and rice straw. Waste Manag. 2020, 106, 240–249. [Google Scholar] [CrossRef] [PubMed]
  39. Li, Y.; Wang, C.; Wu, J.; Zhang, Y.; Li, Q.; Liu, S.; Gao, Y. The effects of localized plant-soil-microbe interactions on soil nitrogen cycle in maize rhizosphere soil under long-term fertilizers. Agronomy 2023, 13, 2114. [Google Scholar] [CrossRef]
  40. Zhou, Y.; Liu, Y.; Zhang, X.; Gao, X.; Shao, T.; Long, X.; Rengel, Z. Effects of Soil Properties and Microbiome on Highbush Blueberry (Vaccinium corymbosum) Growth. Agronomy 2022, 12, 1263. [Google Scholar] [CrossRef]
  41. Darnell, R.L.; Casamali, B.; Williamson, J.G. Nutrient assimilation in southern highbush blueberry and implications for the field. HortTechnology 2015, 25, 460–463. [Google Scholar] [CrossRef]
  42. Yang, H.; Wu, Y.; Zhang, C.; Wu, W.; Lyu, L.; Li, W. Growth and physiological characteristics of four blueberry cultivars under different high soil pH treatments. Environ. Exp. Bot. 2022, 197, 104842. [Google Scholar] [CrossRef]
  43. Jiang, Y.; Zeng, Q.; Wei, J.; Jiang, J.; Yu, H. Growth, fruit yield, photosynthetic characteristics, and leaf microelement concentration of two blueberry cultivars under different long-term soil pH treatments. Agronomy 2019, 9, 357. [Google Scholar] [CrossRef]
  44. Yan, J. Effects of Different Fertilizers on Physiological and Fruit Quality of Blueberry. Master’s Thesis, Guizhou University, Guiyang, China, 2018. [Google Scholar]
  45. Aqeel, M.; Ran, J.; Hu, W.; Irshad, M.K.; Dong, L.; Akram, M.A.; Eldesoky, G.E.; Aljuwayid, A.M.; Chuah, L.F.; Deng, J. Plant-soil-microbe interactions in maintaining ecosystem stability and coordinated turnover under changing environmental conditions. Chemosphere 2023, 318, 137924. [Google Scholar] [CrossRef]
  46. Wu, H.; Wang, L.; Kang, L.; Liu, C.; Li, M. Study on the effect of planting pattern adjustment on the growth of kiwifruit inter-root microorganisms and fruit quality. Turk. J. Agric. For. 2023, 47, 263–272. [Google Scholar] [CrossRef]
  47. Jiang, Y.; Li, S.; Li, R.; Zhang, J.; Liu, Y.; Lv, L.; Zhu, H.; Wu, W.; Li, W. Plant cultivars imprint the rhizosphere bacterial community composition and association networks. Soil. Biol. Biochem. 2017, 109, 145–155. [Google Scholar] [CrossRef]
  48. Khan, A.; Ding, Z.; Ishaq, M.; Khan, I.; Ahmed, A.A.; Khan, A.Q.; Guo, X. Applications of beneficial plant growth promoting rhizobacteria and mycorrhizae in rhizosphere and plant growth: A review. Int. J. Agric. Biol. Eng. 2020, 13, 199–208. [Google Scholar] [CrossRef]
  49. Robinson, R.J.; Fraaije, B.A.; Clark, I.M.; Jackson, R.W.; Hirsch, P.R.; Mauchline, T.H. Endophytic bacterial community composition in wheat (Triticum aestivum) is determined by plant tissue type, developmental stage and soil nutrient availability. Plant Soil 2015, 405, 381–396. [Google Scholar] [CrossRef]
  50. Ma, Y.; Weisenhorn, P.; Guo, X.; Wang, D.; Yang, T.; Shi, Y.; Zhang, H.; Chu, H. Effect of long-term fertilization on bacterial communities in wheat endosphere. Pedosphere 2021, 31, 538–548. [Google Scholar] [CrossRef]
  51. Chen, J.; Dai, J.; Song, X.; Jiang, Q.; Zhao, C.; Sun, C.; Chen, C.; Chen, N.; Han, B. Endophytic microbiota comparison of Dendrobium huoshanense root and stem in different growth years. Planta Med. 2020, 86, 967–975. [Google Scholar] [CrossRef] [PubMed]
  52. Zhao, R.; Zheng, S.; Hu, Y.; Li, H.; Chen, Y.; Chun, Z. Endophytic bacterial diversity of the medicinal orchid Dendrobium nobile. S. Afr. J. Bot. 2023, 158, 90–97. [Google Scholar] [CrossRef]
  53. Ma, S.; Verheyen, K.; Props, R.; Wasof, S.; Vanhellemont, M.; Boeckx, P.; Boon, N.; De Frenne, P. Plant and soil microbe responses to light, warming and nitrogen addition in a temperate forest. Funct. Ecol. 2018, 32, 1293–1303. [Google Scholar] [CrossRef]
  54. Du, X.; Hu, H.; Wang, T.; Zou, L.; Zhou, W.; Gao, H.; Ren, X.; Wang, J.; Hu, S. Long-term rice cultivation increases contributions of plant and microbial-derived carbon to soil organic carbon in saline-sodic soils. Sci. Total Environ. 2023, 904, 166713. [Google Scholar] [CrossRef]
  55. Hu, Q.; Jiang, T.; Thomas, B.W.; Chen, J.; Xie, J.; Hu, Y.; Kong, F.; Yang, Y.; Chen, X.; Zhang, Y.; et al. Legume cover crops enhance soil organic carbon via microbial necromass in orchard alleyways. Soil Till. Res. 2023, 234, 105858. [Google Scholar] [CrossRef]
  56. Mir, I.R.; Rather, B.A.; Sehar, Z.; Masood, A.; Khan, N.A. Nitric oxide in co-ordination with nitrogen reverses cadmium-inhibited photosynthetic activity by interacting with ethylene synthesis, strengthening the antioxidant system, and nitrogen and sulfur assimilation in mustard (Brassica juncea L.). Sci. Hortic. 2023, 314, 111958. [Google Scholar] [CrossRef]
  57. Dey, S.; Kundu, R.; Gopal, G.; Mukherjee, A.; Nag, A.; Paul, S. Enhancement of nitrogen assimilation and photosynthetic efficiency by novel iron pulsing technique in Oryza sativa L. var Pankaj. Plant Physiol. Biochem. 2019, 144, 207–221. [Google Scholar] [CrossRef] [PubMed]
  58. Das, P.P.; Singh, K.R.; Nagpure, G.; Mansoori, A.; Singh, R.P.; Ghazi, I.A.; Kumar, A.; Singh, J. Plant-soil-microbes: A tripartite interaction for nutrient acquisition and better plant growth for sustainable agricultural practices. Environ. Res. 2022, 214, 113821. [Google Scholar] [CrossRef] [PubMed]
  59. Cid-Pérez, T.S.; Nevárez-Moorillón, G.V.; Ochoa-Velasco, C.E.; Navarro-Cruz, A.R.; Hernández-Carranza, P.; Avila-Sosa, R. The relation between drying conditions and the development of volatile compounds in saffron (Crocus sativus). Molecules 2021, 26, 6954. [Google Scholar] [CrossRef] [PubMed]
  60. Hanif, M.K.; Malik, K.A.; Hameed, S.; Saddique, M.J.; Ayesha; Fatima, K.; Naqqash, T.; Majeed, A.; Iqbal, M.J.; Imran, A. Growth stimulatory effect of AHL producing Serratia spp. from potato on homologous and non-homologous host plants. Microbiol. Res. 2020, 238, 126506. [Google Scholar] [CrossRef]
  61. Chakraborty, S.; Das, S.; Banerjee, S.; Mukherjee, S.; Ganguli, A.; Mondal, S. Heavy metals bio-removal potential of the isolated Klebsiella sp TIU20 strain which improves growth of economic crop plant (Vigna radiata L.) under heavy metals stress by exhibiting plant growth promoting and protecting traits. Biocatal. Agric. Biotechnol. 2021, 38, 102204. [Google Scholar] [CrossRef]
  62. Benizri, E.; Kidd, P.S. The Role of the Rhizosphere and Microbes Associated with Hyperaccumulator Plants in Metal Accumulation. In Agromining, Farming for Metals; Springer International Publishing: Cham, Switzerland, 2018; pp. 157–188. [Google Scholar]
  63. Widdig, M.; Schleuss, P.M.; Weig, A.; Guhr, A.; Spohn, M. Nitrogen and Phosphorus additions alter the abundance of phosphorus-solubilizing bacteria and phosphatase activity in grassland soils. Front. Environ. Sci. 2019, 7, 00158. [Google Scholar] [CrossRef]
  64. Sharma, S.B.; Sayyed, R.Z.; Trivedi, M.H.; Gobi, T.A. Phosphate solubilizing microbes: Sustainable approach for managing phosphorus deficiency in agricultural soils. Springerplus 2013, 2, 587. [Google Scholar] [CrossRef]
  65. Kaur, S.; Ubeyitogullari, A. Extraction of phenolic compounds from rice husk via ethanol-water-modified supercritical carbon dioxide. Heliyon 2023, 9, e14196. [Google Scholar] [CrossRef]
  66. Alitaleshi, F.; Daghbandan, A.; Pendashteh, A. Performance of rice husk biocarrier on ammonia nitrogen removal in the MBBR treating aquaculture wastewater using biological attached growth process: Performance and kinetic study. J. Environ. Chem. Eng. 2023, 12, 111446. [Google Scholar] [CrossRef]
  67. Saqib Rashid, M.; Liu, G.; Yousaf, B.; Song, Y.; Ahmed, R.; Rehman, A.; Arif, M.; Irshad, S.; Cheema, A.I. Efficacy of rice husk biochar and compost amendments on the translocation, bioavailability, and heavy metals speciation in contaminated soil: Role of free radical production in maize (Zea mays L.). J. Clean. Prod. 2022, 330, 129805. [Google Scholar] [CrossRef]
  68. Duan, H.; Ji, M.; Chen, A.; Zhang, B.; Shi, J.; Liu, L.; Li, X.; Sun, J. Evaluating the impact of rice husk on successions of bacterial and fungal communities during cow manure composting. Environ. Technol. Innov. 2021, 24, 102084. [Google Scholar] [CrossRef]
  69. Montañez, A.; Blanco, A.R.; Barlocco, C.; Beracochea, M.; Sicardi, M. Characterization of cultivable putative endophytic plant growth promoting bacteria associated with maize cultivars (Zea mays L.) and their inoculation effects in vitro. Appl. Soil. Ecol. 2012, 58, 21–28. [Google Scholar] [CrossRef]
  70. Li, Q.; Koyama, M.; Nakasaki, K. Effect of storage time on organic matter decomposition during composting by inoculating enriched microorganisms. Environ. Technol. Innov. 2023, 29, 102984. [Google Scholar] [CrossRef]
  71. Li, Q.; Zhang, D.; Song, Z.; Ren, L.; Jin, X.; Fang, W.; Yan, D.; Li, Y.; Wang, Q.; Cao, A. Organic fertilizer activates soil beneficial microorganisms to promote strawberry growth and soil health after fumigation. Environ. Pollut. 2022, 295, 118653. [Google Scholar] [CrossRef]
  72. Liu, Q.; Wu, Y.; Ma, J.; Jiang, J.; You, X.; Lv, R.; Zhou, S.; Pan, C.; Liu, B.; Xu, Q.; et al. How does biochar influence soil nitrification and nitrification-induced N2O emissions? Sci. Total Environ. 2023, 908, 168530. [Google Scholar] [CrossRef]
  73. Iboko, M.P.; Dossou-Yovo, E.R.; Obalum, S.E.; Oraegbunam, C.J.; Diedhiou, S.; Brümmer, C.; Témé, N. Paddy rice yield and greenhouse gas emissions: Any trade-off due to co-application of biochar and nitrogen fertilizer? A systematic review. Heliyon 2023, 9, e22132. [Google Scholar] [CrossRef]
  74. Lee, S.I.; Park, H.J.; Jeong, Y.J.; Seo, B.S.; Kwak, J.H.; Yang, H.I.; Xu, X.; Tang, S.; Cheng, W.; Lim, S.S.; et al. Biochar-induced reduction of N2O emission from East Asian soils under aerobic conditions: Review and data analysis. Environ. Pollut. 2021, 291, 118154. [Google Scholar] [CrossRef]
Figure 1. The relative abundance of the bacterial community in the blueberry rhizosphere soil and roots at the phylum level under different soil improvement methods.
Agronomy 14 00125 g001
Figure 2. The network of top 20 genera in blueberry rhizosphere soil and roots under different soil improvement methods. The red line indicates a positive correlation, and the blue line indicates a negative correlation, and the thicker the line, the stronger the correlation.
Agronomy 14 00125 g002
Figure 3. The effects of different improvement methods on the bacterial community in the blueberry rhizosphere soil and roots using Bray–Curtis tree analysis.
Agronomy 14 00125 g003
Figure 4. The significantly changed metabolism pathways (p < 0.05) in the blueberry soil and roots under different soil improvement methods. The lower-case letters ‘a’, ‘b’, and ‘c’ indicate a significant difference (p < 0.05) among different samples for each treatment.
Agronomy 14 00125 g004
Figure 5. The correlation between metabolism pathways and soil physical–chemical properties. ‘*’ indicate a significant correlation per p < 0.05, ‘**’ per p < 0.01 and ‘***’ per p < 0.001 by using spearman method (n = 12).
Agronomy 14 00125 g005
Figure 6. Functional bacteria related to the N cycle in the blueberry rhizosphere soil and roots.
Agronomy 14 00125 g006
Figure 7. The effects of soil improvement methods on the N cycle at the module level in the blueberry rhizosphere soil and roots.
Agronomy 14 00125 g007
Table 1. OTU number and bacterial community diversity in the blueberry rhizosphere soil and roots under different soil improvement methods.
OTUsChao1PD Whole TreeShannonSimpson
SoilT15234.50 ± 25.50 c5889.93 ± 20.49 c418.11 ± 57.77 c9.45 ± 0.41 c0.99 ± 0.00 b
T26700.33 ± 427.10 b7536.67 ± 400.84 b545.94 ± 40.10 b10.13 ± 0.13 b1.00 ± 0.00 a
T36338.50 ± 76.50 b7285.38 ± 43.22 b501.63 ± 6.93 b10.59 ± 0.17 a1.00 ± 0.00 a
T47801.67 ± 395.32 a8471.72 ± 321.61 a653.56 ± 30.22 a10.68 ± 0.01 a1.00 ± 0.00 a
RootT1544.50 ± 42.50 c530.56 ± 122.39 c61.32 ± 9.24 b4.60 ± 0.20 a0.90 ± 0.03 a
T2720.67 ± 35.92 b830.55 ± 39.66 b82.07 ± 1.49 a5.56 ± 0.52 a0.94 ± 0.03 a
T3543.67 ± 80.75 c728.38 ± 7.68 bc64.08 ± 0.30 b4.22 ± 1.19 a0.90 ± 0.04 a
T41113.50 ± 57.50 a1084.01 ± 168.38 a84.40 ± 7.60 a5.43 ± 0.36 a0.88 ± 0.07 a
Note: Data are shown for a total of 12 samples from 4 treatments × 3 replications; the lower-case letters ‘a’, ‘b’, and ‘c’ indicate a significant difference (p < 0.05) among different samples for each treatment.
Table 2. The correlation coefficients between soil physical–chemical properties and N metabolism pathway.
pHSOMTNAPAK
soil
Nitrogen fixation−0.14−0.39−0.05−0.57−0.52
Assimilatory nitrate reduction0.19−0.380.28−0.340.189
Dissimilatory nitrate reduction0.69 *−0.380.67 *−0.010.67 *
Denitrification0.61 *−0.240.62 *0.140.66 *
Nitrification0.28−0.080.160.050.59 *
Complete nitrification0.88 **−0.59 *0.86 **−0.080.62 *
root
Nitrogen fixation−0.02−0.480.03−0.82 **−0.45
Assimilatory nitrate reduction−0.33−0.18−0.18−0.43−0.57
Dissimilatory nitrate reduction−0.11−0.38−0.10−0.48−0.69 *
Denitrification−0.320.03−0.43−0.13−0.22
Nitrification0.02−0.03−0.060.18−0.11
Complete nitrification−0.400.69 *−0.460.49−0.02
Note: ‘*’ indicates a significant correlation with p < 0.05 and ‘**’ with p < 0.01 by using the Spearman method (n = 12).
Disclaimer/Publisher’s Note: The statements, opinions and data contained in all publications are solely those of the individual author(s) and contributor(s) and not of MDPI and/or the editor(s). MDPI and/or the editor(s) disclaim responsibility for any injury to people or property resulting from any ideas, methods, instructions or products referred to in the content.

