Article

Early Mapping Method for Different Planting Types of Rice Based on Planet and Sentinel-2 Satellite Images

1
School of Geomatics and Prospecting Engineering, Jilin Jianzhu University, Changchun 130118, China
2
State Key Laboratory of Black Soils Conservation and Utilization, Northeast Institute of Geography and Agroecology, Chinese Academy of Sciences, Changchun 130102, China
3
School of Agricultural, Jilin Agricultural University, Changchun 130118, China
4
School of Information Technology, Jilin Agricultural University, Changchun 130118, China
*
Author to whom correspondence should be addressed.
Agronomy 2024, 14(1), 137; https://doi.org/10.3390/agronomy14010137
Submission received: 11 December 2023 / Revised: 28 December 2023 / Accepted: 31 December 2023 / Published: 4 January 2024
(This article belongs to the Special Issue Application of Remote Sensing and GIS Technology in Agriculture)

Abstract

:
In Northeast China, transplanted rice cultivation has been adopted to extend the rice growing season and boost yields, responding to the limitations of the cumulative temperature zone and high food demand. However, direct-seeded rice offers advantages in water conservation and labour efficiency. The precise and timely monitoring of the distribution of different rice planting types is key to ensuring food security and promoting sustainable regional development. This study explores the feasibility of mapping various rice planting types using only early-stage satellite data from the rice growing season. We focused on Daxing Farm in Fujin City, Jiamusi City, Heilongjiang Province, for cropland plot extraction using Planet satellite imagery. Utilizing Sentinel-2 satellite imagery, we analysed the differences in rice’s modified normalized difference water index (MNDWI) during specific phenological periods. A multitemporal Gaussian mixture model (GMM) was developed, integrated with the maximum expectation algorithm, to produce binarized classification outcomes. These results were employed to detect surface changes and map the corresponding rice cultivation types. The probability of various rice cultivation types within arable plots was quantified, yielding a plot-level rice-cultivation-type mapping product. The mapping achieved an overall accuracy of 91.46% in classifying rice planting types, with a Kappa coefficient of 0.89. The area extraction based on arable land parcels showed a higher R2 by 0.1109 compared to pixel-based area extraction and a lower RMSE by 0.468, indicating more accurate results aligned with real statistics and surveys, thus validating our study’s method. This approach, not requiring labelled samples or many predefined parameters, offers a new method for rapid and feasible mapping, especially suitable for direct-seeded rice areas in Northeast China. It fills the gap in mapping rice distribution for different planting types, supporting water management in rice fields and policies for planting-method changes.

1. Introduction

Rice is one of the world’s most important crops, serving as an essential food source for more than half the world’s population [1,2]. As the largest water-consuming crop, rice cultivation significantly impacts global water security due to its water-use efficiency [3]. Moreover, flooded rice fields constitute the primary source of greenhouse-gas methane emissions. Consequently, rice-field water management has emerged as a prospective solution for mitigating greenhouse gas emissions [4,5]. Rice cultivation is facing challenges, so farmers worldwide are turning to water-saving, labour-saving, direct-seeded rice.
In Northeast China, owing to light and temperature restrictions and the high demand for food, a land preparation, soaking, and transplanting method of rice cultivation has been implemented to extend the rice production period and increase yields. However, this method is labour-, water-, and energy-intensive. Given the increasing scarcity of these resources, rice cultivation becomes less profitable. These factors have led to a shift in planting methods, specifically from nursery transplantation to direct sowing, to achieve sustainable development compatible with the resource environment [6]. The effective monitoring of the distribution of rice planting among different types is crucial for ensuring food security and addressing environmental concerns related to water resource utilisation and climate change [7].
Traditional methods for gathering data on the distribution and extent of rice cultivation involve statistical reporting and field surveys. However, remote sensing technology is a more efficient and cost-effective option for mapping and monitoring rice on a large scale and over a long period. This method offers extensive coverage, a brief detection period, and low costs [8]. Rice mapping often utilises optical and synthetic aperture radar (SAR) data [9]. Optical images are subject to constraints such as cloud cover, rain, and light, leading to a dearth of useful observation images during the critical rice growth period. Conversely [10], SAR is not impacted by light or climatic conditions, enabling continual observation of the ground throughout the day and under all weather conditions. Nevertheless, radar-received echo signals are often noise-prone, which reduces the accuracy of the ground object classification [11].
Rice mapping techniques using satellite remote sensing data can be classified into three categories. The initial type utilises multitemporal observation data merged with phenological characteristics, enabling automated extraction of rice planting information without the need for frequent field investigation or the manual selection of training samples. Some researchers study rice-specific stages (e.g., transplanting or early stages of crop and surface water mixing), which can be identified by constructing time series of the land surface water content index (LSWI), enhanced vegetation index (EVI), and normalised difference vegetation index (NDVI) to identify rice [12,13]. Some researchers used temperature to define the time window for rice transplanting in Northeast China and produced a 30 m map of rice distribution in Northeast Asia based on Landsat OLI 8 data by detecting the moisture signals from rice fields [14,15]. In addition to using the images of the rice flooding stage, some researchers introduced a new phenological index, integrated the time series signals of the rice transplanting and tillering stage, and effectively carried out rice mapping [16]. The second category is based on individual observations and machine learning classifiers; it has no constraints regarding the specific stage of the image input, but it requires the collection of samples that are trained to extract features. The researchers used a range of machine learning models such as maximum likelihood (MLE) [17], support vector machine (SVM) [18], iterative self-organising data analysis techniques algorithm (ISODAT) [19], random forest (RF) [1], and neural network (NN) [20,21]. However, the utilisation of machine learning methods requires a large number of training samples to obtain optimal models. Addressing the problem of sample scarcity in the context of machine-learning-based rice mapping remains a difficult task. The third category is centred on deep learning to address this type of problem, as conventional machine learning models cannot extract deep features from remote sensing image types. Deep learning models utilizing multiple hidden layers and the innovative architecture of deep convolutional neural networks (DCNNs) deliver sufficient model complexity to facilitate the learning of deep features. Deep learning has found widespread application in land use, land-cover mapping, change detection, cloud mask detection, and other areas [22,23,24]. Researchers have employed multitemporal Landsat OLI 8 images, alongside phenological and surface temperature data, to extract the distribution of rice in Dongting Lake through CNN [25]. Other researchers constructed a full-resolution grid (FR-Net) model composed of multiresolution fusion units (MRFUs) based on residual units, and rice mapping in northeast China was performed based on Landsat OLI 8 imagery [26]. Although there have been numerous previous studies on rice mapping, many of them have solely extracted the distribution of rice cultivation. Additionally, certain researchers have classified rice into categories such as early, middle, and late rice, as well as single-season and double-season rice for extraction [27,28]. There is currently no comprehensive mapping of the various types of rice cultivation, and the distribution information is invaluable. Typically, crop-distribution mapping involves extracting and analysing long-term indices or image data, yet this may not offer timely reference information for early rice production situations. This can pose challenges for government departments, insurance companies, and individual farmers in managing extreme events and assessing production losses [8].
The objectives of this study were (1) to extract the cultivated land plots in the study area to generate plot-level land vector products, (2) to perform multitemporal Gaussian mixture model segmentation based on the selected modified normalised difference water index (MNDWI), and (3) to analyse the planting types in different areas for rice mapping based on the change detection of the multitemporal segmentation results.

2. Materials and Methods

In order to study the distribution of different planting types of rice, we firstly use the Planet satellite for cultivated land parcel extraction. Then, we construct the time series curve of the water body index of each crop type for a whole year through Sentinel-2 multispectral data, select the early critical time phase to calculate the water body index to input to the Gaussian mixture model, obtain the segmentation result to detect the changes and construct the different planting types of rice extracted by the model, and quantify the probability of planting each type of rice for each arable land plot object. Finally, we generate maps of different planting types of rice at the plot scale. The flowchart of this study is shown in Figure 1.

2.1. Study Area

Daxing Farm is located southeast of Fujin City in Heilongjiang Province, nestled within the Sanjiang Plain. It is near both the Naoli River and Qixing River, positioned within the triangular area where these two rivers converge. The latitude and longitude of Daxing Farm vary between 132°75′, 133°25′ E, and 46°84′, 47°18′ N (Figure 2a). The terrain is of a higher elevation in the west and lower in the east, with a high central region and lower areas in the north and south. The farm is in a region with a medium-temperate continental monsoon climate, characterized by less rainfall and winds during spring, short and hot summers, rainy autumns, and long winters. The farm site receives an annual mean precipitation of 525 mm with an average temperature of 2.1 °C. The frost-free period extends to 130 days with temperatures equal to or greater than 10 °C. The annual effective accumulated temperature is 2390 °C, with annual sunshine hours of 2023 h, classifying it within the lower limit of the third accumulated temperature zone. The farm possesses abundant water resources. The total surface water resources amount to 120.83 million m3, with 46 million m3 of available surface water and 108.74 million m3 of exploitable groundwater. The shallowest water level of groundwater is 2.25–7.58 m deep, ideal for rice, soybean, and corn cultivation. Daxing Farm has a total area of 80,000 hectares, of which 51,467 hectares is cultivated land, including 26,734 hectares of rice and 24,733 hectares of soybean and corn. The main crops are typically planted during the spring season (April to May) and harvested in the autumn (September to October). For detailed information regarding the cultivation schedule and irrigation techniques of the main crops in the research location, refer to Figure 3.

2.2. Data Acquisition and Preprocessing

2.2.1. Ground Truth and Validation Data

The samples of this study were field driving surveys in the summer of 2022. A total of 37 direct-seeded rice plots were surveyed in the field. The planting range of these plots was delineated using Google Earth images and GPS toolbox software (version 2.6.41), while information such as planting methods and rice-field water management methods were recorded. Additionally, there were 231 live broadcast plot locations and planting methods provided by the farm management district. However, the survey yielded only 95 sample points for transplanted rice and 96 for dry fields. This included 55 soybean and 41 maize sample points, but these did not involve delineating the planting area (Figure 2b). Photographs of rice with different planting types are presented in Figure 2e–h. To ensure a sufficient number and quality of samples for classification and accuracy validation, spatial filtering based on a 30 × 30 m square buffer was employed. This approach established validation regions for each field-survey sample point. Similarly, the same spatial filtering method was applied to the nonmarginal areas of the plots selected from the surveyed direct-seeded rice plots to eliminate potential uncertainties. For accuracy assessment purposes, only buffers with pure image elements and clear land-cover information were considered valid regions of interest (ROIs) [15].

2.2.2. Satellite Imagery and Product Data

This study used Sentinel-2 MSI, Planet commercial imagery, NASADEM (Figure 2c), and GFSAD Global Cropland Extent Product (GCEP). The GEE cloud computing platform was utilized for online access and processing of Sentinel-2 MSI, NASADEM, and GCEP data. Planet commercial imagery can be obtained at www.planet.com, accessed on 5 August 2022. Furthermore, the annual China Land Cover Dataset (CLCD) was sourced from http://doi.org/10.5281/zenodo.4417809, accessed on 28 December 2023, with updates available as of 2022. Sentinel-2 MSI optical remote sensing data are a Level-1C product that have undergone atmospheric and geometric correction. These data include 13 channels, covering visible to near-infrared and short-wave infrared bands, featuring a spatial resolution of 10 m and a temporal resolution of 5 days. The Planet image was taken on 13 July 2022. The Planet satellite has four different spectral bands—red, green, blue, and near-infrared—and the spatial resolution of the image is 3.5 m. NASADEM is a global 30 m resolution DEM dataset released in February 2020 by the National Aeronautics and Space Administration (NASA). The Global Food Security Support Analysis Data (GFSAD) data product provides global 2015 cropland extent data at 30 m resolution.

2.2.3. Data Processing

The commercial images of the planet underwent radiometric and geometric correction, as well as mosaic stitching. For this study, only additional atmospheric correction and radiometric matching processing were necessary. The data underwent atmospheric correction using the Flassh Atmospheric Correction function in ENVI 5.6 software. Radiometric calibration was then applied for further radiometric correction. Control points were selected based on Sentinel-2 imagery, and georeferencing was performed using ArcGIS 10.6 software. The georeferencing module is utilised to georeference the corrected planet image. In the GEE platform, which is used for processing Sentinel-2 remote sensing data, the quality assessment (QA) band has already identified the cloud image elements. As a result, these elements are not involved in the subsequent processing in this study. The time series data underwent temporal filtering using the Savitzky-Golay (SG) filtering method for temporal noise reduction. The sliding window in the SG filtering is set to 7.

2.3. Feature Extraction

2.3.1. Extraction of Cultivated Land

Daxing Farm is part of a state farm featuring land developed into high-standard cultivated land. As a result, the cultivated land is relatively concentrated, generally regular in shape, and exhibits fewer instances of fine fragmentation. Furthermore, the high-resolution Planet imagery provides clearer and richer ground details, thereby enhancing the extraction of cultivated land. To maximize the accuracy of the extracted plots, we initially applied a mask of cropland extent products to the high-resolution Planet satellite image. Subsequently, a Canny edge detection process was applied to the cropland range image [29]. This process entails reducing image noise through Gaussian filtering, calculating gradient values and directions, filtering nonmaximum values, and ultimately detecting and connecting edges using the double-thresholding method. These steps are essential in capturing rich structural information on the edges of the cultivated land. Based on this information, multiscale image segmentation is then performed to form cultivated land patches. The purpose of segmentation is to divide the image into meaningful objects with spatiotemporal characteristics. The multiscale segmentation algorithm is based on the multiscale features of remote sensing images, such as spectrum and texture. It performs the bottom-up clustering of images based on pixel values’ similarity and shape factors to form meaningful and nonoverlapping image objects within the scale range. To address issues of fragmentation, isolated points, breakpoints, holes, and burrs in the segmented object, we employ morphological algorithms to optimize the segmentation results, thereby producing refined cultivated land vector products [30].

2.3.2. Extraction of Phenological Features

Selecting the appropriate spectral index significantly enhances the spectral separability of rice and other ground objects during various phenological stages. Hence, it is crucial to consider the different phenological stages of rice when selecting the corresponding spectral index. Transplanted rice seedlings are raised in early April, while rice fields begin soaking in mid-April. Transplanting typically occurs in mid-May, alongside the successive sowing of soybeans and corn beginning in early May, and direct-seeded rice is sown in mid-May. Transplanted rice, which requires transplantation in a soil–water mixing environment, enters a period of water and crop mixing after transplanting. Conversely, dry fields remain with bare soil for a brief period post-sowing. There are three types of direct-seeded rice: water direct seeding, wet direct seeding, and dry direct seeding. Most direct-seeded rice is sown directly from the seed by machine. Water direct seeding is done in shallow flooded paddy fields, wet direct seeding on the surface of moist soil, and dry direct seeding on dry soil [31]. Different land preparation and water management methods define these three rice planting types. The key to distinguishing them lies in selecting appropriate water-body correlation indices and key time phases, reflecting the variations in water content across the rice fields of each type. The primary aim is to monitor the surface water content of rice fields during their initial stages. In April, the fields are flattened for sowing and are devoid of vegetation coverage. In May, following recent transplantation or sowing, some seedlings may be present in the paddy fields, but water remains the predominant element. In June, as the seedlings regain their green colour, the rice canopy has not yet fully covered the water surface, meaning that rice still does not play a dominant role. In this study, the modified normalised difference water index (MNDWI) was chosen to monitor surface water changes due to its higher sensitivity to water bodies compared to the land surface water index (LSWI) and its ability to suppress disturbances from buildings, vegetation, and soils [32]. The formula for MNDWI is provided below:
MNDWI = Green ( band 3 ) SWIR ( band 11 ) Green ( band 3 ) + SWIR ( band 11 )
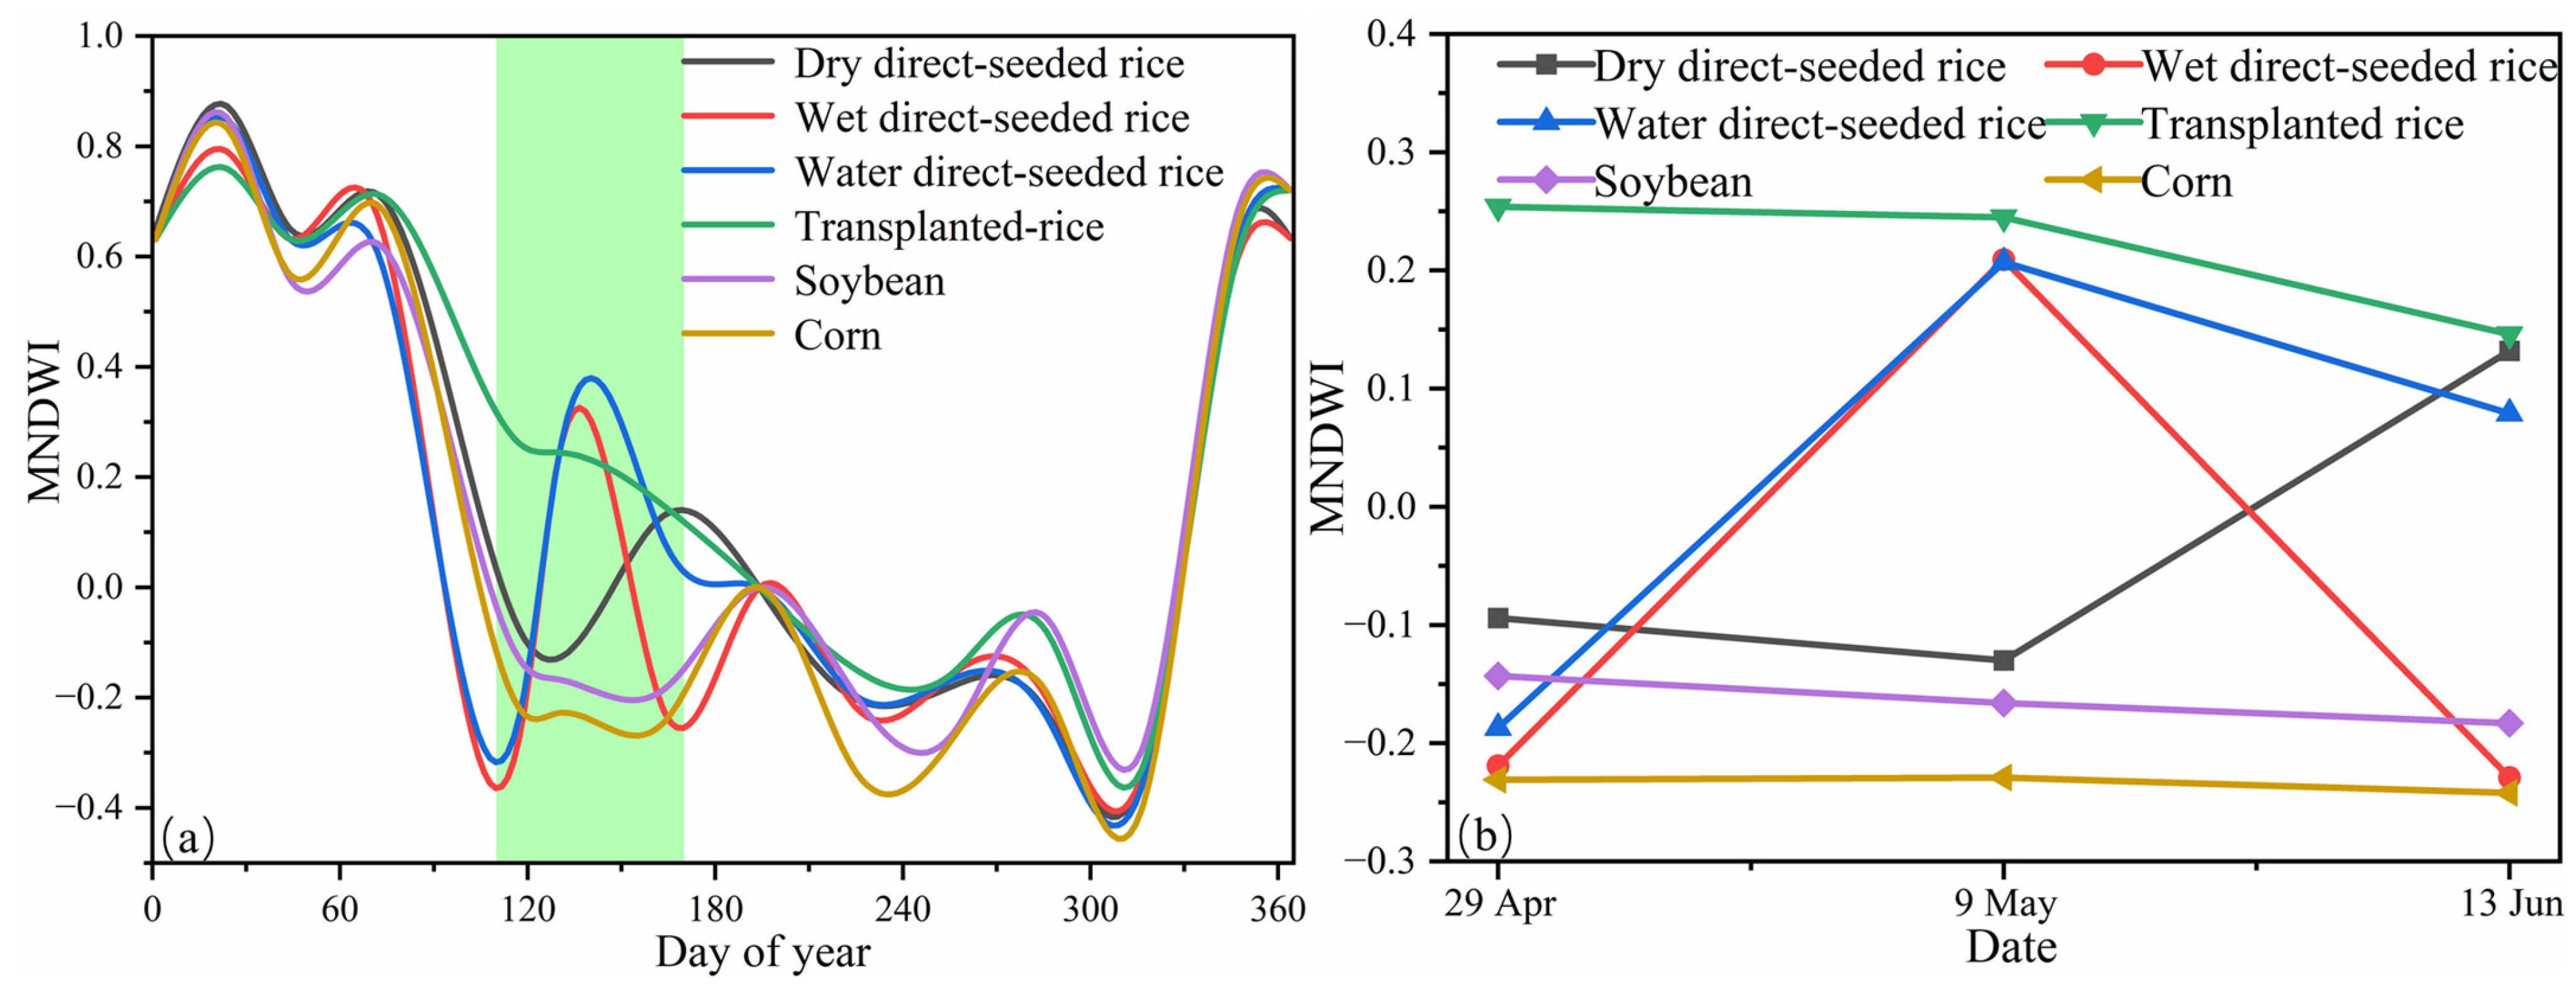
Figure 4a displays the MNDWI temporal curves for each vegetation type throughout an entire year, which is the smoothed result. It is observed that the MNDWI values exhibit greater variability between April and June, as evidenced by the green-shaded region in the figure, which corresponds to the three critical periods in rice cultivation: field irrigation, transplanting, and tillering. In contrast, there is little variation in the surface moisture of rice fields during other periods. The MNDWI index can effectively indicate the initial changes in moisture within rice fields of varying planting types. To minimise the effects of melting ice, snow, and rainfall during early spring, three time frames (29 April 2022, 9 May 2022, and 1 June 2022) were selected based on the respective image quality and growth period information to differentiate various rice-planting approaches. The corresponding MNDWI curve is shown in Figure 4b.

2.4. Gaussian Mixture Model

The Gaussian mixture model (GMM) is a probabilistic model which assumes that the distribution of image pixel values is a combination of multiple Gaussian distributions. GMM aims to fit the pixel value distribution of the entire image by estimating the mean and variance of each Gaussian distribution [33].
This study utilises multitemporal Sentinel-2 images to capture the early growth stages of rice. By calculating the MNDWI of different ground objects, we expect the histogram of the single-band water index to be bimodal or multimodal, conforming to a Gaussian distribution. The surface water-bearing and non-water-bearing areas are then fitted using the Gaussian mixture model. Subsequently, the fitted probability density function of the region is used for the automatic segmentation of these two areas. During this study, three-phase images from the early rice growing season were used to calculate the MNDWI and generate grey-value images using a Gaussian mixture model. The grey histogram of these images was subsequently analysed. However, image smoothing was necessary due to the challenge of determining the minimum value between the two peaks and valleys. Since the object-oriented plot-object segmentation results contain intricate details, a Gaussian low-pass filter was employed to smooth the image. This step helps filter out the greyscale variation caused by isolated single-point noise and alters the greyscale contrast between pixels. The two-dimensional form of the Gaussian low-pass filter is described as follows:
H ( u , v ) = e D 2 ( u , v ) 2 D 0 2
where D 0 is the cut-off frequency, and D u , v is the distance from the centre of the frequency rectangle.
The expression using the Gaussian mixture function is defined as follows:
p ( x ) = k = 1 K π k N ( x |   μ k , Σ k )
k = 1 κ π k = 1
where π k is the weight factor, and p ( x μ k ,   Σ k ) is the kth Gaussian distribution in the Gaussian mixture model, which is defined as follows:
p ( x |   μ , Σ ) = 1 ( 2 π ) n 2 |   Σ | 1 2 exp 1 2 ( x μ i ) T Σ 1 ( x μ )
where u is the mean of the kth Gaussian distribution in the Gaussian mixture model, and Σ   1 is the covariance matrix of the kth Gaussian distribution in the Gaussian mixture model. The water-bearing area is the foreground, and the non-water-bearing area is the background. In this context, the greyscale histogram of the normalized water index displays a characteristic pattern of double peaks. Thus, the simple Gaussian mixture probability model is defined as follows:
p ( x ) = π 1 N ( μ 1 , σ 1 2 ) + π 2 N ( μ 2 , σ 2 2 ) ( μ 1 < μ 2 )
To determine the threshold, the expectation-maximization (EM) algorithm is used to estimate the parameters of the probability density function. This process continues iteratively until the prior probability π, mean μ, and standard deviation σ converge, resulting in a stable Gaussian mixture model. Once each parameter is determined, it becomes possible to calculate the probability that any given pixel contains water. The mathematical formulation of this process is defined as follows:
p ( x 1 ) = π 1 N ( μ 1 , σ 1 2 ) π 1 N ( μ 1 , σ 1 2 ) + π 2 N ( μ 2 , σ 2 2 )
In this study, a threshold of 50% is chosen to binarize p ( x i ) into categories representing water-containing and non-water-containing pixels. Consequently, a value of 1 indicates water-containing pixels, while a value of 0 signifies non-water-containing pixels, serving as background information. The mathematical form of this binarization process is defined as follows:
p i x e l   c a t e g o r y = 1 i f p ( x i ) < 50 % 0 i f p ( x i ) > 50 %

2.5. Construction of Extraction Models for Different Planting Types of Rice

Based on the analysis of phenological characteristics, the MNDWI index was calculated using key phase images. Subsequently, surface water distribution images for the three periods were generated using the aforementioned Gaussian mixture model, followed by the detection of changes. In this study, two models were developed: one based on pixel-level analysis combined with the Gaussian mixture model and the other based on cultivated land plot object analysis, also integrated with the Gaussian mixture model.
The first model operates on the binarisation results generated by the multitemporal Gaussian mixture model, which involves calculating the water-content probability at each pixel location. This is akin to individually thresholding each temporal MNDWI to form clusters of pixels with similar characteristics, categorised into two types: water-containing and non-water-containing. Subsequently, change-detection analyses were performed on the segmentation results for three periods. Change types were identified based on the combination of field survey results and expert knowledge, and these identified pixel changes were then mapped to specific planting types. The second model further utilises plot-level objects as patch units and quantitatively analyses changes in feature information within these multitemporal patch units. Importantly, the type of patch change is mapped to the corresponding planting type, effectively establishing a model for rice extraction from different planting types.

2.6. Accuracy Assessment

This study employs field survey data and farm management area statistics to evaluate the accuracy of distribution maps. For this purpose, a confusion matrix was established using pure samples derived from ground sample points and delineated planting areas. Subsequently, three accuracy metrics were calculated: producer accuracy (PA), user accuracy (UA), and overall accuracy (OA), along with the F1 score (F1). These metrics are calculated as follows:
PA = n i j n j × 100 %
UA = n i j n i × 100 %
OA = i = 1 m n i j n × 100 %
Kappa = [ n i = 1 m n i j i = 1 m ( n i n j ) ] [ n 2 i = 1 n ( n i n j ) ]
F i = 2 PA i × UA i PA i + UA i × 100 %
where n i j is the value of row i and column j in the confusion matrix, n i is the sum of row i in the confusion matrix, n j is the sum of column j in the confusion matrix, n is the total number of validation samples, and m is the number of confusion matrix rows and columns.
The 37 direct-seeded rice plots identified in the field survey were specifically chosen for area calculation to verify the accuracy of the direct-seeded rice area represented in the distribution map. To evaluate the accuracy of the model extraction, two key statistical measures were calculated: the coefficient of determination (R2) and the root mean square error (RMSE). The calculation formula is defined as follows:
R 2 = 1 i = 1 n y i y i ^ 2 i = 1 n y i y i ¯ 2
R M S E = 1 n i = 1 n y i y ^ i 2
where n is the number of surveyed direct-seeded rice plots, y i is the actual area of direct-seeded rice plots, and y ^ i is the area of direct-seeded rice extracted by the model.

3. Results

3.1. Cultivated Land Plot Extraction Results

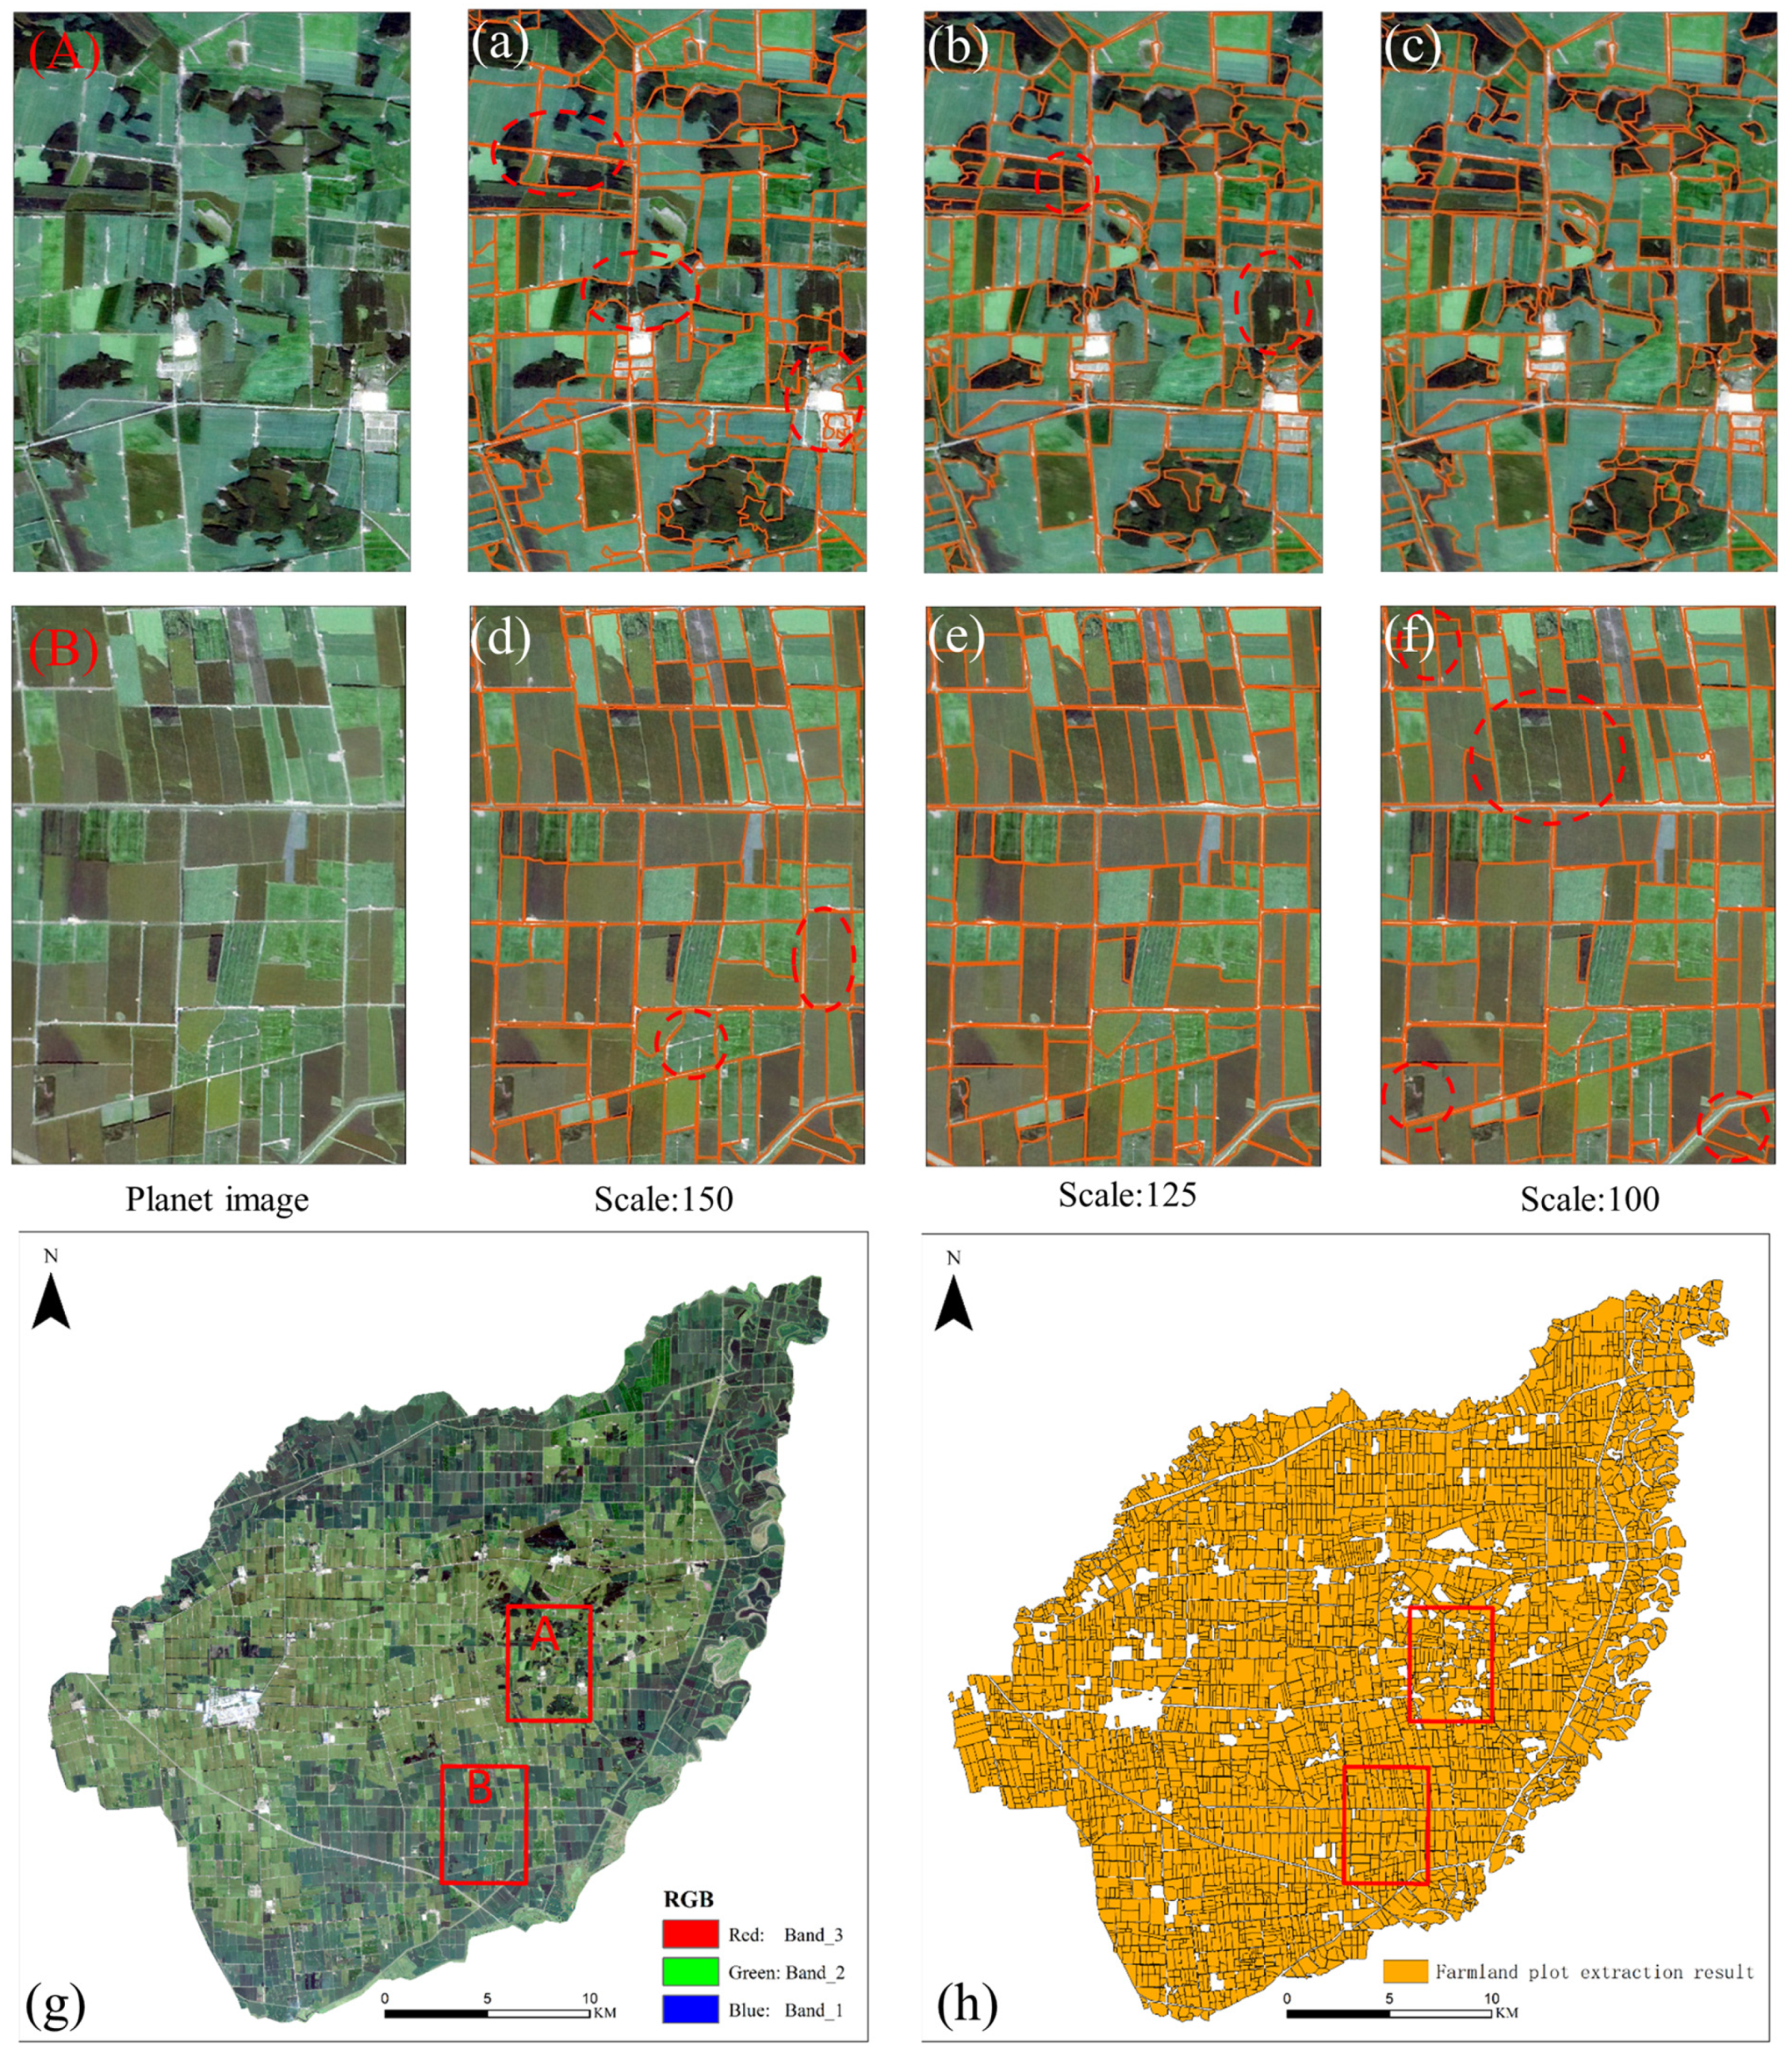
Figure 5g displays the high-resolution Planet image of the study area. The red boxes indicate the two areas with different selected feature types, shown in Figure 5A, and Figure 5B, respectively. Figure 5a–f also demonstrates that the split cultivated land parcels overlap with the actual parcel locations. Area A, chosen for analysis, includes a variety of land object types. There are woodlands, farmland, buildings, and roads. The segmentation scale starts from 0 with a cloth length of 25. When a segmentation scale of 100–150 is selected, the segmentation boundary is consistent with the actual plot boundary. When the scale factor for Figure 5a,b segmentation is set to 150 and 125, some plots around the forestland cannot be extracted, and cultivated land and forestland are mixed into one object. Similarly, when the scale of Figure 5c is set to 100, the segmentation effect of forestland and cultivated land becomes more apparent.
In Figure 5B, area B mainly comprises two land types: cultivated land and roads. In Figure 5d, when the scale is 150, the cultivated land parcels are undersegmented. In Figure 5f, when the scale is 100, there is both oversegmentation and undersegmentation. The areas circled in the upper left corner and lower right corner are oversegmented, and the other circled areas are undersegmented. When the scale of Figure 5e is 125, the segmentation effect is better and more realistic. For the study area, two scales were employed to extract cultivated land. The segmentation results at a scale of 100 were applied to areas with complex feature types, while those at 125 were used for the remaining areas, with shape and tightness parameters set at 0.5 and 0.3, respectively. The combined extraction results are depicted in Figure 5h.
Common issues encountered include slender shelterbelts around some plots remaining unpartitioned and the ineffectiveness of cultivated land products in masking, leading to the extraction of sizeable, cultivated plots. The utilisation of single-phase images for identifying and eliminating narrow shelterbelts presents significant challenges in the extraction of cultivated land plots. Similarly, difficulties are encountered when adjacent plots are cultivated with the same crop or when field ridges become obscured by vegetation canopies, complicating the discernment of plot boundaries. Additionally, a lesser number of dryland ridges can lead to undersegmentation, although the crop types within the extracted plots remain consistent. This study was specifically focused on analysing the spatial distribution of different rice planting types and had no impact on the subsequent classification outcomes.

3.2. Gaussian Mixture Model Analysis

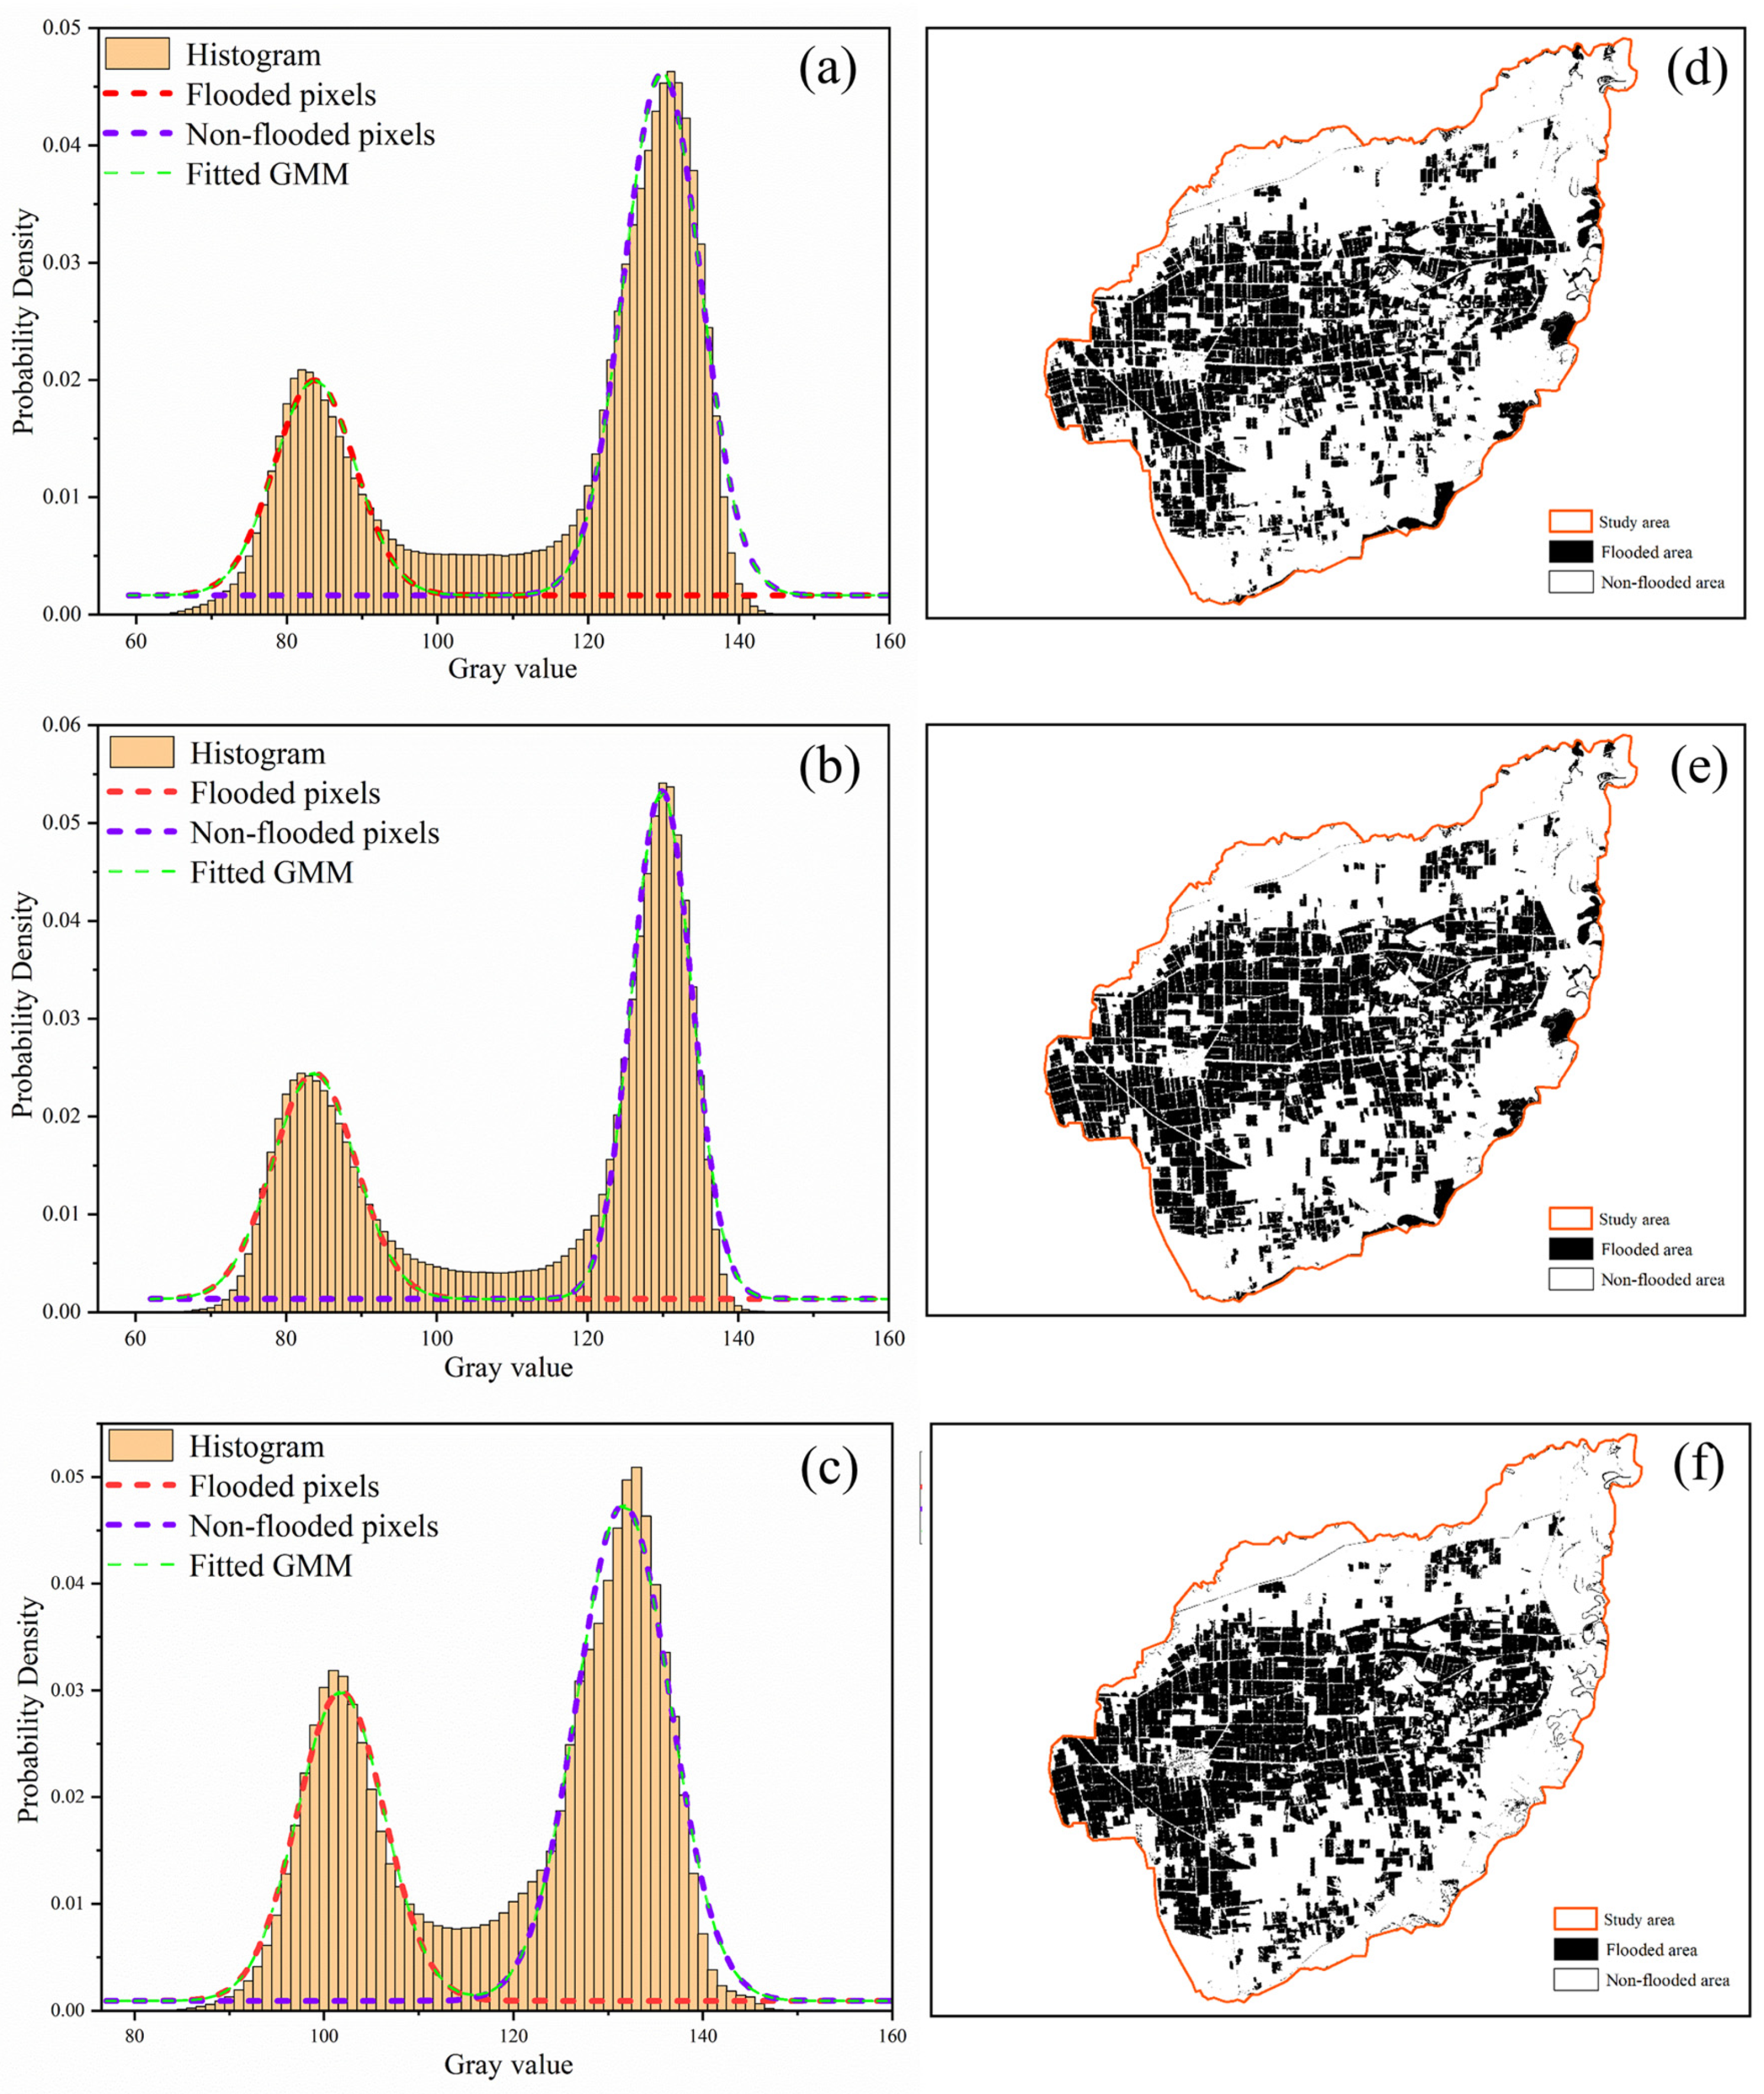
Figure 6a–c presents the histograms of the MNDWI grey values for three time phases. A Gaussian mixture model was employed to fit two distinct distributions: one type is for water-containing pixels corresponding to the peak on the left side of the histogram, and the other type is for non-water-containing pixels corresponding to the peak on the right side of the histogram. This model iterated through the expectation-maximization (EM) algorithm until the parameters were fully optimized. The probability that an unknown pixel belongs to the water-containing pixels can be estimated. In this study, the segmentation results shown in Figure 6d–f were achieved using a threshold value of 50%. In these figures, the black pixels represent surface water areas, while the remaining pixels indicate non-water areas. Specifically, Figure 6d,e reveals that certain wetland regions in the southeastern corner of the study area are identified as water bodies during the monitoring phase. For subsequent analyses, classification results will be overlaid with cultivated land products, and slope calculations will utilize elevation data. Areas with a slope exceeding 5° are deemed unsuitable for rice cultivation and are subject to additional masking [34]. The segmentation results of the three phases prepare for the construction of rice extraction models for different planting types, as shown in Figure 6d–f during the change monitoring process.

3.3. Construction and Analysis of Extraction Models for Different Planting Types of Rice

This study mainly analyses various planting types through the moisture changes in the rice fields in the early stage of rice. The MNDWI curves of the three selected phases are shown in Figure 2b. Figure 3 further explains the water management measures and soil moisture conditions in various planting types of rice fields. On 29 April 2022, only the paddy fields were soaked in water to prepare for transplanting in mid-May. At this point, the surface was water-laden, and the rest of the crop types keep the soil dry. On 9 May 2022, wet direct seeding and water direct seeding was irrigated. Water direct seeding requires more water than wet direct seeding as it aims to keep the soil water-saturated, while wet direct seeding only requires the soil to be wet enough for sowing preparation; on 13 June 2022, transplanted rice paddies remained saturated with soil moisture, while direct seeding paddies were guaranteed a thin layer of water. The dry-seeded rice was just past the green-up period at this time, and normal water management patterns were adopted to begin irrigation. In the early stages, dry direct-seeded rice seeds directly on the dry soil surface, while in wet direct-seeded rice fields, drainage is used to keep the soil moist. The MNDWI values for soybean and corn remained below 0 in all three phases. In the dry fields, no irrigation is applied except for the water stored in the soil by natural rainfall.
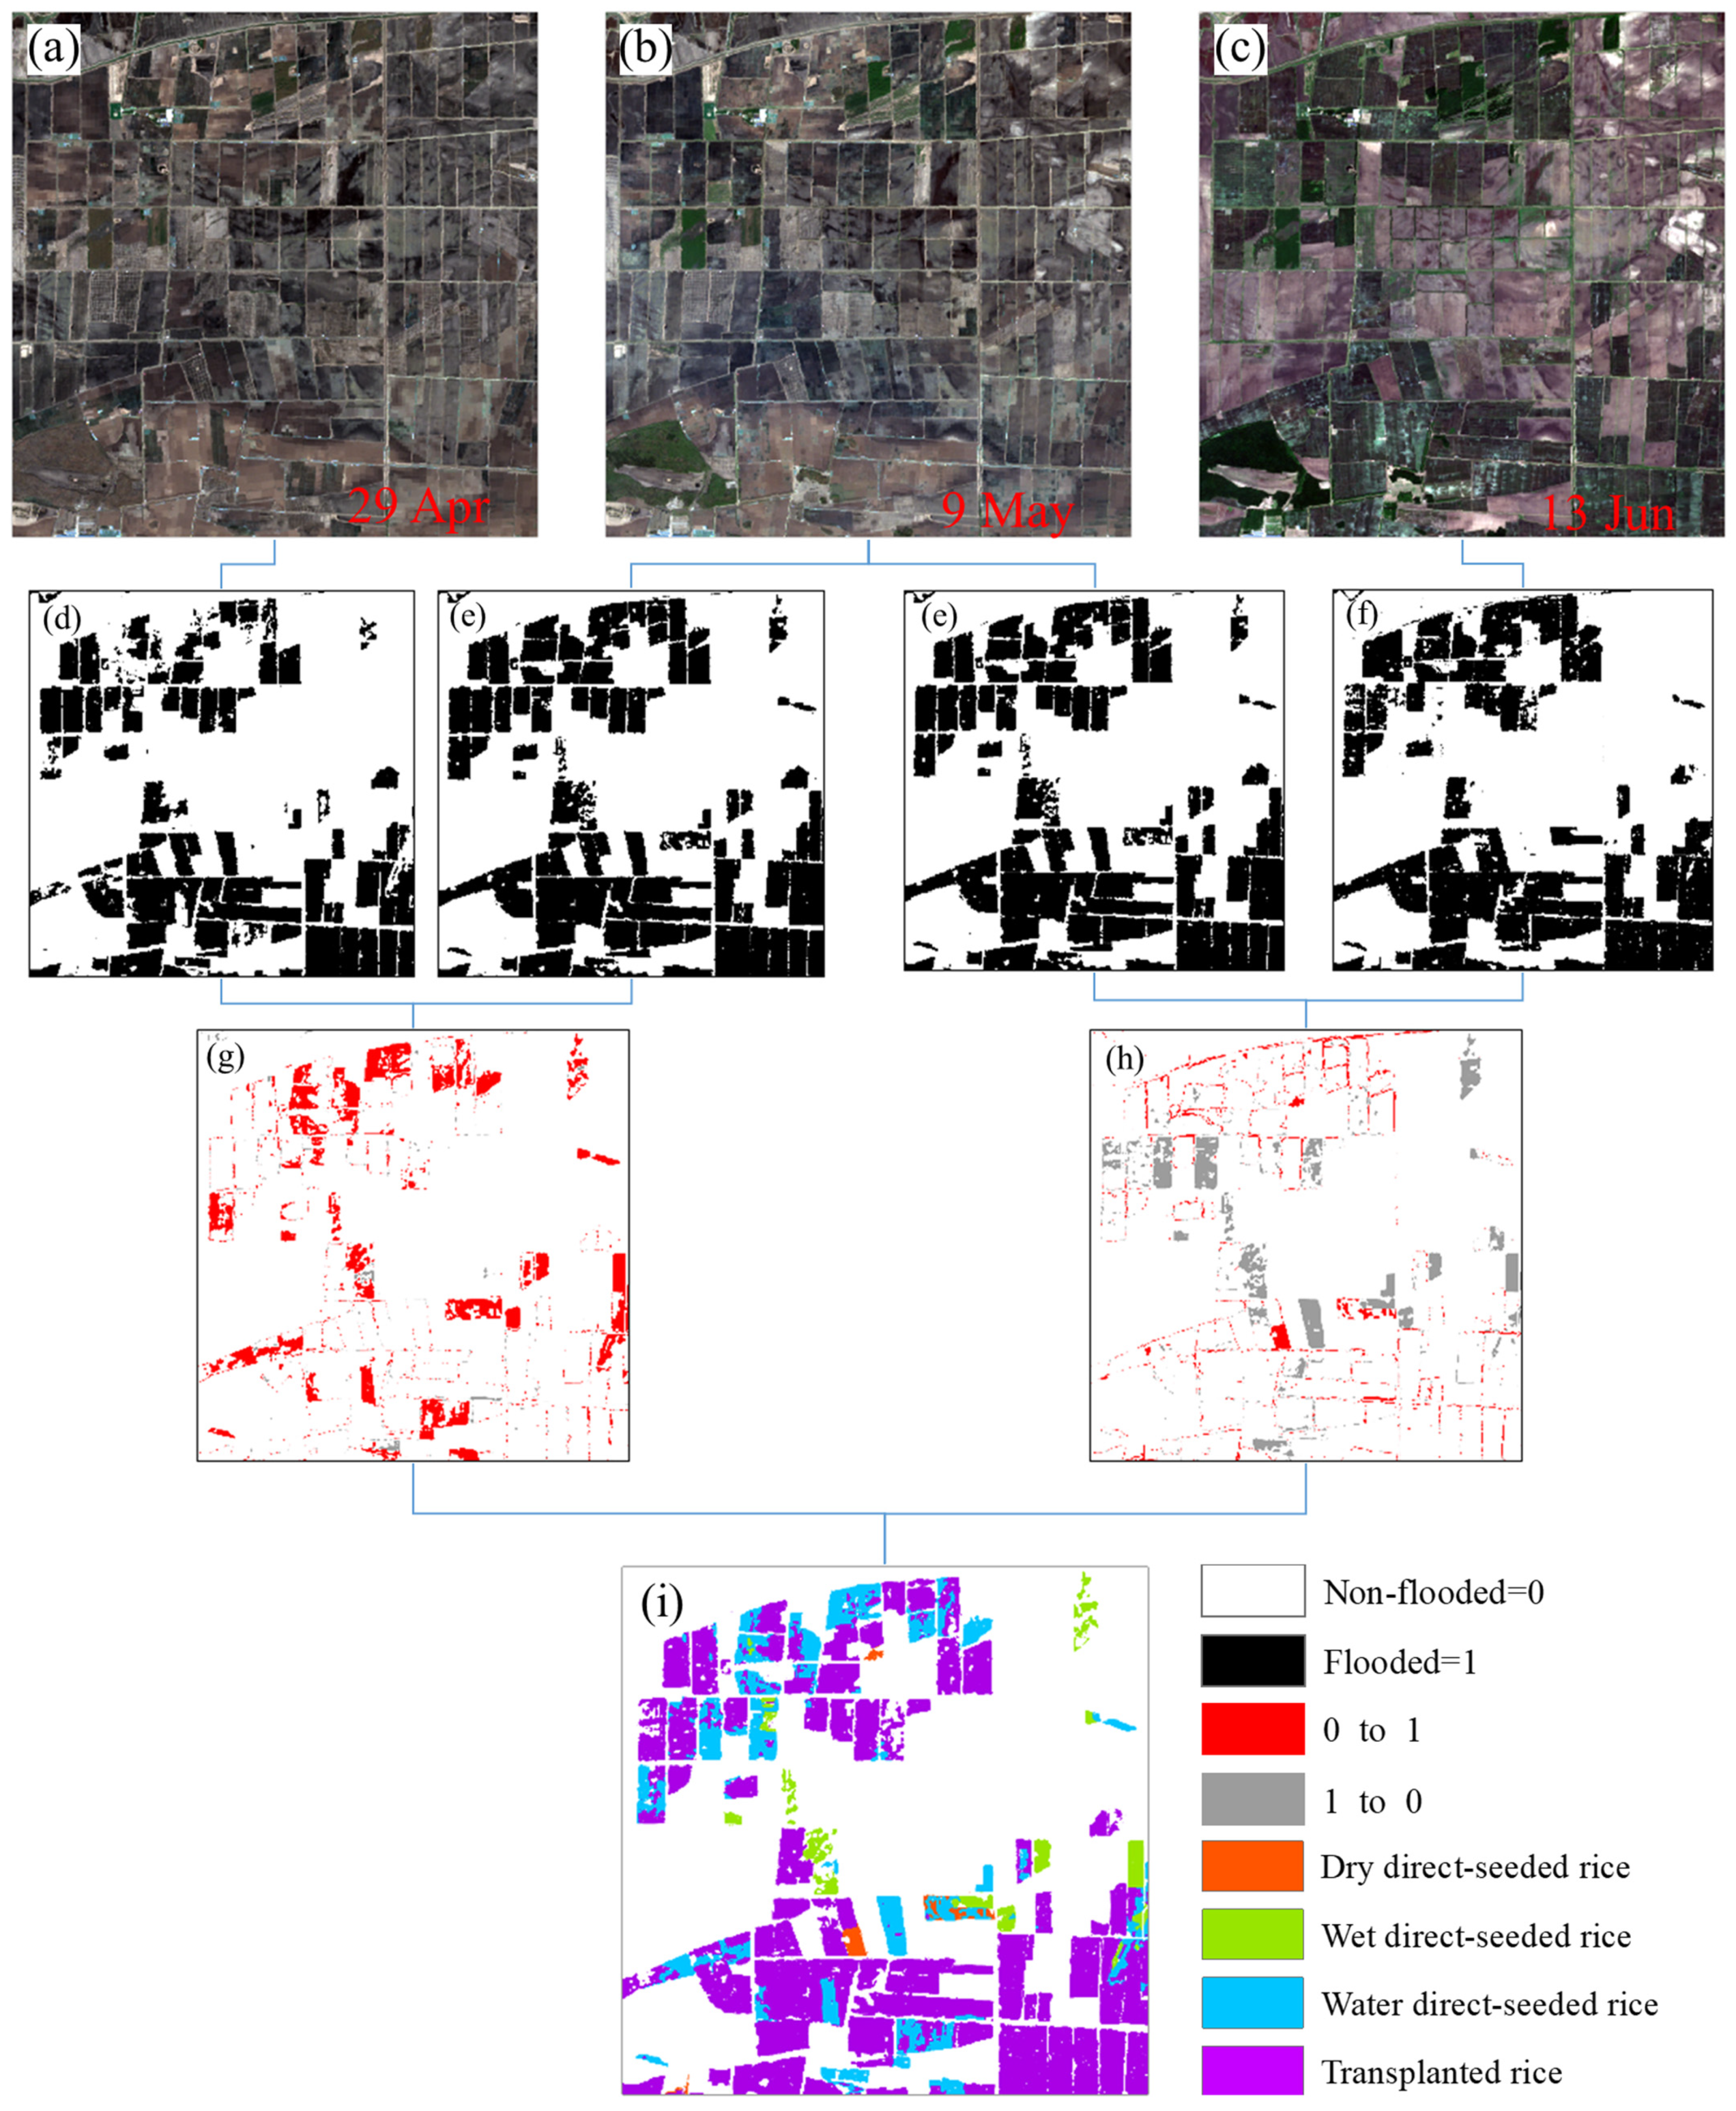
The previously described Gaussian mixture model generates surface water distribution images for these three periods, facilitating change detection. Figure 7 details the change detection process. Figure 7a–c shows the actual colour Sentinel-2 image of three phases, while Figure 7d–f displays the segmentation result of the Gaussian mixture model after calculating the MNDWI index from the Sentinel-2 image. The change type is identified based on field investigation and expert knowledge matching. The corresponding map of a particular area with water in one phase is represented by ‘1’. In comparison, the blank area in the corresponding map with no water in a specific area in one phase is represented by ‘0’. Figure 7g,h illustrates the areas and types of changes between two time phases. The colour red represents the change type from ‘0–1’ and its corresponding area, while grey represents the change type from ‘1–0’ and its corresponding area.
In terms of classification, ‘000’ signifies regions that lack water in all three phases, corresponding to dry field areas. On the other hand, ‘001’ represents regions that are dry on 29 April and 9 May but exhibit water presence on 13 June, which is characteristic of dry direct-seeded rice. Additional rules for extracting rice based on these varied planting types are detailed in (Table 1).

3.4. Analysis of the Classification Results of Different Planting Types of Rice

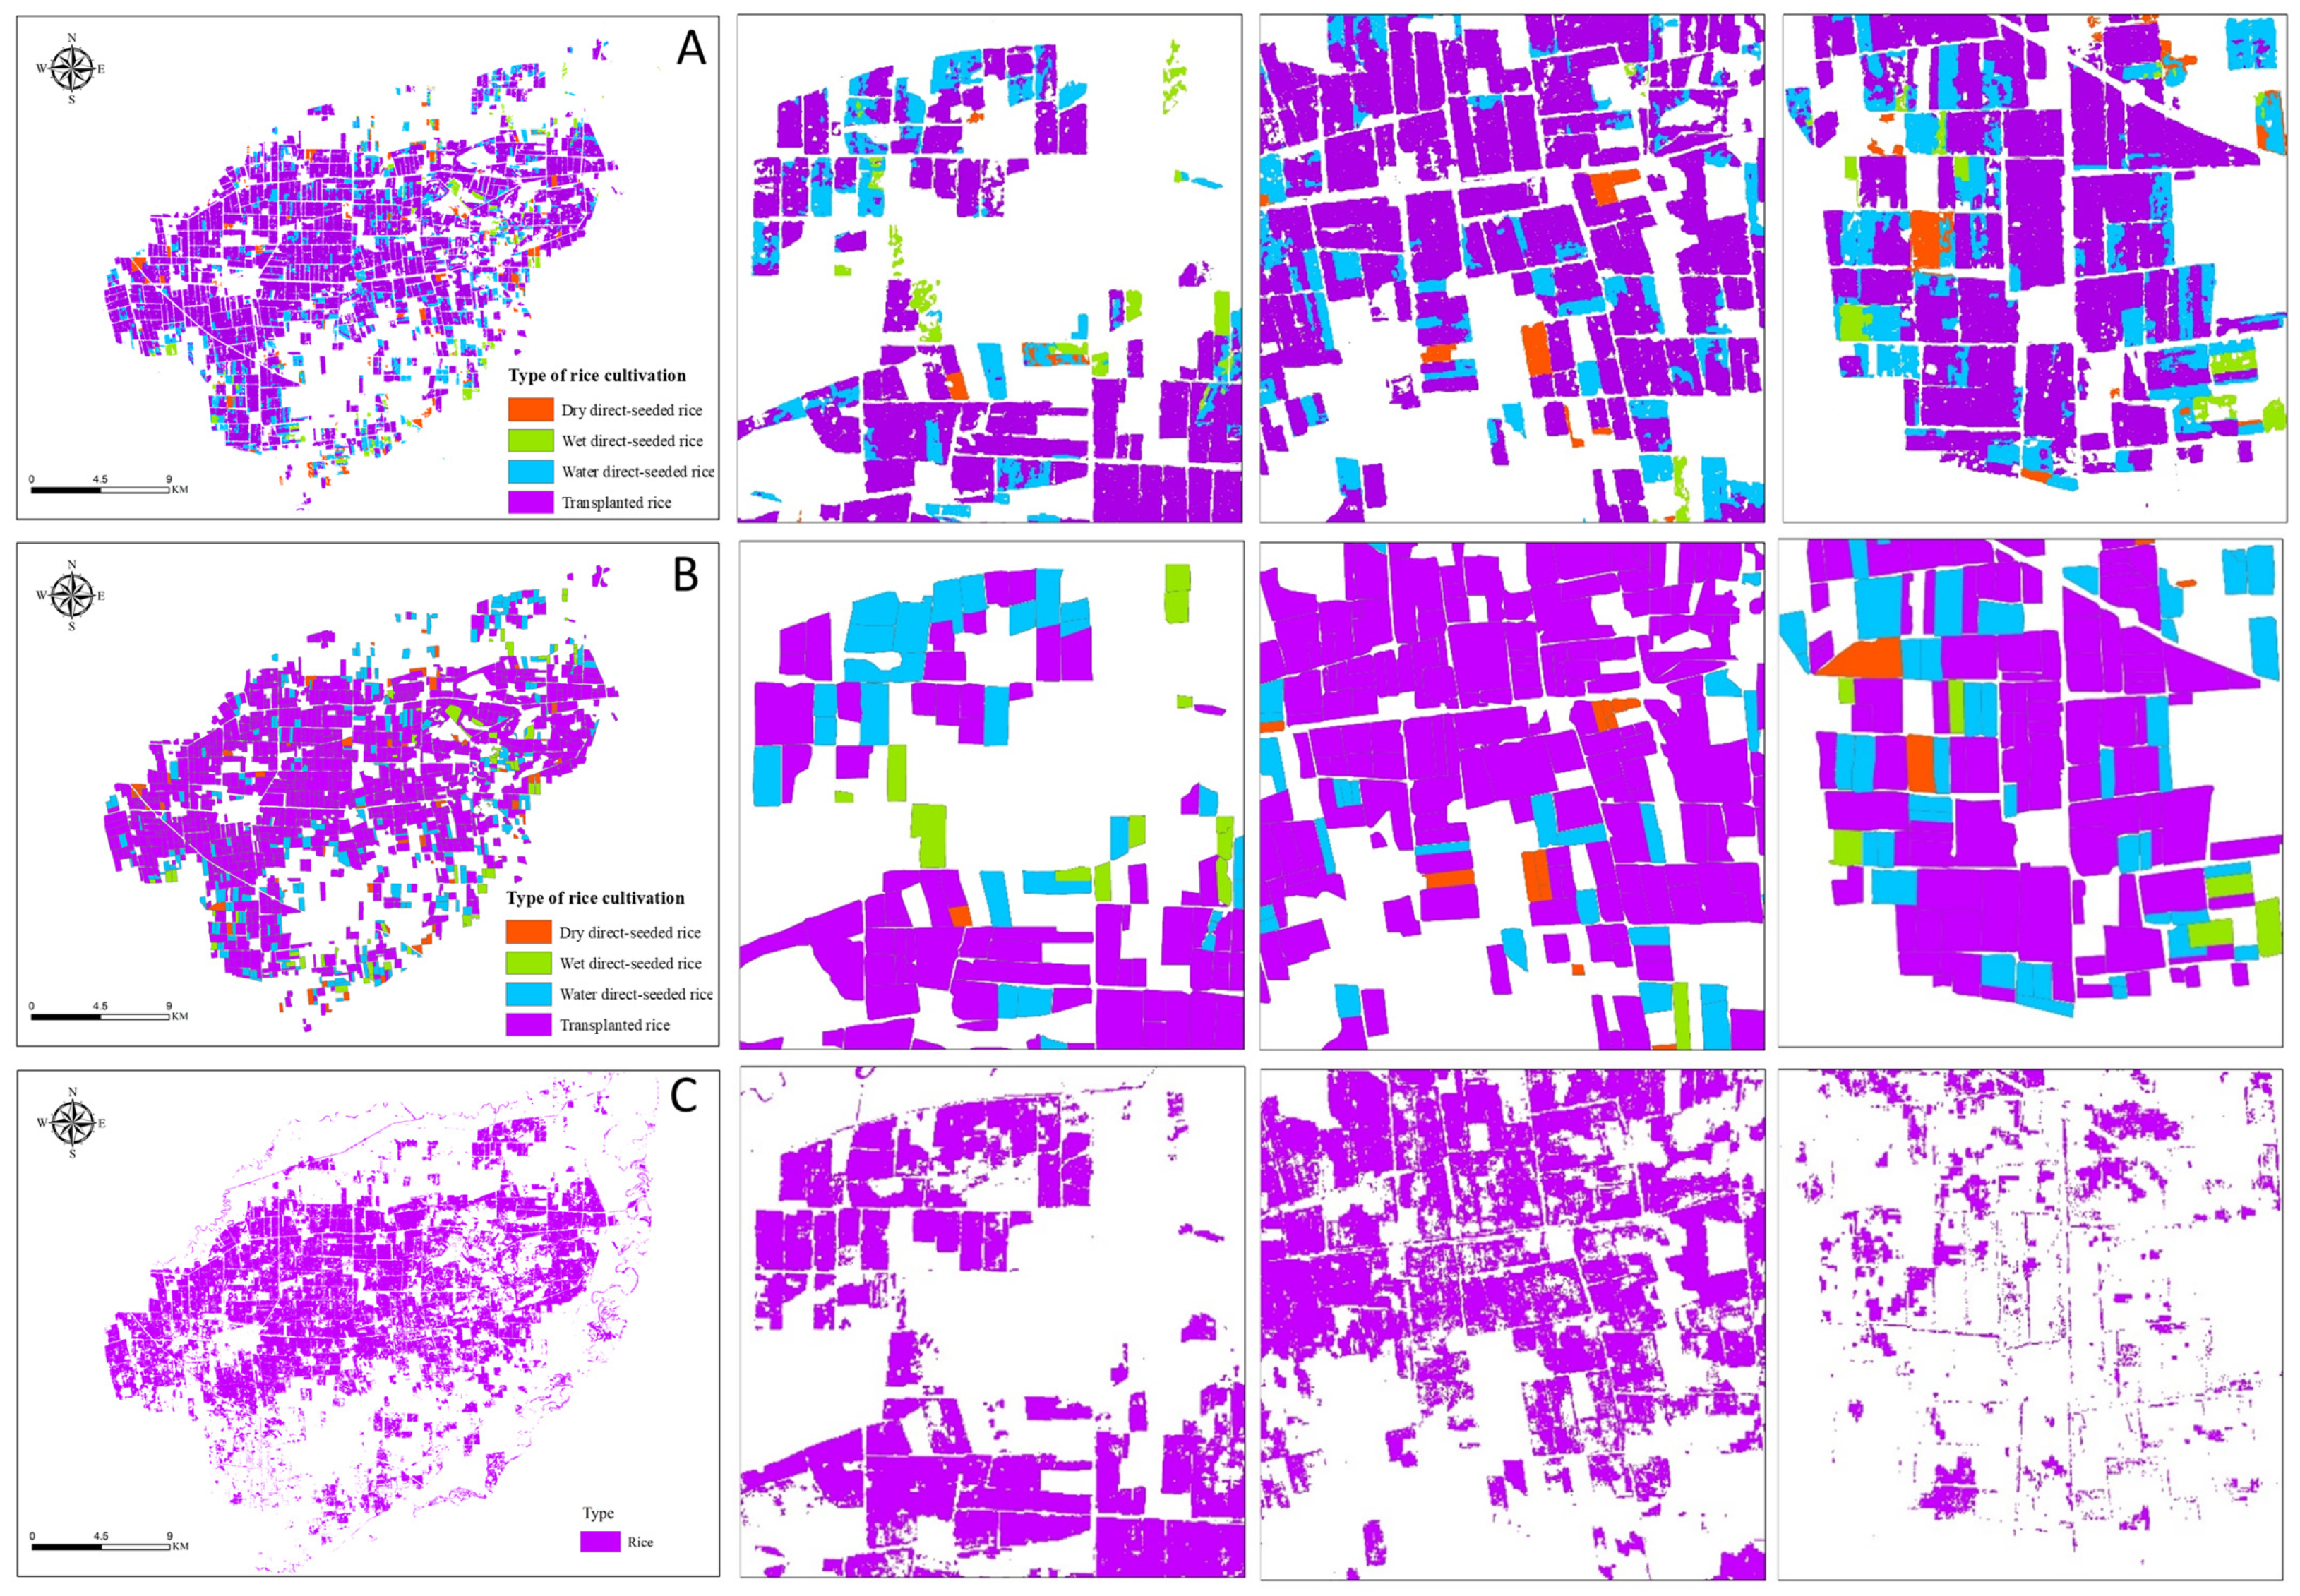
This study introduces two extraction models: the first is based on pixel analysis combined with a Gaussian mixture model, and the second utilises cultivated land plot objects integrated with a Gaussian mixture model. The outputs of these models are showcased in the subsequent figures. Figure 8A displays extractions based on pixels, Figure 8B shows extractions based on cultivated land plot objects, and Figure 8C presents an intercepted portion of the 2022 China single-crop rice distribution dataset.
Figure 8 depicts the spatial arrangement of crops at Daxing Farm in 2022. Transplanted rice was predominantly found in the centre and southwest corner, while dry land was concentrated to the north, east, and south around the farm’s paddy fields. Table 2 reveals that, in terms of rice, transplanted rice constitutes the largest portion of the planting area at 41.8%, followed by water direct seeding at 6.9%, wet direct seeding at 1.1%, dry direct seeding at 1.5%, and dry land at 48.7%. A confusion matrix was utilized to quantitatively assess the accuracy of different rice planting forms. The overall accuracy for pixel-based and cultivated land plot object-based models was 89% and 91%, respectively, with Kappa coefficients of 0.86 and 0.89. These results confirm the mapping accuracy for various rice planting types. The dry field extraction accuracy of both models was notably high, with user accuracy, producer accuracy, and F1 score all exceeding 90%. In the case of transplanted rice, using the cultivated land plot object model, the user accuracy, producer accuracy, and F1 score surpassed 90%. For pixel-based extraction, transplanted rice had a user accuracy of 89%, with all other metrics also above 90%. Dry fields and transplanted rice were chosen as the two most easily identifiable and extractable types in this study. Dry fields demonstrate no water in all three phases, whereas transplanted rice plots exhibit no substantial changes in surface moisture throughout the three phases. Both types can be easily reflected using the MNDWI index. For water direct-seeded rice, the cultivated land plot object model achieved a user accuracy rate of over 90%, outperforming other indicators which registered rates above 80%. A notable change in surface water content was observed among the three phases of water direct seeding, impacting extraction accuracy. Both dry direct-seeded and wet direct-seeded rice achieved user and producer accuracies, as well as F1 scores, above 80%. However, the limited area devoted to dry direct-seeded rice presented monitoring challenges, resulting in comparatively lower accuracy. Wet direct-seeded rice, with varying surface water content across the three phases, faced difficulties in detecting successive changes, leading to reduced extraction accuracy.
Overall, the spatial distribution of different rice planting types extracted by this model aligns closely with field survey results. The extraction precision based on cultivated land plots is superior to that of the pixel extraction model, as indicated by differences in the extraction area. Figure 9 demonstrates that the R2 value for the area extracted using the cultivated land plot object model is 0.1109 higher, and the RMSE value is 0.468 lower than the pixel-based extraction. This suggests that the cultivated land plot object-based extraction is more consistent with actual field statistics and investigations. Pixel extraction challenges, such as the “salt and pepper” effect, pixel loss, variations in plot flatness, and irrigation management, may inadequately represent surface water content changes at a field-level scale. The extraction model, which relies on cultivated land, quantifies the likelihood of different crop types being planted in each plot to derive classification outcomes through change detection. This method effectively eliminates patchy elements like sun ponds, field ridges, roads, and buildings, thereby reducing classification errors due to small-area water content changes within the plots.

4. Discussion

4.1. Advantages of This Model

Previous studies have often used existing plot data so that crops within a plot can be directly identified, but there are no complete databases of plots in developing countries. This study first used high-resolution images to extract cultivated land plot objects and compared it with object-oriented segmentation using methods such as simple noniterative clustering (SNIC). If crops of the same type on adjacent plots have different spectra, textures, or shapes that are very similar, object-oriented segmentation will classify them as the same object. In this study, the extraction of cultivated land plots is not limited to the same crop type but aims to refine the segmentation object to the plot scale, which not only perfectly solves the phenomenon of “salt and pepper” that exists in the pixel-based extraction results, but also obtains plot-level data and classified products [35].
It also provides access to plot-level data and disaggregated products that are important for precision agriculture, crop yield estimation, resource planning, and analysis of environmental impact factors [36]. At the same time, the Sentinel images in the early critical period of rice are selected. There is no need to perform time interpolation and fusion on the images, and the data are simple to use. After calculating the MNDWI index, the binary result was generated by the Gaussian mixture model to reflect the surface water content region, and the rice planting distribution of different planting types was determined by the change detection of the surface water content region in the three periods. In this study, the accuracy of rice extraction is enhanced by capturing the rice flooding signal through a multitemporal Gaussian mixture model, and a single period of extraction leads to the lack of rice acreage extraction, and the results show that multitemporal data are more effective than single-temporal data in rice extraction, and this conclusion has been confirmed in many studies [32,37]. The model used in this study does not necessitate sample data or model training to input multiple features. Hence, it is transferable. Rice is primarily classified by most researchers as early, middle, or late rice, alongside single-cropping and double-cropping rice, without considering the extraction of diverse planting types. Extraction was carried out by analysing the sequence curves of the vegetation indices of rice throughout the growing period, and few studies have carried out early rice extraction. In this study, the extraction of rice was carried out only within one month after rice sowing for planting distribution extraction, only through the water cover characteristics of the early growing environment of rice. Using a single water body index, MNDWI, for the early extraction of different planting types of rice, MNDWI showed high separability with the ability of early extraction. Compared to the 2022 high-resolution Chinese single-season rice planting distribution dataset, the dataset exhibits more missing rice identification and extraction for the direct seeding type. Additionally, the water direct-seeded rice shows the most significant leakage score, and areas with more direct-seeded rice types have their leakage scores ignored. Finally, some wetlands on the east side of the farm are misclassified as rice. The rice area was missed by 2200 hectares, and the overall accuracy of this model is 3% higher than the product.

4.2. Uncertainty Analysis

This study focused on a specific research area in Heilongjiang Province and may not be applicable to other regions with different environmental conditions and agricultural practices. Before proceeding with the extraction of different planting types of rice, the extraction of cultivated land was again carried out to generate plot-level object products after first masking the study area image using the cropland range product. The cropland product used will have some forested land, grassland, and wetland not excluded, and there may be land fallow and newly reclaimed land at the same time, which will lead to errors in the cropland plot extraction results. The water body index also has similar characteristics in reflecting the signals of surface moisture in wetlands and paddy fields [38], which can lead to errors in rice plantation areas. Cultivated land plot extraction through high-resolution Planet imagery resulted in uncertainty in the area between different planting types of rice because of segmentation scale issues but did not affect the total area extracted for all planting types of rice in the study area 2. Due to the optical images used, if the key phenological stage optical images are contaminated by clouds or missing, it will lead to the misclassification and omission of rice, reducing the accuracy of the early extraction of the model in this study. Other satellite data with multispectral sensors can be used to extract the entire growth period of rice, making up for the lack of a single sensor and early images, but at the same time, losing the advantage of the early extraction of the rice planting distribution of different planting types. However, incorporating different stages of the entire growing season to extract and explore the whole phenological cycle of different planting types of rice will improve the accuracy of extraction. The classification accuracy of this study is relatively high. However, there are still some things that need to be corrected in the mapping results, which may be due to farmers’ water management methods in rice fields and the extreme climate that results in extraction rules that are not universal. Further validation and ground truthing are required to assess the accuracy of the mapping methodology.

4.3. Future Development

Direct-seeded rice cultivation is becoming increasingly popular as rice-growing regions transition from traditional labour-intensive transplanting methods to machinery-based labour-efficient sowing methods. However, this study did not consider other factors that may affect the type of rice cultivation, such as weather conditions, soil type, and socioeconomic factors. Future research evaluating and investigating the economic feasibility and practicality of different rice cultivation methods could provide a more comprehensive understanding of rice cultivation methods and improve the accuracy of mapping. The transplantation period is the key characteristic used to distinguish rice from other crops. However, studies suggest that specific types of directly sown rice may exhibit weaker flooding signals compared to transplanted rice, thereby making it challenging to differentiate them from other crops using traditional classification methods. Additionally, the area under rice cultivation may be underestimated [39]. The unique water management method of direct-seeded rice fields requires exploring new techniques to capture subtle flooding indications. Some direct-seeded rice is sown by drones, and the seedlings emerge without the regularity of transplanted seedlings. By using multitemporal higher spatial resolution images, the dissimilarities between direct-seeded and transplanted rice can be studied further by analysing their texture features for identification and extraction. The growing season of direct-seeded rice is usually shorter than that of transplanted rice, and the growth difference in a certain time window can be studied for extraction. In the future, validation of the mapping methodology could be considered for different regions with different environmental conditions and agricultural practices to assess its applicability and accuracy. This model starts with the extraction of arable land parcels; if the land in the area where the model migration is verified is not regular and fragmented, it will affect the extraction accuracy of this model. The growing season of direct-seeded rice is typically shorter than that of transplanted rice, and it is possible to study and extract the growth difference within a specific time window. Direct-seeded rice is advantageous due to its water-saving, labour-saving, and methane-emission-reducing characteristics. Future studies can monitor water consumption, methane emissions, and direct-seeded and transplanted rice yield in different growing seasons. This will help to explore the economic feasibility and practicality of using different rice planting methods. The aim is to achieve eco-efficient production methods that balance increased productivity with environmental sustainability.

5. Conclusions

This study presents a mapping methodology that extracts the spatial distribution of diverse planting types of rice employing high-resolution Planet images and multitemporal Sentinel-2 data. The process involves four distinct steps: (1) the extraction of cultivated land plots using high-resolution Planet imagery, obtaining farmland plot-level distribution products; (2) the surface water-bearing regions of the selected temporal phases were accurately delineated and obtained based on the binarised segmentation of the MNDWI multitemporal Gaussian mixture model; (3) the change detection of segmentation results for multitemporal phases identified the types of changes and areas of changes in different planting types of rice; and (4) for the change area and change type, the planting type of each plot object is matched based on the cultivated land plot distribution product in the first step, and finally the spatial distribution product of different planting types of rice at the plot-level scale is generated.
In this study, a multitemporal Gaussian mixture model is utilized for threshold segmentation, and there is no requirement to adjust the thresholds using real ground data to attain satisfactory classification accuracy. The mapping of diverse rice planting types was concluded during the rice tillering phase, aligning closely with the authentic survey data in order to accomplish the objective of early extraction. The flexibility and timeliness of the early mapping of the distribution of different planting types of rice will appeal to a wider range of users than the traditional rice planting distribution products that do not take into account the planting type. The mapping results can aid in planning and allocating resources, particularly for water management. This can assist farm managers in making informed decisions to optimize farm operations and maintain sustainable agriculture. To ensure sustainable rice production and food security, it is important to monitor water use in the context of declining water, labour, and energy resources; research ought to concentrate on varying rice planting methods and draw distribution maps of different planting types of rice, and respective regions should implement appropriate ways of planting rice that reflect their local ecological environment and food security level. Furthermore, the long-term monitoring and assessment of the impacts of different rice planting methods on water resource management, crop yields, and regional development is desirable to inform sustainable agricultural practices and policy decisions.

Author Contributions

Methodology, formal analysis, visualization, software, writing—original draft preparation, Y.Y. and C.L.; conceptualization, supervision, writing—review and editing, funding acquisition, H.L.; resources, investigation, project administration, X.Z. and L.M.; validation, data curation, B.Q. All authors have read and agreed to the published version of the manuscript.

Funding

This work was supported by the Jilin Province and the Chinese Academy of Sciences, Science and Technology Cooperation High-tech Industrialization Special Fund Project (2021SYHZ0013) and the National Key R&D Program of China (2021YFD1500100).

Data Availability Statement

The data presented in this study are available on request from the corresponding author. The data are not publicly available due to the project requirements.

Conflicts of Interest

The authors declare no conflicts of interest.

References

  1. Zhan, P.; Zhu, W.; Li, N. An Automated Rice Mapping Method Based on Flooding Signals in Synthetic Aperture Radar Time Series. Remote Sens. Environ. 2021, 252, 112112. [Google Scholar] [CrossRef]
  2. Song, Y.; Wang, Y.; Mao, W.; Sui, H.; Yong, L.; Yang, D.; Jiang, D.; Zhang, L.; Gong, Y. Dietary Cadmium Exposure Assessment among the Chinese Population. PLoS ONE 2017, 12, e0177978. [Google Scholar] [CrossRef] [PubMed]
  3. Surendran, U.; Raja, P.; Jayakumar, M.; Subramoniam, S.R. Use of Efficient Water Saving Techniques for Production of Rice in India under Climate Change Scenario: A Critical Review. J. Clean. Prod. 2021, 309, 127272. [Google Scholar] [CrossRef]
  4. Change, I.C. Mitigation of Climate Change. Contrib. Work. Group III Fifth Assess. Rep. Intergov. Panel Clim. Chang. 2014, 1454, 147. [Google Scholar]
  5. Xia, H.; Zhang, X.; Liu, Y.; Bi, J.; Ma, X.; Zhang, A.; Liu, H.; Chen, L.; Zhou, S.; Gao, H. Blue Revolution for Food Security under Carbon Neutrality: A Case from the Water-Saving and Drought-Resistance Rice. Mol. Plant 2022, 15, 1401–1404. [Google Scholar] [CrossRef] [PubMed]
  6. Marasini, S.; Joshi, T.N.; Amgain, L.P. Direct Seeded Rice Cultivation Method: A New Technology for Climate Change and Food Security. J. Agric. Environ. 2016, 17, 30–38. [Google Scholar] [CrossRef]
  7. Li, K.; Brisco, B.; Yun, S.; Touzi, R. Polarimetric Decomposition with RADARSAT-2 for Rice Mapping and Monitoring. Can. J. Remote Sens. 2012, 38, 169–179. [Google Scholar] [CrossRef]
  8. Weiss, M.; Jacob, F.; Duveiller, G. Remote Sensing for Agricultural Applications: A Meta-Review. Remote Sens. Environ. 2020, 236, 111402. [Google Scholar] [CrossRef]
  9. Adrian, J.; Sagan, V.; Maimaitijiang, M. Sentinel SAR-Optical Fusion for Crop Type Mapping Using Deep Learning and Google Earth Engine. ISPRS J. Photogramm. Remote Sens. 2021, 175, 215–235. [Google Scholar] [CrossRef]
  10. Zhang, G.; Xiao, X.; Dong, J.; Kou, W.; Jin, C.; Qin, Y.; Zhou, Y.; Wang, J.; Menarguez, M.A.; Biradar, C. Mapping Paddy Rice Planting Areas through Time Series Analysis of MODIS Land Surface Temperature and Vegetation Index Data. ISPRS J. Photogramm. Remote Sens. 2015, 106, 157–171. [Google Scholar] [CrossRef]
  11. Fatchurrachman; Rudiyanto; Soh, N.C.; Shah, R.M.; Giap, S.G.E.; Setiawan, B.I.; Minasny, B. High-Resolution Mapping of Paddy Rice Extent and Growth Stages across Peninsular Malaysia Using a Fusion of Sentinel-1 and 2 Time Series Data in Google Earth Engine. Remote Sens. 2022, 14, 1875. [Google Scholar] [CrossRef]
  12. Xiao, X.; Boles, S.; Liu, J.; Zhuang, D.; Frolking, S.; Li, C.; Salas, W.; Moore, B., III. Mapping Paddy Rice Agriculture in Southern China Using Multi-Temporal MODIS Images. Remote Sens. Environ. 2005, 95, 480–492. [Google Scholar] [CrossRef]
  13. Son, N.-T.; Chen, C.-F.; Chen, C.-R.; Guo, H.-Y. Classification of Multitemporal Sentinel-2 Data for Field-Level Monitoring of Rice Cropping Practices in Taiwan. Adv. Space Res. 2020, 65, 1910–1921. [Google Scholar] [CrossRef]
  14. Dong, J.; Xiao, X.; Kou, W.; Qin, Y.; Zhang, G.; Li, L.; Jin, C.; Zhou, Y.; Wang, J.; Biradar, C. Tracking the Dynamics of Paddy Rice Planting Area in 1986–2010 through Time Series Landsat Images and Phenology-Based Algorithms. Remote Sens. Environ. 2015, 160, 99–113. [Google Scholar] [CrossRef]
  15. Dong, J.; Xiao, X.; Menarguez, M.A.; Zhang, G.; Qin, Y.; Thau, D.; Biradar, C.; Moore, B., III. Mapping Paddy Rice Planting Area in Northeastern Asia with Landsat 8 Images, Phenology-Based Algorithm and Google Earth Engine. Remote Sens. Environ. 2016, 185, 142–154. [Google Scholar] [CrossRef] [PubMed]
  16. Qiu, B.; Li, W.; Tang, Z.; Chen, C.; Qi, W. Mapping Paddy Rice Areas Based on Vegetation Phenology and Surface Moisture Conditions. Ecol. Indic. 2015, 56, 79–86. [Google Scholar] [CrossRef]
  17. Oguro, Y.; Suga, Y.; Takeuchi, S.; Ogawa, M.; Konishi, T.; Tsuchiya, K. Comparison of SAR and Optical Sensor Data for Monitoring of Rice Plant around Hiroshima. Adv. Space Res. 2001, 28, 195–200. [Google Scholar] [CrossRef]
  18. Ni, R.; Tian, J.; Li, X.; Yin, D.; Li, J.; Gong, H.; Zhang, J.; Zhu, L.; Wu, D. An Enhanced Pixel-Based Phenological Feature for Accurate Paddy Rice Mapping with Sentinel-2 Imagery in Google Earth Engine. ISPRS J. Photogramm. Remote Sens. 2021, 178, 282–296. [Google Scholar] [CrossRef]
  19. Nguyen, T.T.H.; De Bie, C.A.J.M.; Ali, A.; Smaling, E.M.A.; Chu, T.H. Mapping the Irrigated Rice Cropping Patterns of the Mekong Delta, Vietnam, through Hyper-Temporal SPOT NDVI Image Analysis. Int. J. Remote Sens. 2012, 33, 415–434. [Google Scholar] [CrossRef]
  20. Chen, C.; Mcnairn, H. A Neural Network Integrated Approach for Rice Crop Monitoring. Int. J. Remote Sens. 2006, 27, 1367–1393. [Google Scholar] [CrossRef]
  21. Wei, L.; Luo, Y.; Xu, L.; Zhang, Q.; Cai, Q.; Shen, M. Deep Convolutional Neural Network for Rice Density Prescription Map at Ripening Stage Using Unmanned Aerial Vehicle-Based Remotely Sensed Images. Remote Sens. 2021, 14, 46. [Google Scholar] [CrossRef]
  22. Zhang, Z.; Liu, Q.; Wang, Y. Road Extraction by Deep Residual U-Net. IEEE Geosci. Remote Sens. Lett. 2018, 15, 749–753. [Google Scholar] [CrossRef]
  23. Zhong, L.; Hu, L.; Zhou, H. Deep Learning Based Multi-Temporal Crop Classification. Remote Sens. Environ. 2019, 221, 430–443. [Google Scholar] [CrossRef]
  24. Xia, L.; Zhang, R.; Chen, L.; Li, L.; Yi, T.; Wen, Y.; Ding, C.; Xie, C. Evaluation of Deep Learning Segmentation Models for Detection of Pine Wilt Disease in Unmanned Aerial Vehicle Images. Remote Sens. 2021, 13, 3594. [Google Scholar] [CrossRef]
  25. Zhang, M.; Lin, H.; Wang, G.; Sun, H.; Fu, J. Mapping Paddy Rice Using a Convolutional Neural Network (CNN) with Landsat 8 Datasets in the Dongting Lake Area, China. Remote Sens. 2018, 10, 1840. [Google Scholar] [CrossRef]
  26. Xia, L.; Zhao, F.; Chen, J.; Yu, L.; Lu, M.; Yu, Q.; Liang, S.; Fan, L.; Sun, X.; Wu, S. A Full Resolution Deep Learning Network for Paddy Rice Mapping Using Landsat Data. ISPRS J. Photogramm. Remote Sens. 2022, 194, 91–107. [Google Scholar] [CrossRef]
  27. He, Y.; Dong, J.; Liao, X.; Sun, L.; Wang, Z.; You, N.; Li, Z.; Fu, P. Examining Rice Distribution and Cropping Intensity in a Mixed Single-and Double-Cropping Region in South China Using All Available Sentinel 1/2 Images. Int. J. Appl. Earth Obs. Geoinf. 2021, 101, 102351. [Google Scholar] [CrossRef]
  28. Zhu, L.; Liu, X.; Wu, L.; Liu, M.; Lin, Y.; Meng, Y.; Ye, L.; Zhang, Q.; Li, Y. Detection of Paddy Rice Cropping Systems in Southern China with Time Series Landsat Images and Phenology-Based Algorithms. GIScience Remote Sens. 2021, 58, 733–755. [Google Scholar] [CrossRef]
  29. Ali, M.; Clausi, D. Using the Canny Edge Detector for Feature Extraction and Enhancement of Remote Sensing Images. In Proceedings of the IGARSS 2001. Scanning the Present and Resolving the Future. Proceedings. IEEE 2001 International Geoscience and Remote Sensing Symposium (Cat. No. 01CH37217), Sydney, NSW, Australia, 9–13 July 2001; IEEE: Piscataway, NJ, USA, 2001; Volume 5, pp. 2298–2300. [Google Scholar]
  30. Guiming, S.; Jidong, S. Remote Sensing Image Edge-Detection Based on Improved Canny Operator. In Proceedings of the 2016 8th IEEE International Conference on Communication Software and Networks (ICCSN), Beijing, China, 4–6 June 2016; IEEE: Piscataway, NJ, USA, 2016; pp. 652–656. [Google Scholar]
  31. Kumar, V.; Ladha, J.K. Direct Seeding of Rice: Recent Developments and Future Research Needs. Adv. Agron. 2011, 111, 297–413. [Google Scholar]
  32. Xu, J.; Zhu, Y.; Zhong, R.; Lin, Z.; Xu, J.; Jiang, H.; Huang, J.; Li, H.; Lin, T. DeepCropMapping: A Multi-Temporal Deep Learning Approach with Improved Spatial Generalizability for Dynamic Corn and Soybean Mapping. Remote Sens. Environ. 2020, 247, 111946. [Google Scholar] [CrossRef]
  33. Huang, Z.-K.; Chau, K.-W. A New Image Thresholding Method Based on Gaussian Mixture Model. Appl. Math. Comput. 2008, 205, 899–907. [Google Scholar] [CrossRef]
  34. Han, J.; Zhang, Z.; Luo, Y.; Cao, J.; Zhang, L.; Cheng, F.; Zhuang, H.; Zhang, J. AsiaRiceMap10m: High-Resolution Annual Paddy Rice Maps for Southeast and Northeast Asia from 2017 to 2019. Earth Syst. Sci. Data Discusss 2021, 2021, 1–27. [Google Scholar]
  35. Yang, L.; Wang, L.; Abubakar, G.A.; Huang, J. High-Resolution Rice Mapping Based on SNIC Segmentation and Multi-Source Remote Sensing Images. Remote Sens. 2021, 13, 1148. [Google Scholar] [CrossRef]
  36. García-Pedrero, A.; Gonzalo-Martín, C.; Lillo-Saavedra, M. A Machine Learning Approach for Agricultural Parcel Delineation through Agglomerative Segmentation. Int. J. Remote Sens. 2017, 38, 1809–1819. [Google Scholar] [CrossRef]
  37. Zhang, H.; Yuan, H.; Du, W.; Lyu, X. Crop Identification Based on Multi-Temporal Active and Passive Remote Sensing Images. ISPRS Int. J. Geo-Inf. 2022, 11, 388. [Google Scholar] [CrossRef]
  38. Zhou, Y.; Xiao, X.; Qin, Y.; Dong, J.; Zhang, G.; Kou, W.; Jin, C.; Wang, J.; Li, X. Mapping Paddy Rice Planting Area in Rice-Wetland Coexistent Areas through Analysis of Landsat 8 OLI and MODIS Images. Int. J. Appl. Earth Obs. Geoinf. 2016, 46, 1–12. [Google Scholar] [CrossRef]
  39. Guo, Y.; Jia, X.; Paull, D.; Benediktsson, J.A. Nomination-Favoured Opinion Pool for Optical-SAR-Synergistic Rice Mapping in Face of Weakened Flooding Signals. ISPRS J. Photogramm. Remote Sens. 2019, 155, 187–205. [Google Scholar] [CrossRef]
Figure 1. The flowchart of study.
Agronomy 14 00137 g001
Figure 2. Location of the study area: location of the study of China (a); spatial distribution of sample points and direct-seeded rice fields (b); study area elevation data (the data are sourced from the Google Earth platform) (c); 2022 land use cover products for the study area (the data are sourced from http://doi.org/10.5281/zenodo.4417809, accessed on 15 July 2023) (d); photo of transplanted rice (e); photo of dry direct-seeded rice (f); photo of wet direct-seeded rice (g); photo of water direct-seeded rice (h).
Agronomy 14 00137 g002
Figure 3. Detailed information concerning the cultivation timetable and irrigation techniques for the main crops.
Agronomy 14 00137 g003
Figure 4. Time series curves of MNDWI for different crops throughout the year (a); time series curves of MNDWI in three selected phases (b).
Agronomy 14 00137 g004
Figure 5. The image of the selected area A (A), the results of each segmentation scale of area A (ac); the image of the selected area B (B), the results of each segmentation scale of area B (df); different segmentation scale renderings of sites A and B. Planet image of study area (g), cultivated land plot extraction results (h).
Agronomy 14 00137 g005
Figure 6. Histograms and segmentation renderings of MNDWI in three periods: the histograms of the three time-phase MNDWI grey values (ac); segmentation results of the three phases (df).
Agronomy 14 00137 g006
Figure 7. Change detection process and classification results: the true colour of Sentinel-2 images was composited by red, green, and blue bands (ac); surface water distribution images (df); distribution map of areas and types of changes (g,h); distribution map of rice planting types (i).
Agronomy 14 00137 g007
Figure 8. Pixel-based extraction results (A); extraction results based on cultivated land plot objects (B); 2022 high-resolution China single-crop rice planting distribution dataset (C).
Agronomy 14 00137 g008
Figure 9. Comparison of the area extracted based on pixels and the area of surveyed and statistical plots (a) and the comparison of the area extracted based on cultivated land objects and the area of surveyed and statistically plotted plots (b).
Agronomy 14 00137 g009
Table 1. Extraction rules for planting types.
Date29 April9 May13 JunePlanting Type
Type
000Non-floodedNon-floodedNon-floodedDryland
001Non-floodedNon-floodedFloodedDry direct-seeded
010Non-floodedFloodedNon-floodedWet direct-seeded
011Non-floodedFloodedFloodedWater direct-seeded
111FloodedFloodedFloodedTransplanted
Table 2. Evaluation of crop extraction accuracy based on pixels and cultivated land objects.
ModelPlanting TypeArea
( k m 2 )
User
Accuracy (%)
Producer
Accuracy (%)
F1 Score
(%)
Overall
Accuracy (%)
Kappa
Coefficient
Based On pixelDry direct-seeded7.98819387890.86
Wet direct-seeded8.98819085
Water direct-seeded36.41898084
Transplanted232.55899190
Dryland263.46979395
Based on cultivated land plot objectDry direct-seeded7.97839287910.89
Wet direct-seeded5.91849087
Water direct-seeded36.15918689
Transplanted219.23959193
Dryland255.33979797
ProductTransplanted245.28899491880.70
Dryland 847378
Disclaimer/Publisher’s Note: The statements, opinions and data contained in all publications are solely those of the individual author(s) and contributor(s) and not of MDPI and/or the editor(s). MDPI and/or the editor(s) disclaim responsibility for any injury to people or property resulting from any ideas, methods, instructions or products referred to in the content.