Abstract
Global climate warming and increased climate variability may increase the number of annual freeze–thaw cycles (FTCs) in temperate zones. The occurrence of more frequent FTCs is predicted to influence soil carbon and nitrogen cycles and increase nitrogen leaching. Biochar has the potential to increase soil organic carbon storage and decrease nitrogen leaching. This study aims to investigate the impact of freeze–thaw cycles (FTCs) on soil nitrogen leaching in temperate zones, considering the potential exacerbation of FTCs due to global climate warming and increased climate variability. This study focuses on how biochar, a carbon-rich material produced from biomass, might mitigate nitrogen leaching by influencing soil characteristics. This study explores the interactions between different laboratory-simulated FTC frequencies (ranging from 0 to 12 cycles) and various biochar addition ratios (0%, 2%, 4%, and 6% w/w) on soil nitrogen leaching based on a total of 60 soil columns. Pearson correlations between the soil quality indicators and nitrogen leaching characteristics were detected, and partial least squares path modeling (PLS-PM) was used to assess the effects of the FTCs, biochar addition ratios, and soil quality indicators on the nitrogen leaching content. The results showed that the amount of leached soil NH4+-N and NO3−-N reached 0.129–1.726 mg and 2.90–7.90 mg, respectively. NH4+-N and NO3−-N first increased and then decreased under the FTCs, with the highest values being observed after the 6th FTC. As the biochar addition ratio increased, the NH4+-N and NO3−-N contents decreased. Correlation analysis showed that the nitrogen leaching content was significantly related to the soil pH, soil organic matter (SOM), NH4+-N content, and microbial biomass carbon content (MBC) (p < 0.01). The results of the conceptual path model revealed that nitrogen leaching characteristics were significantly affected by the pH, SOM, soil nitrogen content, and biochar addition ratio. Our results suggest that biochar addition can help reduce nitrogen leaching in farmland soil in areas with black soil and seasonal freeze–thaw cycles.
1. Introduction
Freeze–thaw cycles (FTCs), a form of soil thermal dynamics, are repeated freeze–thaw processes caused by soil water transitions [1]. FTCs occur in high-latitude and high-elevation areas and temperate areas, with more than 50% of the northern hemisphere land area experiencing seasonal soil freezing. FTCs significantly affect soil nitrogen cycling [2]. Based on laboratory simulations [3] and field tests [4], increased soil nitrogen leaching is often detected under FTCs among different ecosystems [5]. Leaching of nitrogen from farmland is harmful because it leads to the eutrophication of waterways [6,7]. The intensity, frequency, and duration of FTCs may strongly affect soil structure [8], soil aggregates [9], soil microorganisms [10,11], soil compaction, and inorganic N availability [12], which all may influence soil nitrogen cycling [13,14]. Soil NH4+-N increased during FTCs because of the release from destroyed soil aggregates and dead microorganisms and the reduced absorption of damaged plant roots. Soil NO3−-N was promoted after FTCs because FTCs could increase soil nitrification and microbial mineralization [9]. NH4+-N can be absorbed by the high soil cation-exchange capacity [7], while NO3−-N may be absorbed only via biological uptake (both plants and microbiota). Furthermore, it is important to identify which soil variables have a greater impact on decreasing nitrogen leaching under FTCs.
Biochars, a C-rich solid matter produced via the pyrolysis of crop straw at high temperatures and without oxygen, can help to increase soil carbon storage [15], reduce greenhouse gas emissions, improve soil quality indicators, amend soil fertility, and increase crop yield [16]. In terms of nitrogen cycling, biochar is a nutrient source that can lead to the release of nutrients and a soil conditioner that can prevent nitrogen leaching and promote nitrogen immobilization [17]. Biochar can adsorb NH4+-N directly through the functional groups, such as carboxyl and hydroxyl ions on the surface, which help to promote the cation-exchange capacity, thus significantly increasing NH4+-N adsorption onto biochar [4]. Biochar can also chemically adsorb NO3−-N via the basic functional groups formed at high temperatures [4], while biochar has a limited ability to absorb NO3−-N. Chen et al. [3] noted that biochar addition ratios of 3% and 6% reduced nitrogen leaching and increased nitrogen retention in soils from tea plantations of different ages. The effects of biochar on soil nitrogen leaching are various among different soil types, regional variations, experimental designs, and biochar types. Some studies have found that biochar affects soil nitrogen leaching and retention by increasing the ion-exchange capacity and soil water retention [18]. Biochar can also affect nitrogen cycling by changing the soil microbial community composition [19] and promoting the abundance of nitrogen-fixing microorganisms [11].
The effects of the interaction between FTCs and biochar addition on soil nitrogen leaching has been explored by some researchers. Kettunen and Saarnio [20] found that biochar addition positively decreased nitrogen losses under an increased number of FTCs based on short-term laboratory research. Zhou et al. [4] noted that biochar application helps to decrease soil nitrogen loss during winter. Karhu et al. [7] pointed out that spruce biochar mitigated nitrogen leaching in a field study performed in boreal conditions. However, studies of the combined effect of FTCs and biochar addition on soil nitrogen leaching in frozen black soil areas are not conclusive. Therefore, additional studies are needed to determine the effect of biochar addition on nitrogen leaching characteristics during FTCs.
To detect the effects of biochar addition on soil nitrogen leaching in farmland soil in seasonally frozen areas, we carried out simulated FTC experiments on undisturbed soil columns with the addition of biochar at different ratios. The objectives of this study were as follows: (1) to detect the extents of NH4+-N and NO3−-N leaching under FTCs; (2) to detect the effects of the biochar addition rate on NH4+-N and NO3−-N leaching; and (3) to identify the main soil property variables that influence NH4+-N and NO3−-N leaching under FTCs. Our hypotheses were as follows: (1) the extent of NH4+-N and NO3−-N leaching under FTCs will differ significantly depending on the biochar addition ratio, and (2) the soil property variables are the key factors influencing soil nitrogen leaching under FTCs in black soil regions. Therefore, our study helps provide a reference for the rational application of biochar and for decreasing soil nitrogen leaching in farmland soil in seasonally frozen areas.
2. Materials and Methods
2.1. Soil and Biochar
A sample plot measuring 20 m × 30 m was selected at the XiangFang Experimental Farm of Northeast Agricultural University, Harbin, Heilongjiang Province, China (45°34′–45°46′ N, 126°22′–126°50′ E). This area has a moderate temperate continental monsoon climate and belongs to Dwa-zone, according to the Köppen climate classification, with hot and rainy summers and long and cold winters; additionally, the soil freezes in early November and thaws gradually from mid-to-late March to May. The annual average precipitation is 529 mm, and the snow cover duration is approximately 110 days. According to the diagonal method, litter was cleared from the soil surface, and soil (classified as Haplic Phaeozem [21]) from the 0–20 cm layer was collected from five sampling points. The soil was air-dried for two weeks in a ventilated area, mixed, and passed through a 2 mm soil sieve. The soil bulk density was 1.29 g/cm3, the pH was 6.6, the organic matter content was 24.82 g/kg, the total nitrogen content was 2.89 g/kg, the initial ammonium nitrogen content was 8.15 mg/kg, and the initial nitrate nitrogen content was 2.67 mg/kg.
Corn straw biochar was produced via anaerobic pyrolysis at 450 °C, with a final particle size of 1.5–2.0 mm. The pH of the biochar was 9.14, the ash mass fraction was 31.8%, and the mass fractions of total C, N, S, and K were 70.38%, 1.53%, 0.78%, and 1.66%, respectively.
2.2. Simulated Freeze–Thaw Experiment
Plexiglass cylinders measuring 10 cm in diameter and 30 cm in height with holes at the bottom with diameters of 0.5 cm were prepared for the leaching experiments. The bottom of each column was filled with a 2-centimeter-thick layer of quartz sand and gauze to filter the leaching solution. Based on the annual yield of straw, the findings of the latest studies of the effects of biochar addition on soil nitrogen cycles [3,22], crop growth, and the local field extension experience in farmland soil in Northeast China, four biochar addition ratios of 0% (CK), 2% (B1), 4% (B2), and 6% (B3) (w/w) were selected. The air-dried soil and biochar were fully mixed, and then deionized water was added to adjust the mass moisture content to 20% (the average soil moisture in the study area). Soil, biochar, and water were evenly stirred and then added to the plexiglass cylinders to make 20 cm soil columns. The bulk density of the soil columns was close to the initial value of 1.29 g/cm3. All the soil columns were incubated at a constant temperature for two weeks at 10 °C (simulating the soil temperature in early spring and late autumn) to restore its biological activity. The surfaces of the soil columns were covered with plastic wrap to prevent water evaporation.
Five treatments with different numbers of FTCs (0, 3, 6, 9, and 12 cycles) were chosen. Based on the climate and soil freezing characteristics of Northeast China, as well as the characteristics of environmental temperature changes from November 2018 to May 2022, the temperatures during the freezing–thawing period were mostly between −20 °C and 10 °C. Thus, in the freezing mode, the samples were frozen at −20 °C for 48 h, and in the thawing mode, the samples were exposed to 10 °C for 48 h. The whole FTC duration lasted 48 days. To simulate one-dimensional heat transfer in soil under real-world conditions and avoid transverse frost heave, insulation was wrapped around and under the plexiglass cylinders to ensure that the soil columns froze from top to bottom. Thus, there were 20 treatments, each replicated 3 times, for a total of 60 soil columns.
2.3. Leaching Experiment
After the FTC experiments, the soil columns exposed to the freezing and thawing temperatures were placed on the support for the leaching experiment. A continuous leaching process was adopted, and 500 mL of deionized water was slowly injected into the soil columns (based on the average precipitation experienced during the freezing and thawing periods in the study area). The water level in the soil column remained 1 cm above the soil surface throughout the leaching process. Every 30 mL leached was considered to be 1 sample, and the leaching time was recorded.
2.4. Soil Analyses
The soil moisture content was measured via the weight difference method after drying at 105 °C. The soil pH was obtained in deionized water (1:2.5, w:v) using a pH meter with a glass electrode (SevenEasy, MettlerToledo, Switzerland) [3]. Total N was determined using a semimicro Kjeldahl analyzer (Kjeltec 8400, FOSS, Denmark) [23]. Soil organic matter (SOM) was determined using an elemental analyzer (Elementar, VarioEL cube, Langenselbold, Germany). Soil inorganic nitrogen content (NH4+-N and NO3−-N) was extracted with 1 mol/L KCl and then obtained through an AA3 flow analyzer (Auto Analyzer 3, SEAL Analytical GmbH, Norderstedt, Germany). The microbial biomass carbon content (MBC) and microbial biomass nitrogen content (MBN) were measured with the chloroform fumigation direct extraction method [3]. The leached inorganic nitrogen content (NH4+-N and NO3−-N) was measured using a continuous flow analyzer (Auto Analyzer 3, SEAL Analytical GmbH, Norderstedt, Germany).
2.5. Data Analyses
We performed two-way analysis of variance (ANOVA) in SPSS 22.0 software (IBM SPSS Statistics Inc., Chicago, IL, USA) to detect the effects of the biochar addition ratio, FTCs, and their interactions on nitrogen leaching characteristics and soil quality indicators. The assumptions of normality and equal variance were verified before statistical analysis. The correlations between the soil quality indicators and nitrogen leaching characteristics were detected via the Pearson correlations through R statistical software (version 3.5.1; R Development Core Team, 2018) using the corrplot package [24]. PLS-PM was applied in R 3.5.1 statistical software using the plspm package to assess the effects of the FTCs, biochar addition ratios, and soil quality indicators on the nitrogen leaching contents. The goodness-of-fit index of the path analysis model and the R2 of the nitrogen leaching characteristics were used to evaluate the results of the PLS-PM.
3. Results and Analysis
3.1. Leaching Characteristics
The two-way ANOVA results are shown in Table 1. The leaching characteristics were significantly different between the FTCs, biochar addition ratios, and their interactions (p < 0.01). The interaction of the biochar addition ratio and FTC treatment significantly affected the leaching volume and NH4+ and NO3−-N contents in the leachate.

Table 1.
Two-way ANOVA results of the effects of FTCs, biochar addition ratios, and their interactions on nitrogen leaching characteristics.
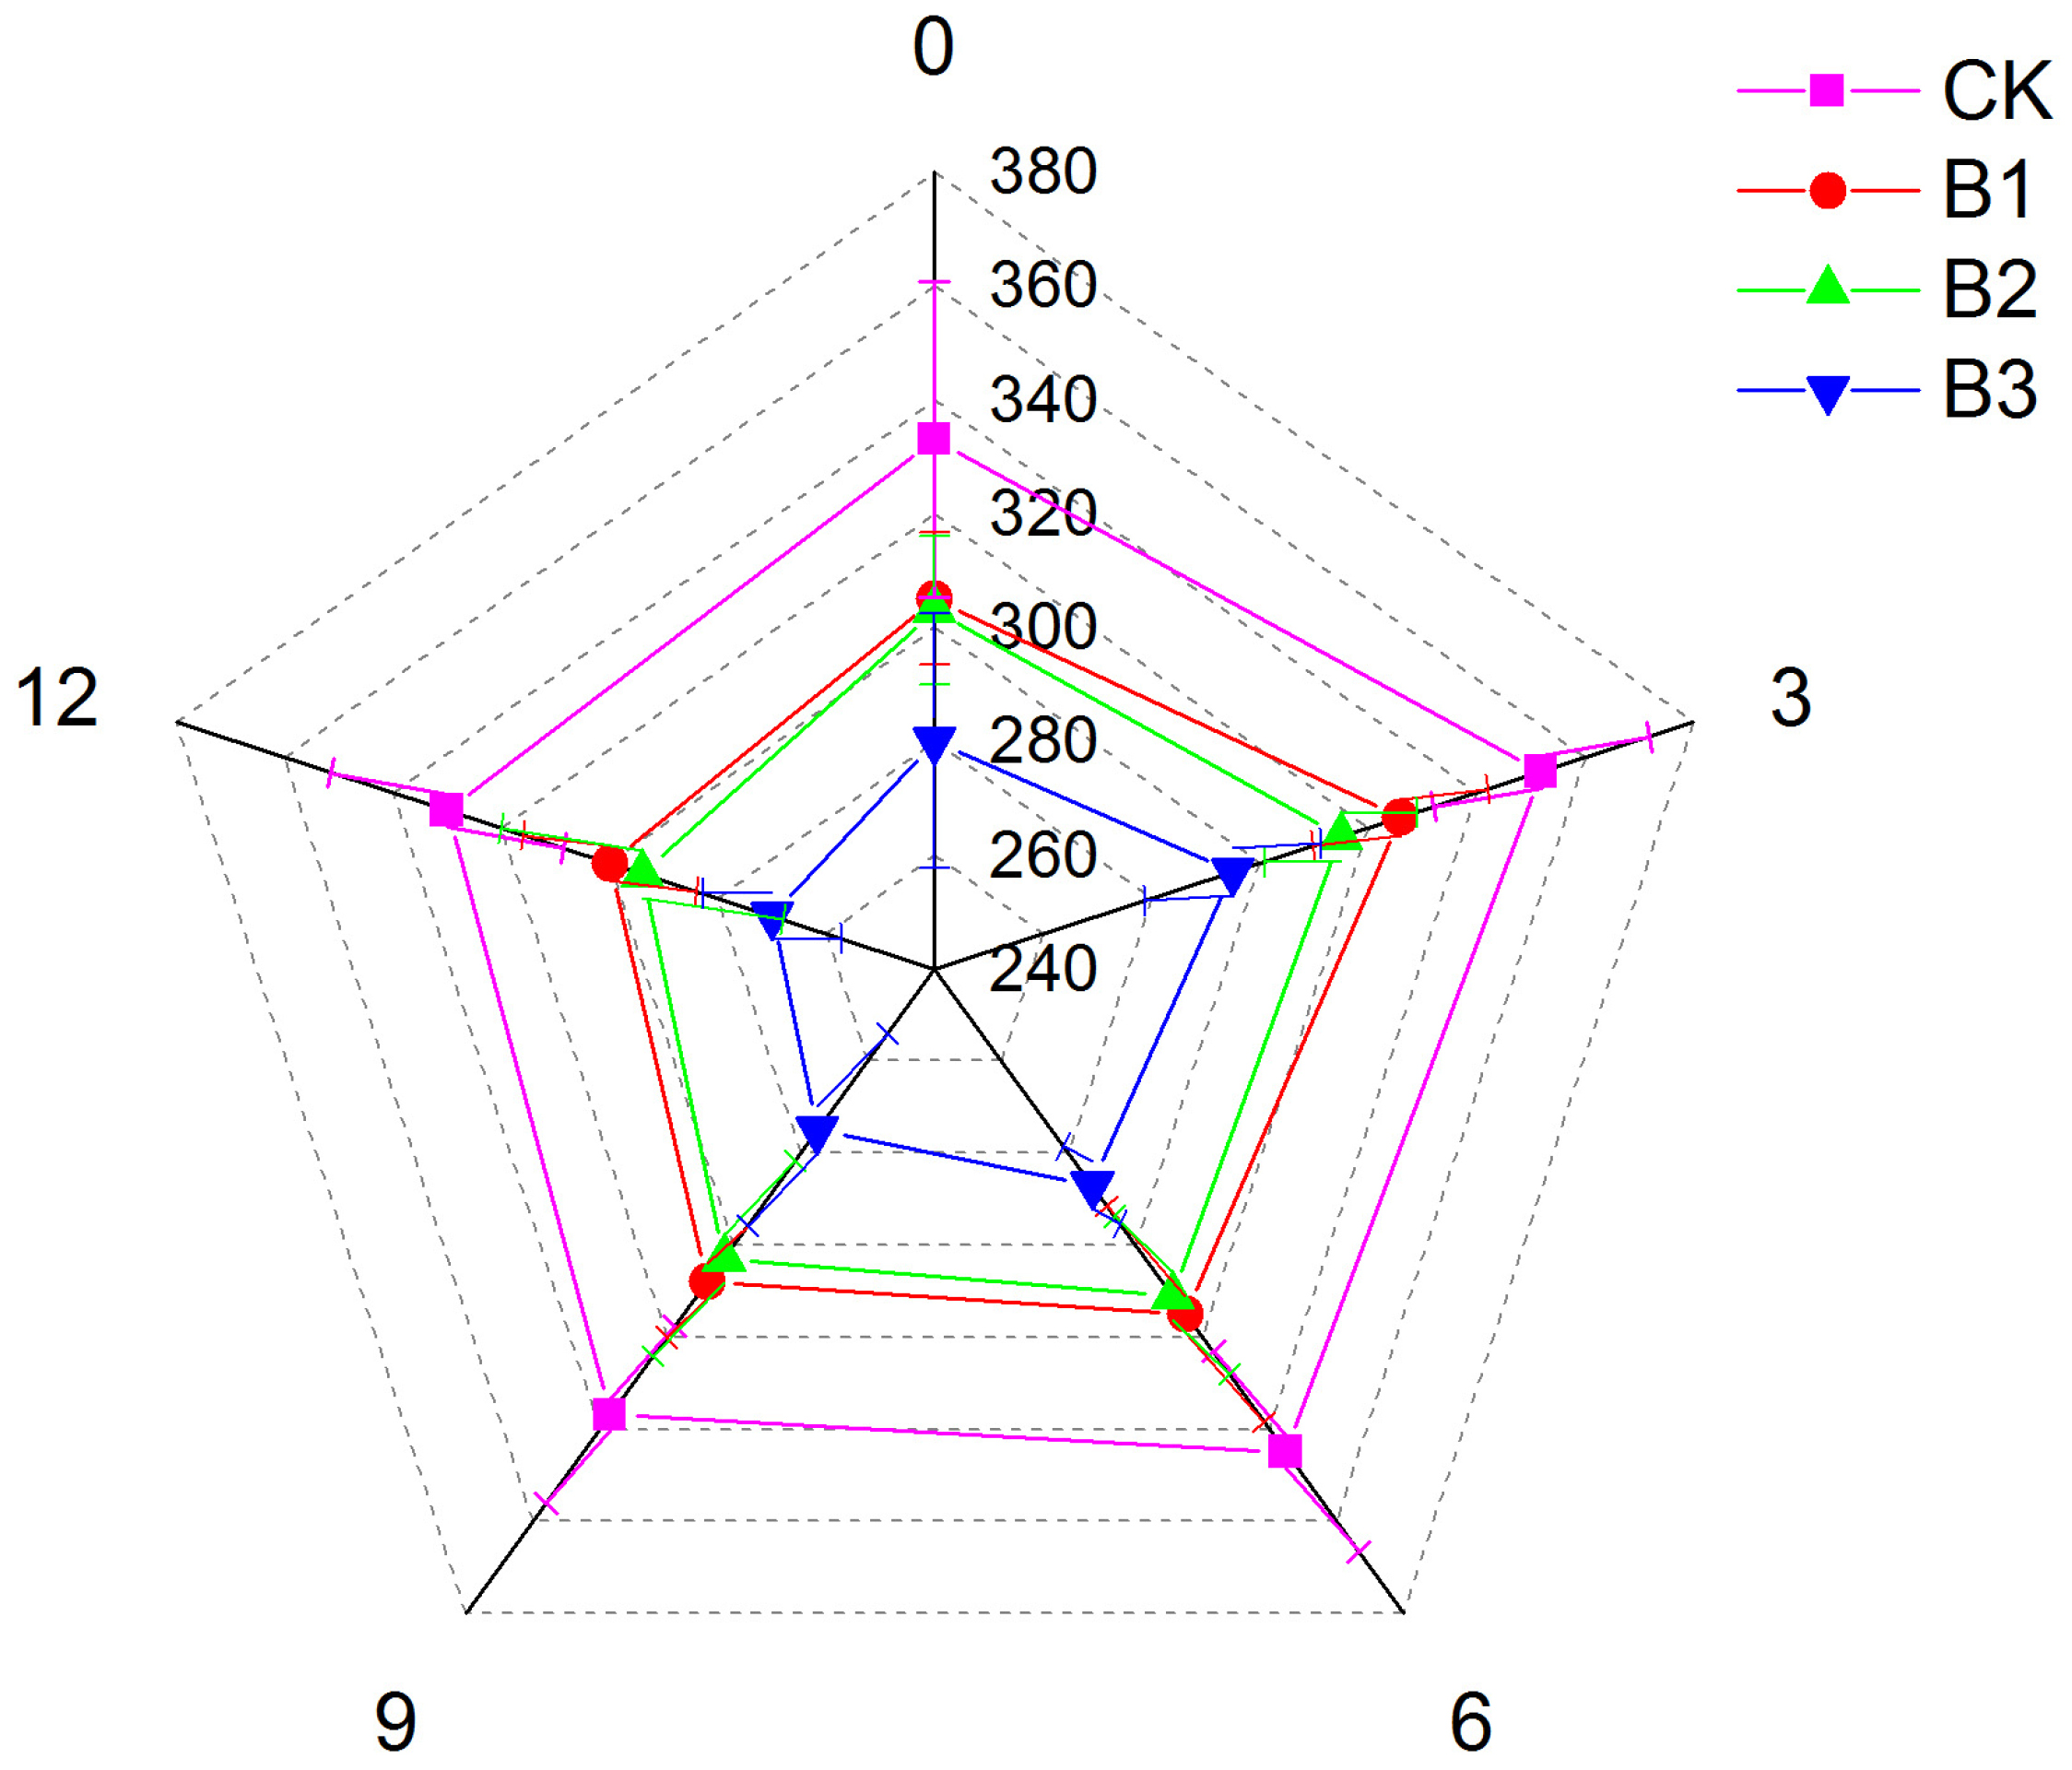
The leaching volume ranged from 270 to 352 mL, and it first increased, then decreased, and finally peaked after the 3rd FTC (Figure 1). Compared with unfrozen soil, the leaching volume decreased by 0.90–3.57% after the 12th FTC. The leaching volume decreased as the biochar addition ratio increased. The soil leaching volume with a 6% biochar addition ratio decreased by 15.92–18.40% compared with that in soil without biochar.
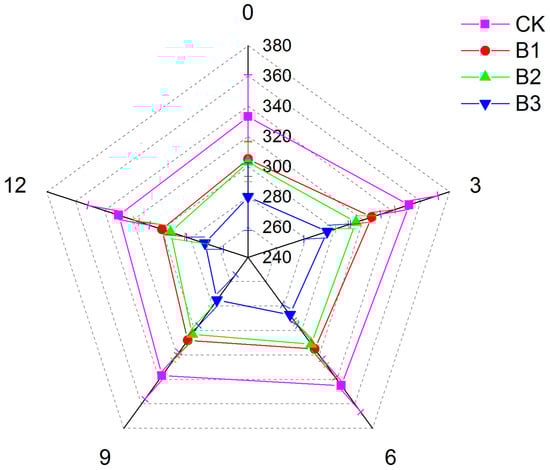
Figure 1.
Radar map of the leaching volume of soil with different biochar addition ratios and FTCs.
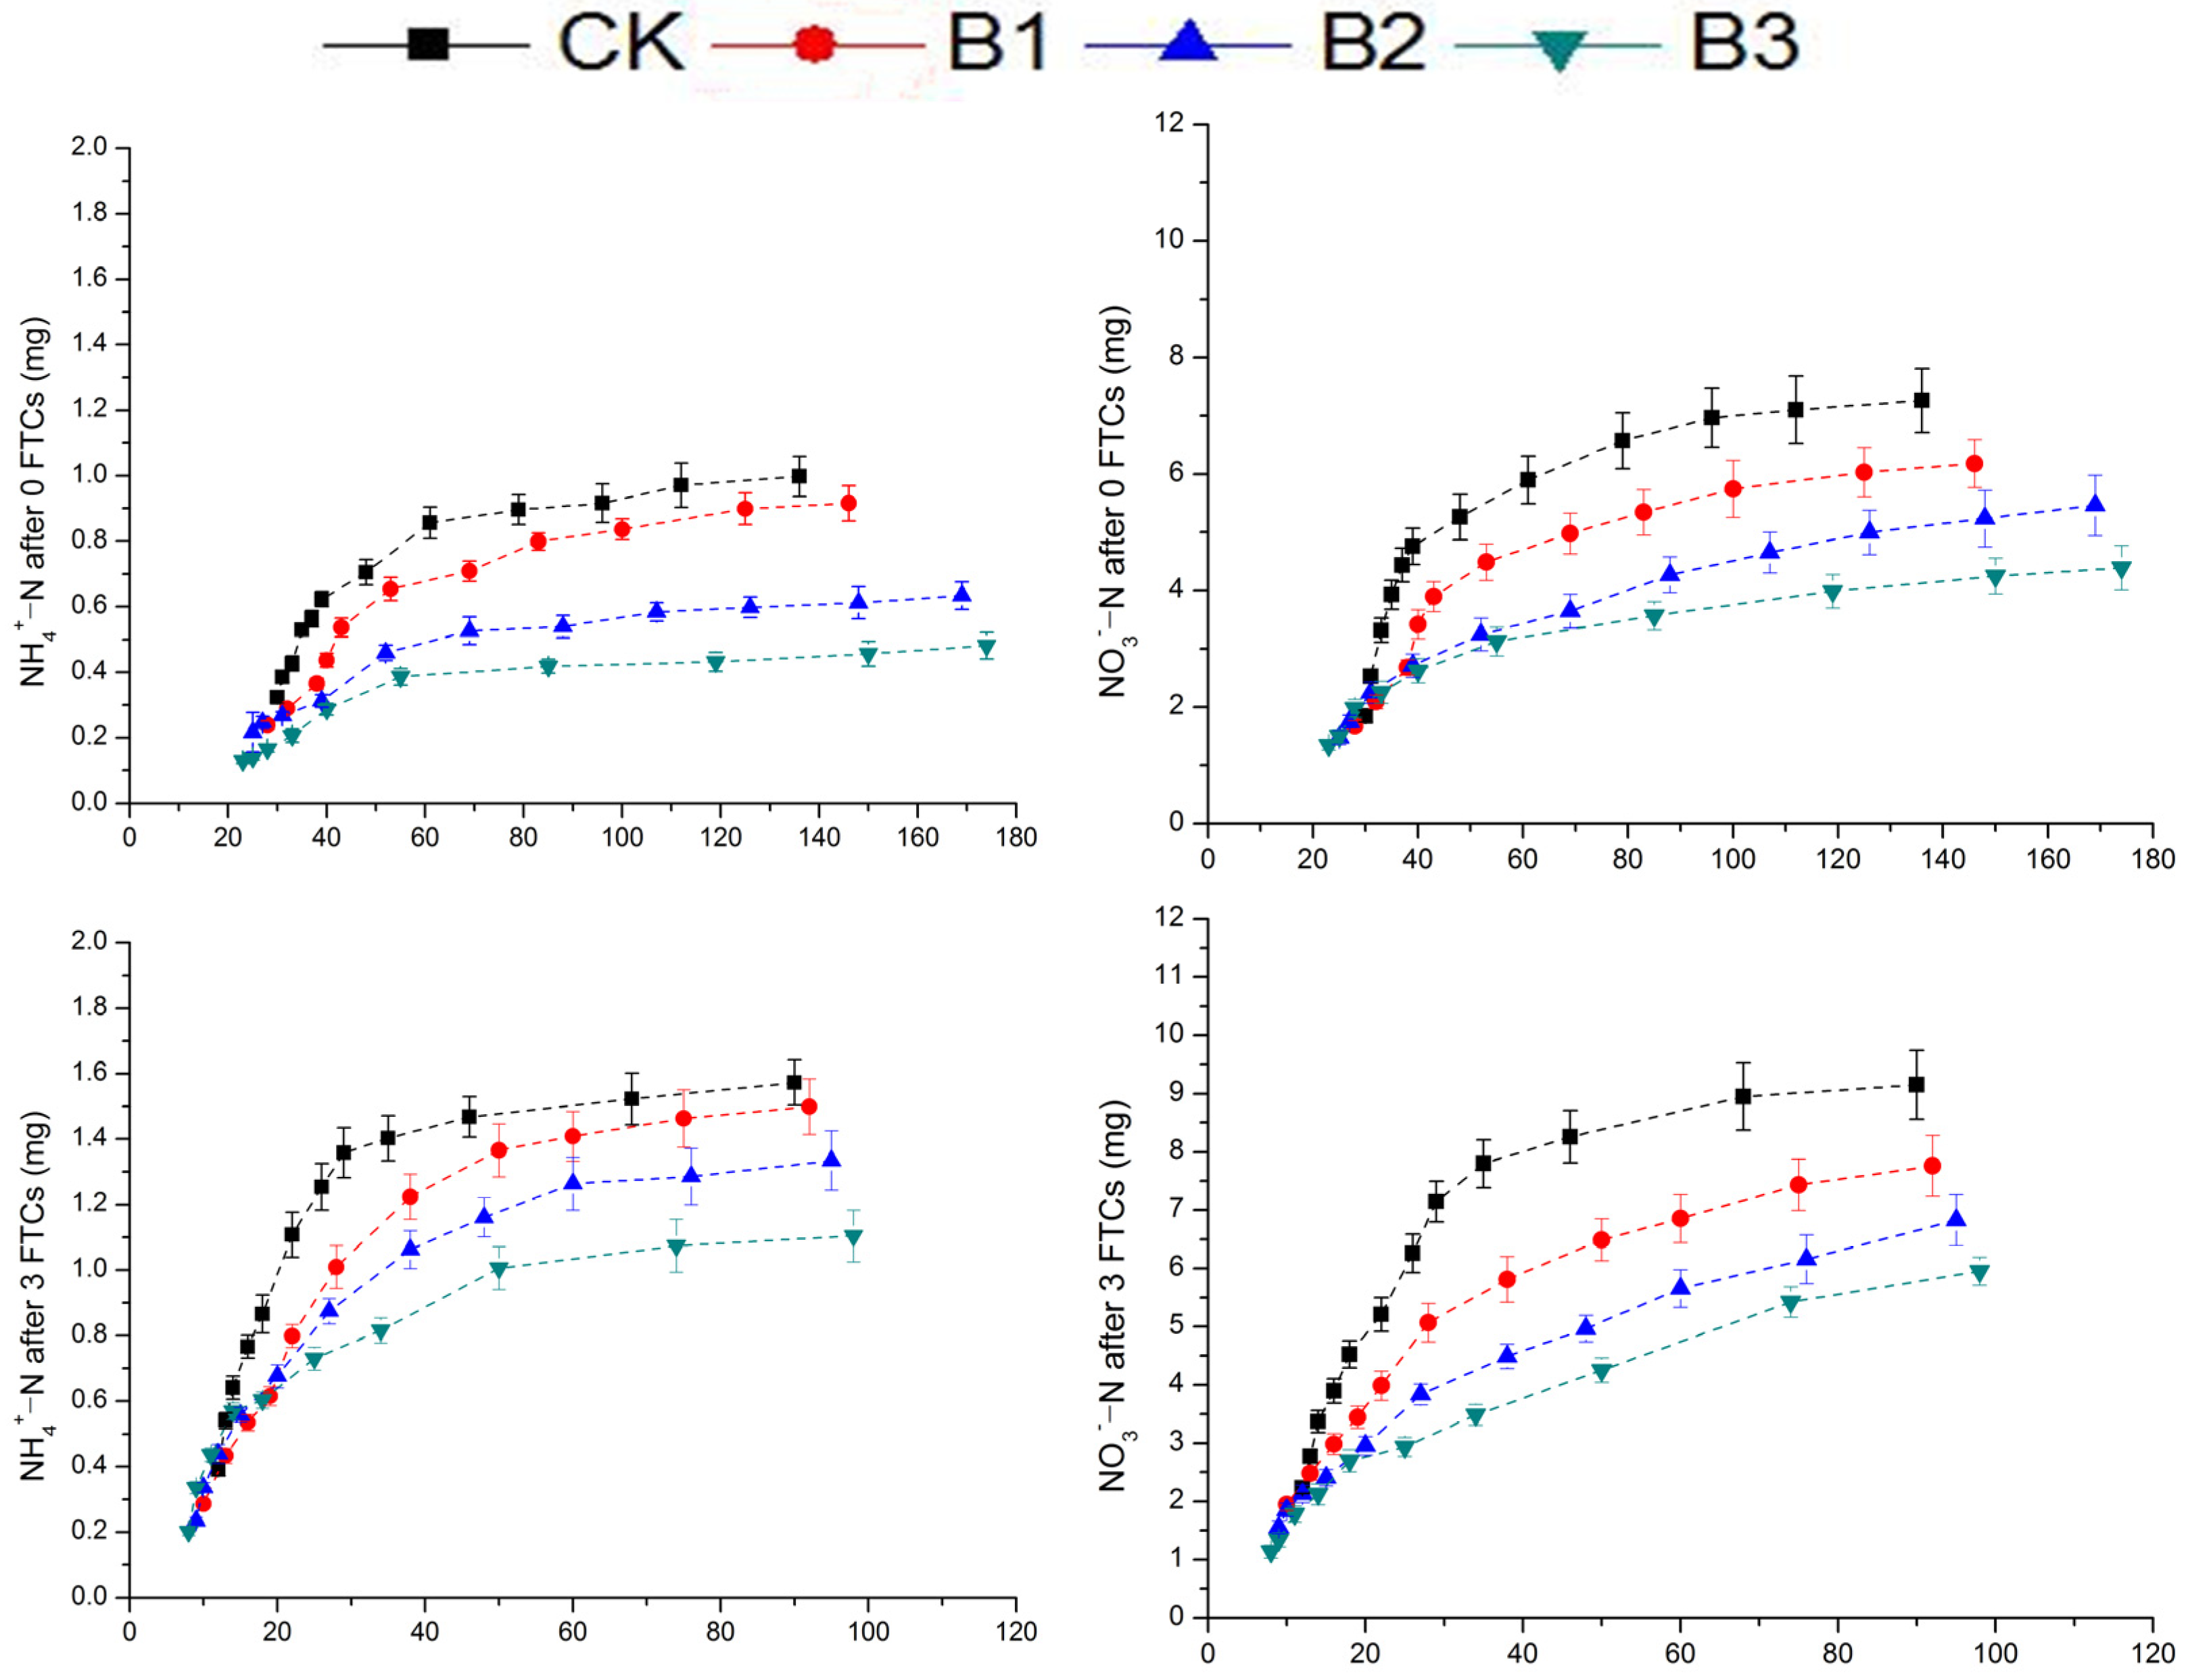
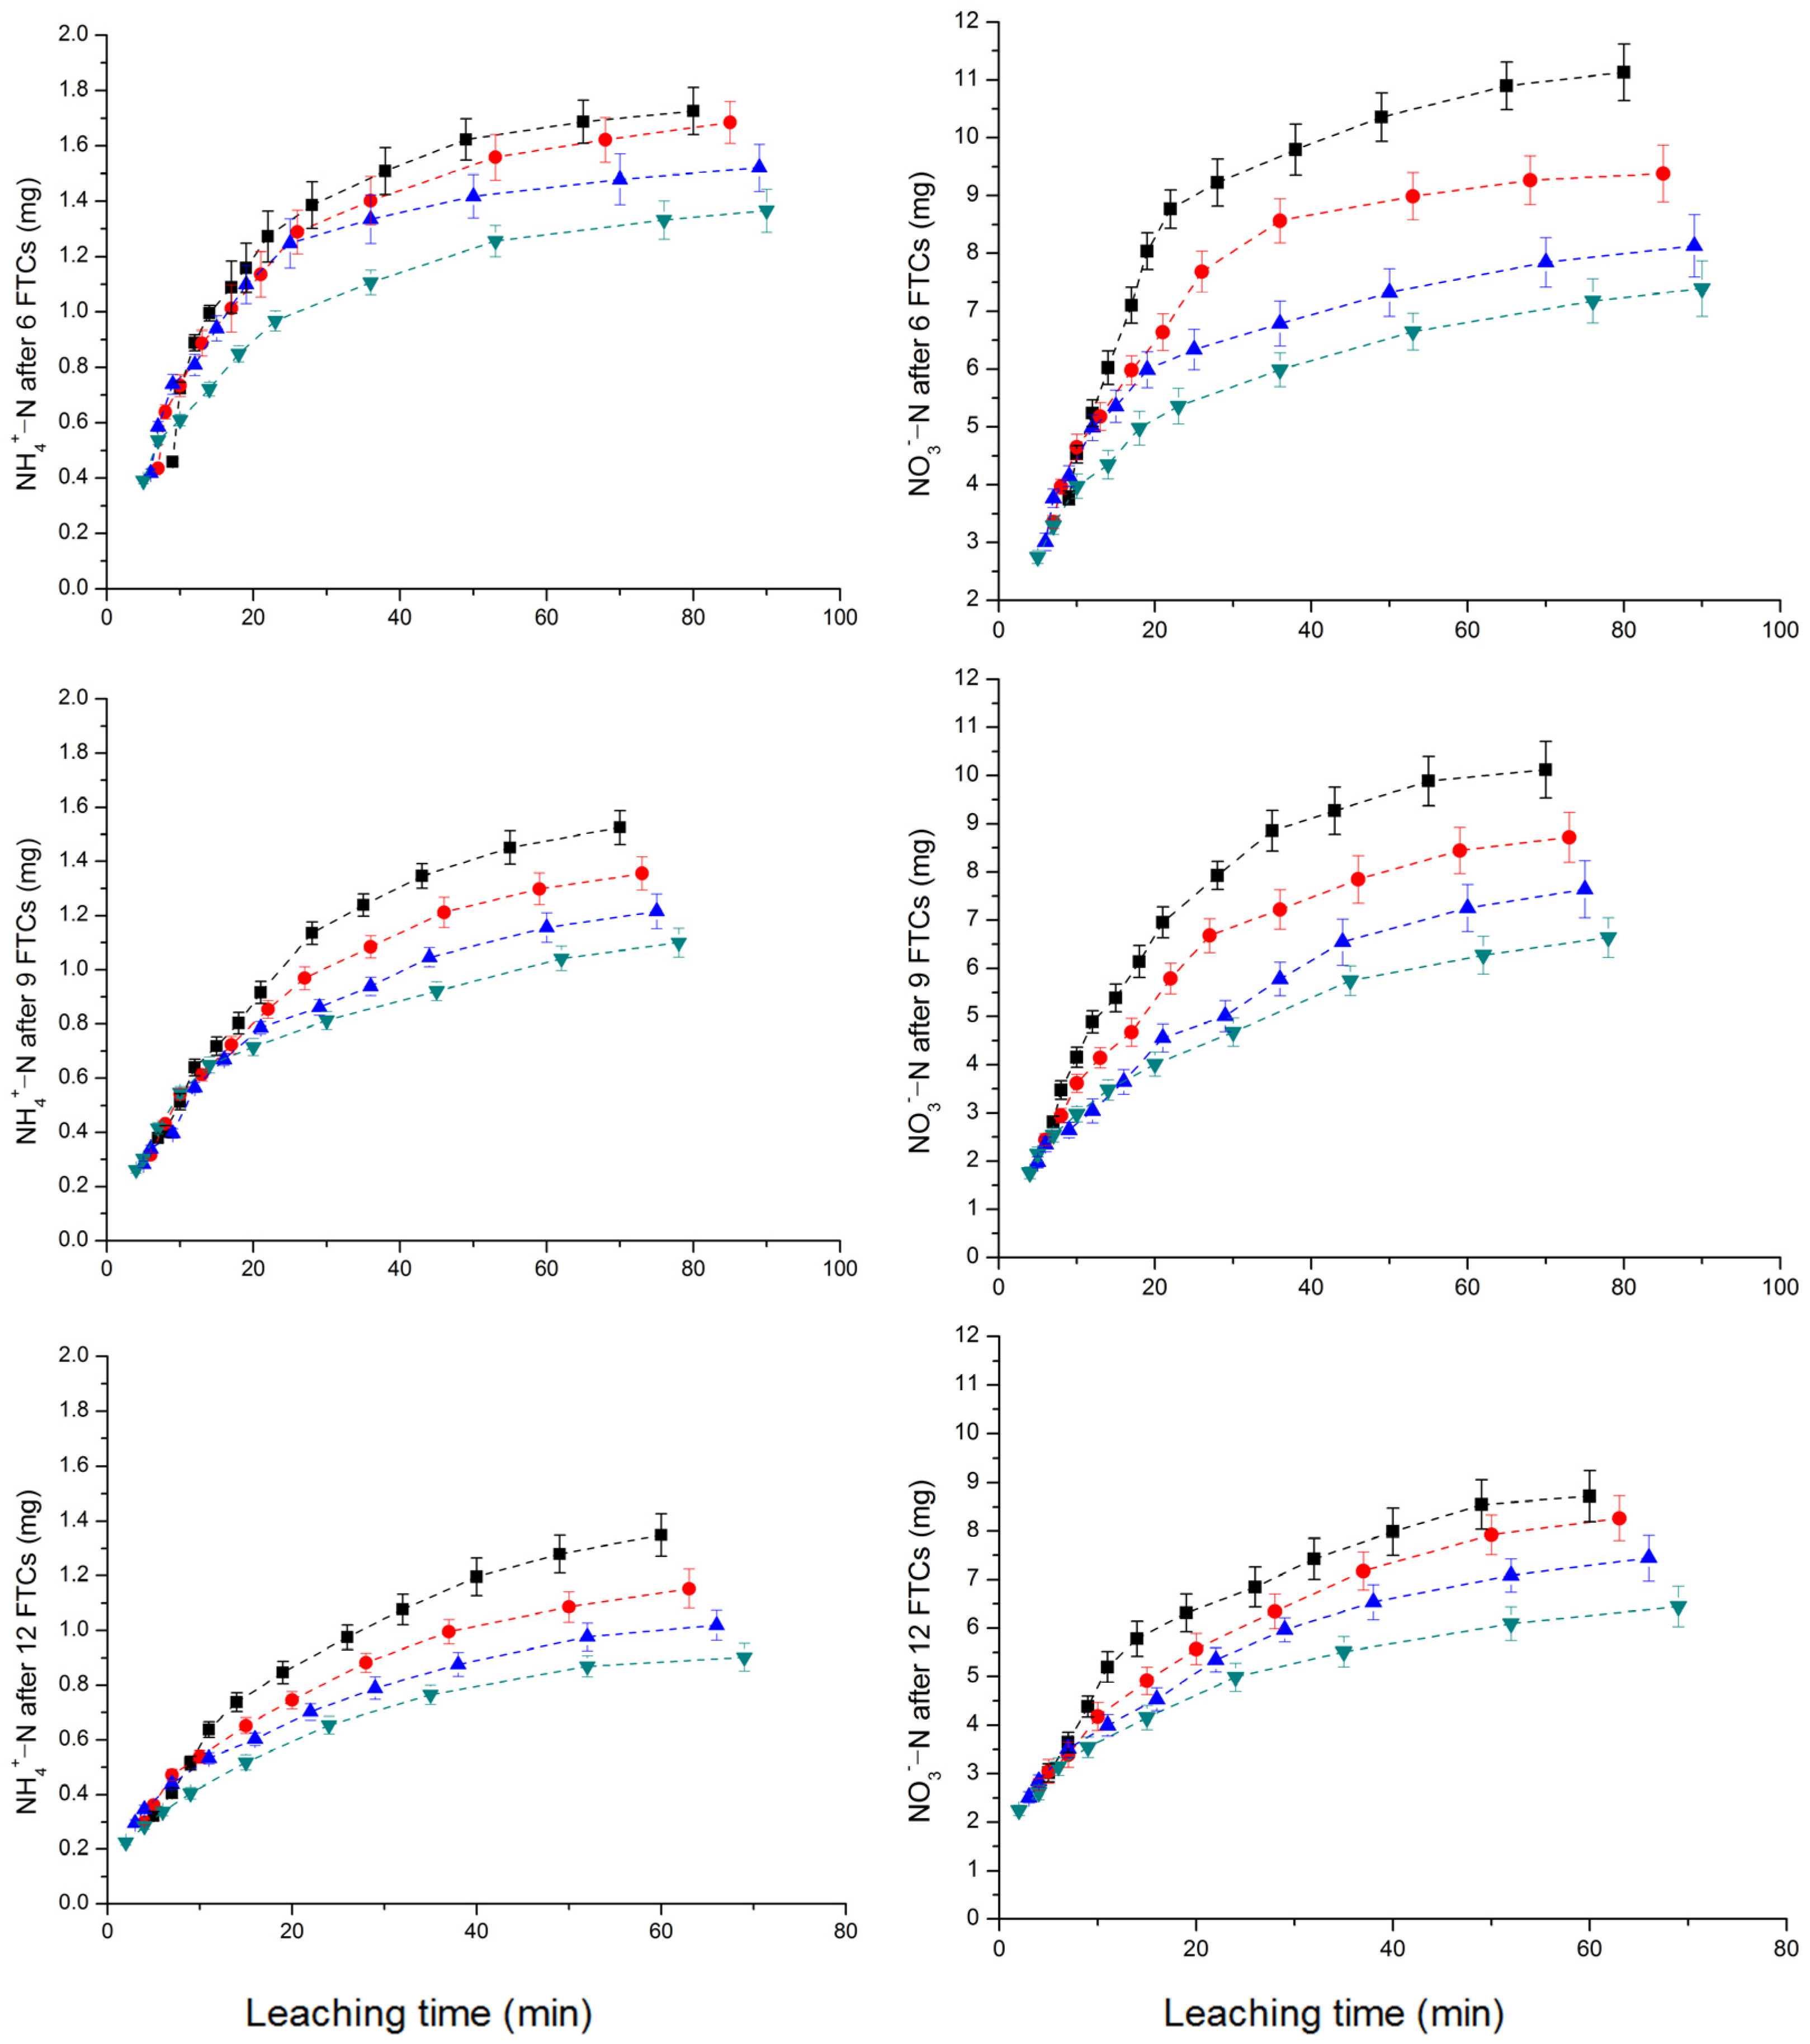
The cumulative leaching amount of NH4+-N and NO3−-N rapidly increased at the initial stage, reached a maximum after the 6th FTC, and then gradually stabilized, with values of 0.129–1.726 mg and 2.90–7.90 mg (Figure 2). Compared with those of unfrozen soil, the NH4+-N and NO3−-N contents increased by 18.33–77.98% and 23.66–48.33%, respectively, after the 12th FTC. The cumulative leaching amount of NH4+-N and NO3−-N decreased as the biochar addition ratio increased.
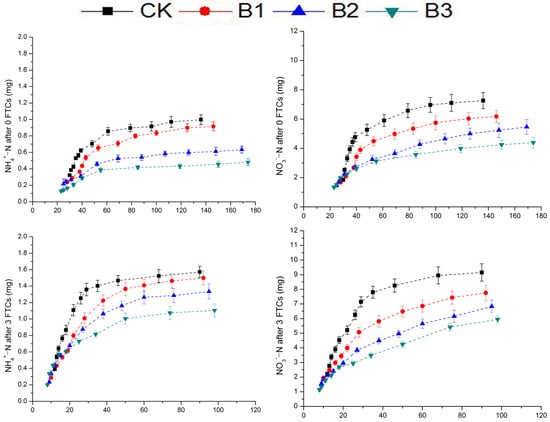
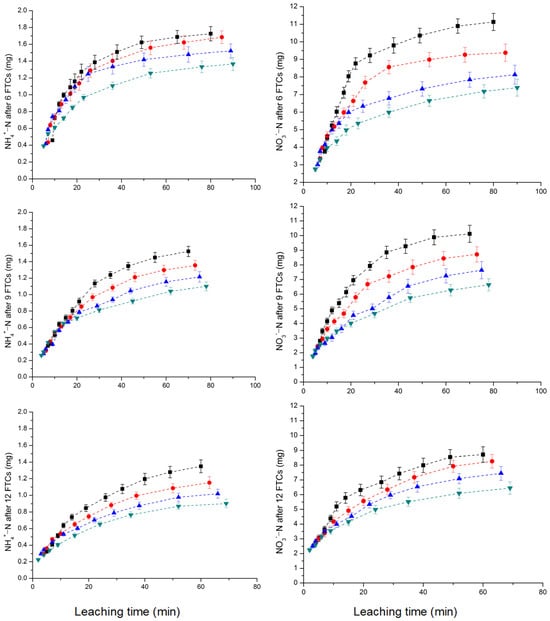
Figure 2.
Effects of biochar addition ratios and FTCs on the cumulative mass of ammonium and nitrate nitrogen contents in leachate.
3.2. Soil Quality Indicator Characteristics
The results of two-way ANOVA indicated that soil quality indicators differed significantly between the FTCs, biochar addition ratios, and their interactions (p < 0.05, Table 2). The interaction between FTCs and biochar addition ratios significantly affected the soil moisture, SOM, NO3−-N, and MBC.
Table 2.
Results of two-way ANOVA for the influence of FTCs, biochar addition ratios, and their interactions on soil quality indicators.
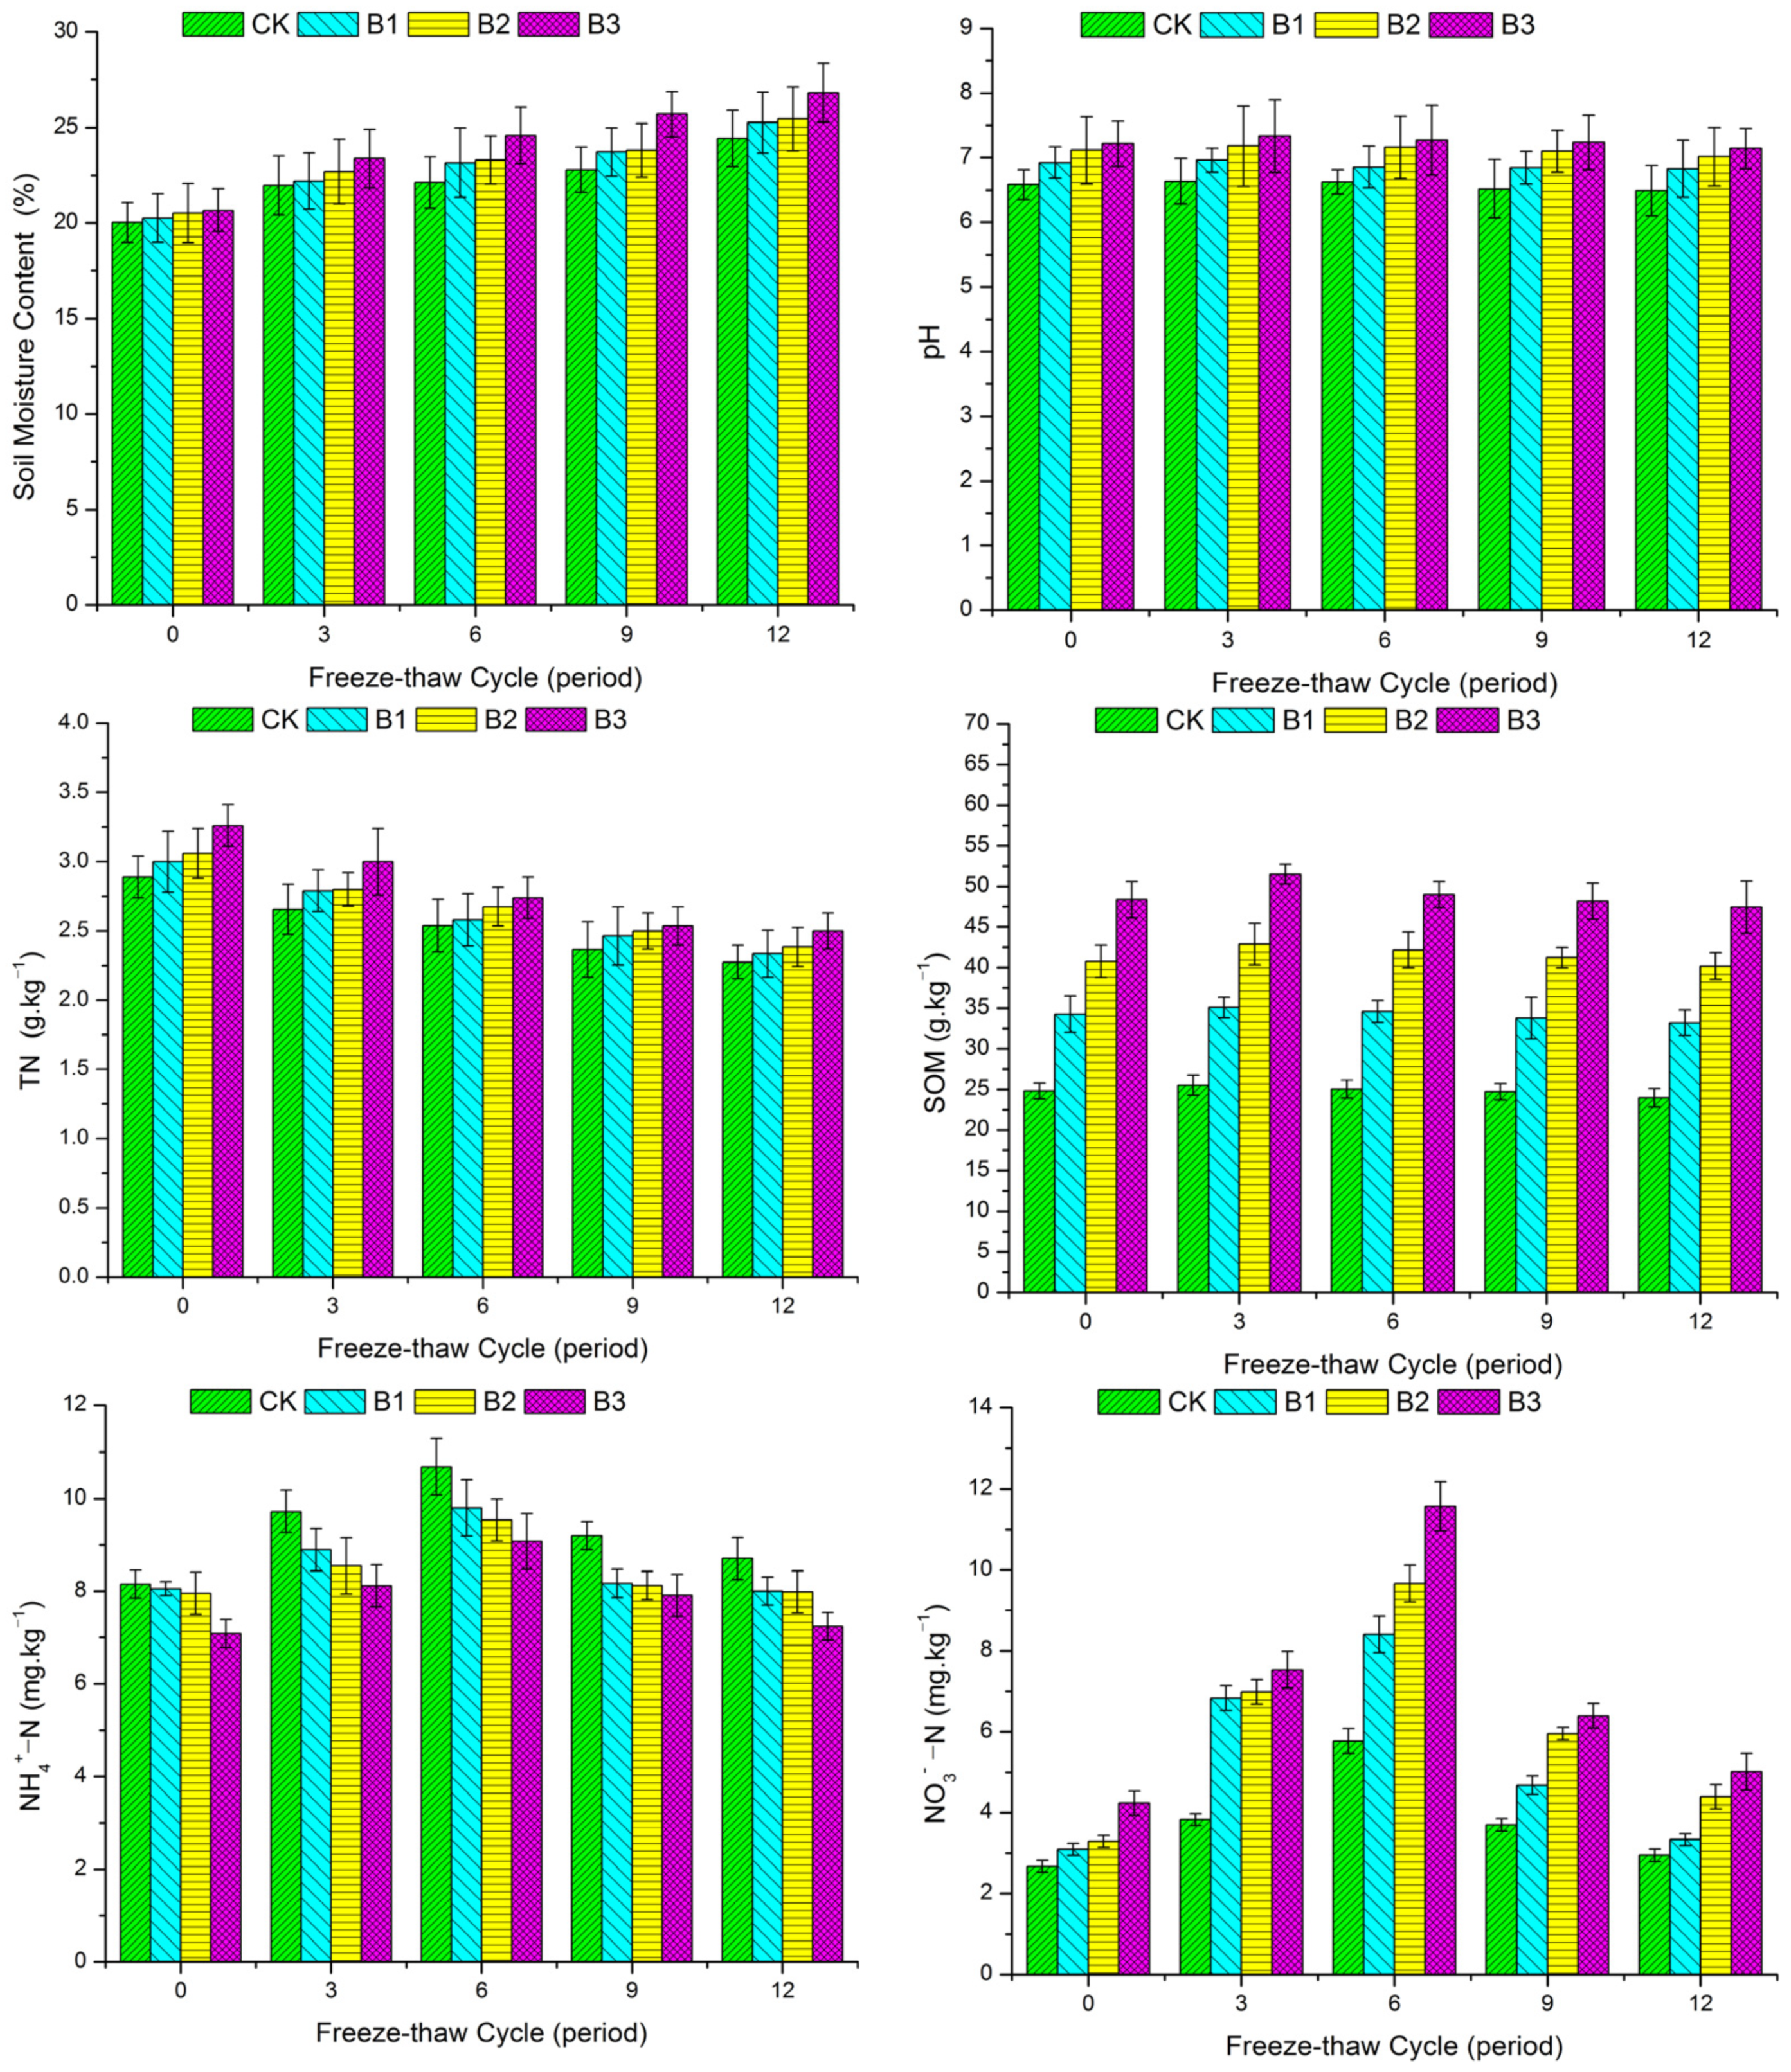
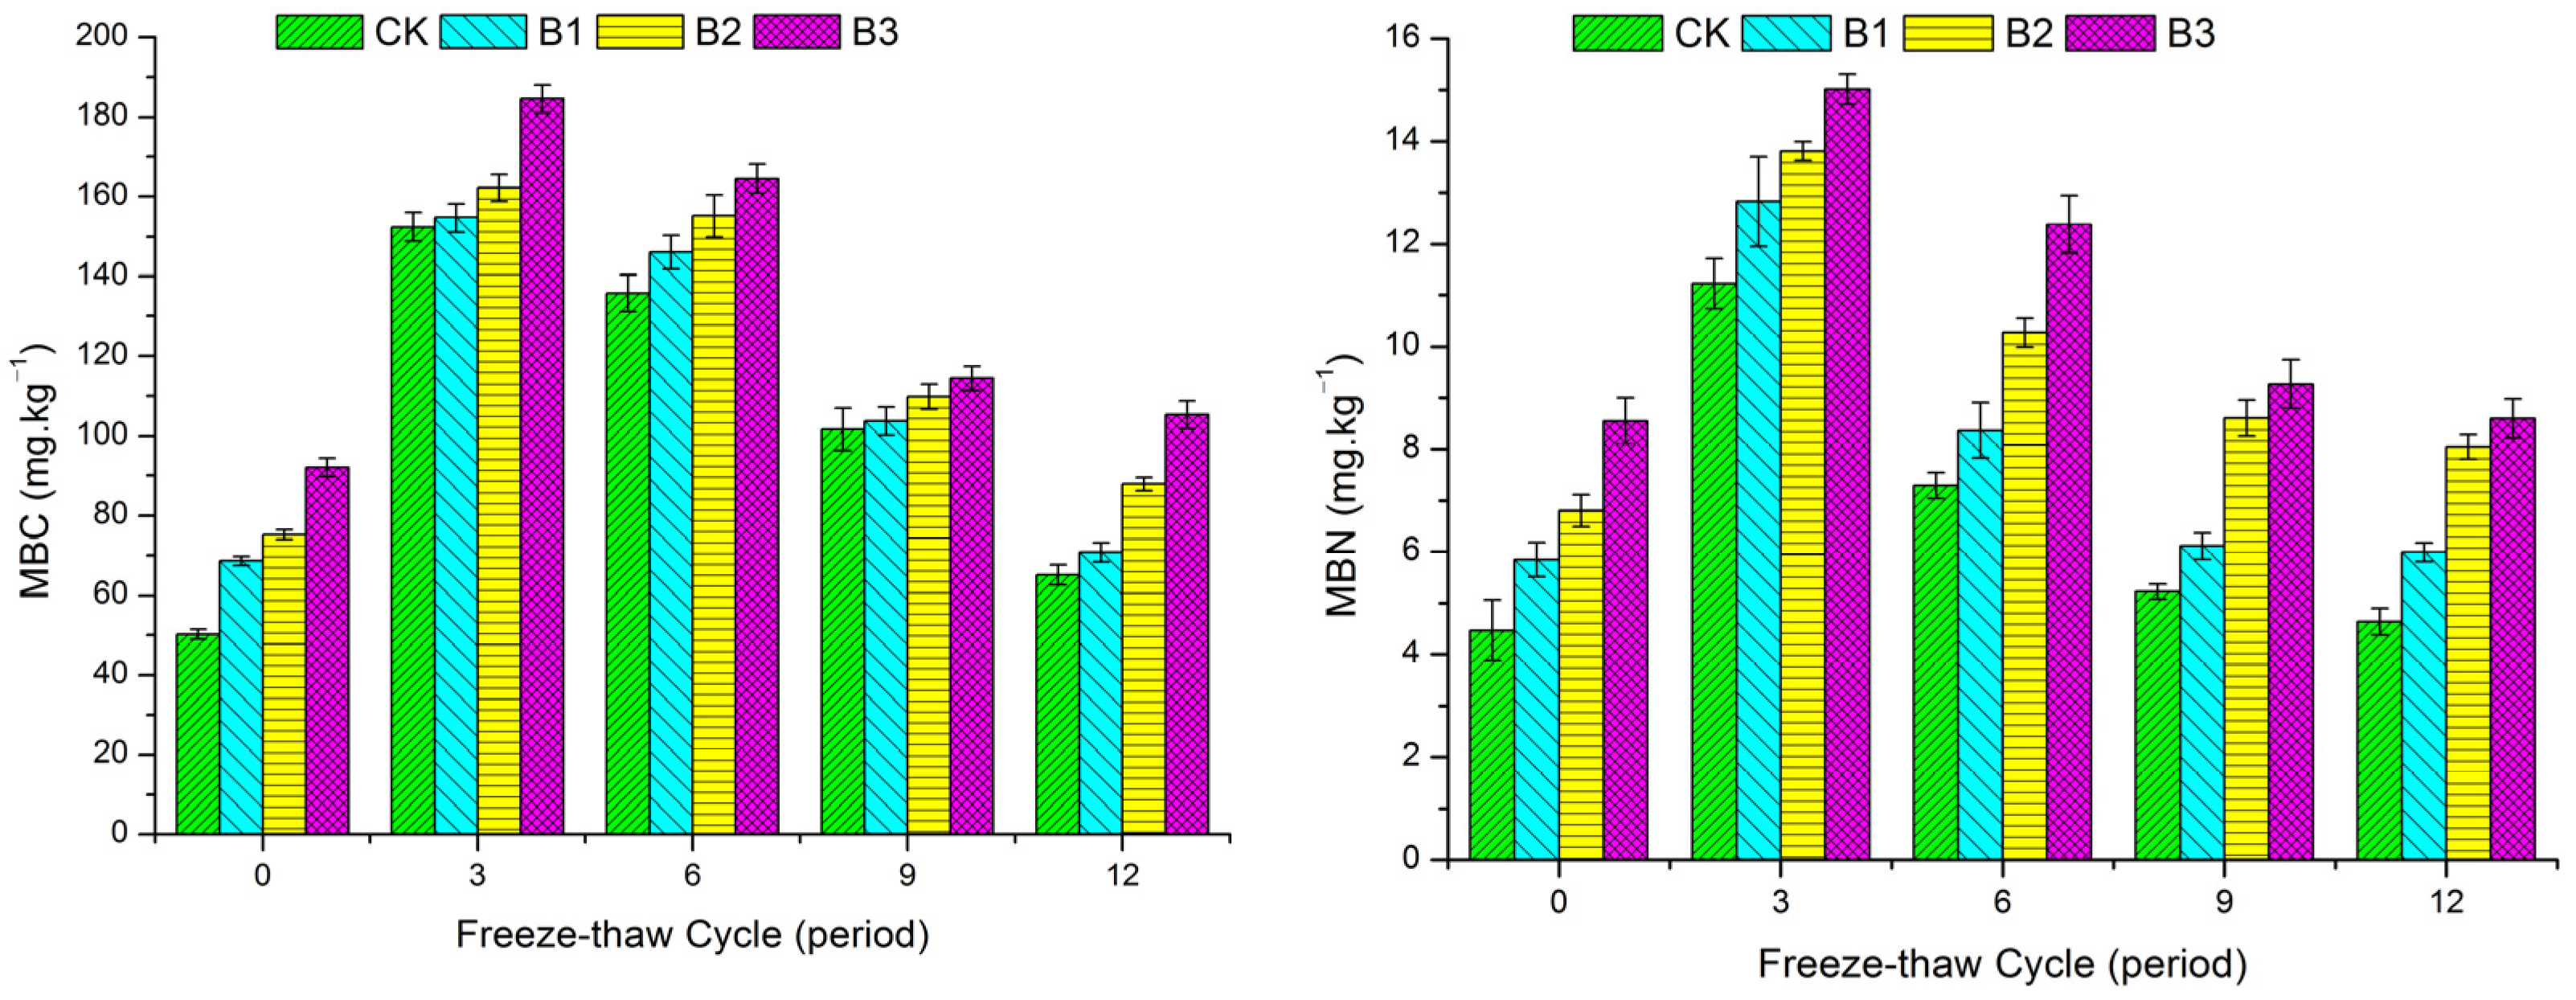
The soil moisture content increased with the increases in FTCs, with values of 20.04–26.82% recorded (Figure 3). Compared with that in the unfrozen soil column, the soil moisture content increased after the 12th FTC, with values of 21.92–29.80%. The soil pH ranged from 6.49 to 7.22, the SOM ranged from 23.96 to 51.50 g/kg, and the MBC and MBN values were 50.18–184.58 mg/kg and 4.47–15.02 mg/kg, respectively. The pH, SOM, MBC, and MBN contents peaked after the 3rd FTC and then gradually decreased. The TN ranged from 2.28 to 3.26 g/kg, and it decreased as the number of FTCs increased. The variation trends of the NH4+-N and NO3−-N contents remained the same under the different FTC treatments, and the order was as follows: 6 > 3 > 9 > 12 > 0.
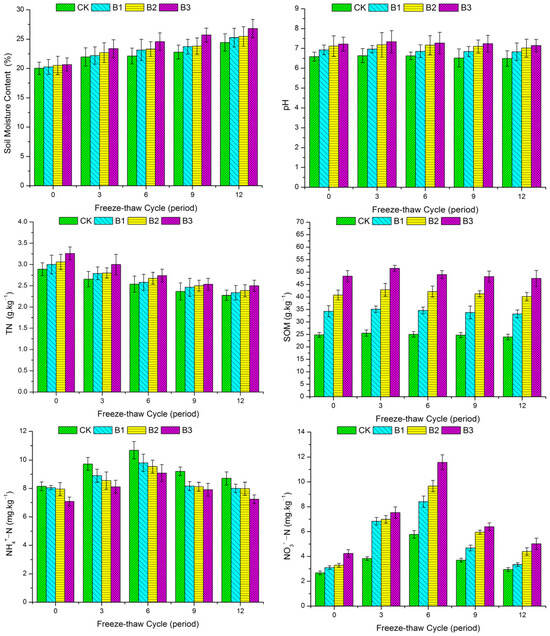

Figure 3.
Soil quality indicators under freeze–thaw cycles (FTCs). TN, total nitrogen; SOM, soil organic matter; NH4+-N, soil ammonium nitrogen; NO3−-N, soil nitrate nitrogen; MBC, microbial biomass carbon content; MBN, microbial biomass nitrogen content.
As biochar addition ratio increased, the pH, soil moisture, SOM, TN, NO3−-N, MBC, and MBN increased, and the NH4+-N values decreased.
3.3. Effects of Soil Quality Indicators on Leaching Characteristics
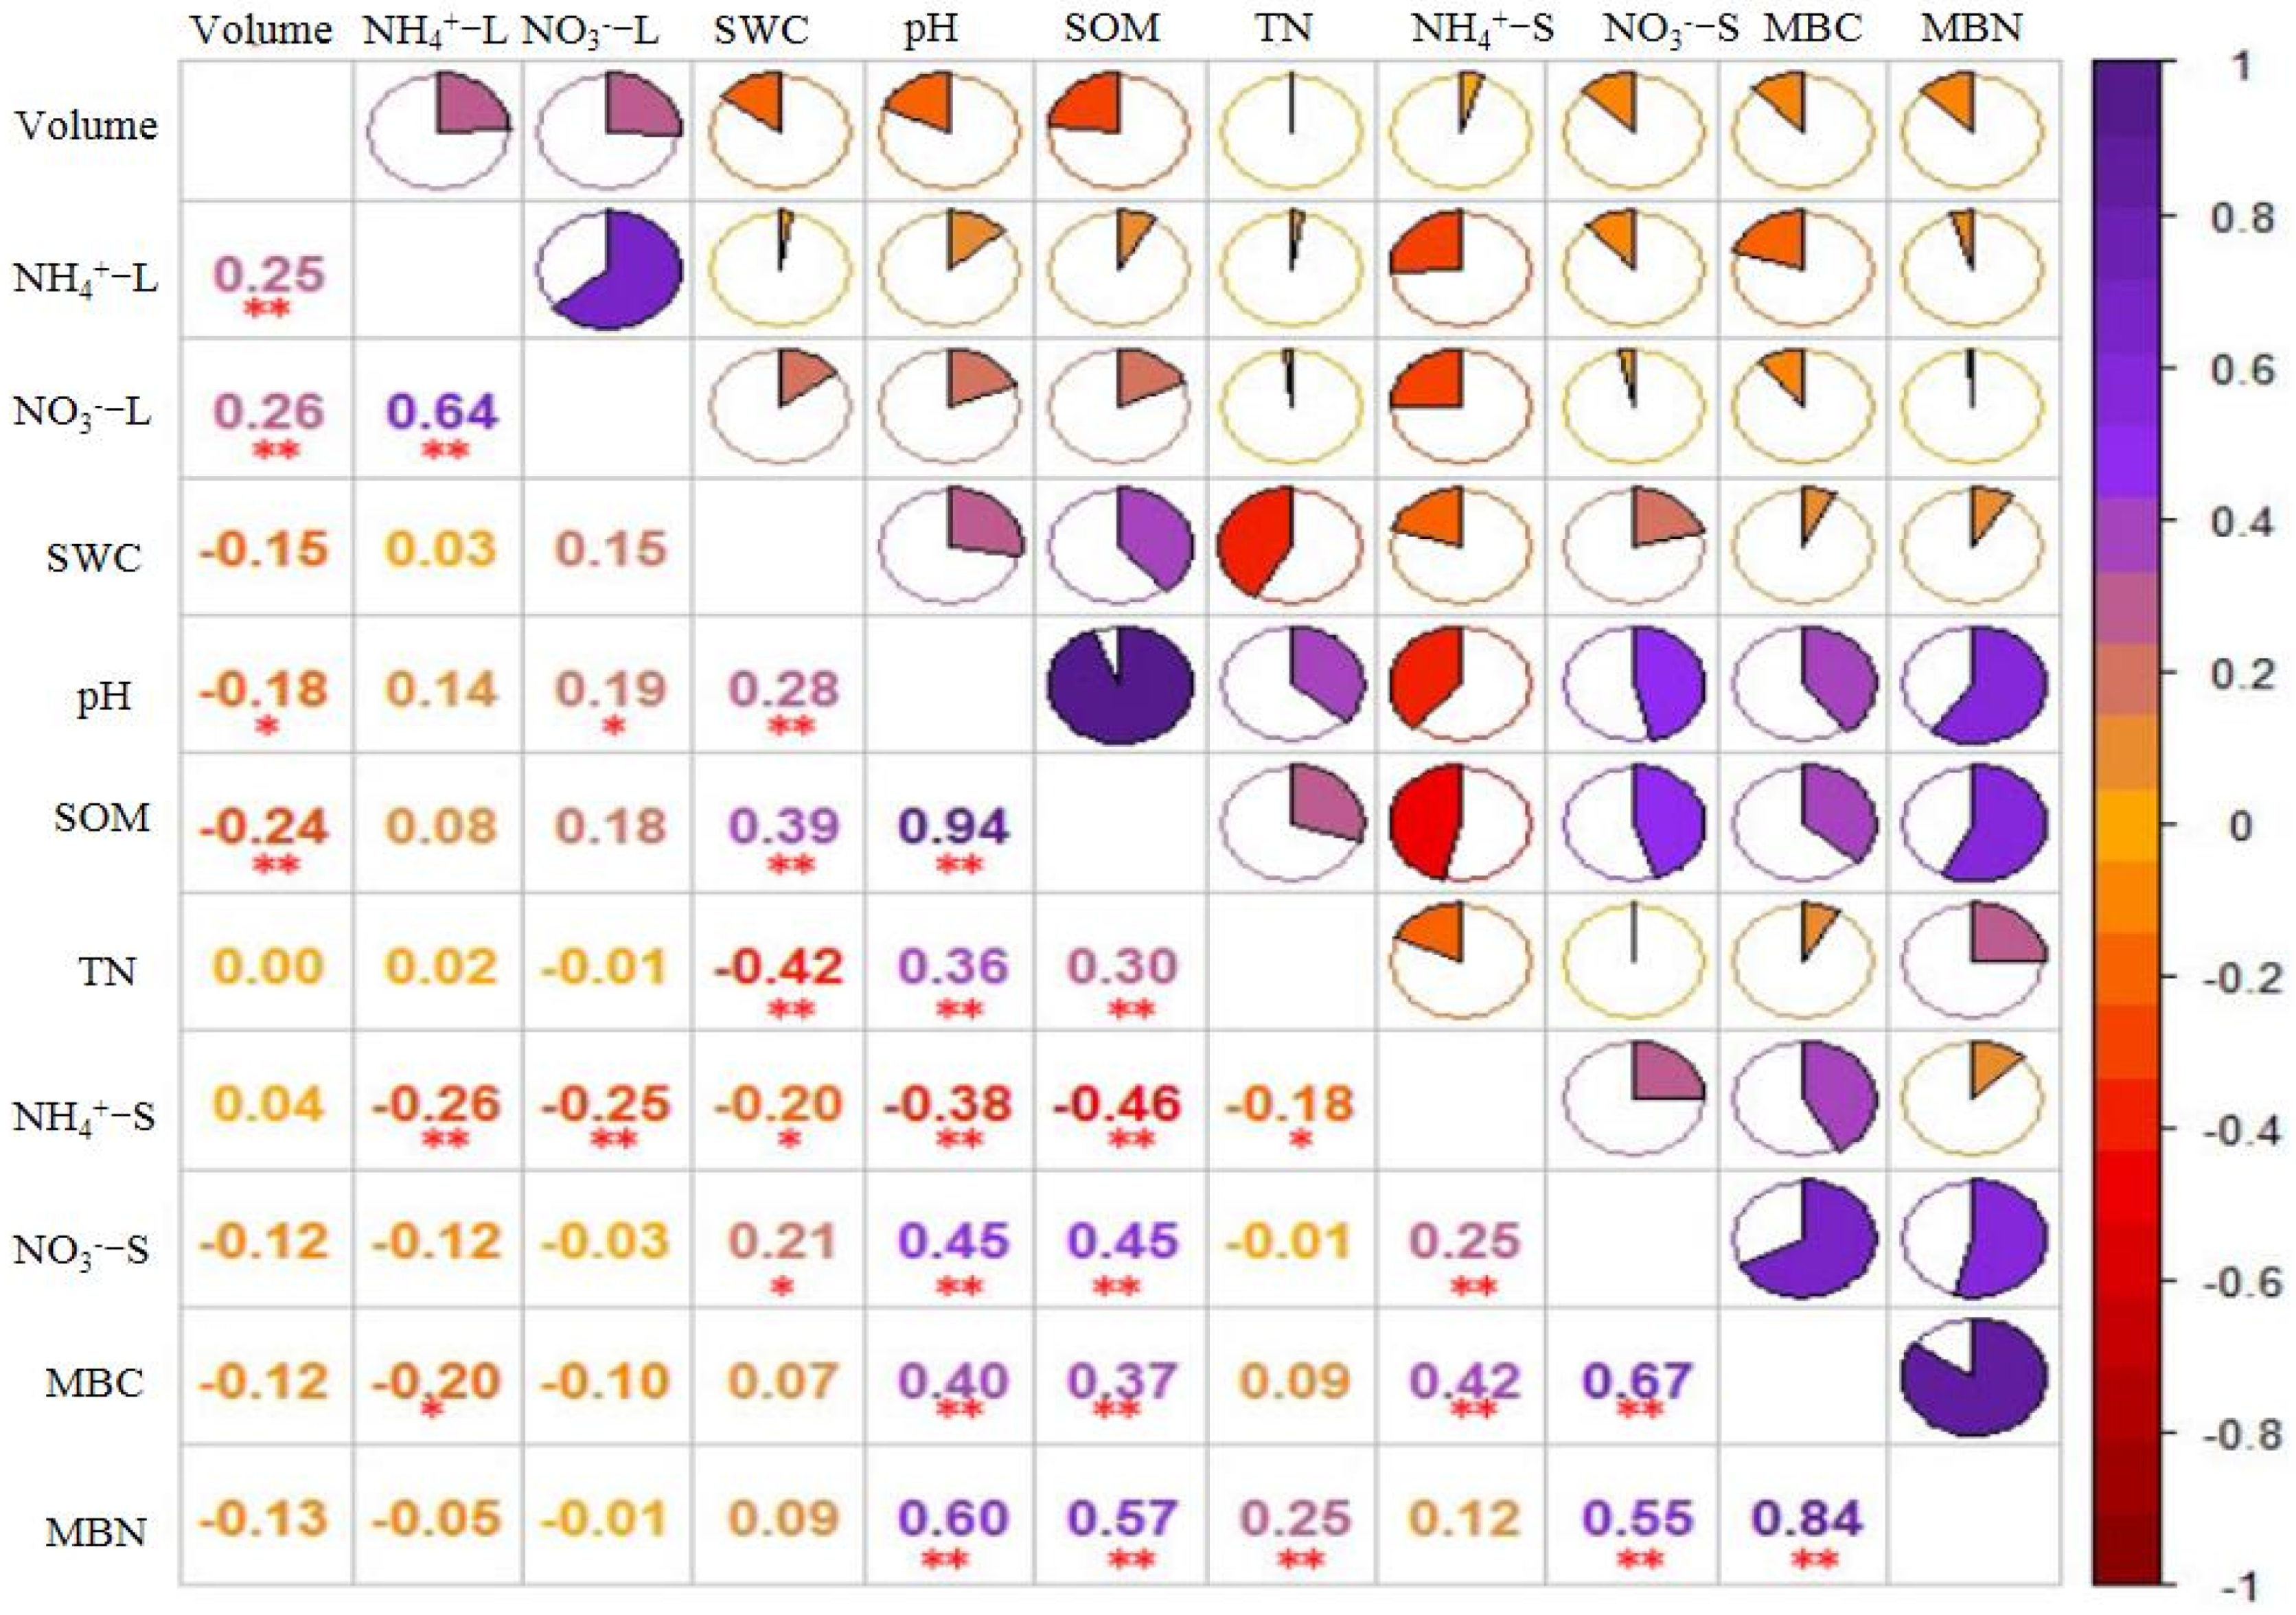
The correlation analysis revealed that there were strong correlations between soil quality indicators and nitrogen leaching characteristics (Figure 4). The leaching volume was significantly and negatively related to pH and SOM (p < 0.01), with correlation coefficients of −0.18 and −0.24. In addition, the cumulative leaching amount of NH4+-N was significantly and negatively related to soil NH4+-N and MBC (p < 0.01), with correlation coefficients of −0.26 and −0.20. The cumulative amount of leached NO3−-N showed a significant and positive correlation with pH (p < 0.01), with a correlation coefficient of 0.19. Moreover, the cumulative amount of NO3−-N was significantly and negatively related to the soil NH4+-N content (p < 0.01), with a correlation coefficient of −0.25.

Figure 4.
Pearson correlations of soil quality indicators and nitrogen leaching characteristics. Purple indicates a positive correlation, and red indicates a negative correlation. Significance levels: * p < 0.05; ** p < 0.01. The shaded area inside each circle represents the magnitude of the correlation coefficient. NH4+-L, ammonium nitrogen in leachate; NO3−-L, nitrate nitrogen in leachate; SMC, soil moisture content; SOM, soil organic matter; TN, total nitrogen. NH4+-S, soil ammonium nitrogen; NO3−-S, soil nitrate nitrogen; MBC, microbial biomass carbon content; MBN, microbial biomass nitrogen content.
3.4. Path Analysis of the Effects of FTCs, Biochar Addition Ratio, and Soil Quality Indicators on Nitrogen Leaching Characteristics
The path model explained 76% of the variance in the nitrogen leaching content, and the goodness-of-fit index of the PLS-PM was 0.62 (Figure 5a). The pH, SOM, soil nitrogen content, and biochar addition ratio significantly and negatively affected the nitrogen leaching characteristics (standardized path coefficients of −0.47, p < 0.05; −0.95, p < 0.01; −0.43, p < 0.05; and −0.78, p < 0.01, respectively). The FTCs significantly and positively affected moisture (SPC = 0.82, p < 0.05) and significantly negatively influenced soil nitrogen content (SPC = −0.49, p < 0.05). The biochar addition ratio significantly and positively influenced pH and SOM (SPC = 0.92 and 0.97, p < 0.01) and significantly negatively influenced microbial biomass (SPC = −0.45, p < 0.05).
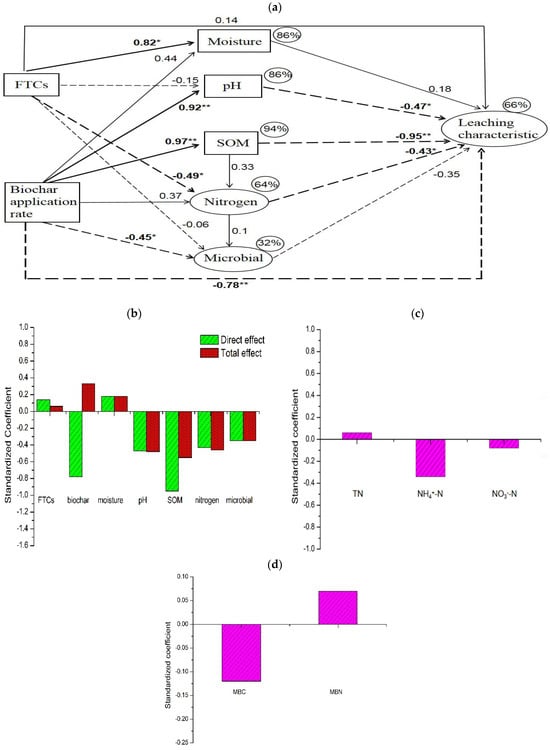
Figure 5.
Effects of freeze–thaw cycles (FTCs), biochar addition ratios, and soil quality indicators on nitrogen leaching characteristics. (a) The outputs of the path models; the solid arrows indicate positive effects, and the dashed arrows indicate negative effects; the numbers on the arrows are standardized path coefficients; the numbers in bold represent significant effects (* p < 0.05, ** p < 0.01); the bold arrows represent significant standardized path coefficients (p < 0.05), and the thin arrows represent nonsignificant path coefficients (p > 0.05); and the percentages next to the boxes represent the variance explained by the model (R2). The goodness-of-fit index was 0.62 for the path model. (b) The standardized path coefficients of the direct and indirect influences of FTCs, biochar addition ratios, soil moisture, pH, soil organic matter (SOM), nitrogen content, and microbial biomass content on nitrogen leaching characteristics. (c) The standardized coefficients of the influence of total nitrogen (TN), ammonia nitrogen (NH4+-N), and nitrate nitrogen (NO3−-N) contents on the nitrogen leaching characteristics. (d) The standardized coefficients of the influence of MBC (microbial biomass carbon content) and MBN (microbial biomass nitrogen content) on nitrogen leaching characteristics.
SOM most strongly affected the nitrogen leaching characteristics, with an SPC of −0.95 (Figure 5b). The effect of NH4+-N on the leaching characteristics was the strongest, with an SPC of −0.34, followed by NO3−-N (SPC = −0.08) and TN (SPC = 0.06) (Figure 5c). The effect of MBC on the nitrogen leaching characteristics was higher than that of MBN (SPC = 0.07).
4. Discussion
4.1. Nitrogen Leaching Characteristics under FTCs
Nitrogen leaching was promoted under FTCs in temperate forests and grassland ecosystems but reduced in tundra ecosystems [9]. In our study, enhanced NH4+-N and NO3−-N leaching under FTCs was observed in seasonally frozen regions (Figure 2). The amount of leached NH4+-N was lower than that of NO3−-N under the FTCs (Figure 2), consistent with the findings of Karhu et al. [7]; this is because NH4+-N is difficult to move due to its adsorption by the soil surface through the soil cation-exchange capacity [25]. Conversely, NO3−-N is easily leached because it is not easily absorbed by the soil surface [26].
The NH4+-N and NO3−-N leaching first increased, reached the highest values after the 6th FTC, and then tended to stabilize (Figure 2), consistent with the regulation of soil NH4+-N and NO3−-N content under FTCs (Figure 3). FTCs cause the rupturing of soil microbial cells, release organic and inorganic N into the soil, and increase soil organic and inorganic nitrogen [27]. Thus, NH4+-N and NO3−-N leaching increased after 3 and 6 FTCs. Soil microorganisms might be adapted to this environmental change [28]. The soil nitrification rate may also be reduced under FTCs [29]. Thus, NH4+-N and NO3−-N leaching tended to be stable after the 9th and 12th FTCs. Joseph et al. [30] reported that after the second and third FTCs, the nitrogen leaching loss temporarily decreased, and after the 11th FTC, the nitrogen leaching loss remained high, which contradicts our results owing to the different types of biochar and different freeze–thaw temperatures. Compared with that in unfrozen soil, the rate of increase in the NH4+-N leaching content was greater than that for NO3−-N after 12 FTCs (Figure 2), probably because the soil nitrification rate decreased with the increase in FTCs [29].
4.2. Nitrogen Leaching Characteristics for Different Biochar Addition Ratios
With the increase in the biochar addition ratio, the soil NO3−-N content increased, while the NH4+-N content decreased (Figure 3), consistent with the findings of Chen [3], who showed that NH4+-N was converted into NO3−-N via nitrification and net nitrification was promoted, leading to an increase in the soil NO3−-N content [3]. We considered whether the addition of biochar under the FTCs helped to promote soil nitrogen mineralization. (1) Biochar can absorb phenolic compounds that slow the nitrification process, thus indirectly accelerating nitrification [31]. (2) Biochar can accelerate nitrifying bacterial activity and promote the nitrification process [32].
Although biochar can enhance the soil nitrification process and change ammonia nitrogen into nitrate nitrogen (Figure 3), NO3−-N is more easily leached. With the increase in the biochar addition ratio, the NH4+-N and NO3−-N leaching loss decreased gradually in our study, and the rate of decrease in NH4+-N leaching content was higher than that of NO3−-N (Figure 2), illustrating that the inhibition effect of biochar on NH4+-N leaching content in soil column is greater than that of NO3−-N. Previous studies have reported that the addition of biochar helps to reduce soil nitrogen leaching in subtropical cropland soil [33], ferralsol soil of moso bamboo plantations [34], karst yellow soil [35], and clay soil [7]. Increases in soil water retention and the effects of soil microbes related to nitrogen cycling are generally considered the main reasons for the reduction in soil nitrogen leaching. In our study, the cumulative volume of the leaching solution decreased as the biochar addition ratio increased (Figure 1), illustrating that biochar application affected nitrogen leaching by changing the soil water storage capacity [36]. The microbial biomass content increased as the biochar addition ratio increased (Figure 3), which could explain the mechanism through which microorganisms moderated the effects of biochar on the nitrogen leaching content [32].
4.3. Effects of the Biochar Addition Ratios on Nitrogen Leaching under FTCs
Some studies have pointed out that nitrogen leaching under FTCs is influenced by soil properties, including soil moisture [9], soil structure [30], and soil microorganisms [37]. In our research, the cumulative leaching amount of NO3−-N was significantly and positively correlated with pH and soil NH4+-N. The cumulative leaching amount of NH4+-N was significantly and negatively correlated with soil NH4+-N and MBC. In addition, we used PLS-PM to investigate the influence of FTCs, biochar addition, and soil variables on nitrogen leaching characteristics. The number of FTCs indirectly increased nitrogen leaching by affecting the soil nitrogen content (Figure 5a). Gao et al. [9] noted that FTCs significantly increased soil NH4+-N and NO3−-N contents and then increased the amount of leached NO3−-N. Soil aggregates were destroyed and released nitrogen under FTCs; then, soil total nitrogen and microbial biomass nitrogen content decreased, and finally, nitrogen leaching content increased [7].
Biochar directly decreased the nitrogen leaching content (Figure 5a), consistent with the results of previous studies [32,38]. Biochar directly decreases nitrogen leaching due to the physical retention of dissolved nitrogen. The mechanisms driving this phenomenon are as follows: (1) a large amount of solution flows into the pores of biochar particles, and the hydrated asymmetric nitrate ions are trapped in the pores of biochar particles [32], and then (2) negatively charged nitrate ions are bound to functional groups and cations adsorbed on the biochar surface [39]. (3) The biochar directly adsorbs ammonia nitrogen through cation exchange owing to its high adsorption capacity [40]. Biochar indirectly affected nitrogen leaching through SOM and pH (Figure 5a). Biochar is a carbon-rich material and has a high initial (alkaline) pH, which helps to increase soil SOM and pH (Figure 3). Holub et al. [41] found that organic carbon amendments had a positive effect on nitrogen uptake and reduced nitrogen leaching. Chen et al. [3] found that biochar application reduced the nitrogen leaching content and increased the retention of nitrogen in tea soils by increasing the soil pH. The increase in SOM and pH helped to increase the microbial biomass content and enzyme activities, changed the bacterial community structure, and finally reduced the nitrogen leaching content.
Some studies have examined the interactive effects of FTCs and biochar addition on soil nitrogen retention and found that biochar application mitigated the enhancement of soil nitrogen leaching losses under FTCs [4,7]. In our study, the combined effect of FTCs and biochar addition at varying ratios significantly affected the leaching volume and NH4+-N and NO3−-N leaching content (Table 1). The total effect of the biochar addition ratio on nitrogen leaching was higher than that of FTCs (Figure 5b).
Although there are several limitations in our study (short monitoring time, one type of soil and biochar, the use of a laboratory simulation experiment), the results still reveal that biochar application decreases nitrogen leaching under FTCs compared with that in unfrozen soil. Thus, biochar application should be considered for decreasing nitrogen leaching in farmland soil in seasonally frozen areas.
5. Conclusions
The characteristics of soil nitrogen leaching under FTCs and with different biochar addition ratios were detected. The results showed that the amounts of NH4+-N and NO3−-N leaching content first increased, peaked after the 6th FTC, and then decreased under subsequent FTCs, and the amount of leached NH4+-N was lower than that of NO3−-N during FTCs. As the biochar addition ratio increased, the NH4+-N and NO3−-N leaching content decreased. The FTCs indirectly increased nitrogen leaching through the soil nitrogen content. Biochar not only directly decreased the amount of nitrogen leaching but also indirectly controlled nitrogen leaching through SOM and pH. In the black soil area with seasonal freeze–thaw cycles, biochar had a greater effect than FTCs on the amount of nitrogen leaching. This study can provide guidance for controlling nitrogen leaching under FTCs in farmland soils. Future studies should explore the effects of various biochar types with nitrogen leaching characteristics under FTCs among different soil types from the perspective of microbial mechanisms. Biochar application (2%, 4%, and 6% (w/w)) could help to decrease nitrogen leaching in seasonally frozen areas.
Author Contributions
Conceptualization, L.W. and H.L. (Hui Liu); data curation, L.W.; funding acquisition, T.L. and A.Y.; investigation, H.L. (Hongyu Li), A.Y. and Z.Z.; methodology, L.W. and H.L. (Hongyu Li); resources, L.W. and T.L.; software, Z.Z.; writing—original draft preparation, L.W.; writing—review and editing, L.W. and H.L. (Hui Liu). All authors have read and agreed to the published version of the manuscript.
Funding
We acknowledge that this study was supported by the Project Fund of the Key Laboratory of Efficient Use of Agricultural Water Resources, Ministry of Agriculture and Rural Affairs of China (AWR2021004), the Natural Science Foundation of Heilongjiang Province (LH2021E010), and the Northeast Agricultural University “Youth Talent” Fund (20QC14).
Data Availability Statement
Data supporting the findings of this study are available on request from the corresponding author.
Conflicts of Interest
The authors declare no conflicts of interest. The funders had no role in the design of this study; the collection, analyses, or interpretation of data; the writing of the manuscript, or the decision to publish the results.
References
- Wu, M.S.; Zhao, Q.; Jansson, P.E.; Wu, J.W.; Tan, X.; Duan, Z.; Wang, K.; Chen, P.; Zheng, M.J.; Huang, J.S.; et al. Improved soil hydrological modeling with the implementation of salt-induced freezing point depression in CoupModel: Model calibration and validation. J. Hydrol. 2021, 596, 125693. [Google Scholar] [CrossRef]
- Bao, T.; Xu, X.; Jia, G.; Billesbach, D.P.; Sullivan, R.C. Much stronger tundra methane emissions during autumn freeze than spring thaw. Glob. Chang. Biol. 2021, 27, 376–387. [Google Scholar] [CrossRef]
- Chen, P.; Liu, Y.; Mo, C.; Jiang, Z.; Yang, J.; Lin, J. Microbial mechanism of biochar addition on nitrogen leaching and retention in tea soils from different plantation ages. Sci. Total Environ. 2021, 757, 143817. [Google Scholar] [CrossRef] [PubMed]
- Zhou, Y.; Berruti, F.; Greenhalf, C.; Tian, X.; Henry, H.A. Increased retention of soil nitrogen over winter by biochar application: Implications of biochar pyrolysis temperature for plant nitrogen availability. Agr. Ecosyst. Environ. 2017, 236, 61–68. [Google Scholar] [CrossRef]
- Ding, S.; Zou, Y.; Yu, X. Freeze-thaw cycles alter the growth sprouting strategy of wetland plants by promoting denitrification. Commun. Earth Environ. 2023, 4, 57. [Google Scholar] [CrossRef]
- Liu, H.Y.; Li, H.B.; Zhang, A.P.; Rahaman, M.A.; Yang, Z.L. Inhibited effect of biochar application on N2O emissions is amount and time-dependent by regulating denitrification in a wheat-maize rotation system in North China. Sci. Total Environ. 2020, 721, 137636. [Google Scholar] [CrossRef]
- Karhu, K.; Kalu, S.; Seppänen, A.; Kitzler, B.; Virtanen, E. Potential of biochar soil amendments to reduce N leaching in boreal field conditions estimated using the resin bag method. Agr. Ecosyst. Environ. 2021, 316, 107452. [Google Scholar] [CrossRef]
- Song, Y.; Zou, Y.C.; Wang, G.P.; Yu, X.F. Stimulation of nitrogen turnover due to nutrients release from aggregates affected by freeze-thaw in wetland soils. Phys. Chem. Earth. 2017, 97, 3–11. [Google Scholar] [CrossRef]
- Gao, D.; Zhang, L.; Liu, J.; Peng, B.; Fan, Z.; Dai, W.; Bai, E. Responses of terrestrial nitrogen pools and dynamics to different patterns of freeze-thaw cycle: A meta-analysis. Glob. Change Biol. 2017, 24, 2377–2389. [Google Scholar] [CrossRef]
- Hu, R.; Wang, X.P.; Xu, J.S.; Zhang, Y.F.; Pan, Y.X.; Su, X. The mechanism of soil nitrogen transformation under different biocrusts to warming and reduced precipitation: From microbial functional genes to enzyme activity. Sci. Total Environ. 2020, 722, 137849. [Google Scholar] [CrossRef]
- Zhang, Y.F.; Wang, J.M.; Feng, Y. The effects of biochar addition on soil physicochemical properties: A review. Catena 2021, 202, 105284. [Google Scholar] [CrossRef]
- Chen, Z.; Yang, S.Q.; Zhang, A.P.; Jing, X.; Song, W.M.; Mi, Z.R.; Zhang, Q.W.; Wang, W.Y.; Yang, Z.L. Nitrous oxide emissions following seasonal freeze-thaw events from arable soils in Northeast China. J. Integr. Agr. 2018, 17, 231–246. [Google Scholar] [CrossRef]
- Campbell, J.L.; Socci, A.M.; Templer, P.H. Increased nitrogen leaching following soil freezing is due to decreased root uptake in a northern hardwood forest. Glob. Change Biol. 2014, 20, 2663–2673. [Google Scholar] [CrossRef] [PubMed]
- Wang, S.; Wang, D.; Liu, T.; Liu, Y.; Luo, M.; Li, Y.; Zhou, W.; Yang, M.; Liang, S.; Li, K. Simulation of winter wheat growth dynamics and optimization of water and nitrogen application systems based on the aquacrop model. Agronomy 2024, 14, 110. [Google Scholar] [CrossRef]
- Han, L.F.; Sun, K.; Yang, Y.; Xia, X.H.; Li, F.B.; Yang, Z.F.; Xing, B.S. Biochar’s stability and effect on the content, composition and turnover of soil organic carbon. Geoderma 2020, 364, 114184. [Google Scholar] [CrossRef]
- Yang, W.; Wang, Z.; Guo, S.; Yang, M.; Zhao, L.; Zhao, H.; Jia, H.; Xu, W. Evaluation of soil fertility quality under biochar combined with nitrogen in an irrigated wheat field in Northern Xinjiang, China. Agronomy 2023, 13, 2518. [Google Scholar] [CrossRef]
- Yang, Y.Q.; Cui, M.H.; Ren, Y.G.; Guo, J.C.; Liu, H. Correlations between the physicochemical characteristics and adsorption capacity of sludge-based biochar induced at pyrolysis temperature. J. Shenzhen Univ. Sci. Eng. 2020, 37, 194–201. [Google Scholar] [CrossRef]
- Romero, C.M.; Hao, X.Y.; Li, C.L.; Owens, J.; Schwinghamer, T.; McAllister, T.A.; Okine, E. Nutrient retention, availability and greenhouse gas emissions from biochar fertilized Chernozems. Catena 2021, 198, 105046. [Google Scholar] [CrossRef]
- El-Naggar, A.; Lee, S.S.; Rinklebe, J.; Farooq, M.; Song, H.; Sarmah, A.K.; Zimmerman, A.R.; Ahmad, M.; Shaheen, S.M.; Ok, Y.S. Biochar application to low fertility soils: A review of current status, and future prospects. Geoderma 2019, 337, 536–554. [Google Scholar] [CrossRef]
- Kettunen, R.; Saarnio, S. Biochar can restrict N2O emissions and the risk of nitrogen leaching from an agricultural soil during the freeze-thaw period. Agr. Food Sci. 2013, 22, 373–379. [Google Scholar] [CrossRef]
- FAO. Soils Map of the World: Revised Legend; Food and Agriculture Organization of the United Nations: Rome, Italy, 1988. [Google Scholar]
- Liao, J.Y.; Hu, A.; Zhao, Z.W.; Liu, X.R.; Jiang, C.; Zhang, Z.H. Biochar with large specific surface area recruits N2O-reducing microbes and mitigate N2O emission. Soil. Biol. Biochem. 2021, 156, 108212. [Google Scholar] [CrossRef]
- Yang, X.Y.; Chen, X.W.; Yang, X.T. Phosphorus release kinetics and solubility capacity of phosphorus fractionation induced by organic acids from a black soil in northeast China. Can. J. Soil. Sci. 2019, 99, 92–99. [Google Scholar] [CrossRef]
- Wei, T.; Simko, V.; Levy, M.; Xie, Y.; Jin, Y.; Zemla, J. Package ‘corrplot’. Statistician 2017, 56, 316–324. [Google Scholar]
- Macdonald, J.A.; Dise, N.B.; Matzner, E.; Armbruster, M.; Gundersen, P.; Forsius, M. Nitrogen input together with ecosystem nitrogen enrichment predict nitrate leaching from European forests. Glob. Change Biol. 2002, 8, 1028–1033. [Google Scholar] [CrossRef]
- Jaakkola, A. Leaching losses of nitrogen from a clay soil under grass and cereal crops in Finland. Plant Soil. 1984, 76, 59–66. [Google Scholar] [CrossRef]
- Zong, R.; Wang, Z.H.; Li, W.H.; Ayantobo, O.O.; Li, H.Q.; Song, L.B. Assessing the impact of seasonal freezing and thawing on the soil microbial quality in arid northwest China. Sci. Total Environ. 2023, 863, 161029. [Google Scholar] [CrossRef] [PubMed]
- Wu, X.; Wang, F.F.; Li, T.; Fu, B.J.; Lv, Y.H.; Liu, G.H. Nitrogen additions increase N2O emissions but reduce soil respiration and CH4 uptake during freeze-thaw cycles in an alpine meadow. Geoderma 2020, 363, 114157. [Google Scholar] [CrossRef]
- Christopher, S.F.; Shibata, H.; Ozawa, M.; Nakagawa, Y.; Mitchell, M.J. The effect of soil freezing on N cycling: Comparison of two headwater subcatchments with different vegetation and snowpack conditions in the northern Hokkaido Island of Japan. Biogeochemistry 2008, 88, 15–30. [Google Scholar] [CrossRef]
- Joseph, G.; Henry, H.A.L. Soil nitrogen leaching losses in response to freeze-thaw cycles and pulsed warming in a temperate old field. Soil Biol. Biochem. 2008, 40, 1947e1953. [Google Scholar] [CrossRef]
- Schmidt, H.P.; Kammann, C.; Hagemann, N.; Leifeld, J.; Bucheli, T.D.; Sánchez Monedero, M.A.; Cayuela, M.L. Biochar in agriculture-A systematic review of 26 global meta-analyses. GCB Bioenergy 2021, 13, 1708–1730. [Google Scholar] [CrossRef]
- Xu, N.; Tan, G.C.; Wang, H.Y.; Gai, X.P. Effect of biochar additions to soil on nitrogen leaching, microbial biomass and bacterial community structure. Eur. J. Soil. Biol. 2016, 74, 1–8. [Google Scholar] [CrossRef]
- Zhao, X.; Wang, S.Q.; Xing, G.X. Nitrification, acidification, and nitrogen leaching from subtropical cropland soils as affected by rice straw-based biochar: Laboratory incubation and column leaching studies. J. Soils Sediments 2014, 14, 471–482. [Google Scholar] [CrossRef]
- Lei, Z.F.; Li, Q.; Song, X.Z.; Wang, W.F.; Zhang, Z.T.; Peng, C.H.; Tian, L.L. Biochar mitigates dissolved organic carbon loss but does not affect dissolved organic nitrogen leaching loss caused by nitrogen deposition in Moso bamboo plantations. Glob. Ecol. Conserv. 2018, 16, e00494. [Google Scholar] [CrossRef]
- Zhang, C.; Huang, X.; Zhang, X.; Wan, L.; Wang, Z. Effects of biochar application on soil nitrogen and phosphorous leaching loss and oil peony growth. Agr. Water Manag. 2021, 255, 107022. [Google Scholar] [CrossRef]
- Novak, J.M.; Busscher, W.J.; Watts, D.W.; Amonette, J.E.; Ippolito, J.A.; Lima, I.M.; Gaskin, J.; Das, K.C.; Steiner, C.; Ahmedna, M.; et al. Biochars impact on soil-moisture storage in an ultisol and two aridisols. Soil. Sci. 2012, 177, 310–320. [Google Scholar] [CrossRef]
- Campbell, J.L.; Reinmann, A.B.; Templer, P.H. Soil freezing effects on sources of nitrogen and carbon leached during snowmelt. Soil. Sci. Soc. Am. J. 2013, 78, 297–308. [Google Scholar] [CrossRef]
- Li, S.; Zhang, Y.; Yan, W.; Shangguan, Z. Effect of biochar application method on nitrogen leaching and hydraulic conductivity in a silty clay soil. Soil. Till Res. 2018, 183, 100–108. [Google Scholar] [CrossRef]
- Mukherjee, A.; Zimmerman, A.R.; Harris, W. Surface chemistry variations among a series of laboratory-produced biochars. Geoderma 2011, 163, 247–255. [Google Scholar] [CrossRef]
- Sun, H.J.; Lu, H.Y.; Chu, L.; Shao, H.B.; Shi, W.M. Biochar applied with appropriate rates can reduce N leaching, keep N retention and not increase NH3 volatilization in a coastal saline soil. Sci. Total Environ. 2017, 575, 820–825. [Google Scholar] [CrossRef]
- Holub, P.; Klem, K.; Tůma, I.; Vavříková, J.; Surá, K.; Veselá, B.; Záhora, J. Application of organic carbon affects mineral nitrogen uptake by winter wheat and leaching in subsoil: Proximal sensing as a tool for agronomic practice. Sci. Total Environ. 2020, 717, 137058. [Google Scholar] [CrossRef]

Disclaimer/Publisher’s Note: The statements, opinions and data contained in all publications are solely those of the individual author(s) and contributor(s) and not of MDPI and/or the editor(s). MDPI and/or the editor(s) disclaim responsibility for any injury to people or property resulting from any ideas, methods, instructions or products referred to in the content. |
© 2024 by the authors. Licensee MDPI, Basel, Switzerland. This article is an open access article distributed under the terms and conditions of the Creative Commons Attribution (CC BY) license (https://creativecommons.org/licenses/by/4.0/).