Article

Enhancing Soil Aggregation and Organic Carbon Retention in Greenhouse Vegetable Production through Reductive Soil Disinfestation with Straw and Fertiliser: A Comprehensive Study

1
College of Natural Resources and Environment, Northwest Agriculture and Forestry University, Yangling, Xianyang 712100, China
2
College of Agricultural, Tarim University, Alar 843300, China
3
Key Laboratory of Low-Carbon Green Agriculture in Northwestern China, Ministry of Agriculture and Rural Affairs, Yangling, Xianyang 712100, China
*
Author to whom correspondence should be addressed.
Agronomy 2024, 14(1), 179; https://doi.org/10.3390/agronomy14010179
Submission received: 19 December 2023 / Revised: 9 January 2024 / Accepted: 12 January 2024 / Published: 14 January 2024
(This article belongs to the Section Soil and Plant Nutrition)

Abstract

:
In greenhouse vegetable production, reductive soil disinfestation (RSD) effectively mitigates soil-borne diseases, yet its impact on the dynamics of soil organic carbon (SOC) has not been adequately examined. This study investigated the distribution of soil aggregates and the organic carbon retention mechanism following intensive RSD treatment. Greenhouse experiments, including control (CK), wheat straw (RSD), and wheat straw with chemical fertilizer (RSD + NP) treatments, indicated augmentation in the formation of macro-aggregates (>2 mm and 0.25–2 mm) under RSD, particularly in the RSD + NP treatment. Silty clay particles transform into macro- and micro-aggregates. Fourier infrared spectroscopy highlighted the augmentation of carbon-containing functional groups in SOC, with aliphatic carbon accumulating in macro-aggregates and aromatic carbon in silt clay. Laboratory culture experiments employing different C/N ratios (RSD1 with wheat straw, RSD2 with kiwifruit branches) underscored the beneficial impact of low C/N ratio organic matter on coarse and fine macro-aggregate content, mean weight diameter, geometric mean diameter, and reduced silt clay. Low C/N ratios enhance SOC retention in large aggregates, while high ratios stabilise micro-aggregate carbon. This research underscores the severe degradation in continuous greenhouse cropping systems and emphasises RSD’s dual benefits—disease prevention and improved SOC retention. Implementing RSD requires careful consideration of organic material choices, specifically their C/N ratios, as a pivotal factor influencing SOC dynamics.

1. Introduction

Originating in 2000 in the Netherlands and Japan, reductive soil disinfestation (RSD), also known as soil anaerobic sterilisation, is a sustainable method for preventing and controlling soil-borne diseases. It involves adding a carbon source (e.g., fresh organic materials such as straw, green manure, or soybean residue) to the soil, saturating the soil with irrigation water, and covering it with plastic film to promote strong soil reduction conditions. This temporarily changes the soil environment from an aerobic to an anaerobic state, fostering the proliferation of facultative and obligate anaerobic microorganisms, including those in the Clostridium and Bacillus families [1,2]. This method is based on the consensus that the soil micro-environment, including the composition of organic matter and the structure of the microbial community, can be altered to guard against pathogens [2,3,4]. This method is typically applied every 3 or 4 years and has demonstrated efficacy in reducing soil-borne diseases, thereby improving soil quality [5]. According to previous studies, the application of RSD in vegetable cropping systems in solar greenhouses mainly aims to control soil-borne diseases and the degree of soil restoration in degraded greenhouses [5,6]. Furthermore, the anaerobic environment in RSD causes transient changes to the soil redox potential, pH, and microbial population while selectively protecting the decomposition of some organic compounds. Consequently, the anaerobic micro-domain is a critical regulator of soil carbon storage [7].
Aggregates are the basic units of soil; grain size and composition ratio affect the stability of soil structure. The level of aggregate quantity also reflects the strength of soil water retention, permeability, nutrient retention, and other capabilities [8]. The addition of foreign organic matter to increase the content of soil organic carbon (SOC) and further improve the stability of soil aggregates is considered to be an effective means of improving soil structure [9]. Aggregates store approximately 90% of the carbon in the surface soil, and their stability directly affects the sequestration of organic carbon [10]. Multiple studies have demonstrated that straw can improve the soil structure and effectively increase the stability of soil aggregates [11,12,13]. Straw C/N is considered to be an important index of residue quality, and its change affects the stability characteristics of soil aggregates [14]. It was found that the straw residues with low C/N were decomposed faster and had a stronger effect on soil agglomeration, which was conducive to improving the stability of soil structure [15,16]. There are also conceptual models suggesting that difficult-to-decompose residues often lead to slow and persistent improvements in soil aggregates [17]. The carbon protection mechanisms of aggregates with different stabilities vary, as do the active organic carbon components in aggregates with different particle sizes [11]. Accordingly, the chemical structure of internal organic carbon also likely differs. When straw carbon is added to the soil, exogenous carbon preferentially accumulates in the components of macro-aggregates [18]. In macro-aggregates, simple and easily decomposable carbon is the main component, whereas in micro-aggregates, aromatic carbon with strong stability is the main component [19]. Aliphatic functional groups have been associated with the activity of organic carbon. This has a significant impact on the stability of aggregates [20,21]; thus, the carbon turnover rate is the fastest [22]. Straw is further degraded by microorganisms to produce fine particulate organic carbon and mineral-bound organic carbon [13,23], which accumulate in silt, clay, and micro-aggregate components [24,25].
However, the effect of exogenous carbon on the stability and carbon sequestration of soil aggregates in high-temperature and high-humidity anaerobic conditions remains unknown. Therefore, we aimed to assess the retention of organic carbon and its chemical functional groups in soil aggregates following intensive RSD treatment. In this study, the chemical functional group structure of organic carbon in aggregates with varying stability was analysed and determined through Fourier infrared spectroscopy, and the infrared spectral structure characteristics and carbon sequestration mechanisms of organic carbon in aggregates were explored. Our results can support the enhancement of carbon sequestration potential in SOC and the sustainability of soil management in greenhouses.
In this study, two types of local plant waste with different carbon and nitrogen ratios, namely wheat straw and kiwi branches, were used as carbon sources for RSD. We explored: (1) the effects of nutrient regulation on the distribution and chemical structure of organic carbon in soil aggregates; and (2) the effects of different C/N ratios on the distribution and chemical structure of organic carbon in soil aggregates. This study provides a theoretical basis for the formulation of soil quality evaluation criteria under RSD treatment.

2. Materials and Methods

2.1. Overview of the Experimental Area

The experimental area is located in Zhangbu Village Facility Cultivation Base (108°3′41″, 34°15′51″), Yangling Agricultural high-tech Industry Demonstration Zone in the central part of Guanzhong Plain, Shaanxi Province. It is a warm, temperate, semi-humid monsoon zone with a continental climate. The altitude is approximately 520 m, the average annual temperature is 13 °C, and the average annual precipitation is 620 mm. The average annual evaporation is approximately 1400 mm. The soil is classified as a calcareous clay loam, a Eum-Orthic Anthrosol (Udic Haplustalf in the USDA system) and Anthrosol (FAO system).
The solar greenhouse was built in 2010 and covers an area of 666.4 m2. The planting system includes one crop per year: tomatoes. The physical and chemical properties of the soils are listed in Table 1. The greenhouses have been growing tomatoes for over ten years, and serious soil-borne diseases have caused significant damage, as demonstrated in Figure S1. The trial was conducted in July 2021.

2.2. Test Materials

The organic materials used were wheat straw (Fufeng County Feed Factory, Baoji, China) and kiwifruit branches. The wheat was dried and cut into 3–5 cm pieces after harvest. The amount of straw added was 15,000 kg/ha. The kiwifruit branches for the test were selected from the summer-pruned branches of the Xuxiang Kiwifruit orchard in the Yangling Agricultural Demonstration Park. The branches were dried at 65 °C, crushed with a powder machine, and screened (2 mm) for reserve use. The physical and chemical properties of the tested organic materials are listed in Table 1.
In this study, according to Kirkby [26], the ratio of the amount of straw added to the amount of fertilizer was C:N:P = 400:5:2. The carbon content of straw was estimated at 40%. Accordingly, the calculated addition of pure carbon was 15,000 kg/hm2 × 40% = 6000 kg/hm2. Subsequently, the required amounts of nitrogen and phosphorus were 75 kg/hm2 and 30 kg/hm2 (approximately equivalent to P2O5 68.7 kg/hm2), respectively. Therefore, the recommended application included urea for nitrogen, providing 163 kg/hm2, and superphosphate for phosphorus, delivering P2O5 at 429 kg/hm2. A polyethylene film (0.06 mm) with specifications of 8 m × 6 m was used for the test.

2.3. Experimental Design

During the summer fallow period on 24 June 2021, soil samples from the topsoil layer (0–20 cm) were collected and air-dried naturally to remove impurities such as visible roots and stones; some samples were reserved for testing the basic physical and chemical properties of the soil, while other soil samples were ground and sifted (2 mm) for laboratory culture tests. The experiment adopted an indoor constant temperature culture experiment and was set as a single factor scheme, with a total of three treatments: (1) only flooded soil (CK), (2) flooded soil + wheat straw (RSD1); and (3) flooded soil + kiwi branches (RSD2). The amount of foreign organic materials added was 2% of the weight of the soil, and each treatment was repeated three times.
Before culturing, we weighed the soil after passing it through a 2 mm sieve into the culture bottle. Pre-cultivation was conducted at 25 °C in the dark for 3 days under humid conditions (70% water capacity) to restore the soil microbial ecological environment. Following the pre-culture, we added 2% organic materials to the soil and thoroughly mixed it according to the aforementioned treatment. Subsequently, deionized water was added, creating a 3-cm flooded layer (Figure S2). The system was then sealed, filled with nitrogen, and cultured in a 45 °C incubator under dark conditions for 30 days. After the 30-day anaerobic culture, we poured away the upper layer of solution. After 7 days of natural drying, we removed the soil from the culture bottle without damaging the soil structure, and it was then mmobili for the determination and analysis of aggregates.
Subsequently, a random-block greenhouse design with three treatments was adopted: (1) control with only flooded soil (CK), (2) flooded soil + wheat straw (RSD), and (3) flooded soil + wheat straw + N/P mmobilize (RSD + NP). Each treatment was repeated three times. We spread mmobilize stalks (3–5 cm layers) on the soil surface. We utilized a rotary tiller to incorporate the stalks into the soil at a depth of 15 cm, followed by irrigation to achieve a flooded layer depth of 4 cm. We covered the area with plastic film for a duration of 30 days, ensuring the film remained intact to maintain an adequate anaerobic environment. We embedded a thermometer in each section to monitor soil temperature. Upon the conclusion of the 30-day period, we removed the plastic film, opened the greenhouse, and implemented ventilation procedures. We allowed the soil to naturally ventilate and dry for approximately 7 days to eliminate any toxic or harmful gases and by-products produced during the reaction (Figure 1). Following this aeration phase, we proceeded with planting.
The size of the greenhouse used in this test is 100 m × 7 m, 10 m for each blocks, and 50 cm isolation zone between the blocks. When the mechanical tiller reaches the edge of the plot, the rotary tiller automatically lifts.
Sample collection, After 30 days of cultivation and then air drying under natural conditions for about a week, soil aggregate samples were taken from field or indoor culture bottles.
In these experiments, the water-stable soil aggregates were divided into four grades using the wet sieve method [27]: >2 mm, 0.25–2 mm, 0.053–0.25 mm, and <0.053 mm. Specifically, the soil aggregate samples were broken into small pieces less than 8 mm along the natural texture, Weigh 30 g sample and put it on 2 mm, 0.25 mm, 0.053 mm sleeve sieve, and put it in wet sieve, then add deionized water, soak for 5 min, set the MIN-1 running speed for 30 times, and vibrate it up and down for about 10 min, remove the sleeve sieve, rinse the particles of different particle sizes remaining on the sieve into the petri dish. All levels of agglomerates can be obtained by drying at 40 °C to constant weight.
The carbon content of the aggregates was determined using a K2Cr2O7-H2SO4 heating method.

2.4. Collection and Measurement of Infrared Spectrum

Infrared spectroscopy of the soil aggregate particles of different sizes was performed using a Fourier transform infrared spectrometer (Nicolet IS10; Thermo Fisher Scientific, Waltham, MA, USA). The soil sample was placed in a drying oven at 60 °C for 4 h before tableting to eliminate interference from the hydroxyl groups in excess water in the infrared spectrogram. We used an electronic balance (accuracy: 1/10,000) to weigh 2 mg of dry sample with 400 mg (sample: KBr = 1). The dried KBr (spectrally pure) was ground to a powder (particle size < 2 μm) in an agate mortar, thoroughly mixed, placed in a mould at 10 t·cm−2 pressure, pressed into a thin sheet for 1 min, and pressed into a transparent sheet. The sample was tested in an infrared spectrometer. The wave number ranged from 400 to 4000 cm−1, the number of scans was 32, the resolution was 4 cm−1, air was used as the background, and the background spectrum was automatically deducted during scanning.
Determination of other indicators: Soil total carbon (TC) was determined by elemental analyzer; Total nitrogen (TN) was determined by H2SO4 digestion and flow Analyzer (Auto Analyzer 3-AA3); Soil total phosphorus (TP) extraction concentrated H2SO4 digestion—molybdenum antimony resistance colorimetric method; Soil total potassium (TP) was measured by NaOH fusion-flame spectrophotometry; SOC content using a K2Cr2O7-H2SO4 heating method. NO3-N, NH4+-N content used KCl solution leaching method; Microbial biomass carbon (MBC) was determined by chloroform fumigation-K2SO4 extraction method Unfumigated portions of the filtrate can be used for soluble organic carbon (DOC); pH value and EC determination with S220K pH meter China) and conductivity meter.

2.5. Related Calculation

The stability indices of the soil aggregates were mean weight diameter (MWD), geometric mean diameter (GMD), and aggregate content > 0.25 mm (R0.25). The fractal dimensions (D) were described. The following calculations were used:
MWD = ∑ni = 1 WiXi
GMD = exp (∑ni = 1 WiLnXi)
Xi is the average diameter of the grade I aggregates (the average diameters of aggregates at all levels were coarse macro-aggregates (5 mm), fine macro-aggregates (1.125 mm), micro-aggregates (0.1515 mm), and silt and clay (0.0265 mm)). Wi is the mass of the grade i aggregates.
R 0.25 = 1 − MX < 0.25/MT
Mx < 0.25 is the particle size of the <0.25 mm aggregates, MT is the total weight of the aggregates.
D was calculated using the following formula [28]:
M ( r < X ¯ i ) M T = X ¯ i X m a x 3 D
x ¯ i is the average diameter of the grade i aggregate, M ( r < x ¯ i ) is the mass percentage of aggregates with particle size less than x ¯ i , MT is the total weight of the aggregate, xmax is the maximum particle size of the aggregate (8 mm).
The contribution rate of organic carbon to soil aggregates of different particle sizes was calculated using the method proposed by Liang et al. [12].
Contribution rate of aggregates (%) = [organic carbon content of aggregates
× percentage composition of aggregates (%)/SOC] × 100.

2.6. Statistical Analysis of Data

The experimental data were recorded by WPS XLSX and analysed statistically by SPSS 22.0 (IBM Corp., Armonk, NY, USA). One-way analysis of variance was used for different treatments, and the significance of differences was calculated using the least significant difference method (p < 0.05). A principal component analysis (PCA) of the relative contents determined the aggregate size and carbon content of soil and the relative content of functional groups. FTIR spectral analysis evaluated the differences among the treatments of the SOC fractions’chemical compositions. Omnic software (v8.0; Thermo Fisher Scientific) was used to analyse the infrared spectra. (1) Baseline correction was applied to rectify a slight tilt in the scanning process map using the softwar’s built-in function. (2) Relative peak areas were calculated following a baseline correction. The wavelength range of the absorption peak was determined by establishing a baseline within the range, integrating the absorption peak, calculating the correction area, and summing the total area of each absorption peak. The percentage of each peak area (i.e., the relative area of the absorption peak) was then calculated. Correlation analysis between soil organic carbon and aggregate organic carbon was conducted using ORIGIN 2021 for statistical analysis and linear fitting. All graphs in this study were generated using ORIGIN 2021 (Originlab, Northampton, MA, USA).

3. Results and Analysis

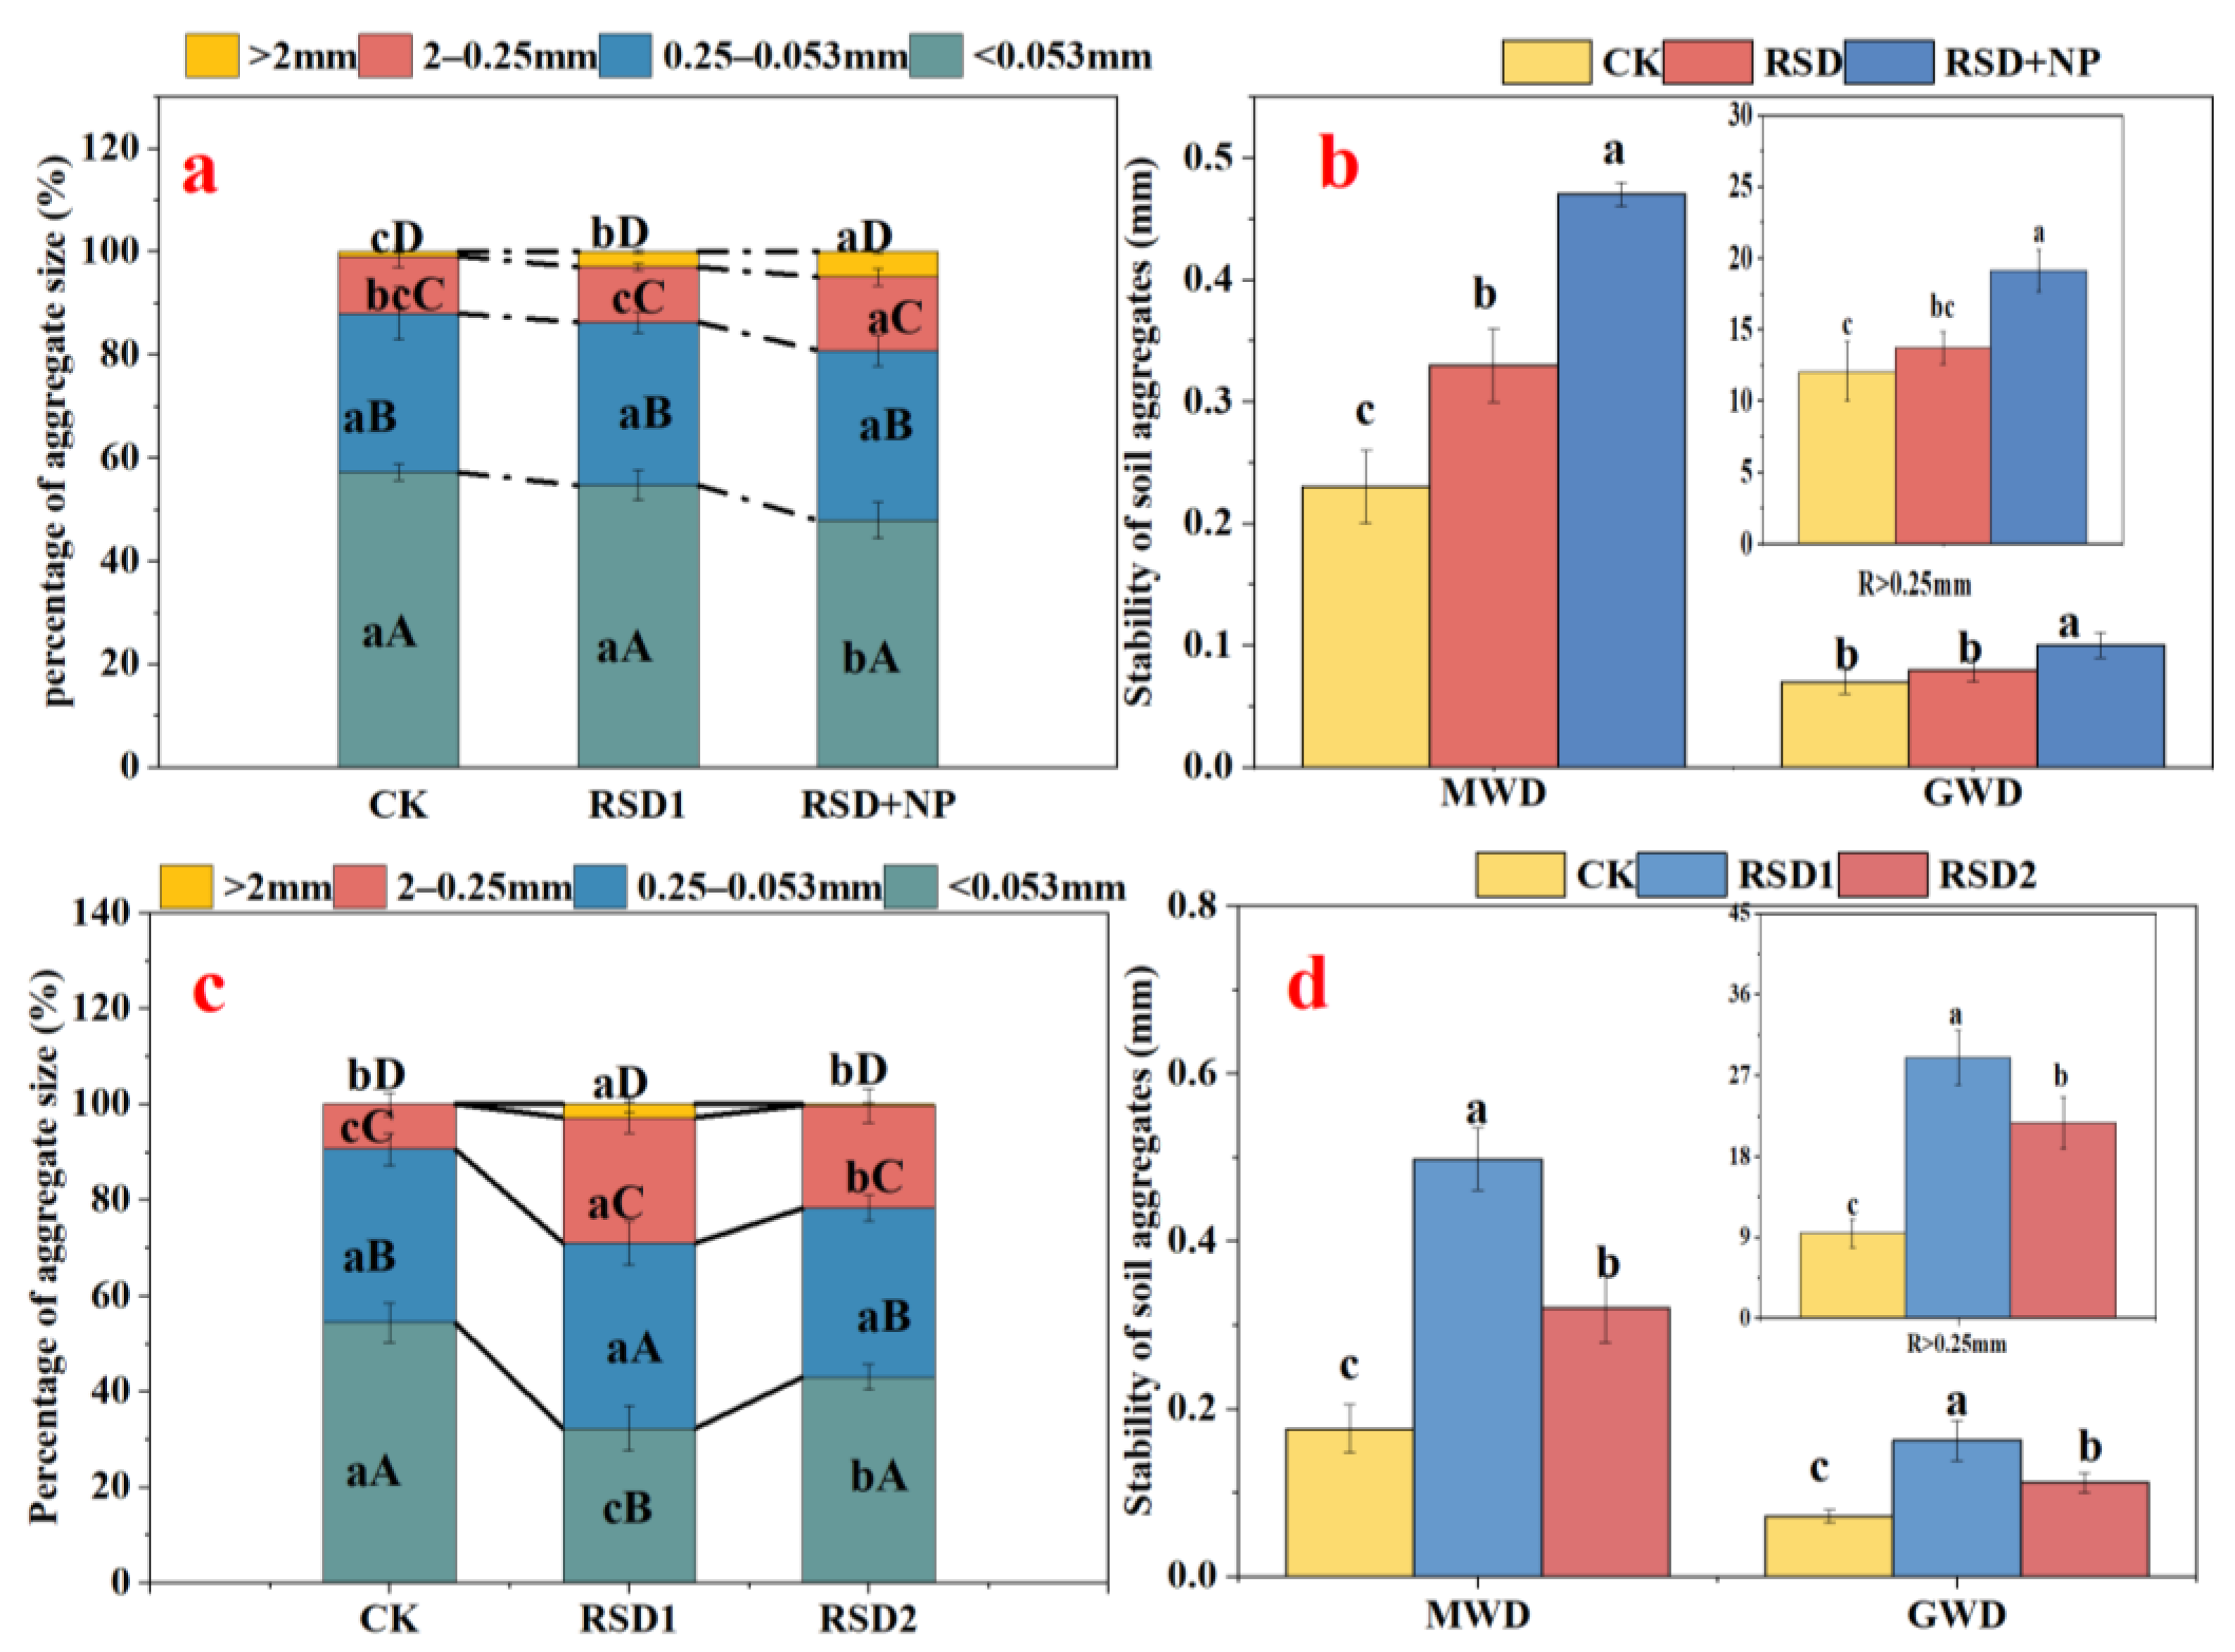
3.1. Structural Characteristics of Soil Aggregates

In this study, after 30 days of culturing under high-temperature anaerobic flooding, the wet sieve method [27] was used to obtain changes in the components of aggregates with different water stabilities, as shown in Figure 2a. The proportion of soil aggregates of different grades changed. Difference analysis showed that after RSD treatment, coarse (>2 mm) and fine macro-aggregates (0.25–2 mm) were significantly higher than those of the CK; the average proportions of RSD and RSD + NP were 3.0% and 4.9%, respectively. The results were especially evident in the RSD + NP treatment (p < 0.05).
The silt and clay (<0.053 mm) fraction in the RSD + NP treatment was significantly lower than that in other treatments, and the micro-aggregate (0.053–0.25 mm) fraction exhibited no significant change. Notably, nutrient addition enhanced agglomeration. The results demonstrated that RSD + NP treatment significantly increases the composition of large aggregates (>2 mm and 0.25–2 mm) while notably decreasing silt and clay (<0.053 mm).
The distributions of the aggregate components with different water stabilities are shown in Figure 2c. Compared with the CK group, the mass proportion of coarse macro-aggregates (>2 mm) and fine macro-aggregates (0.25–2 mm) treated with RSD1 was significantly increased (p < 0.05). The proportion of fine macro-aggregates (0.25–2 mm) of RSD1 and RSD2 increased from 9.5% to 26.3% and 21.5%, respectively (p < 0.05), while the mass proportion of silt and clay (<0.053 mm) of RSD1 and RSD2 decreased significantly (p < 0.05), from 54.3% to 32.3% and 43.0%, respectively. The mass proportion of micro-aggregates (0.053–0.25 mm) was not significantly different.
As shown in Figure 2b, within the context of robust reduction, the addition of exogenous organic carbon and can significantly improve the stability of soil aggregates and the MWD of each treatment from 0.26 to 0.47. The stability order was RSD + NP > RSD > CK, and the differences demonstrated statistical significance (p < 0.05). Specifically, for GMD and R > 0.25, RSD + NP exhibited significantly higher values compared to other treatments (p < 0.05), while no significant differences were observed among the remaining treatments.
In terms of soil aggregate stability, the average MWD, GMD, and percentage of soil aggregates (R > 0.25) followed the same trend: RSD1 > RSD2 > CK. The fractal dimension (D) followed the order CK > RSD2 > RSD1, and there was a significant difference between the treatments (p < 0.05, Figure 2d). After submerged culturing, the stability of the RSD treatment was much higher than that of the CK treatment. The stability of the RSD1 treatment with wheat straw was also significantly higher than that of the RSD2 treatment with kiwifruit branches. The results indicated that the addition of organic materials with low C/N ratios was conducive to improving the degree of soil agglomeration, thus improving the soil structure and increasing the mass proportion of large soil agglomerates.

3.2. Relative Contribution Rate of Organic Carbon in Soil Aggregate Components

The organic carbon content of the aggregates according to the classification of different aggregates is shown in Figure 3a. The organic carbon content in coarse macro-aggregates and fine macro-aggregates (>2 mm and 0.25–2 mm) was the highest, reaching 10.55 g/kg and 13.66 g/kg respectively, and that in silt and clay (<0.053 mm) was the lowest, only 6.63. (p > 0.05). The addition of straw significantly increased the SOC content. Compared with CK and the treatments without straw, the RSD and RSD + NP treatments significantly increased the organic carbon content in all aggregate fractions (p < 0.05). Compared with RSD, the SOC content in large aggregates (>2 mm and 0.25–2 mm) treated with RSD + NP was significantly decreased (p < 0.05) in aggregates with grain sizes >2 mm and 0.25–2 mm. SOC content in micro-aggregates (0.053–0.25 mm) exhibited a decreasing trend, but the change was not significant (p > 0.05). However, the SOC content in silt and clay (<0.053 mm) was in contrast to the order RSD + NP > RSD.
As shown in Figure 3b, the contribution rate of organic carbon in soil aggregates varied significantly. The largest contribution rate was observed in silt and clay (<0.053 mm), ranging from 36% to 45%, followed by micro-aggregates (0.053–0.25 mm) and fine macro-aggregates, with contribution rates of 32% to 36% and 16% to 22%, respectively. The lowest contribution rate was found in coarse macro-aggregates (>2 mm), accounting for only 1.4% to 6.8%.
The SOC distribution in the aggregates at all levels is shown in Figure 3c. The carbon content of fine macro-aggregates (0.25–2 mm) and micro-aggregates (0.053–0.25 mm) was the highest, followed by coarse macro-aggregates (>2 mm). The carbon content of silt and clay (<0.053 mm) was the lowest (p < 0.05). Silt and clay are protected by other aggregates; straw carbon does not easily combine with them. Consequently, the SOC content in silt and clay was the lowest. The distribution of SOC under different treatments showed the following pattern at all levels of aggregates: RSD2 > RSD1 > CK (p < 0.05). Compared with the CK, the SOC content in the >2 mm, 0.25–2 mm, 0.053–0.25 mm, and <0.053 mm aggregates increased by 13.9%, 24.2%, 29.8%, and 3.6%, respectively, in the RSD1 treatment with the addition of straw. The addition of kiwifruit branches in the RSD2 treatment increased the SOC content in the >2 mm, 0.25–2 mm, 0.053–0.25 mm, and <0.053 mm aggregates by 24.4%, 24.7%, 37.1%, and 14.8%, respectively. The carbon sequestration capacity of the micro-aggregates was the largest. The higher the C/N ratio, the greater the carbon sequestration capacity.
The contribution rate of aggregate carbon to the soil is shown in Figure 3d. Compared with the CK, RSD significantly increased the contribution rate of organic carbon in fine macro-aggregates (0.25–2 mm) (p < 0.05) from 15.0% to 35.2% and 30.8%. The contributions of organic carbon to silt and clay (<0.053 mm) were significantly reduced (p < 0.05) from 42.7% to 19.8% and 27.4%, respectively. There was no significant effect on micro-aggregates, mainly because exogenous carbon first accumulates into macro-aggregates. The influence on silt and clay is that the addition of exogenous carbon increases the agglomeration of soil, enhances the transformation of silt and clay into soil aggregates, and reduces the contribution of silt and clay to SOC.
As shown in Figure 4, the relationship between the contribution rate of SOC and soil aggregate organic carbon exhibited a significant correlation between SOC and particle sizes of >2 mm, 0.25–2 mm, and <0.053 mm (p < 0.05; Figure 4a,b). The contribution rate of SOC in large aggregates increased with the increase in whole SOC, and the contribution rate of SOC in silt and clay had a significant negative correlation with whole SOC (p < 0.01; Figure 4d), while the correlation between whole SOC content and micro-aggregates (0.053–0.25 mm) was not significant (Figure 4c).
The correlation results indicated that there was a significant positive correlation between whole SOC and fine macro-aggregates (0.25–2 mm) and micro-aggregates (0.053–0.25 mm) (p < 0.05; Figure 4f,g). Simultaneously, the contribution rates of SOC in silt and clay were negatively correlated with those of bulk SOC, but the difference was not significant (p > 0.05, Figure 4h).

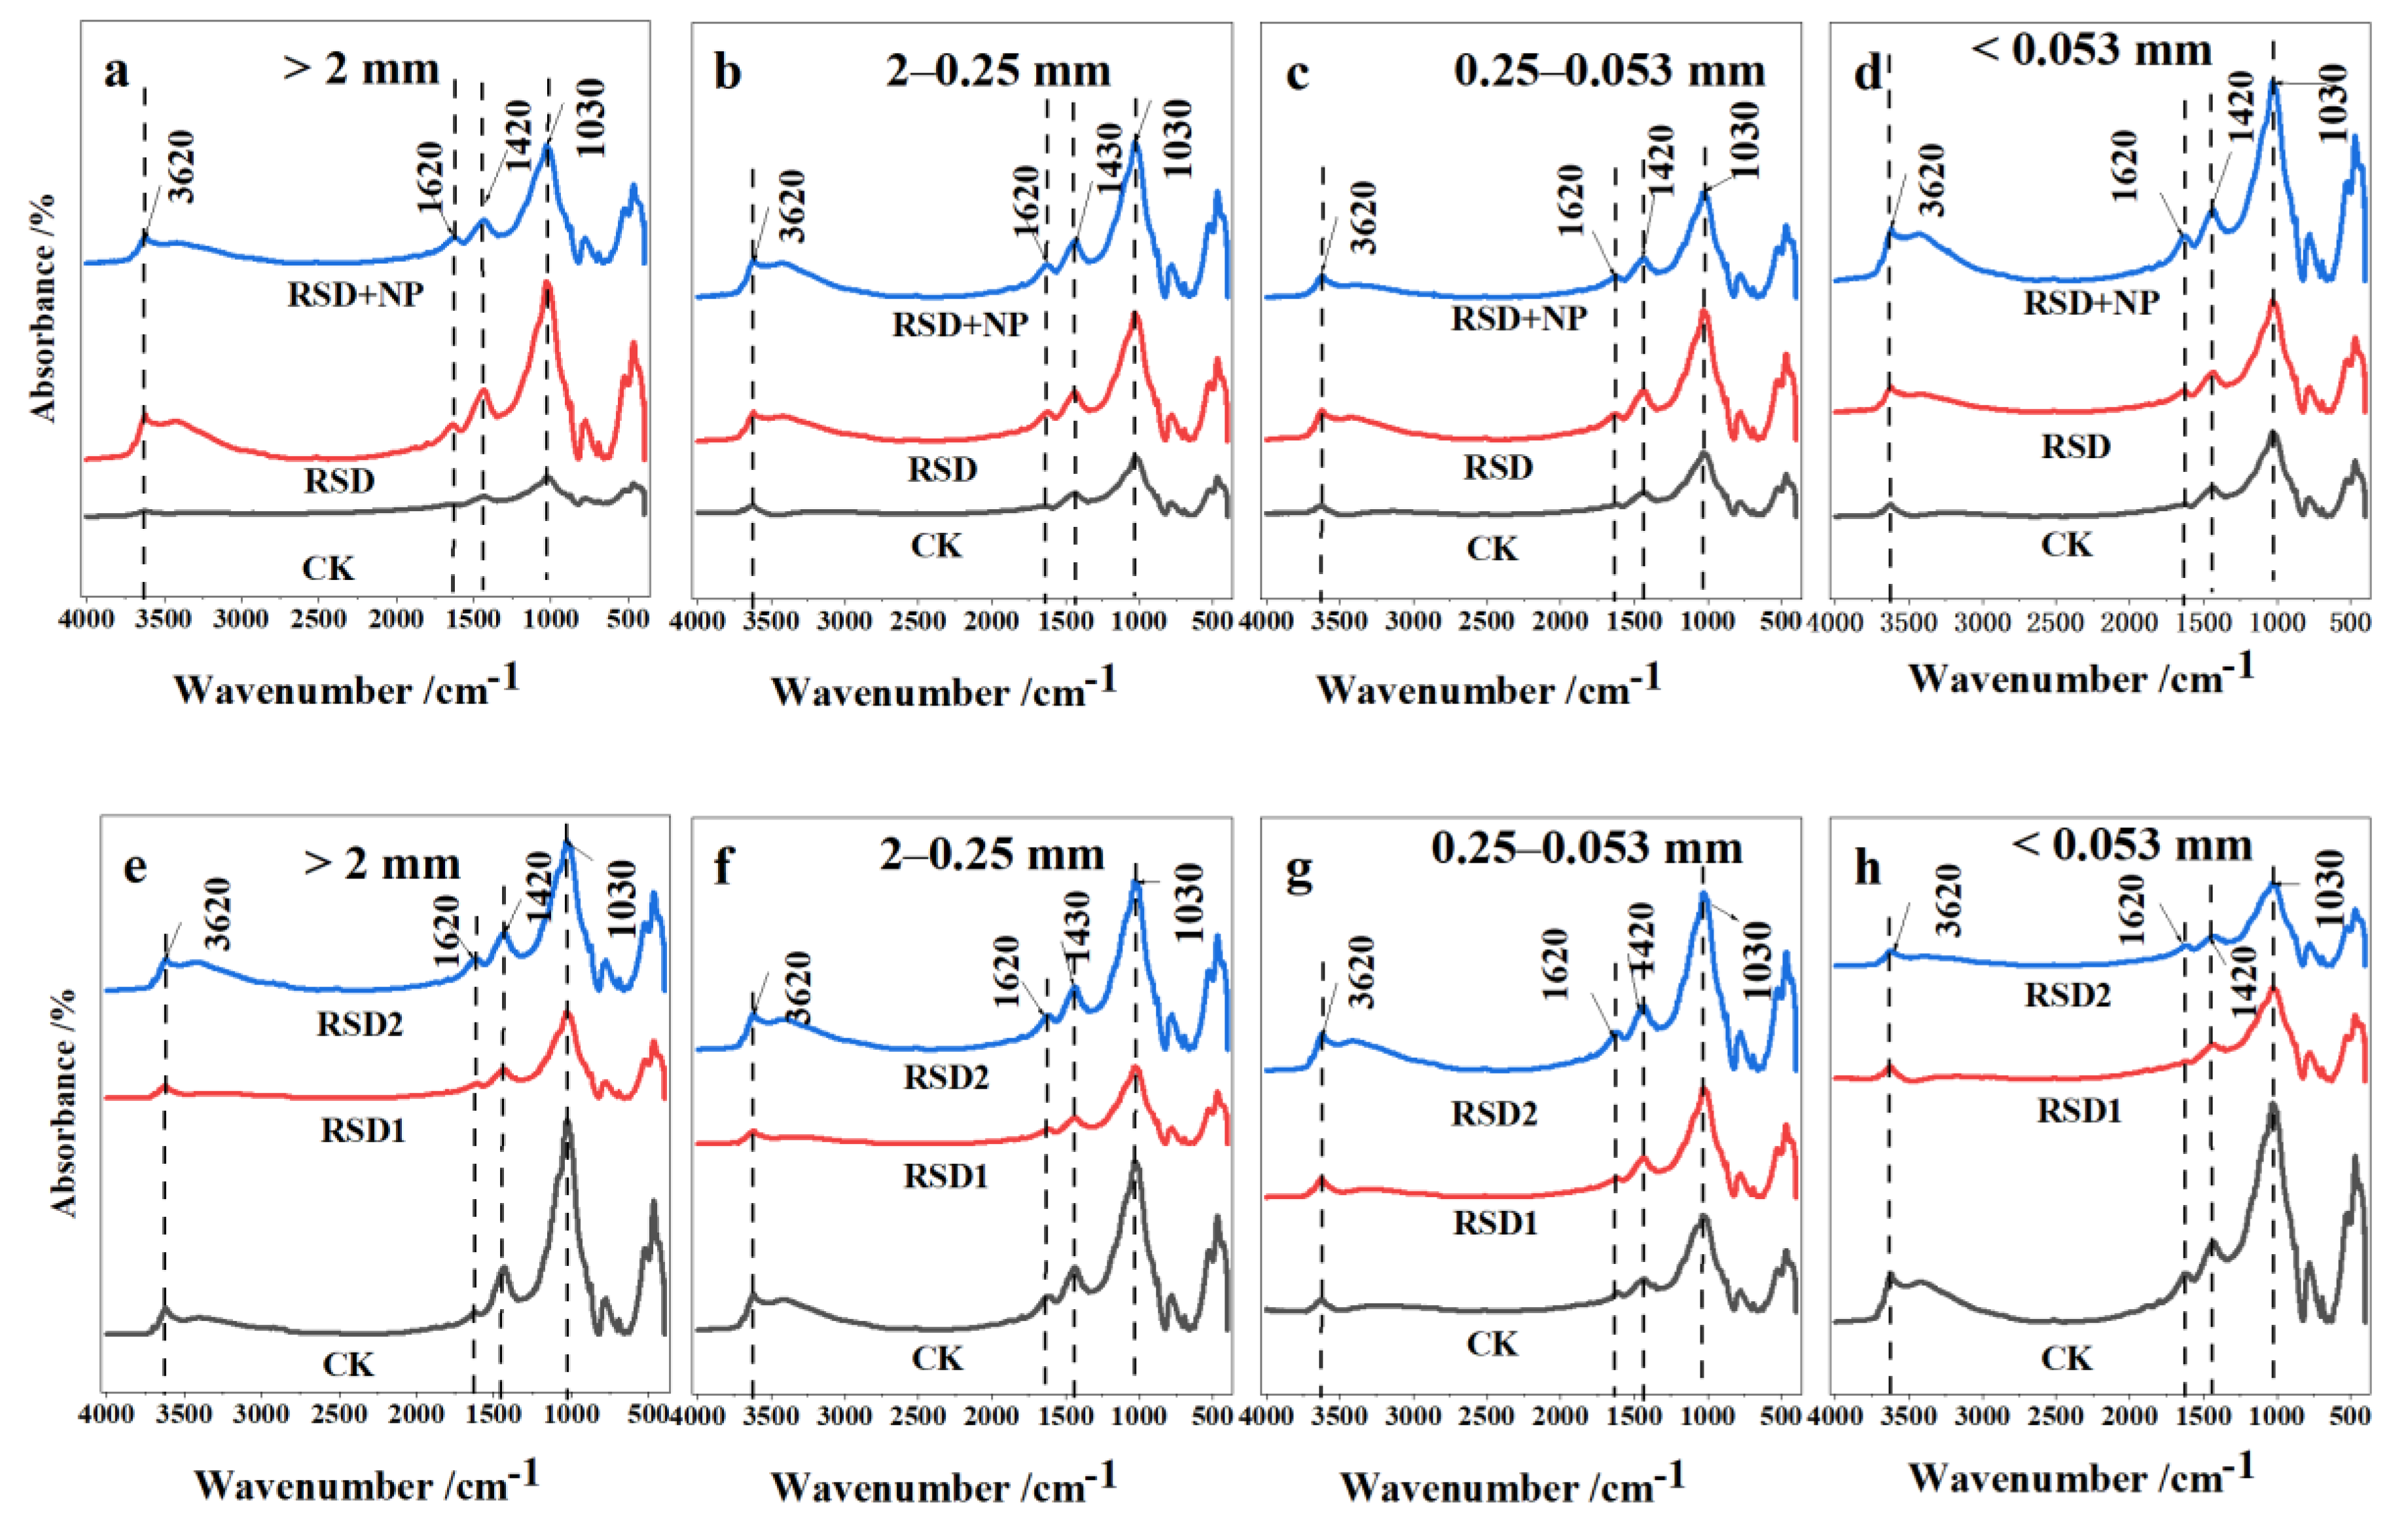
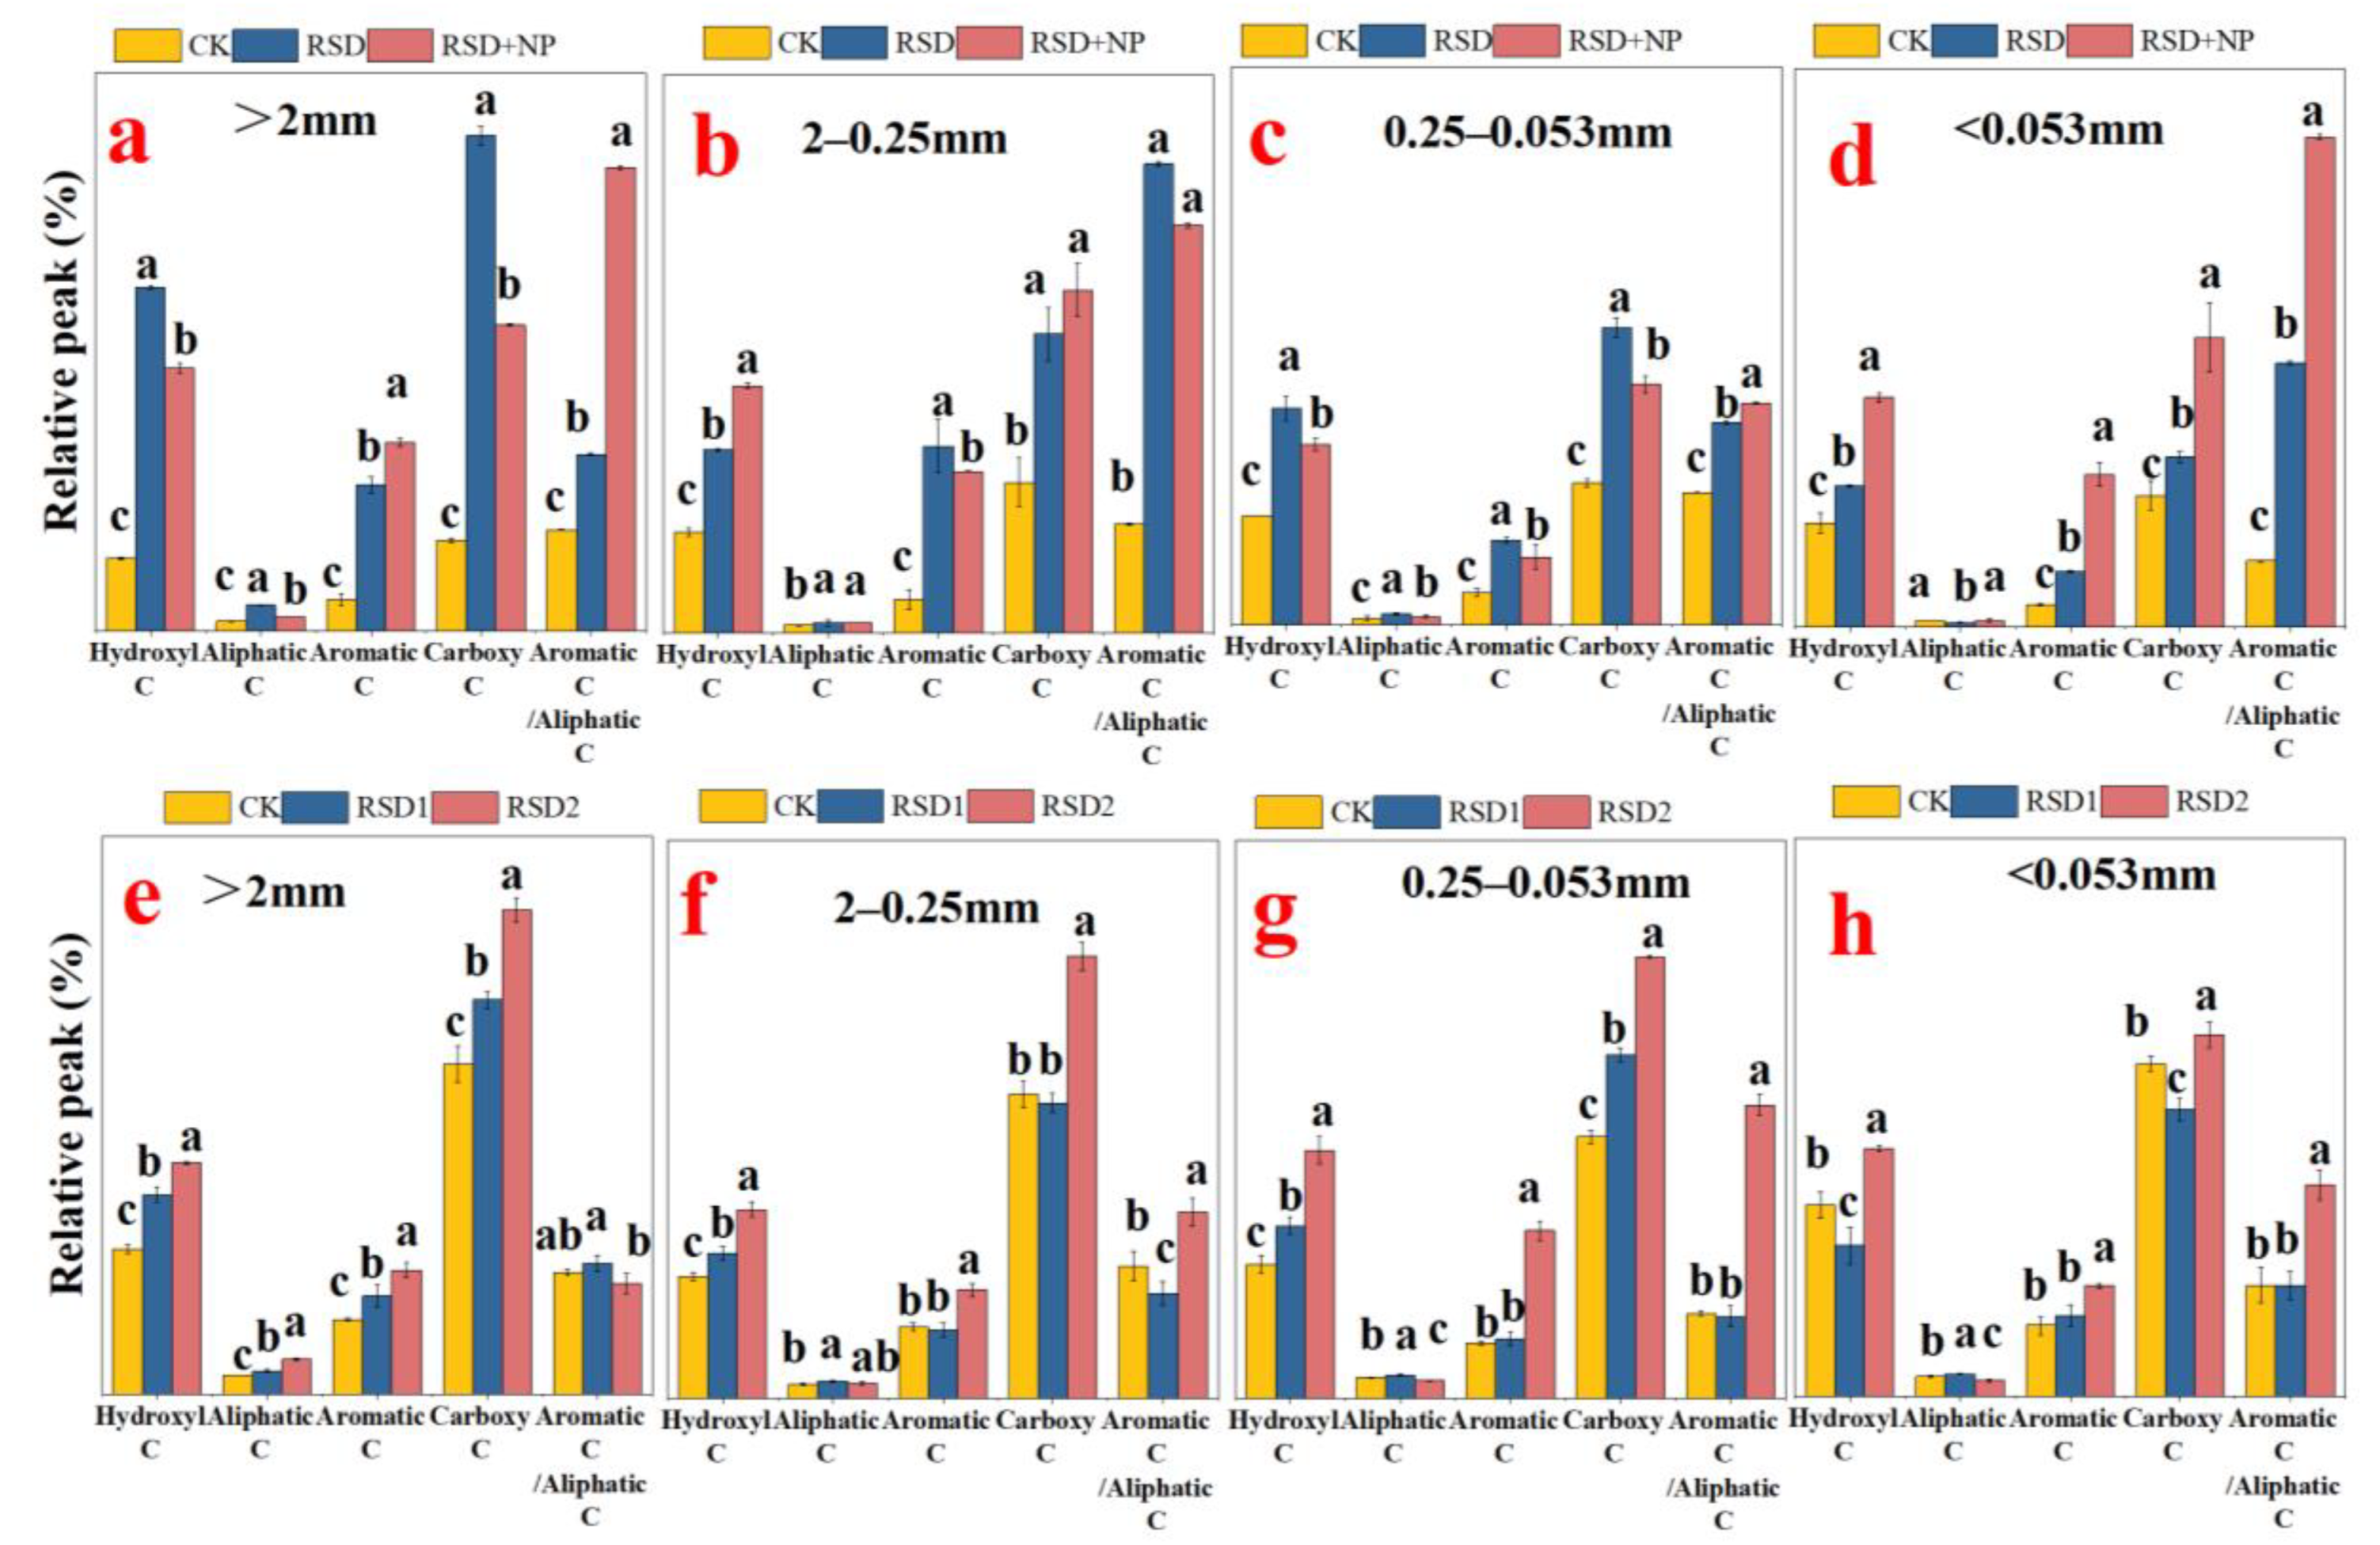
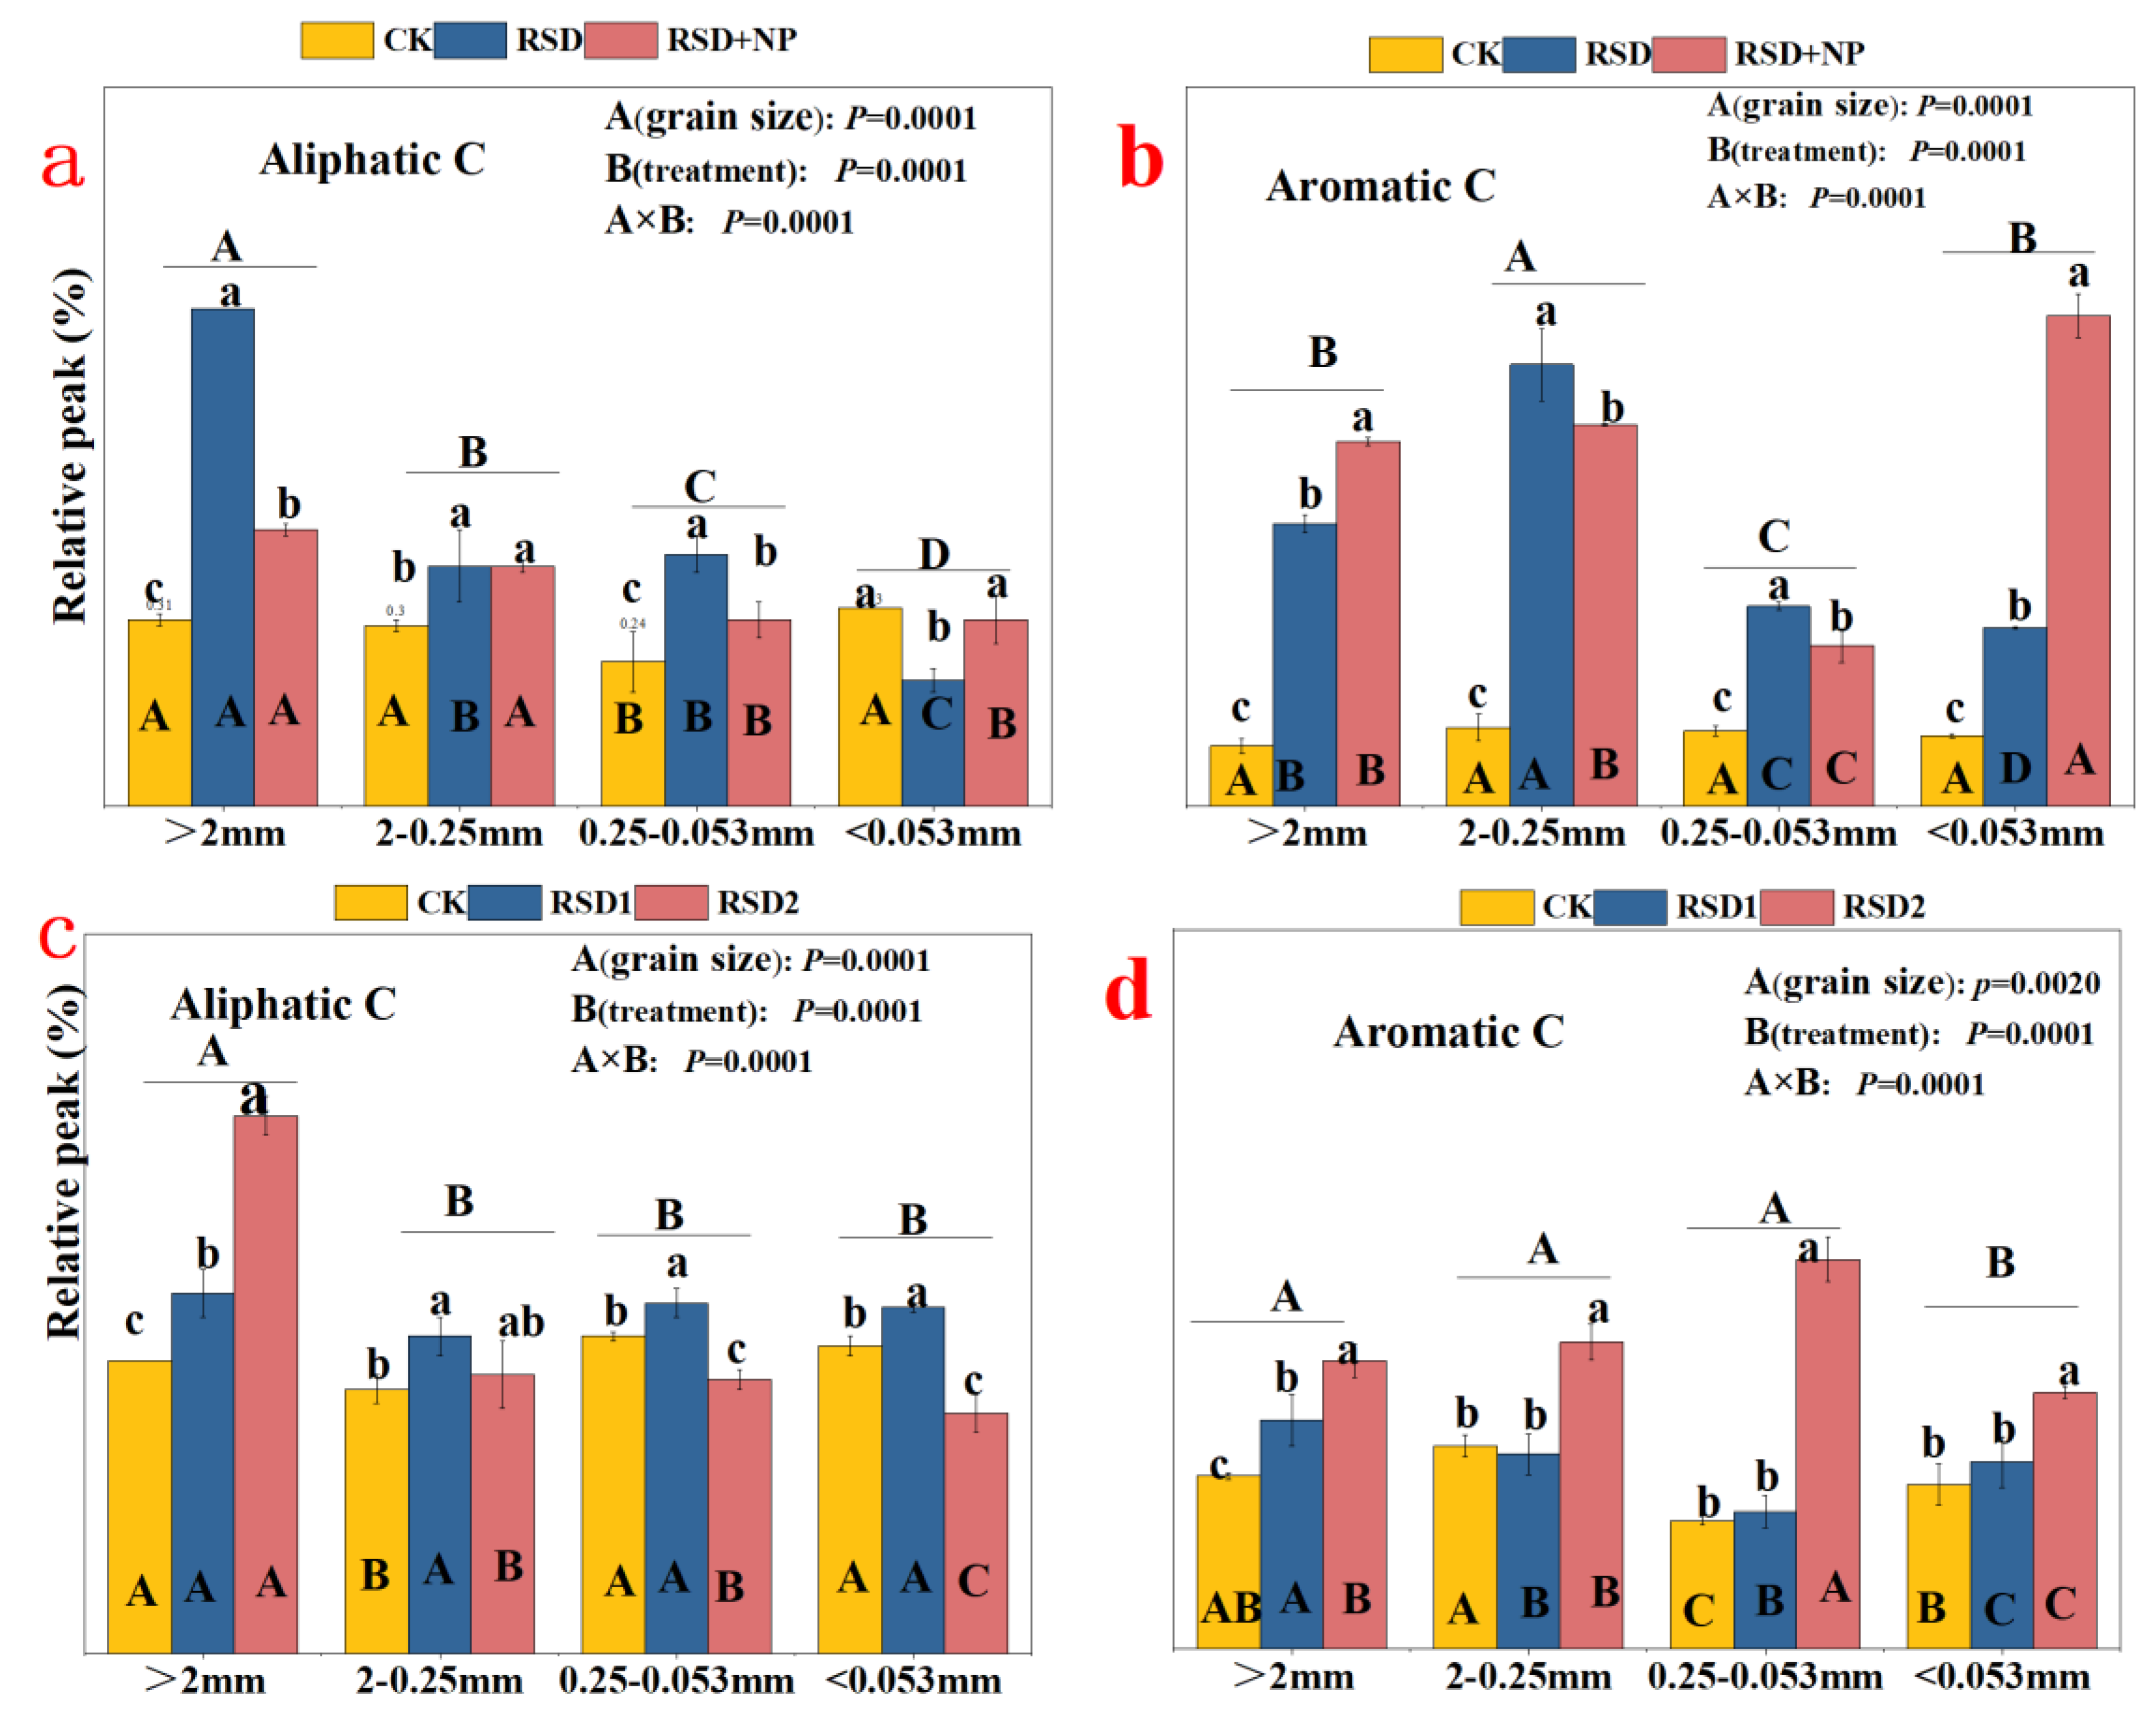
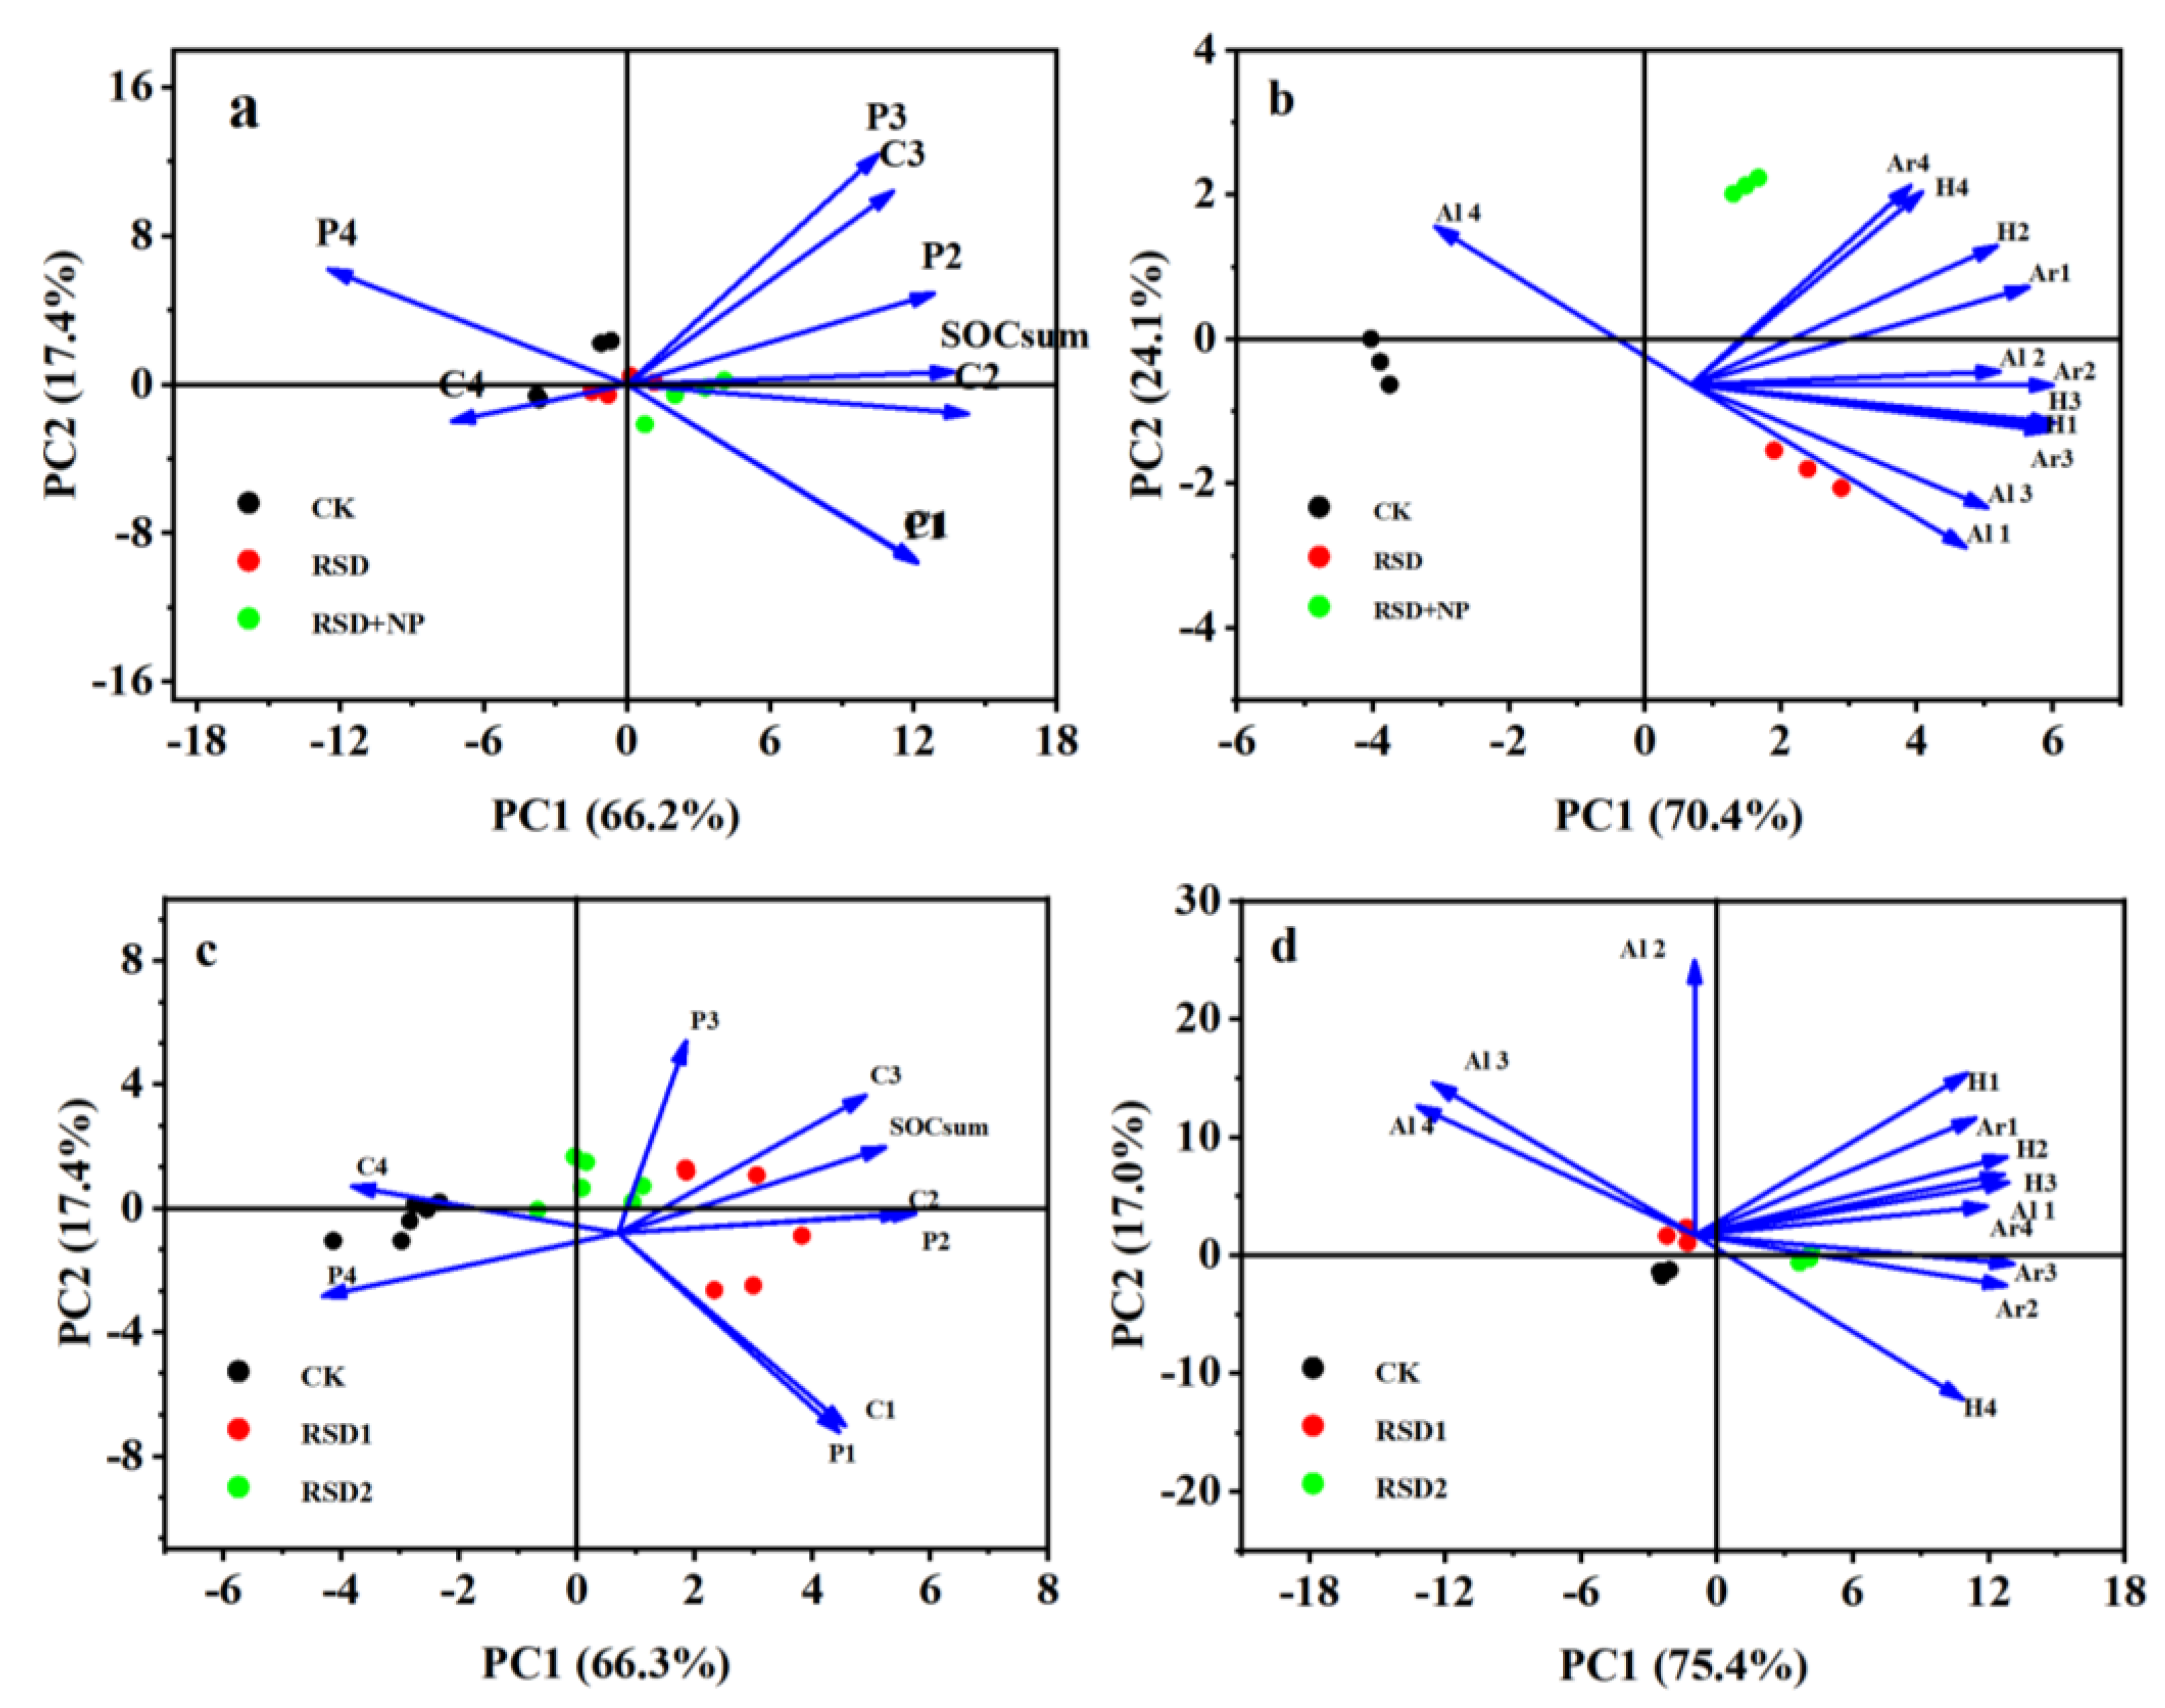
3.3. Functional Groups of Organic Carbon in Soil Aggregates

In this study, absorption peaks at 3620 cm−1, 2850–2925 cm−1, 1620 cm−1, and 1430 cm−1 were selected to reveal the characteristics of organic acids, aliphatic groups, aromatic groups, and saturated C-H functional groups, respectively, to explore the effects of different treatments on the organic carbonation structure of the soil [29]. Fourier infrared spectroscopy illustrated that, in aggregates of each particle size, the strength of various functional groups treated by RSD increased significantly compared with CK, indicating that the addition of exogenous carbon in aggregates can enrich SOC, and under the different treatments, the infrared spectral absorption peaks of the organic carbon skeleton of each component of the soil aggregates were similar (Figure 5). Among the four grain sizes, the intensity of alkoxy carbon (1030 cm−1) and organic acid compounds (3200–3650 cm−1) was relatively high, that of fatty carbon (2800–3010 cm−1) was the lowest. In the C-H bond functional group at 2850–2925 cm−1, representing the aliphatic group, a comparison between RSD treatments with different C/N ratios revealed that in coarse macro-aggregates (>2 mm), RSD2 treated with kiwi branches exhibited significantly higher levels than RSD1 treated with wheat straw (p < 0.05). Conversely, in aggregates of 0.25–2 mm, 0.053–0.25 mm, and <0.053 mm, RSD1 > RSD2 was observed (Figure 5e–h). These findings indicate that the aliphatic properties of RSD1 with wheat straw were higher than those of RSD2 with kiwi branches, particularly in aggregates <0.25 mm.
By calculating the relative intensity of the characteristic peak areas of different functional groups, the results showed that, compared with CK, after the addition of exogenous organic carbon, the absorption peak intensity of the carbon-related functional groups of the four grain grades was significantly increased (p < 0.05; Figure 6). For different RSD treatments, different types of functional groups showed RSD > RSD + NP in large aggregates (>2 mm and 0.25–2 mm) and micro-aggregates (0.25–0.053 mm), but the opposite was true in silt and clay, that is, RSD + NP > RSD. Aromatic carbon/aliphatic hydrocarbon carbon (1620/2925 + 2850) showed the order RSD + NP > RSD > CK (Figure 6a–d). Among the four different components of aggregates, RSD2 was significantly higher than RSD1 and CK (p < 0.05; Figure 6e–h), indicating that the soil treated with kiwifruit branches contained more aromatic carbon compared to the soil treated with wheat straw.
The ratio of 1620/2925 + 2850 cm−1 represents the ratio of aromatic carbon to aliphatic hydrocarbon carbon. The ratio of wheat straw treatment was the largest in aggregates >2 mm, and the ratio of kiwifruit branch treatment was the largest in aggregates 0.25–2 mm (p < 0.05; Figure 6e–h). These results indicate that, after adding exogenous carbon, an organic material with a low C/N ratio is conducive to improving the stability of large aggregate carbon, whereas an organic material with a high C/N ratio is conducive to improving the stability of micro-aggregate carbon.
Figure 7 shows the difference between the aliphatic and aromatic carbons for different grain sizes. Among them, there are significant differences in aliphatic carbon between different grain sizes (p < 0.05). In the straw combined with Chemical fertilizer treatment, the aliphatic carbon of the RSD treatment was significantly increased in three grain sizes (>2 mm, 0.25–2 mm, and 0.053–0.25 mm) compared with CK, while it was significantly decreased in grain sizes < 0.053 mm (Figure 7a). For aromatic carbon, RSD treatment significantly increased in all four grain grades compared with CK, and RSD + NP showed a significant increase in silt and clay (Figure 7b). Therefore, under RSD, the addition of straw and Chemical fertilizer can increase the accumulation of aliphatic carbon in large aggregates and increase the accumulation of aromatic carbon in silt and clay. Under the application of different organic matter C/N ratios, the proportion of the relative peak area of aliphatic carbon in RSD2 was significantly higher than that of other treatments, and the proportion of aromatic carbon content was the highest in the 0.053–0.25 mm grades (Figure 7c,d). Furthermore, the proportion of aliphatic carbon in RSD1 with a low C/N ratio was significantly higher than that in other aggregates (except for particle size > 2 mm), and the proportion of aromatic carbon in RSD2 with a high C/N ratio was significantly higher than that in other aggregates.
In the principal component analysis (PCA) of soil aggregate composition under straw combined with Chemical fertilizer application, the contribution rate of the first principal component (PC1) was 61.8%, and its eigenvalues were mainly C1, C2, C3, P1, P3, P4, and SOCsum. The contribution rate of the second principal component (PC2) was 21.9%, and its eigenvalues were mainly C4 and P2. The first two principal components cumulatively explained 83.7% of the variance of the variables. The different treatments could be clearly distinguished by PC1. Compared with CK, RSD significantly increased the C3 and C4 content (Figure 8a). The analysis of the chemical structure of soil aggregates showed that the contribution rate of PC1 was 55.1%, and its eigenvalues were mainly H1–H4, Ar1–3, and Al3. The contribution rate of PC2 was 28.9%, and its eigenvalues were mainly Al1, Al2, and Al4. The different treatments could be clearly distinguished by PC2. Compared with CK, RSD significantly increased the contents of H4, Ar2, and H1, and RSD + NP significantly increased the contents of Al2, Ar4, and H2 (Figure 8b).
After the application of different organic matter C/N ratios, the contribution rate of the first principal component (PC1) of soil aggregate composition was 66.3%, and its eigenvalues were mainly C2, C3, C4, P2, P4, and SOCsum. The contribution rate of the second principal component (PC2) was 17.4%, and the first two principal components cumulatively explained 83.7% of the variance of the variables. The different treatments could be clearly distinguished by PC1. Compared with CK, RSD1 and RSD2 significantly increased the SOCsum and P3 content (Figure 8c). The analysis of the chemical structure of soil aggregates showed that the contribution rate of PC1 and PC2 were 75.4% and 17.0%, respectively. The different treatments could be clearly distinguished by PC1. Compared with CK, RSD1 significantly increased the content of H4 (Figure 8d).

4. Discussion

4.1. Effects of RSD on Soil Aggregate Organic Carbon Content and Retention

Under high temperature and humidity conditions, RSD exhibits a robust agglomerating effect on soil macro-aggregates (>2 mm and 0.25–2 mm) when organic materials, such as straw, are added (Figure 2). Studies have demonstrated that the application of organic materials, including straw, plays an important role in soil carbon turnover and retention by improving agglomeration and aggregate stability [30,31]. Straw carbon is remained and accumulates in aggregate components through the physical, chemical, and biological protection mechanisms of the soil, indicating that aggregates can provide a favourable environment for the stabilisation and storage of exogenous organic carbon, and further stimulate the activity of microorganisms [32,33,34]. Aggregates of different particle sizes have varying effects on SOC. In the long run, micro-aggregates are crucial for the physical protection of SOC, whereas large aggregates mainly affect SOC stability [35,36,37].
The different application modes of RSD showed the different response of aggregate carbon retention. In this study, the addition of straw and fertiliser significantly increased the carbon contribution rate of soil macro-aggregates, while reducing the contribution rate of soil carbon in silty clay (Figure 3). This finding is consistent with those of previous studies. Six et al. [38] suggested that the turnover of all macro-aggregates is a key process that affects the immobilisation of SOC. Under 4.5 t·ha−1 and 9 t·ha−1 application, straw biochar significantly increased the soil macro-aggregate content, MWD, aggregate ratio, and other indicators [39]. Stewart and Oliveira et al. [24,40] also showed that under the combined application of organic and inorganic materials, SOC and total nitrogen were mainly distributed in macro-aggregates (>0.25 mm) and that the addition of organic matter increased the contents of organic carbon and total nitrogen in the aggregates. Meanwhile, silt and clay (<0.053 mm) in the soil were transformed into macro- and micro-aggregates (Figure 2). This agglomeration is mainly related to changes in sugars, amino acids, and other substances produced by straw decomposition under nutrient regulation. Therefore, returning straw to the field can improve the stability of aggregates, and fertiliser further increases the stability of aggregates [41].
Soil agglomeration and organic carbon retention were not only affected by C/N of exogenous carbon input, but also related to the stability of exogenous carbon components. In this study, it was found that wheat straw had a stronger agglomeration effect on soil than kiwi branches with a higher C/N (Figure 2 and Figure 3). Straw decomposition products with low C/N helped gradually agglomerate the silt and clay and eventually form large aggregates, thus changing the mass distribution of the aggregates [42]. The addition of kiwifruit branches has a relatively weak effect on soil agglomeration. This may be because the kiwifruit branches contain lignin and other substances that are difficult to decompose. Under the same time conditions, they are difficult to decompose into sugars and amino acids that are easy to degrade, and fewer macro-aggregates are formed than those of wheat straw [43].
In addition, the addition of exogenous organic material effectively improved the stability of soil aggregates (Figure 2). Crop residues are key to the development and stability of the soil structure [44,45]. In our study, a large amount of exogenous organic carbon was added, and after plant residues entered the soil, they were first immobilised by soil macro-aggregates. Simultaneously, the newly added organic materials can also serve as a carbon source for the growth of fungi and other soil micro-organisms [34,37,41], all of which increase water-stable aggregates, thus leading to a higher proportion of macro-aggregates in the soil with the addition of organic materials. Some studies have also shown that this is related to the duration of application of exogenous organic matter. The long-term input of organic materials effectively promoted the formation of lignin in soil micro-aggregates to improve the stability of soil carbon [46,47,48]. However, this phenomenon is difficult to reflect in short-term experiments, so the follow-up study can conduct in-depth discussion on aggregate carbon from the perspective of different input durations of organic matter. Compared to wheat straw, the MWD, GWD, and R > 0.25 of the aggregates treated with kiwifruit branches were significantly lower, and the D value was significantly higher. Therefore, organic matter with a low C/N ratio can increase soil aggregate stability.
In summary, under conditions of high temperature, high humidity, and anaerobic RSD, the addition of exogenous straw-carbon promotes the formation of macro-aggregates and significantly increases the aggregation of straw-carbon in macro-aggregates. Owing to physicochemical protection, the effect of macro-aggregates is more obvious. At the same time, the input of exogenous carbon with a low C/N ratio effectively improves the soil structure and the stability of macro-aggregates, and increases carbon retention in soil aggregates [42,49].

4.2. Effects of RSD on the Chemical Structure of Soil Aggregate Organic Carbon

For nearly 20 years, Fourier transform infrared spectroscopy has been successfully used to study the functional group distribution of organic carbon in soils [50]. It can describe the composition of SOM by functional groups, such as aromatic, aliphatic, hydroxyl, carboxyl, and polysaccharide groups, and has a higher sensitivity in analysing some C-containing functional groups, such as aliphatic C-H groups, amide C-O groups, and carbonyl C-O groups [21]. The results of this study showed that under the RSD treatment, the chemical structure changes of organic carbon in the soil showed a certain regularity, and there was also a certain correlation with the stability of the aggregates (Figure 5). In each grain grade of the aggregates, the peak area of the polysaccharide functional groups was always the highest, which is consistent with the results of other studies. Kubar et al. [51] found that polysaccharides were the main organic functional groups in paddy soil, followed by fatty and aromatic carbons. The addition of exogenous carbon helped to increase the strength of all carbon-containing functional groups in the soil aggregates and simultaneously increased the stability of SOC (Figure 5). At the same time, exogenous carbon combined with fertilizer was more conducive to the accumulation of organic carbon in powder clay. Dhillon et al. [52] found that the combined application of organic fertiliser mainly increased the proportion of alkoxy carbon functional groups in soil macro-aggregates, while carbonyl carbon mainly aggregated in macro- and micro-aggregates. In other words, RSD increased the content of amino compounds, aliphatic carbon, ester compounds, aromatic carbon, and carbohydrates in the soil, and increased the richness of soil organic functional groups and the stability of organic matter [33].
In this study, it was found that after adding exogenous carbon, an organic material with a low C/N ratio is conducive to improving the stability of large aggregate carbon, whereas an organic material with a high C/N ratio is conducive to improving the stability of micro-aggregate carbon. According to the Elliott [27] model, macro-aggregates are formed from small aggregates cemented by unstable cementing agents such as fungal mycelium, roots, micro-organisms, and plant-derived polysaccharides and therefore contain more organic carbon than small aggregates. Soil cementation agents mainly come from the degradation of soil organic matter, and the aromatic carbon, carboxyl carbon, carbonyl carbon, amide nitrogen, and DON (phenolic alcohol aromatic compounds) formed by the decomposition of organic materials are first adsorbed on the surface of soil clay and are coated by micro-aggregates after soil cementation and flocculation. These compounds can promote the formation and stability of aggregates, thereby improving the physical properties and fertility of the soil [53]. In addition, the aliphatic carbon content of wheat straw treated with a low C/N ratio was higher than that of kiwifruit branches. Studies have confirmed that the stable organic carbon produced after the decomposition of organic matter with a high C/N ratio, such as aromatic, carboxyl carbon, carbonyl carbon, and other compounds, is preferentially adsorbed on the soil fine particles and is covered by micro-aggregates after soil cementation and condensation [54,55]. The results of this study show that the strength of various functional groups treated with RSD increased significantly.

5. Conclusions

Under RSD conditions, straw combined with fertilizer can enhance macroaggregate (>2 mm and 0.25–2 mm) agglomeration, while promoting silty clay particles in the soil (<0.053 mm) to form macroaggregates and microaggregates, significantly increasing the contribution rate of carbon in soil macroaggregates. In addition, foreign carbon combined with fertilizer is highly conducive to the accumulation of organic carbon in silt and clay. Exogenous carbon mainly increased the content of aliphatic organic carbon and aromatic organic carbon in soil aggregates of different grain levels and improved the stability of soil aggregates at all levels and increased soil organic carbon. Organic materials with low C/N ratios contribute to the increase the mass percentage content of coarse aggregates (>2 mm) and fine and large aggregates (0.25–2 mm), increase the organic carbon content, and enhance the stability of aggregates, while organic materials with high C/N ratios help to improve the stability of micro-aggregate carbon; the lower the C/N ratio, the more beneficial to soil organic carbon retention. Therefore, in the RSD repair process, the choice of materials is also a key factor.

6. Shortcomings and Prospects of the Research

This study only used two materials with different C/N ratios, which has limitations in the selection of materials. In addition, this study mainly discussed the effect of soil agglomeration and organic carbon sequestration under RSD. However, this experiment lacks the consideration of soil disease repair effect and actual production. Therefore, in the follow-up study, we will focus on the synergistic effect analysis of soil organic carbon sequestration and soil-borne disease control, so as to promote sustainable production in relevant areas and the promotion and application of RSD technology.

Supplementary Materials

The following supporting information can be downloaded at: https://www.mdpi.com/2073-4395/14/1/179/s1, Figure S1: Picture of soil-borne diseases in the study area; Figure S2: Experimental schematic of laboratory culture tests.

Author Contributions

S.W. drafted the original manuscript and completed the manuscript revision. X.T. and J.H. made constructive suggestions. J.W., S.X., Y.J. (Yuhan Jiang), Y.Z., J.Z. and J.Y. performed field work and sample analysis. Y.J. (Yapeng Jiao) assisted in the image processing. All authors have read and agreed to the published version of the manuscript.

Funding

This study was supported by National Key R&D Program of China (2021YFD1900700), National Key R&D Program of China (2022YFD1900300), Key Research and Development Program of Shaanxi (2022ZDLNY02-06), and National Natural Science Foundation of China (32372823).

Data Availability Statement

Data will be made available on request. All relevant data are within the paper.

Acknowledgments

The research team wishes to extend their gratitude to Yunlong Zhai and Binbin Cao for revising the manuscript.

Conflicts of Interest

The authors declare that they have no known competing financial interests or personal relationships that could have appeared to influence the work reported in this paper.

Correction Statement

This article has been republished with a minor correction to resolve spelling and grammatical errors. This change does not affect the scientific content of the article.

References

  1. Liu, L.; Long, S.; Deng, B.; Kuang, J.; Wen, K.; Li, T.; Bai, Z.; Shao, Q. Effects of Plastic Shed Cultivation System on the Properties of Red Paddy Soil and Its Management by Reductive Soil Disinfestation. Horticulturae 2022, 8, 279. [Google Scholar] [CrossRef]
  2. Blok, W.J.; Lamers, J.G.; Termorshuizen, A.J.; Bollen, G.J. Control of Soilborne Plant Pathogens by Incorporating Fresh Organic Amendments Followed by Tarping. Phytopathology 2000, 90, 253–259. [Google Scholar] [CrossRef] [PubMed]
  3. Huang, X.; Liu, L.; Wen, T.; Zhang, J.; Shen, Q.; Cai, Z. Reductive Soil Disinfestations Combined or Not with Trichoderma for the Treatment of a Degraded and Rhizoctonia Solani Infested Greenhouse Soil. Sci. Hortic. 2016, 206, 51–61. [Google Scholar] [CrossRef]
  4. Huang, X.; Liu, L.; Zhao, J.; Zhang, J.; Cai, Z. The Families Ruminococcaceae, Lachnospiraceae, and Clostridiaceae Are the Dominant Bacterial Groups during Reductive Soil Disinfestation with Incorporated Plant Residues. Appl. Soil Ecol. 2019, 135, 65–72. [Google Scholar] [CrossRef]
  5. Jiang, Y.; Kang, Y.; Han, C.; Zhu, T.; Deng, H.; Xie, Z.; Zhong, W. Biochar Amendment in Reductive Soil Disinfestation Process Improved Remediation Effect and Reduced N 2 O Emission in a Nitrate-Riched Degraded Soil. Arch. Agron. Soil Sci. 2020, 66, 983–991. [Google Scholar] [CrossRef]
  6. Momma, N. Biological Soil Disinfestation (BSD) of Soilborne Pathogens and Its Possible Mechanisms. JARQ 2008, 42, 7–12. [Google Scholar] [CrossRef]
  7. Chen, Y.; Zhang, Y.; Li, C.; Xu, R.; Pei, Z.; Li, F.; Wu, Y.; Chen, F.; Liang, Y.; Li, Z.; et al. Linking Soil Organic Carbon Dynamics to Microbial Community and Enzyme Activities in Degraded Soil Remediation by Reductive Soil Disinfestation. Appl. Soil Ecol. 2023, 189, 104931. [Google Scholar] [CrossRef]
  8. Adesodun, J.K.; Mbagwu, J.S.C.; Oti, N. Distribution of Carbon, Nitrogen and Phosphorus in Water-Stable Aggregates of an Organic Waste Amended Ultisol in Southern Nigeria. Bioresour. Technol. 2005, 96, 509–516. [Google Scholar] [CrossRef]
  9. Wu, M.; Pang, D.; Chen, L.; Li, X.; Liu, L.; Liu, B.; Li, J.; Wang, J.; Ma, L. Chemical Composition of Soil Organic Carbon and Aggregate Stability along an Elevation Gradient in Helan Mountains, Northwest China. Ecol. Indic. 2021, 131, 108228. [Google Scholar] [CrossRef]
  10. Jastrow, J.D.; Miller, R.M. Soil Aggregate Stabilization and Carbon Sequestration: Feedbacks through Organomineral Associations. In Office of Scientific & Technical Information Technical Reports; Taylor & Francis Group: Abingdon, UK, 1998. [Google Scholar]
  11. Xiong, S.; Zhu, J.; Yang, J.; Guo, Y.; Meng, X.; Ren, S.; Du, J.; Wen, S.; Jiang, Y.; Shi, J.; et al. Straw Return plus Zinc Fertilization Increased the Accumulations and Changed the Chemical Compositions of Mineral-Associated Soil Organic Carbon. Agric. Ecosyst. Environ. 2023, 357, 108699. [Google Scholar] [CrossRef]
  12. Liang, Z.; Cao, B.; Jiao, Y.; Liu, C.; Li, X.; Meng, X.; Shi, J.; Tian, X. Effect of the Combined Addition of Mineral Nitrogen and Crop Residue on Soil Respiration, Organic Carbon Sequestration, and Exogenous Nitrogen in Stable Organic Matter. Appl. Soil Ecol. 2022, 171, 104324. [Google Scholar] [CrossRef]
  13. Six, J.; Elliott, E.T.; Paustian, K. Soil Macroaggregate Turnover and Microaggregate Formation: A Mechanism for C Sequestration under No-Tillage Agriculture. Soil Biol. Biochem. 2000, 32, 2099–2103. [Google Scholar] [CrossRef]
  14. Le Guillou, C.; Angers, D.A.; Leterme, P.; Menasseri-Aubry, S. Differential and Successive Effects of Residue Quality and Soil Mineral N on Water-Stable Aggregation during Crop Residue Decomposition. Soil Biol. Biochem. 2011, 43, 1955–1960. [Google Scholar] [CrossRef]
  15. Sall, S.N.; Masse, D.; Diallo, N.H.; Sow, T.M.B.; Hien, E.; Guisse, A. Effects of residue quality and soil mineral n on microbial activities and soil aggregation in a tropical sandy soil in senegal. Eur. J. Soil Biol. 2016, 75, 62–69. [Google Scholar]
  16. Zhu, Z.; Angers, D.A.; Field, D.J.; Minasny, B. Using Ultrasonic Energy to Elucidate the Effects of Decomposing Plant Residues on Soil Aggregation. Soil Tillage Res. 2017, 167, 1–8. [Google Scholar] [CrossRef]
  17. Rahman, M.T.; Liu, S.; Guo, Z.C.; Zhang, Z.B.; Peng, X.H. Impacts of Residue Quality and N Input on Aggregate Turnover Using the Combined 13C Natural Abundance and Rare Earth Oxides as Tracers. Soil Tillage Res. 2019, 189, 110–122. [Google Scholar] [CrossRef]
  18. Demyan, M.S.; Rasche, F.; Schulz, E.; Breulmann, M.; Cadisch, G. Use of Specific Peaks Obtained by Diffuse Reflectance Fourier Transform Mid-Infrared Spectroscopy to Study the Composition of Organic Matter in a Haplic Chernozem. Eur. J. Soil Sci. 2012, 63, 189–199. [Google Scholar] [CrossRef]
  19. Demyan, M.S.; Rasche, F.; Schütt, M.; Smirnova, N.; Schulz, E.; Cadisch, G. Combining a Coupled FTIR-EGA System and in Situ DRIFTS for Studying Soil Organic Matter in Arable Soils. Biogeosciences 2013, 10, 2897–2913. [Google Scholar] [CrossRef]
  20. Fultz, L.M.; Jennifer, M.K.; Francisco, C.; Veronica, A.-M. Using Fourier-Transform Mid-Infrared Spectroscopy to Distinguish Soil Organic Matter Composition Dynamics in Aggregate Fractions of Two Agroecosystems. Soil Sci. Soc. Am. J. 2014, 78, 1940–1948. [Google Scholar] [CrossRef]
  21. Chen, J.; Gu, B.; Leboeuf, E.J.; Pan, H.; Dai, S. Spectroscopic Characterization of the Structural and Functional Properties of Natural Organic Matter Fractions. Chemosphere 2002, 48, 59–68. [Google Scholar] [CrossRef]
  22. Brown, K.H.; Bach, E.M.; Drijber, R.A.; Hofmockel, K.S.; Jeske, E.S.; Sawyer, J.E.; Castellano, M.J. Long-Term Nitrogen Fertilizer Gradient Has Little Effect on Soil Organic Matter in a High-Intensity Maize Production System. Glob. Chang. Biol. 2014, 20, 1339–1350. [Google Scholar] [CrossRef] [PubMed]
  23. Zhi-Fu, P.; Mei, H.; An, X.; Yue-Xian, Z.; Xin, W.; Hui-Xin, Z.; Qin-Guo, S. Chemical Structure Characteristics of Organic Carbon in Saline Soil Aggregates under Straw Returning Condition. Chin. J. Appl. Ecol. 2021, 32, 4401–4410. [Google Scholar]
  24. Stewart, C.E.; Follett, R.F.; Wallace, J.; Pruessner, E.G. Impact of Biosolids and Tillage on Soil Organic Matter Fractions: Implications of Carbon Saturation for Conservation Management in the Virginia Coastal Plain. Soil Sci. Soc. Am. J. 2012, 76, 1257–1267. [Google Scholar] [CrossRef]
  25. Wei, H.; Guenet, B.; Vicca, S.; Nunan, N.; Asard, H.; AbdElgawad, H.; Shen, W.; Janssens, I.A. High Clay Content Accelerates the Decomposition of Fresh Organic Matter in Artificial Soils. Soil Biol. Biochem. 2014, 77, 100–108. [Google Scholar] [CrossRef]
  26. Kirkby, C.A.; Richardson, A.E.; Wade, L.J.; Batten, G.D.; Blanchard, C.; Kirkegaard, J.A. Carbon-Nutrient Stoichiometry to Increase Soil Carbon Sequestration. Soil Biol. Biochem. 2013, 60, 77–86. [Google Scholar] [CrossRef]
  27. Elliott, E.T. Aggregate Structure and Carbon, Nitrogen, and Phosphorus in Native and Cultivated Soils. Soil Sci. Soc. Am. J. 1986, 50, 627. [Google Scholar] [CrossRef]
  28. Kang, S.Z.; Liu, X.M.; Gao, X.K.; Xiong, Y.Z. Computer Simulation of Water Transport in Soil-Plant-Atmosphere Continuum. J. Hydraul. Eng. 1992, 3, 1–12. [Google Scholar]
  29. Matamala, R.; Jastrow, J.D.; Calderón, F.J.; Liang, C.; Fan, Z.; Michaelson, G.J.; Ping, C.L. Predicting the Decomposability of Arctic Tundra Soil Organic Matter with Mid Infrared Spectroscopy. Soil Biol. Biochem. 2019, 129, 1–12. [Google Scholar] [CrossRef]
  30. Bucka, F.B.; Klbl, A.; Uteau, D.; Peth, S.; Kgel-Knabner, I. Organic Matter Input Determines Structure Development and Aggregate Formation in Artificial Soils. Geoderma 2019, 354, 113881. [Google Scholar] [CrossRef]
  31. Bronick, C.J.; Lal, R. Soil Structure and Management: A Review. Geoderma 2005, 124, 3–22. [Google Scholar] [CrossRef]
  32. Huang, S.; Rui, W.; Peng, X.; Huang, Q.; Zhang, W. Organic Carbon Fractions Affected by Long-Term Fertilization in a Subtropical Paddy Soil. Nutr. Cycl. Agroecosyst. 2010, 86, 153–160. [Google Scholar] [CrossRef]
  33. Cosentino, D.; Chenu, C.; Bissonnais, Y.L. Aggregate Stability and Microbial Community Dynamics under Drying-Wetting Cycles in a Silt Loam Soil. Soil Biol. Biochem. 2006, 38, 2053–2062. [Google Scholar] [CrossRef]
  34. Jin, X.; An, T.; Gall, A.R.; Li, S.; Filley, T.; Wang, J. Enhanced Conversion of Newly-Added Maize Straw to Soil Microbial Biomass C under Plastic Film Mulching and Organic Manure Management. Geoderma 2018, 313, 154–162. [Google Scholar] [CrossRef]
  35. Xu, X.; An, T.; Zhang, J.; Sun, Z.; Schaeffer, S.; Wang, J. Transformation and Stabilization of Straw Residue Carbon in Soil Affected by Soil Types, Maize Straw Addition and Fertilized Levels of Soil. Geoderma 2019, 337, 622–629. [Google Scholar] [CrossRef]
  36. Guan, S.; Dou, S.; Chen, G.; Wang, G.; Zhuang, J. Isotopic Characterization of Sequestration and Transformation of Plant Residue Carbon in Relation to Soil Aggregation Dynamics. Appl. Soil Ecol. 2015, 96, 18–24. [Google Scholar] [CrossRef]
  37. Bravo-Garza, M.R.; Voroney, P.; Bryan, R.B. Particulate Organic Matter in Water Stable Aggregates Formed after the Addition of (14)C-Labeled Maize Residues and Wetting and Drying Cycles in Vertisols. Soil Biol. Biochem. 2010, 42, 953–959. [Google Scholar] [CrossRef]
  38. Six, J.; Bossuyt, H.; Degryze, S.; Denef, K. A History of Research on the Link between (Micro)Aggregates, Soil Biota, and Soil Organic Matter Dynamics. Soil Tillage Res. 2004, 79, 7–31. [Google Scholar] [CrossRef]
  39. Zhao, J.; Chen, S.; Hu, R.; Li, Y. Aggregate Stability and Size Distribution of Red Soils under Different Land Uses Integrally Regulated by Soil Organic Matter, and Iron and Aluminum Oxides. Soil Tillage Res. 2017, 167, 73–79. [Google Scholar] [CrossRef]
  40. Oliveira, M.; Barre, P.; Trindade, H.; Virto, I. Different Efficiencies of Grain Legumes in Crop Rotations to Improve Soil Aggregation and Organic Carbon in the Short-Term in a Sandy Cambisol. Soil Tillage Res. 2019, 186, 23–35. [Google Scholar] [CrossRef]
  41. Zhao, H.; Ning, P.; Chen, Y.; Liu, J.; Ghaffar, S.A.; Xiaohong, T.; Shi, J. Effect of Straw Amendment Modes on Soil Organic Carbon, Nitrogen Sequestration and Crop Yield on the North-Central Plain of China. Soil Use Manag. 2019, 35, 511–525. [Google Scholar] [CrossRef]
  42. Bearden, B.N.; Petersen, L. Influence of Arbuscular Mycorrhizal Fungi on Soil Structure and Aggregate Stability of a Vertisol. Plant Soil 2000, 218, 173–183. [Google Scholar] [CrossRef]
  43. Gosling, P.; Parsons, N.; Bending, G.D. What Are the Primary Factors Controlling the Light Fraction and Particulate Soil Organic Matter Content of Agricultural Soils? Biol. Fertil. Soils 2013, 49, 1001–1014. [Google Scholar] [CrossRef]
  44. Du, Z.-L.; Zhao, J.-K.; Wang, Y.-D.; Zhang, Q.-Z. Biochar Addition Drives Soil Aggregation and Carbon Sequestration in Aggregate Fractions from an Intensive Agricultural System. J. Soils Sediments 2017, 17, 581–589. [Google Scholar] [CrossRef]
  45. Lehmann, J.; Kleber, M. The Contentious Nature of Soil Organic Matter. Nature 2015, 528, 60–68. [Google Scholar] [CrossRef] [PubMed]
  46. Bandyopadhyay, P.K.; Saha, S.; Mani, P.K.; Mandal, B. Effect of Organic Inputs on Aggregate Associated Organic Carbon Concentration under Long-Term Rice–Wheat Cropping System. Geoderma 2010, 154, 379–386. [Google Scholar] [CrossRef]
  47. Caesar-TonThat, T.; Sainju, U.M.; Wright, S.F.; Shelver, W.L.; Kolberg, R.L.; West, M. Long-Term Tillage and Cropping Effects on Microbiological Properties Associated with Aggregation in a Semi-Arid Soil. Biol. Fertil. Soils 2011, 47, 157–165. [Google Scholar] [CrossRef]
  48. Gao, Y.; Song, X.; Liu, K.; Li, T.; Zheng, W.; Wang, Y.; Liu, Z.; Zhang, M.; Chen, Q.; Li, Z.; et al. Mixture of Controlled-Release and Conventional Urea Fertilizer Application Changed Soil Aggregate Stability, Humic Acid Molecular Composition, and Maize Nitrogen Uptake. Sci. Total Environ. 2021, 789, 147778. [Google Scholar] [CrossRef]
  49. Shenzhong, T.; Yu, W.; Yufeng, Z.; Wenfan, B.; Liang, D.; Jiafa, L.; Honghai, G. Residue Returning with Subsoiling Replacing Rotary Tillage Improving Aggregate and Associated Carbon. Trans. Chin. Soc. Agric. Eng. 2017, 33, 133–140. [Google Scholar]
  50. Hsiao-Tieh, H.; Corey, L.; Matthew, W.; John, B.; Katharine, M. A Molecular Investigation of Soil Organic Carbon Composition across a Subalpine Catchment. Soil Syst. 2018, 2, 6. [Google Scholar] [CrossRef]
  51. Kubar, K.A.; Huang, L.; Xue, B.; Li, X.; Lu, J. Straw Management Stabilizes the Chemical Composition of Soil Organic Carbon (SOC): The Relationship with Aggregate-associated C in a Rice-rape Cropping System. Land Degrad. Dev. 2021, 32, 851–866. [Google Scholar] [CrossRef]
  52. Dhillon, G.S.; Gillespie, A.; Peak, D.; Van Rees, K.C.J. Spectroscopic Investigation of Soil Organic Matter Composition for Shelterbelt Agroforestry Systems. Geoderma 2017, 298, 1–13. [Google Scholar] [CrossRef]
  53. Xue, B.; Huang, L.; Huang, Y.; Kubar, K.A.; Lu, J. Straw Management Influences the Stabilization of Organic Carbon by Fe (Oxyhydr)Oxides in Soil Aggregates. Geoderma 2019, 358, 113987. [Google Scholar] [CrossRef]
  54. Chung, H.; Ngo, K.J.; Plante, A.; Six, J. Evidence for Carbon Saturation in a Highly Structured and Organic-Matter-Rich Soil. Soil Sci. Soc. Am. J. 2010, 74, 130–138. [Google Scholar] [CrossRef]
  55. De Gryze, S.; Six, J.; Brits, C.; Merckx, R. A Quantification of Short-Term Macroaggregate Dynamics: Influences of Wheat Residue Input and Texture. Soil Biol. Biochem. 2005, 37, 55–66. [Google Scholar] [CrossRef]
Figure 1. Brief flow diagram of RSD.
Agronomy 14 00179 g001
Figure 2. Effects of RSDs on soil aggregate properties in the form of straw combined with chemical fertiliser (a,b) and different organic matter C/N ratios (c,d). Note: CK denotes the absence of straw treatment; RSD indicates the inclusion of additional straw treatment; RSD + NP signifies the application of straw combined with fertilizer treatment. RSD1 involves adding straw to the field at a rate of 1 times the normal amount, while RSD2 entails incorporating twice the standard amount of straw. In the figures, uppercase letters denote the significance of differences between various aggregate particle sizes within the same treatment (p < 0.05), whereas lowercase letters indicate the significance between different treatments for the same grain size (p < 0.05). The same below.
Agronomy 14 00179 g002
Figure 3. Effects of RSDs on the distribution of SOC in different aggregates in the form of straw combined with chemical fertiliser (a,b) and different organic matter C/N ratios (c,d).Note: CK denotes the absence of straw treatment; RSD indicates the inclusion of additional straw treatment; RSD + NP signifies the application of straw combined with fertilizer treatment. RSD1 involves adding straw to the field at a rate of 1 times the normal amount, while RSD2 entails incorporating twice the standard amount of straw. In the figures, uppercase letters denote the significance of differences between various aggregate particle sizes within the same treatment (p < 0.05), whereas lowercase letters indicate the significance between different treatments for the same grain size (p < 0.05).
Agronomy 14 00179 g003
Figure 4. Correlation between bulk SOC and contribution of SOC in aggregates in the form of straw combined with chemical fertiliser (ad) and different organic matter C/N ratios (eh). Note: The blue dots represent the dependent variable SOC; the red lines represent the fitting image of the independent variable x; the pink bands represent the 95% confidence bands; and the lilac bands represent the 95% prediction bands.
Agronomy 14 00179 g004
Figure 5. Fourier transform infrared spectroscopy of soil aggregates under straw combined with chemical fertiliser (ad) and different organic matter C/N ratios application (eh).
Agronomy 14 00179 g005
Figure 6. Functional groups of soil aggregates under straw combined with chemical fertiliser (ad) and different organic matter C/N ratios (eh).Note: lowercase letters indicate the significance between different treatments for the same grain size (p < 0.05).
Agronomy 14 00179 g006
Figure 7. Characteristics of aliphatic carbon and aromatic carbon in aggregates under straw combined with chemical fertiliser (a,b) and different organic matter C/N ratios (c,d).Note:In the figures, uppercase letters denote the significance of differences between various aggregate particle sizes within the same treatment (p < 0.05), whereas lowercase letters indicate the significance between different treatments for the same grain size (p < 0.05). The same below.
Agronomy 14 00179 g007
Figure 8. Principal component analysis of soil aggregates under straw combined with chemical fertiliser (a,b) and different organic matter C/N ratios (c,d). Percentage content of soil aggregates (P1−P4: >2 mm, 0.5−2mm, 0.053−0.25 mm, <0.053 mm), soil carbon content (C1−C4: >2 mm, 0.25−2 mm, 0.053−0.25 mm, <0.053 mm), and SOC (SOCsum). H1−H4 represent alcohol hydroxyl groups and organic acids in >2 mm, 0.25−2 mm, 0.053−0.25 mm, and <0.053 mm aggregates; Al1−Al4 represent aliphatic carbons in >2 mm, 0.25−2 mm, 0.053−0.25 mm, and <0.053 mm aggregates. Ar1−Ar4 represent aromatic carbon in aggregates >2 mm, 0.25−2 mm, 0.053−0.25 mm, and <0.053 mm, respectively.
Agronomy 14 00179 g008
Table 1. Basic physical and chemical properties of tested materials.
MaterialsTC
(%)
TN
(g/kg)
TP
(g/kg)
TK
(g/kg)
SOC
(g/kg)
DOC
(mg/kg)
MBC
(mg/kg)
NO3-N
(mg/kg)
NH4+-N
(mg/kg)
pHEC
(us/cm)
C/N
Soil1.591.10.7820.18.62119.40161.2444.197.278.48367.6714.5
Wheat straw41.17.45.229.3-------55.5
Kiwifruit branches56.55.110.216.2-------110.8
TC: total carbon; TN: total nitrogen; TP: total phosphorus; TK: total potassium; SOC: soil organic carbon; DOC: dissolved organic carbon; MBC: microbial biomass carbon; EC: electrical conductivity.
Disclaimer/Publisher’s Note: The statements, opinions and data contained in all publications are solely those of the individual author(s) and contributor(s) and not of MDPI and/or the editor(s). MDPI and/or the editor(s) disclaim responsibility for any injury to people or property resulting from any ideas, methods, instructions or products referred to in the content.

