Article

Agronomic and Physiological Performance of the Indica Rice Varieties Differing in Tolerance to Low Phosphorus

1
Jiangsu Key Laboratory of Crop Genetics and Physiology/Jiangsu Key Laboratory of Crop Cultivation and Physiology/Agricultural College, Yangzhou University, Yangzhou 225009, China
2
Jiangsu Co-Innovation Center for Modern Production Technology of Grain Crops, Yangzhou University, Yangzhou 225009, China
3
Department of Biology, Hong Kong Baptist University, Hong Kong 999077, China
4
State Key Laboratory of Agrobiotechnology, Chinese University of Hong Kong, Hong Kong 999077, China
*
Author to whom correspondence should be addressed.
Agronomy 2024, 14(1), 41; https://doi.org/10.3390/agronomy14010041
Submission received: 9 November 2023 / Revised: 17 December 2023 / Accepted: 20 December 2023 / Published: 22 December 2023

Abstract

:
Phosphorus (P) deficiency and low P use efficiency (PUE) are limiting factors in rice (Oryza sativa L.) production. Understanding the agronomic and physiological traits of P-tolerant rice varieties is crucial for improving PUE. However, the agronomic and physiological traits of rice varieties differing in tolerance to low P have not been fully studied or comprehensively explored. Two varieties with strong tolerance to low P (STVs, low P tolerance index > 0.9) and two with weak tolerance to Low P (WTVs, low P tolerance index < 0.5) were grown hydroponically with normal P level (NP, 8.02 mg L−1) and low P level (LP, 0.401 mg L−1) in year 2020 and 2021. Results showed that, compared with NP, the LP significantly decreased grain yield, but enhanced P translocation efficiency (PTE), internal P use efficiency (IPE), and P harvest index (PHI) in all the varieties. The STVs showed better performance than the WTVs. Specifically, the STVs exhibited a 131.33% higher grain yield, 15.95% higher PTE, 41.6% higher IPE, and 8.84% higher PHI compared to the WTVs. The STVs also exhibited superior shoot traits, including increased productive tillers, leaf area index (LAI), leaf photosynthetic rate, shoot biomass, contents of indole-3-acetic acid (IAA) and zeatin (Z) and zeatin riboside (ZR) in leaves, non-structural carbohydrates (NSC) remobilization during grain filling, and content of NSC per spikelet, when compared to the WTVs under the LP treatment. Additionally, the STVs demonstrated better root traits, such as higher root biomass, root oxidative activity (ROA), root acid phosphatase (RAP) activity, and greater root IAA and Z + ZR contents. These shoot and root traits exhibited highly positive correlations with grain yield, PTE, and IPE. In conclusion, the STVs maintain higher grain yield and PUE under the LP treatment, due mainly to their improved root and shoot agronomic and physiological traits, which provide valuable references for selecting for P-efficient rice varieties.

1. Introduction

Chemical fertilizers play a pivotal role in bolstering food production. However, the conflict between the excessive fertilizer input and the environment protection has intensified. The persistent emphasis on augmenting food production through heightened fertilizer inputs has triggered a swift and sustained surge in fertilizer consumption [1,2,3]. Phosphorus (P) is an essential nutrient in plant growth and development. Its deficiency has become a critical factor constraining crop growth, development, and yield performance [4,5]. To fulfill the escalating food requirements of an expanding global population, there has been a consistent rise in phosphate fertilizer consumption. At present, the worldwide annual demand for phosphate fertilizer has soared to 500 million tonnes. It is projected that from the current period until 2030, the application of phosphate fertilizer will experience an annual increase averaging about 200 million tonnes [6,7]. Moreover, P constitutes one of the essential trio of nutrients, serving critical physiological and biochemical functions in crops [8,9]. Globally, around 43% of arable land is P-deficient, and nearly two-thirds of China’s cultivated soil suffers from P insufficiency [10]. There are reports showing that 70% to 90% of inorganic P in soil binds as organic or inorganic complexes with metal cations, precipitating as insoluble compounds adhering to soil particles. This process hampers P use efficiency (PUE) of for crops [9,11,12]. Consequently, P deficiency stands as a key constraint to heightening crop productivity. Enhancing the uptake and utilization of available P in soil for crops is a pressing challenge in current agricultural practices, which has profound implications for ensuring food security, embracing sustainable and eco-friendly agriculture, and fostering sustainable development.
In rice production, the primary approach to enhance crop P uptake is by increasing the application of phosphorus fertilizer or altering the method of P fertilizer application [13]. While applying P fertilizer can temporarily address the P deficiency in crops, it is not the most ideal solution from a long-term perspective. It is reported that enhancing the diversity of soil microorganisms constitutes a critical approach to increase soil available phosphorus. These microorganisms are capable of secreting various compounds that promote the dissolution of insoluble phosphorus compounds in the soil [14,15]. For instance, earlier work has shown that Bacillus could increase the content of soil available P by secreting organic acids to dissolve phosphate in soil rhizosphere [16,17]. Subsequent studies demonstrate that the functions of plant rhizosphere microbes are intricately regulated by their root system [18]. In other words, a superior root performance can recruit beneficial microorganisms, leading to enhanced nutrient uptake through a synergistic coordination between roots and rhizosphere microbes. Notably, plant root performance is strongly linked to shoot activity, as numerous studies have shown a close relationship between the root and shoot that influences their developments [19]. Briefly, identifying and selecting excellent plant traits is a crucial strategy in P uptake and utilization.
Indica rice is widely cultivated in southern China, and approximately 60% of the total rice production in this country comes from indica rice [20]. However, excessive P input is a prominent problem, leading to a low PUE and environmental pollution. In response to this challenge, agronomists consider the adoption of P-efficient indica rice varieties as an important strategy to reduce P input, improve grain yield, and promote environmental sustainability [21,22]. Given that root and shoot traits directly or indirectly drive the release of soil available P content, it is therefore that substantial attention should be directed toward unraveling the relationship between PUE and plant traits in indica rice, particularly under the limited P conditions.
There are reports showing that substantial variations exist in P uptake and utilization among rice genotypes [23,24,25]. These observations underscore a significant potential for augmenting PUE in rice by adoption of P-efficient varieties. In general, methods such as hydroponic culture, soil culture, and sand culture are used for the preliminary screening of genotypes with high PUE [26,27]. However, previous studies focused mainly on the seedling stage to select the rice genotypes with high PUE under various P treatments. However, few studies were carried out to investigate the effect of P treatments during the whole growing season on grain yield formation and its underlying mechanism [26,27,28]. It is suggested that rice varieties that exhibit better yield performance under low P condition, i.e., strong tolerance to low P, could serve as a significant evaluation indicator for screening P-efficient varieties. Although some plant traits related to P-efficient rice varieties have been elucidated in previous studies, the coverage is not yet comprehensive, especially concerning plant hormones [21,28]. For example, there are reports showing that elevated auxin content in roots under low P conditions can uptake more P in soil by shaping the root morphology [29,30]. Furthermore, other observations suggest that elevated cytokinins levels in roots enhance both root and shoot activities, thereby improving the adaptability of rice plants under low P conditions [31,32]. Therefore, elucidating changes in hormones in response to low P conditions can serve as a robust complement to understanding the plant traits of rice varieties with strong tolerance to low P.
The purpose of this study was to investigate the agronomic and physiological performances of indica rice varieties with varying tolerance to low P. We examined changes in shoot and root morphological and physiological traits throughout the rice growth season, including shoot biomass, leaf area index, photosynthetic rate, root dry weight, root oxidation activity, and hormonal contents in roots and leaves. Furthermore, we determined their correlations with grain yield and PUE. Such a study would provide valuable insights and a theoretical basis for the selection and breeding of P-efficient rice varieties.

2. Materials and Methods

2.1. Plant Materials and Growing Conditions

A hydroponic study was conducted at Yangzhou University research farm in Jiangsu, China (32°30′ N, 119°25′ E) throughout the rice growing season from May to October in 2020 and was repeated in 2021. We selected 12 representative indica rice varieties widely cultivated in Jiangsu Province over the past 80 years, all of which could normally ripen in Yangzhou. The rice varieties information is listed in Table S1. Based on the low P tolerance index [LPTI, (grain yield of a variety under LP/grain yield of a variety under NP) × grain yield of a variety under LP]/mean grain yield of all tested varieties under LP), all tested varieties were classified into two categories: strong tolerance to low P varieties (STVs, the LPTI > 0.9) and weak tolerance to low P varieties (WTVs, the LPTI < 0.5). In this study, the STVs of IIyou 084 (IIY 084) and Yangdao 2 (Y2) and the WTVs of Huangguaxian (HGX) and IR24 were selected for hydroponic cultivation. We adopted the hydroponic culture method described by Mae and Ohira et al. [33] (Table S2). On May 12 of both years, seedlings were planted on the seedbed, and we selected three-leaf seedlings with consistent growth to transplant into the concrete tank on June 8. Two seedlings were planted per hill, with a hill spacing of 20 cm × 16 cm. Each tank had a volume of 6.4 m3 (8.0 m in length, 2.0 m in width, and 0.4 m in height).

2.2. Experimental Design

Two P treatments were set: the normal P content (NP, control) and low P content (LP, 1/20 P content of the NP), where the significant differences among rice varieties were observed under the condition of 1/20 normal P in our early studies. The concentrations for NP and LP were 8.02 mg L−1 and 0.401 mg L−1, respectively. Other nutrient formulations were the same in both LP and NP. Phosphorus and potassium supply were controlled using H3PO4 and KCl. The nutrient solution was continuously circulated using a pump to ensure proper ventilation in the concrete tank and uniform nutrient absorption by rice. The solution was changed every 7 days. Daily adjustments to maintain a pH of 5.0 were made by adding H2SO4 or NaOH. In case of rain, the nutrient solution was changed the next day. The plot size was 16.0 m2 with three replications for each P treatment.

2.3. Sampling and Measurement

2.3.1. Tiller Number, Leaf Area, and Shoot Biomass

The number of tillers per 10 hills in each treatment was recorded every 7 days from mid-tilling onwards. Plant samples were collected at growth stages of middle tillering (MT), panicle initiation (PI), heading (HD), and maturity (MA) for the measurement of leaf area and plant dry matter. Leaf area was measured immediately after separation from the stem following the method outlined by Zhang et al. [34]. In each plot, plants from five hills were taken and divided into leaves, stems (including culms and sheaths), panicles (only at HD and MA), and roots. Plant dry matter weight was determined by drying rice tissues, including roots, stems, leaves, and panicles (at HD and MA only), in an oven at 75 °C until a constant weight was achieved.

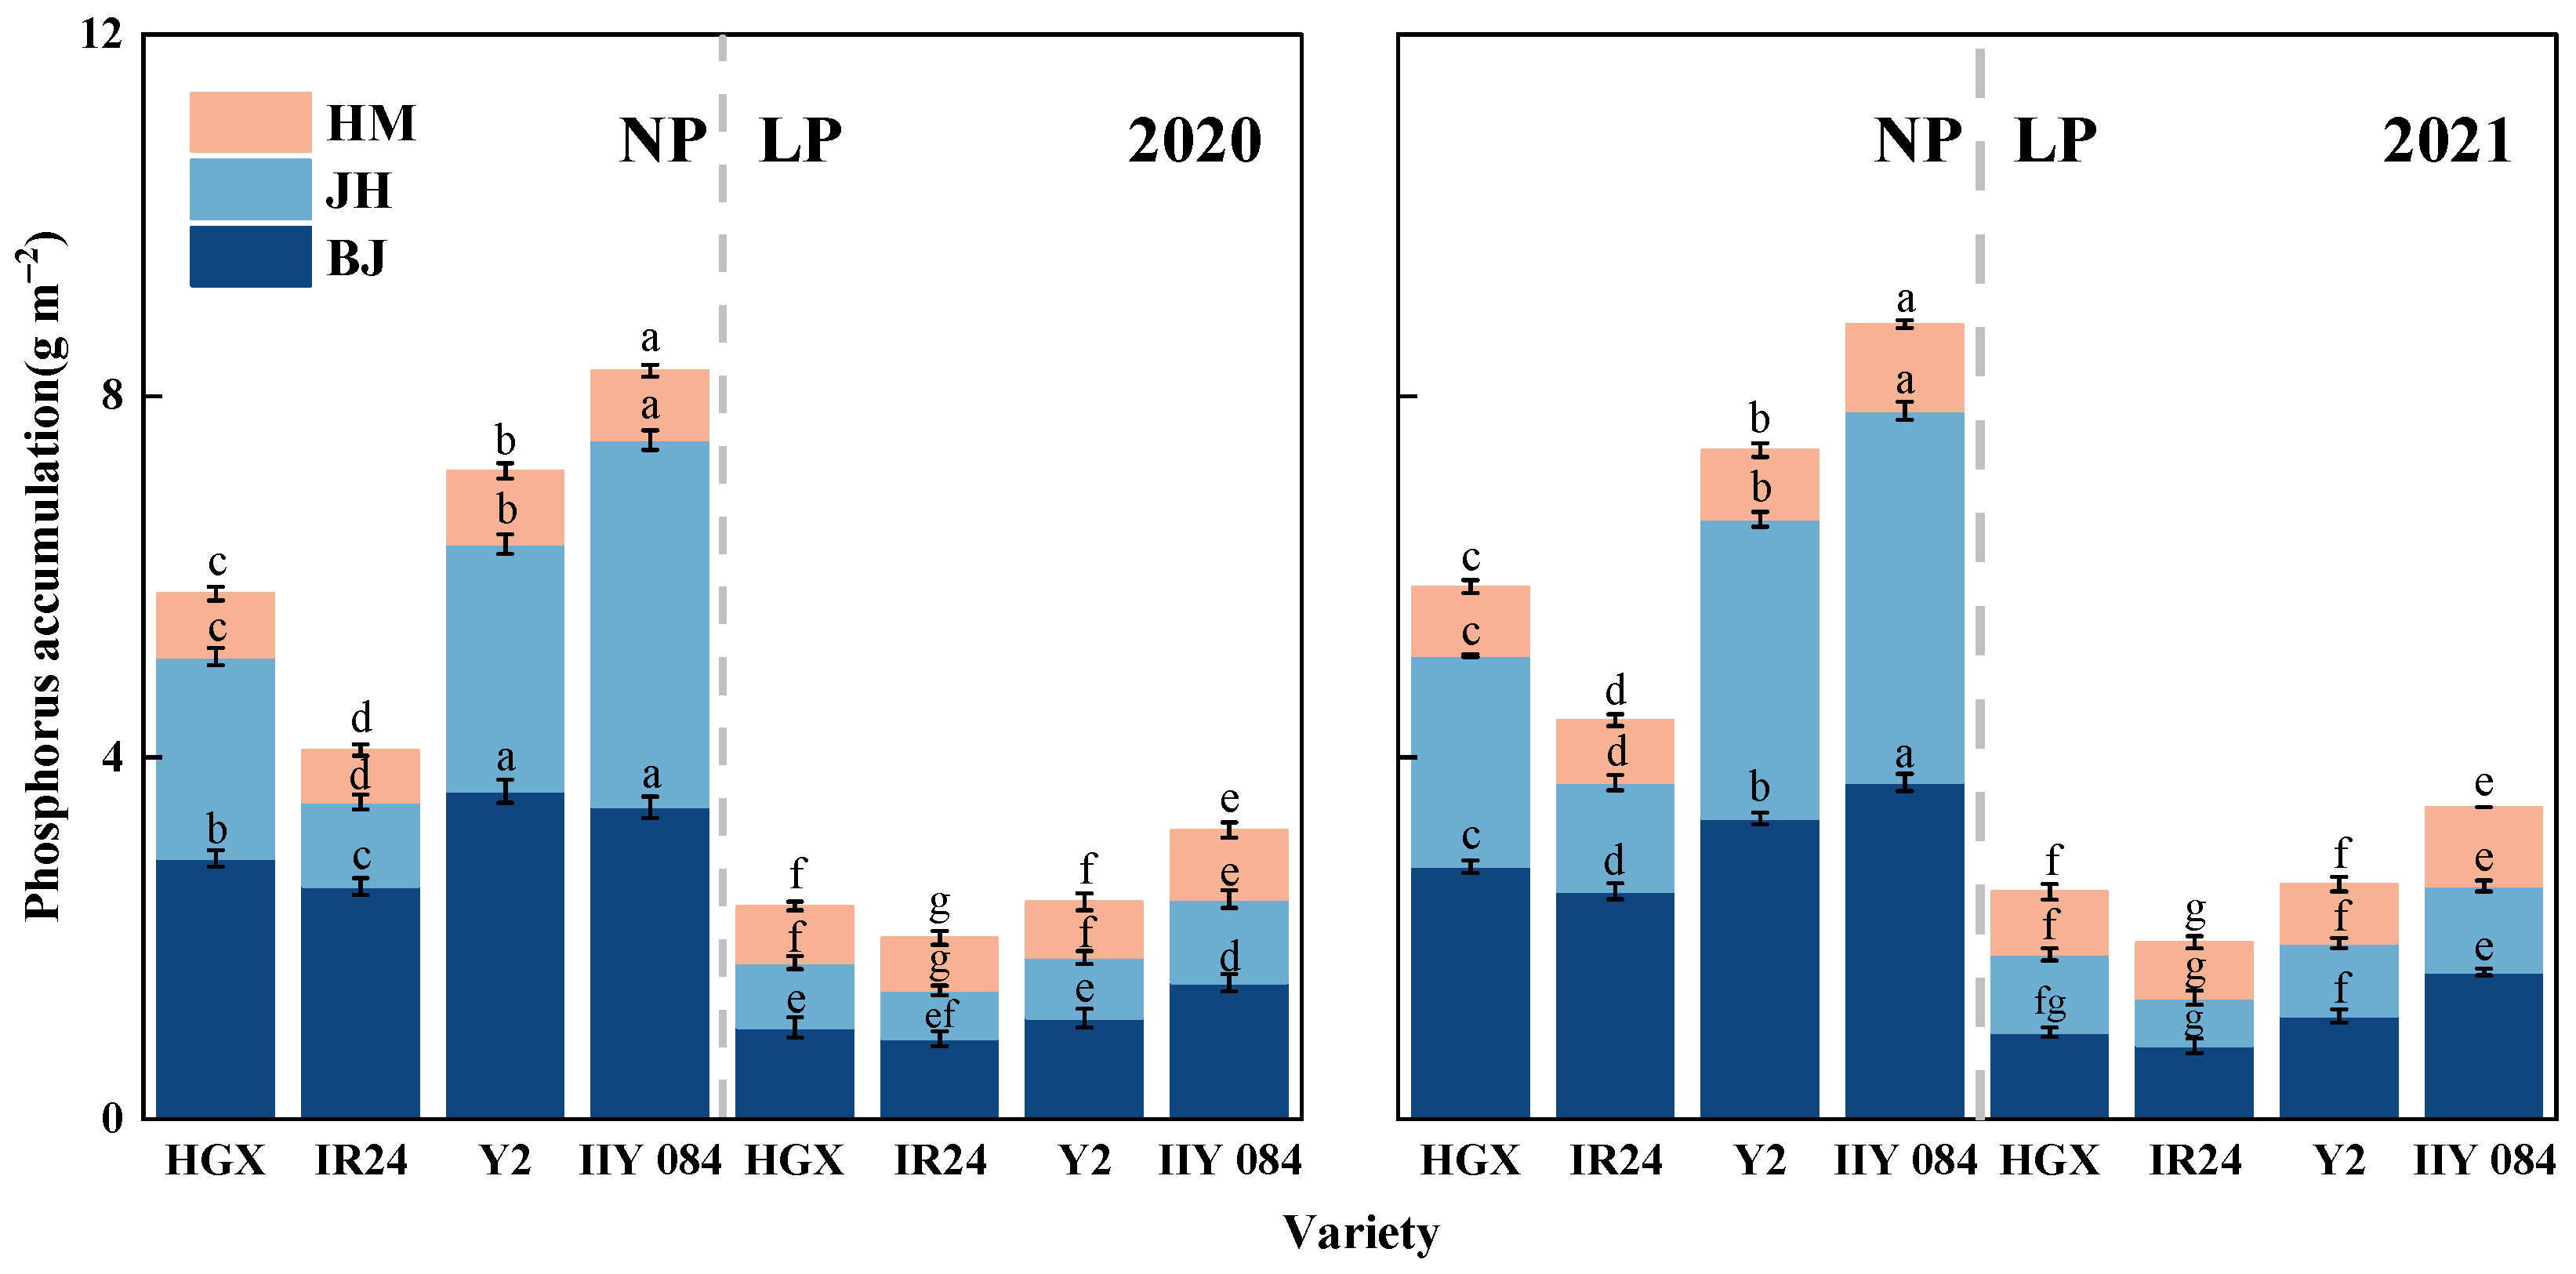
2.3.2. Phosphorus Content and Non-Structural Carbohydrate Remobilization

The dried samples of rice plant organs were used to determine both P and non-structural carbohydrates (NSC) content. The measurement of P accumulation was using the method described by Deng et al. [21]. The NSC content in the stem (including culms and sheaths) at the heading time and maturity was determined using the method of anthrone proposed by Yoshida et al. [35]. The subsequent formulas were employed to calculate phosphorus translocation efficiency (PTE), internal phosphorus use efficiency (IPE) and phosphorus harvest index (PHI), NSC remobilization, and NSC contribution to the grain.
P T E % = P h P m P m × 100
P H I % = P g P t m × 100
IPE   ( kg   kg 1 ) = G y P t m × 100
NSC remobilization (%) = (NSC in the stem at HD − NSC in the stem at maturity)/NSC in the stem at heading × 100
NSC contribution to the grain (%) = (NSC in the stem at heading − NSC in the stems at maturity)/grain yield
where Ph and Pm are stems, sheath, and leaf phosphorus content (kg m−2) at the heading and maturity, respectively, and Gy, Pg and Ptm represent grain yield (g m−2), P accumulation in the grain, and P accumulation in the above-ground tissues at maturity (g m−2), respectively.

2.3.3. Leaf Photosynthetic Rate

The measurement of leaf photosynthesis was conducted at four the growth stages: middle tillering, panicle initiation, heading, and maturity using a gas exchange analyzer (Li-Cor 6800, LI-COR, Lincoln, NE, USA) on a sunny morning between 9:00 and 11:00 when photosynthetic active radiation above the canopy was 1300 to 1500 μmol m−2 s−1. The canopy photosynthetic rate was defined as the CO2 efflux rate (μmol m−2 s−1). Ten leaves were measured at each measurement time for each treatment.

2.3.4. Root Traits and Phytohormones

Plants of three hills were randomly selected from each plot to measure root oxidation activity (ROA), root acid phosphatase (RAP) activity, and the content of indole-3-acetic acid (IAA), and zeatin (Z) and zeatin riboside (ZR) at middle tillering, panicle initiation, heading, and maturity. Rice roots were thoroughly rinsed, and sections from each root sample were used to assess ROA, following the alpha-naphthylamine (α-NA) method described by Ramasamy et al. [36]. For RAP activity determination, fresh root tissue was pulverized with liquid nitrogen to create a fine powder. A 0.1 g sample was mixed with 8 mL extraction buffer (0.2 mol L−1 sodium acetate buffer, pH 5.8) and homogenized. The resulting homogenate underwent centrifugation at 4 °C for 20 min at a speed of 12,000× g, and the supernatant was collected. Enzyme activity analysis was performed on the supernatant using an assay kit (Cominbio Biotechnology Co., Ltd., Suzhou, China), following the provided instructions. The quantification of IAA and Z + ZR in roots and leaves was determined using high-performance liquid chromatography-mass spectrometry (HPLC-MS), as described by Pan et al. [37].

2.3.5. Final Harvest

In both years, the assessment of grain yield and its components were conducted on 15−17 October. A sample size of 10 randomly selected plants (excluding border plants) from each plot was used to determine the number of panicles per square meter, percentage of filled grains, and grain weight. All plants (except border plants) from a 3 m2 area selected in each plot were used to determine grain yield, which was subsequently adjusted for a moisture content of 14%.

2.4. Statistical Analysis

The statistical analysis package SAS/STAT (version 9.2; SAS Institute, Cary, NC, USA) was used for conducting the analysis of variance. Plots were made using Origin software (version 2021; OriginLab, Northampton, MA, USA). Means were tested by least significant difference at p < 0.05 (LSD 0.05). In our statistical analysis, we employed the Tukey test to determine the LSD. The statistical model included factors such as year, variety, P treatment, and the interactions of year × variety, year × P treatment, and variety × P treatment to explain sources of variation. The Pearson correlation was calculated and graphed using R package in version 4.1.1: “https://cran.r-project.org (accessed on 9 October 2023)”.

3. Results

3.1. Grain Yield and PUE

Compared with the NP, the LP resulted in significant decreases in the number of total spikelets and grain yield of both types of rice varieties. The STVs (Y2 and IIY 084) exhibited higher grain yield compared to the WTVs (HGX and IR24) under LP (Table 1). The decrease in grain yield of the STVs was smaller under the LP compared to that of the WTVs, due mainly to a greater number of total spikelets and a higher percentage of filled grains for the STVs. On average, grain yield, the number of total spikelets and the percentage of filled grains were 131.33%, 79.46%, and 14.11%, respectively, more or higher for the STVs than for the WTVs (Table 1).
Similar to grain yield, the STVs exhibited higher P accumulation (PA) compared to the WTVs under LP (Figure 1). The more P accumulation for the STVs was due mainly to stronger P uptake before jointing. Additionally, the STVs demonstrated not only greater total P uptake but also higher P translocation efficiency (PTE), internal phosphorus use efficiency (IPE), and a higher phosphorus harvest index (PHI). These values were 15.95%, 41.6%, and 8.84%, respectively, higher in the STVs than in the WTVs (Table 2).

3.2. Non-Structural Carbohydrates (NSC) Remobilization

The NSC remobilization and NSC contribution to the grain were significantly reduced by LP compared to NP, whereas an adverse result was observed in NSC per spikelet (Table 3). The NSC accumulation was more in the STVs than in the WTVs at heading and maturity. The NSC remobilization, NSC contribution to the grain, and NSC per spikelet were significantly higher in the STVs than in the WTVs under LP, which were 35.94%, 22.24%, and 51.60%, respectively, higher in the STVs than in the WTVs, on average (Table 3).

3.3. Tiller Number, Leaf Area Index, and Leaf Photosynthetic Rate

The tiller number was higher in the STVs than in the WTVs at the main growth stage. A similar result was observed for the percentage of productive stems and tillers (PPST) (Table 4).
Compared with those under NP, the leaf photosynthetic rate and leaf area index of two types of rice varieties were significantly reduced under LP (Figure 2). The leaf photosynthetic rate and leaf area index were 42.41% and 84.22%, respectively, greater in the STVs than in the WTVs (Figure 2).

3.4. Shoot and Root Dry Weight

Compared with NP, LP significantly decreased straw (leaf + stem) dry matter weight at heading and maturity in both types of rice varieties. The STVs exhibited higher straw dry matter weight at heading and maturity, respectively, compared to the WTVs at the two P treatments. Moreover, the matter translocation efficiency from heading to maturity was greater in the STVs than in the WTVs, particularly at the LP treatment (Table 5).
The shoot dry weight and root dry weight were significant higher in the STVs than in the WTVs under LP, which were 106.00% and 53.14% higher in the STVs than in the WTVs, on average (Figure 3A–D). A gradual decline in the root-shoot ratio was observed from middle tillering to maturity for both types of varieties. The root-shoot ratio of the STVs was 39.75% lower than that of the WTVs under LP (Figure 3E,F).

3.5. Root Oxidative Activity and Root Acid Phosphatase Activity

At each growth stage, LP exhibited a significant decrease in root oxidative activity and an increase in root acid phosphatase activity compared to NP (Figure 4). The root oxidative activity and acid phosphatase activity were significantly higher for the STVs than for the WTVs under LP, which were 21.02% and 69.14% higher for the former than for the latter, on average (Figure 4).

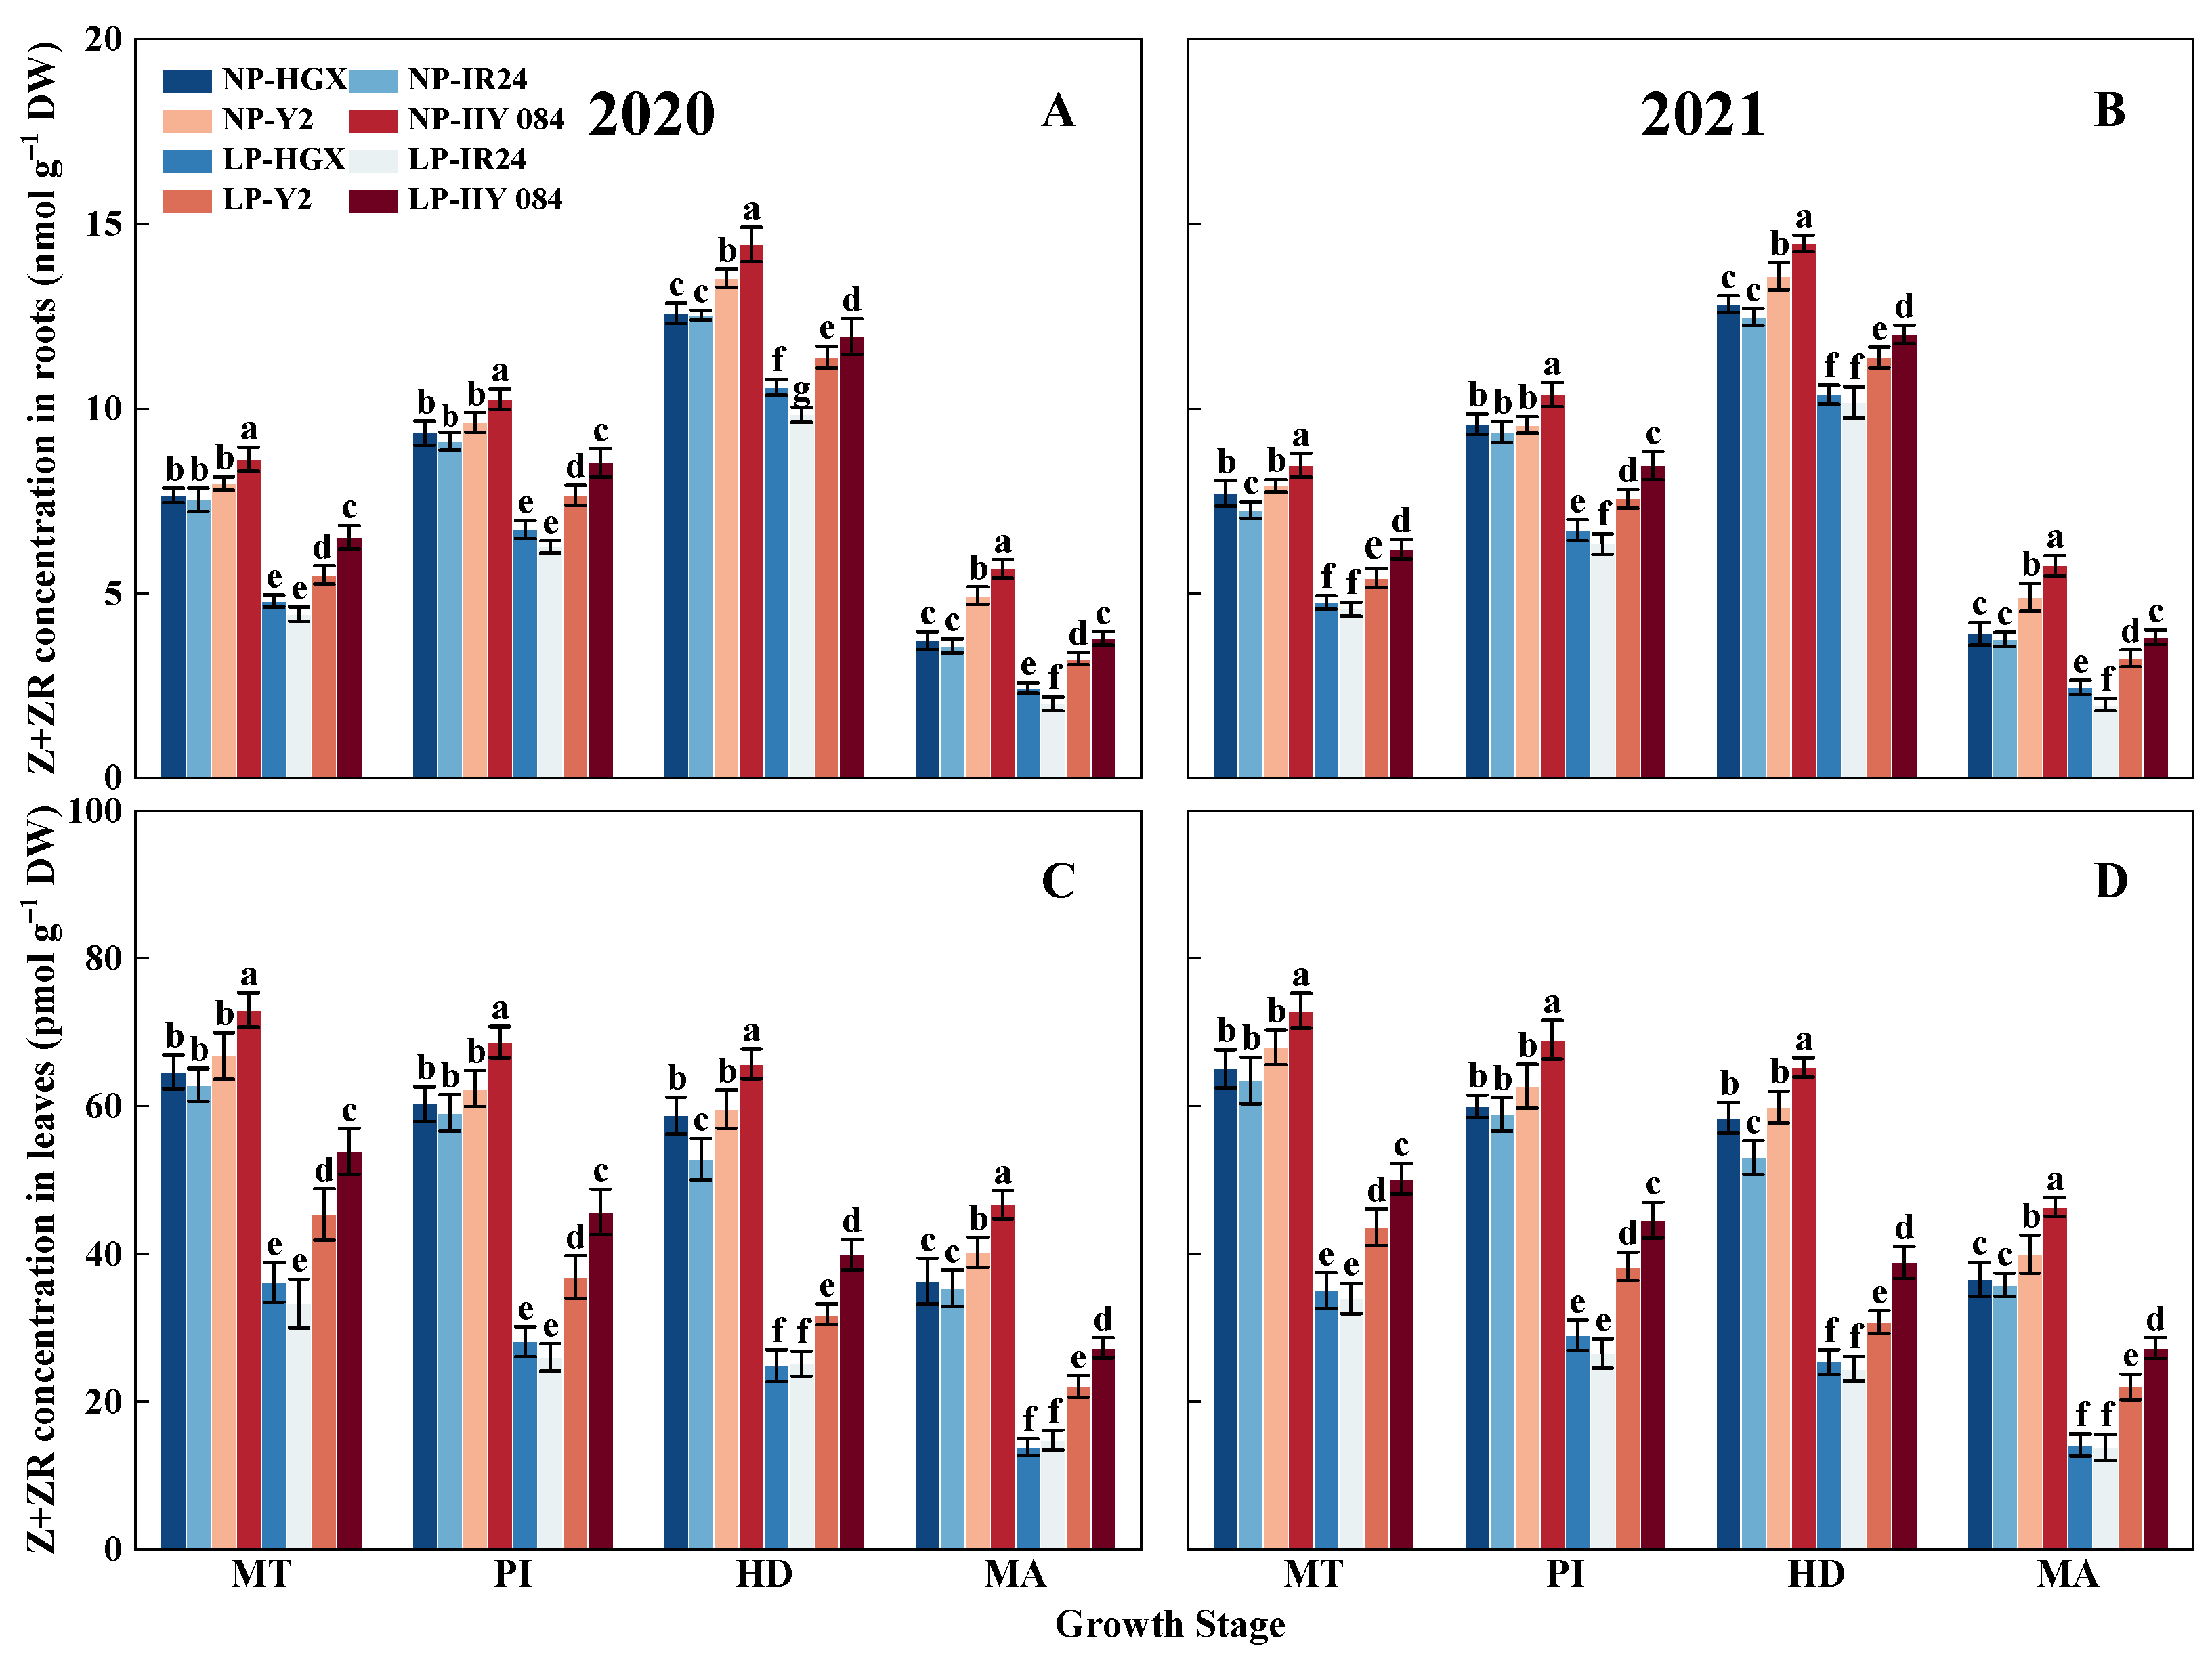
3.6. Indole-3-Acetic Acid and Zeatin + Zeatin Riboside Contents in Roots and Leaves

Indole-3-acetic acid (IAA) content in roots and leaves decreased gradually from mid-tillering to maturity. Compared with NP, LP significantly reduced IAA content in leaves and roots for the WTVs and IAA content in leaves for the STVs, whereas it markedly increased IAA content in roots for the STVs (Figure 5). The contents of IAA in roots and leaves were higher in the STVs than in the WTVs at the same growth stage. The IAA contents in roots and leaves were 52.54% and 19.86% higher in the STVs than in the WTVs, on average (Figure 5).
As shown in Figure 6, the zeatin + zeatin riboside (Z + ZR) contents in roots exhibited a gradual increase from mid-tillering to heading, and it was subsequently decreased at maturity, whereas Z + ZR contents in leaves decreased gradually from mid-tillering to maturity (Figure 6). Compared to NP, LP significantly reduced Z + ZR contents in both roots and leaves. The STVs exhibited higher leaf and root Z + ZR contents in relative to the WTVs at the same growth stage (Figure 6).

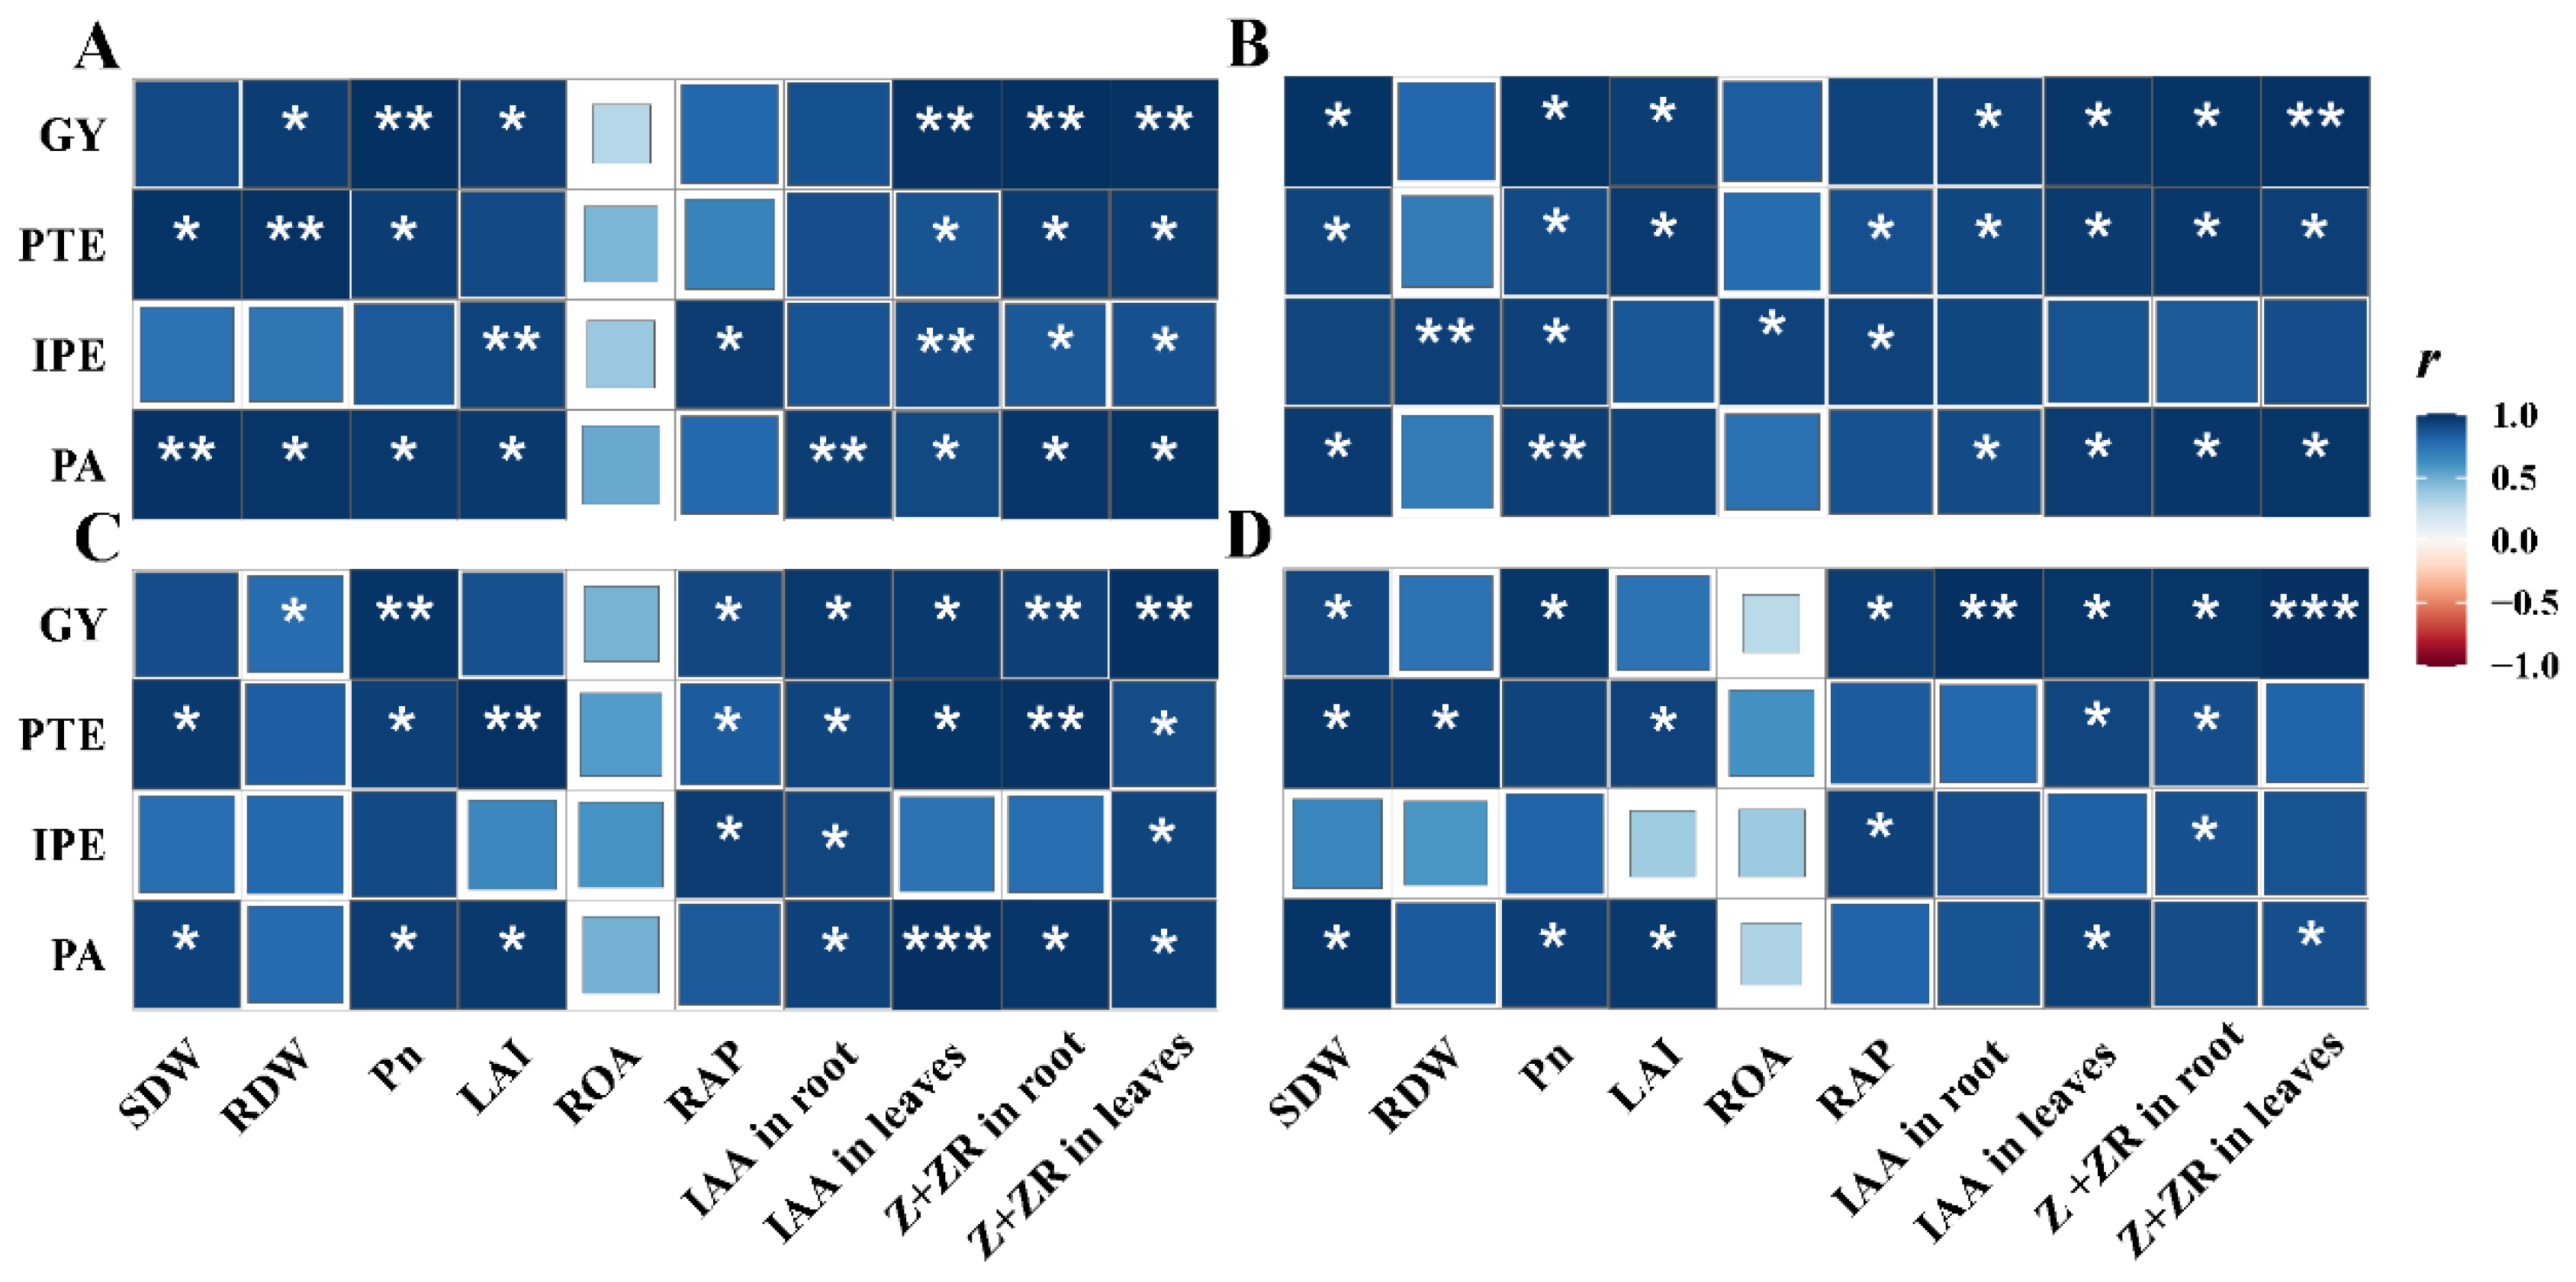
3.7. Correlations of Rice Morphological and Physiological Traits with PUE

The shoot dry weight, leaf photosynthetic rate, leaf index area, the contents of IAA and Z + ZR in leaves at mid-tillering significantly or very significantly and positively correlated with phosphorus translocation efficiency (PTE), internal phosphorus use efficiency (IPE) and phosphorus accumulation (PA). Root traits, including root dry weight, ROA, RAP activity, root IAA and Z + ZR contents at mid-tillering, also significantly or very significantly and positively correlated with phosphorus translocation efficiency, internal phosphorus use efficiency and phosphorus accumulation (Figure 7A). Similar results were obtained at panicle initiation, heading, maturity and these plant traits were significantly correlated with phosphorus translocation efficiency, internal phosphorus use efficiency and phosphorus accumulation (Figure 7B–D).

4. Discussion

Prior to this study, little information is known about agronomic and physiological performances in indica rice varieties differing in tolerance to LP. In the present study, we observed that the STVs showed superior grain yield compared to the WTVs, which was primarily attributed to their less reduction in the total number of spikelets under LP treatment (Table 1). In addition, LP significantly decreased the grain yield in both types of varieties compared to NP (Table 1). Although the percentage of filled grains and grain weight improved under LP, they could not compensate for the decrease in the total number of spikelets. Notably, the STVs exhibited a smaller reduction in grain yield than the WTVs under LP, indicating that the STVs showed better stability in responses to LP.
Phosphorus (P) uptake efficiency and utilization efficiency are two key traits conferring the efficient use of P in crops [38,39]. Our results in this study showed that the STVs exhibited greater P accumulation at maturity compared to the WTVs (Figure 1). Such difference could be attributed to their P accumulation at the middle and early growth stages, especially during the period from tillering to jointing. It is believed that greater PTE after heading is highly associated with IPE [23]. In this study, the STVs demonstrated a greater PTE after heading, leading to a higher IPE compared to the WTVs (Table 2). These results indicate that the STVs can obtain a synergistic improvement in P uptake and utilization, especially under the LP condition. Therefore, we argue that adopting the STVs is an effective approach to achieve the dual goals of higher yield and PUE under limited P application. Furthermore, we observed a significant increase in PTE for all varieties under LP in 2021 compared to 2020. This may be due to the higher matter translocation efficiency resulting from the larger sink size in 2021 (Table 1 and Table 5). It is reported that rice varieties with larger sink can facilitate the remobilization of nutrients and photo-assimilates from vegetative organs to grains [4]. Hence, a larger sink size, particularly evident in the STVs under LP, can serves as a crucial indicator for achieving higher PTE.
In addition, significant interactions were observed between varieties, treatments, and years, particularly the varieties × P treatments, regarding the grain yield, PTE, and IPE (Table 1 and Table 2). This result indicates that the differences in these values among the varieties are significantly magnified by P treatments. A reasonable explanation is attributed to the better stability in the STVs in response to low P stress compared to the WTVs. In summary, the STVs could maintain superior plant traits, such as root morphology and shoot activity, to mitigate the negative effects caused by LP. These observations also suggest that the adoption of the STVs provides better resilience against externally induced stressors.
It is proposed that the morpho-physiological changes of roots and shoots account for the differences of grain yield and PUE in response to low P stress [40,41,42,43]. However, little is known about the mechanism underlying the high grain yield and high PUE of the STVs, particularly under the LP treatment. Herein, we summarized several potential explanations. Firstly, compared with the WTVs, the STVs possessed higher leaf IAA and Z + ZR contents (Figure 2C,D). Recent studies have demonstrated that an increased IAA content can decrease the inclination of the flag leaf and expand its width [44]. Moreover, higher Z + ZR content can facilitate the more nitrogen remobilized to the upper parts. This process can optimize the canopy structure and leaf N distribution for photosynthetic production, as evidenced by larger leaf area index (LAI) and greater photosynthetic rate in the STVs. [45,46,47]. These results, in turn, resulted in elevated shoot dry weight, particularly at jointing stage, thus providing more photo-assimilates for the formation of large sink size in the STVs (Figure 3A,B). Secondly, the STVs exhibited superior root traits compared to the WTVs, including higher root dry weight, greater ROA, enhanced RAP activity and higher root IAA and Z + ZR contents (Figure 3C,D, Figure 4 and Figure 5). Previous studies have shown that higher root IAA and Z + ZR contents in rice during early and late growth stages have a distinct advantage in sink size formation and grain filling, respectively, through producing more photo-assimilates and increasing endosperm cell proliferation [48,49,50,51]. Hence, we speculate that the superiority in IAA and Z + ZR levels is the important physiological basis for greater sink size and filled grains in the STVs. Moreover, elevated levels of root IAA and Z + ZR are widely reported to significantly enhance root architecture and activity, along with higher RAP activity, providing both quantitative and qualitative improvements to the roots of the STVs [29,30,31]. This situation is beneficial to maximize the root capability to uptake P, leading to more P accumulation for shoot development [52,53,54]. Thirdly, there was higher NSC per spikelet at the heading and greater NSC remobilization during grain filling in the STVs than in the WTVs (Table 3). It is generally believed that rice varieties with higher NSC per spikelet is conducive for spikelets to derive the photo-assimilates stored in vegetative organs, facilitating the NSC remobilization during grain filling [55,56]. Furthermore, there are reports also showing that NSC remobilization is very positively correlated with HI, further contributing to the plant internal P utilization efficiency [25]. Therefore, we conclude that more NSC per spikelet and greater NSC remobilization can serve as the important indicators for achieving increased filled-grain percentage, greater nutrient remobilization including P, and higher HI, thus generating improved IPE in the STVs under LP. Additionally, these above-mentioned traits were highly correlated with grain yield and PUE, which can be served as important indicators for selecting P-efficient varieties in rice production.
It should be noted that, under low P stress, the STVs may exert substantial long-term benefits on soil P cycling and its bioavailability. In this study, we observed that the STVs had higher root oxidation activity and acid phosphatase activity under LP. It is hypothesized that changes in these root physiological traits contribute to P solubilization, mineralization, and desorption by influencing rhizosphere microbes. This process can effectively optimize the distribution of phosphorus in the soil, especially the available P status [57,58]. On the other hand, due to the superior performance in P uptake and utilization, the adoption of the STVs can reduce the need for P fertilizer input, contributing to the improvement in soil properties [59]. Consequently, this situation enhances the soil capability to retain P or other nutrients. Therefore, the adoption of the STVs bears considerable scientific and practical significance in enhancing phosphorus availability in low-phosphorus soils and fortifying the sustainability of agricultural ecosystems.

5. Conclusions

In both types of rice varieties, LP significantly reduced grain yield and increased PUE (e.g., PTE and IPE) compared to NP. The reduction in grain yield was smaller in the STVs than in the WTVs. A higher grain yield and improved PUE for the STVs were attributed mainly to the improvement in shoot and root morpho-physiological traits, including photosynthetic rate, productive tillers, LAI, NSC remobilization, root biomass, ROA, and RAP activity, and the contents of IAA and Z + ZR in roots and leaves. These improved agronomic and physiological performances in the STVs can be served as the references for selecting strong tolerance to LP or P-efficient varieties in rice production.

Supplementary Materials

The following supporting information can be downloaded at: https://www.mdpi.com/article/10.3390/agronomy14010041/s1, Table S1: Tested cultivars in the study; Table S2: Hydroponic culture method.

Author Contributions

Conceptualization, W.Z., J.G., K.Z., Z.W., J.Z. and J.Y.; validation, S.Q.; investigation, Y.X. and D.J.; data curation, Z.S.; investigation and writing—original draft preparation, Z.S.; writing—review and editing, Z.W., K.Z. and J.Y.; supervision, J.Z. and J.Y.; project administration, J.Y.; funding acquisition, K.Z., J.Z. and J.Y. All authors have read and agreed to the published version of the manuscript.

Funding

This research was funded by the National Natural Science Foundation of China (32272198; 32071943), and the Priority Academic Program Development of Jiangsu Higher Education Institutions (PAPD).

Institutional Review Board Statement

Not applicable.

Informed Consent Statement

Not applicable.

Data Availability Statement

The data presented in this study are available upon request from the corresponding author.

Conflicts of Interest

The authors declare no conflict of interest.

Abbreviations

BJ: before-jointing; HD: heading; HI: harvest index; HM: heading-maturity; IAA: indole-3-acetic acid; IPE: internal phosphorus use efficiency; JH: jointing-heading; LAI: leaf area index; LP: low phosphorus level; MA: maturity; MT: mid-tillering; NP: normal phosphorus level; NSC: non-structural carbohydrates; PA: phosphorus accumulation; PHI: phosphorus harvest index; PI: panicle initiation; Pn: Leaf photosynthetic rate; PPST: percentage of productive stems and tillers; PTE: phosphorus translocation efficiency; PUE: phosphorus utilization efficiency; RAP: root acid phosphatase; RDW: root dry weight; ROA: root oxidation activity; SDW: shoot dry weight; STVs: varieties with strong tolerance to low phosphorus; WTVs: varieties with weak tolerance to low phosphorus; Z + ZR: zeatin and zeatin riboside.

References

  1. Nkebiwe, P.M.; Weinmann, M.; Bar-Tal, A.; Müller, T. Fertilizer placement to improve crop nutrient acquisition and yield: A review and meta-analysis. Field Crops Res. 2016, 196, 389–401. [Google Scholar] [CrossRef]
  2. Melia, P.M.; Cundy, A.B.; Sohi, S.P.; Hooda, P.S.; Busquets, R. Trends in the recovery of phosphorus in bioavailable forms from wastewater. Chemosphere 2017, 186, 381–395. [Google Scholar] [CrossRef] [PubMed]
  3. Qaswar, M.; Chai, R.; Ahmed, W.; Jing, H.; Han, T.; Liu, K.; Ye, X.; Xu, Y.; Anthonio, C.K.; Zhang, H. Partial substitution of chemical fertilizers with organic amendments increased rice yield by changing phosphorus fractions and improving phosphatase activities in fluvo-aquic soil. J. Soils Sediment. 2020, 20, 1285–1296. [Google Scholar] [CrossRef]
  4. Prathap, V.; Suresh, K.; Tyagi, A. Comparative proteome analysis of phosphorus-responsive genotypes reveals the proteins differentially expressed under phosphorous starvation stress in rice. Int. J. Biol. Macromol. 2023, 234, 123760. [Google Scholar] [CrossRef] [PubMed]
  5. Rinasoa, S.; Rakotoson, T.; Rabeharisoa, L.; Tsujimoto, Y.; Nishigaki, T. Farmyard manure application increases lowland rice yield in phosphorus-deficient soils, but not in soils with high pH and phosphorus-fixing capacity. Field Crop. Res. 2023, 296, 108906. [Google Scholar] [CrossRef]
  6. Heuer, S.; Gaxiola, R.; Schilling, R.; Herrera-Estrella, L.; López-Arredondo, D.; Wissuwa, M.; Rouached, H. Improving phosphorus use efficiency: A complex trait with emerging opportunities. Plant J. 2017, 90, 868–885. [Google Scholar] [CrossRef] [PubMed]
  7. Hallama, M.; Pekrun, C.; Lambers, H.; Kandeler, E. Hidden miners: The roles of cover crops and soil microorganisms in phosphorus cycling through agroecosystems. Plant Soil 2019, 434, 7–45. [Google Scholar] [CrossRef]
  8. Kumar, S.; Pallavi; Chugh, C.; Seem, K.; Kumar, S.; Vinod, K.K.; Mohapatra, T. Characterization of contrasting rice (Oryza sativa L.) genotypes reveals the Pi-efficient schema for phosphate starvation tolerance. BMC Plant Biol. 2021, 21, 282. [Google Scholar] [CrossRef]
  9. Song, T.; Das, D.; Hu, Q.; Yang, F.; Zhang, J. Alternate wetting and drying irrigation and phosphorus rates affect grain yield and quality and heavy metal accumulation in rice. Sci. Total Environ. 2021, 752, 141–862. [Google Scholar] [CrossRef]
  10. Zhang, B.; Wang, Y.; Liu, H.; Yang, X.; Yuan, P.; Wang, C.; Shi, L. Optimal phosphorus management strategies to enhance crop productivity and soil phosphorus fertility in rapeseed–rice rotation. Chemosphere 2023, 337, 139392. [Google Scholar] [CrossRef]
  11. Prathap, V.; Kumar, S.; Meena, N.L.; Maheshwari, C.; Dalal, M.; Tyagi, A. Phosphorus Starvation Tolerance in Rice Through Combined Physiological, Biochemical, and Proteome Analyses. Rice Sci. 2023, 30, 613–631. [Google Scholar] [CrossRef]
  12. Song, T.; Xu, F.; Yuan, W.; Chen, M.; Hu, Q.; Tian, Y.; Xu, W. Combining alternate wetting and drying irrigation with reduced phosphorus fertilizer application reduces water use and promotes phosphorus use efficiency without yield loss in rice plants. Agr. Water Manag. 2019, 223, 105–686. [Google Scholar] [CrossRef]
  13. Wu, P.; Shou, H.; Xu, G.; Lian, X. Improvement of phosphorus efficiency in rice on the basis of understanding phosphate signaling and homeostasis. Curr. Opin. Plant Biol. 2013, 16, 205–212. [Google Scholar] [CrossRef] [PubMed]
  14. Lu, J.L.; Jia, P.; Feng, S.W.; Wang, Y.T.; Zheng, J.; Ou, S.N.; Li, J.T. Remarkable effects of microbial factors on soil phosphorus bioavailability: A country-scale study. Global Chang. Biol. 2022, 28, 4459–4471. [Google Scholar] [CrossRef] [PubMed]
  15. Hu, X.; Gu, H.; Liu, J.; Wei, D.; Zhu, P.; Cui, X.A.; Wang, G. Metagenomic strategies uncover the soil bioavailable phosphorus improved by organic fertilization in Mollisols. Agr. Ecosyst. Environ. 2023, 349, 108462. [Google Scholar] [CrossRef]
  16. Jiang, Y.; Wang, W.; Xie, Q.; Liu, N.A.; Liu, L.; Wang, D.; Wang, E. Plants transfer lipids to sustain colonization by mutualistic mycorrhizal and parasitic fungi. Science 2017, 356, 1172–1175. [Google Scholar] [CrossRef]
  17. Zhang, S.; Guo, X.; Yun, W.; Xia, Y.; You, Z.; Rillig, M.C. Arbuscular mycorrhiza contributes to the control of phosphorus loss in paddy fields. Plant Soil 2020, 447, 623–636. [Google Scholar] [CrossRef]
  18. de Vries, F.T.; Griffiths, R.I.; Knight, C.G.; Nicolitch, O.; Williams, A. Harnessing rhizosphere microbiomes for drought-resilient crop production. Science 2020, 368, 270–274. [Google Scholar] [CrossRef]
  19. Hou, S.; Thiergart, T.; Vannier, N.; Mesny, F.; Ziegler, J.; Pickel, B.; Hacquard, S. A microbiota–root–shoot circuit favours Arabidopsis growth over defence under suboptimal light. Nat. Plants 2021, 7, 1078–1092. [Google Scholar] [CrossRef]
  20. Feng, F.; Li, Y.; Qin, X.; Liao, Y.; Siddique, K.H. Changes in rice grain quality of indica and japonica type varieties released in China from 2000 to 2014. Front. Plant Sci. 2017, 8, 1863. [Google Scholar] [CrossRef]
  21. Deng, Y.; Qiao, S.; Wang, W.; Zhang, W.; Gu, J.; Liu, L.; Zhang, H.; Wang, Z.; Yang, J. Tolerance to low phosphorus was enhanced by an alternate wetting and drying regime in rice. Food Energy Secur. 2021, 10, e294. [Google Scholar] [CrossRef]
  22. Zhang, Y.; Zhang, W.; Wu, M.; Liu, G.; Zhang, Z.; Yang, J. Effects of irrigation schedules and phosphorus fertilizer rates on grain yield and quality of upland rice and paddy rice. Environ. Exp. Bot. 2021, 186, 104465. [Google Scholar] [CrossRef]
  23. Dissanayaka, D.M.S.B.; Plaxton, W.C.; Lambers, H.; Siebers, M.; Marambe, B.; Wasaki, J. Molecular mechanisms underpinning phosphorus-use efficiency in rice. Plant Cell Environ. 2018, 41, 1483–1496. [Google Scholar] [CrossRef] [PubMed]
  24. Vellaikumar, S.; Malarvizhi, P. Phosphorus use efficiency of selected rice varieties. Trends Biochem. Sci. 2017, 10, 6662–6677. [Google Scholar]
  25. Rose, T.J.; Mori, A.; Julia, C.C.; Wissuwa, M. Screening for internal phosphorus utilization efficiency: Comparison of genotypes at equal shoot P content is critical. Plant Soil 2016, 401, 79–91. [Google Scholar] [CrossRef]
  26. Kumar, S.; Seem, K.; Kumar, S.; Vinod, K.K.; Chinnusamy, V.; Mohapatra, T. Pup1 QTL regulates gene expression through epigenetic modification of DNA under phosphate starvation stress in rice. Front. Plant Sci. 2022, 13, 871890. [Google Scholar] [CrossRef] [PubMed]
  27. Guo, M.; Ruan, W.; Li, C.; Huang, F.; Zeng, M.; Liu, Y.; Yu, Y.; Ding, X.; Wu, Y.; Mo, X. Integrative comparison of the role of the PHOSPHATE RESPONSE1 subfamily in phosphate signaling and homeostasis in rice. Plant Physiol. 2015, 168, 1762–1776. [Google Scholar] [CrossRef] [PubMed]
  28. Deng, Y.; Men, C.; Qiao, S.; Wang, W.; Gu, J.; Liu, L.; Zhang, Z.; Zhang, H.; Wang, Z.; Yang, J. Tolerance to low phosphorus in rice varieties is conferred by regulation of root growth. Crop J. 2022, 8, 534–547. [Google Scholar] [CrossRef]
  29. Lv, B.; Wei, K.; Hu, K.; Tian, T.; Zhang, F.; Yu, Z.; Ding, Z. MPK14-mediated auxin signaling controls lateral root development via ERF13-regulated very-long-chain fatty acid biosynthesis. Mol. Plant. 2021, 14, 285–297. [Google Scholar] [CrossRef]
  30. Hasan, M.M.; Hasan, M.M.; Teixeira da Silva, J.A.; Li, X. Regulation of phosphorus uptake and utilization: Transitioning from current knowledge to practical strategies. Cell Mol. Biol. Lett. 2016, 21, 1–19. [Google Scholar] [CrossRef]
  31. Zulfiqar, A.; Azhar, B.; Aroosa, Z.; Zeenat, A.; Aman, S. Screening of rice varieties based on remodeling of root architecture linked to enhanced phosphorus transporters and ethylene signaling for better phosphorous acquisition under limiting conditions. Sains Malays. 2021, 50, 1621–1638. [Google Scholar] [CrossRef]
  32. Yan, H.; Wang, Y.; Chen, B.; Wang, W.; Sun, H.; Sun, H.; Zhao, Q. OsCKX2 regulates phosphate deficiency tolerance by modulating cytokinin in rice. Plant Sci. 2022, 319, 111257. [Google Scholar] [CrossRef] [PubMed]
  33. Mae, T.; Ohira, K. The remobilization of nitrogen related to leaf growth and senescence in rice plants (Oryza sativa L.). Plant Cell Physiol. 1981, 22, 1067–1074. [Google Scholar]
  34. Zhang, W.; Yu, J.; Xu, Y.; Wang, Z.; Liu, L.; Zhang, H.; Gu, J.; Zhang, J.; Yang, J. Alternate wetting and drying irrigation combined with the proportion of polymer-coated urea and conventional urea rates increases grain yield, water and nitrogen use efficiencies in rice. Field Crop. Res. 2021, 268, 108165. [Google Scholar] [CrossRef]
  35. Yoshida, S.; Forna, D.; Cock, J.; Gomez, K. Laboratory manual for physiological studies of rice. Int. Rice Res. Ins. 1976, 23, 61–66. [Google Scholar]
  36. Ramasamy, S.; Ten Berge, H.F.M.; Purushothaman, S. Yield formation in rice in response to drainage and nitrogen application. Field Crop. Res. 1997, 51, 65–82. [Google Scholar] [CrossRef]
  37. Pan, X.; Welti, R.; Wang, X. Quantitative analysis of major plant hormones in crude plant extracts by high-performance liquid chromatography-mass spectrometry. Nat. Protoc. 2010, 5, 986–992. [Google Scholar] [CrossRef]
  38. Elke, V.; Terry, R.; Kazuki, S.; Kwanho, J.; Matthias, W. Integration of P acquisition efficiency, P utilization efficiency and low grain P concentrations into P-efficient rice genotypes for specific target environments. Nutr. Cycl. Agroecosys. 2016, 104, 413–427. [Google Scholar]
  39. Wang, K.; Cui, K.; Liu, G.; Luo, X.N.; Huang, J. Low straw phosphorus concentration is beneficial for high phosphorus use efficiency for grain production in rice recombinant inbred lines. Field Crop. Res. 2017, 203, 65–73. [Google Scholar] [CrossRef]
  40. Irfan, M.; Aziz, T.; Maqsood, M.A.; Bilal, H.M.; Siddique, K.H.; Xu, M. Phosphorus (P) use efficiency in rice is linked to tissue-specific biomass and P allocation patterns. Sci. Rep. 2020, 10, 4278. [Google Scholar] [CrossRef]
  41. Vejchasarn, P.; Lynch, J.P.; Brown, K.M. Genetic variability in phosphorus responses of rice root phenotypes. Rice 2016, 9, 29. [Google Scholar] [CrossRef] [PubMed]
  42. Dordas, C. Dry matter, nitrogen and phosphorus accumulation, partitioning and remobilization as affected by N and P fertilization and source-sink relations. Eur. J. Agron. 2009, 30, 129–139. [Google Scholar] [CrossRef]
  43. Verbeeck, M.; Houben, E.; De Bauw, P.; Rakotoson, T.; Merckx, R.; Smolders, E. Root biomass explains genotypic differences in phosphorus uptake of rainfed rice subjected to water and phosphorus stresses. Plant Soil 2023, 486, 253–271. [Google Scholar] [CrossRef]
  44. Huang, G.; Hu, H.; van de Meene, A.; Zhang, J.; Dong, L.; Zheng, S.; Zhang, D. AUXIN RESPONSE FACTORS 6 and 17 control the flag leaf angle in rice by regulating secondary cell wall biosynthesis of lamina joints. Plant Cell 2021, 33, 3120–3133. [Google Scholar] [CrossRef]
  45. Shah, S.; Cai, L.; Li, X.; Fahad, S.; Wang, D. Influence of cultivation practices on the metabolism of cytokinin and its correlation in rice production. Food Energy Secur. 2023, 12, e488. [Google Scholar] [CrossRef]
  46. Pan, X.; Liu, S.; Li, F.; Li, M. Effect of low phosphorus stress on leaf photosynthesis in the seedlings of different rice cultivars. Act. Agro Sin. 2003, 29, 770–774. (In Chinese) [Google Scholar]
  47. Ruan, W.; Guo, M.; Xu, L.; Wang, X.; Zhao, H.; Wang, J.; Yi, K. An SPX-RLI1 module regulates leaf inclination in response to phosphate availability in rice. Plant Cell 2018, 30, 853–870. [Google Scholar] [CrossRef]
  48. Samejima, H.; Kondo, M.; Ito, O.; Nozoe, T.; Shinano, T.; Osaki, M. Root-shoot interaction as a limiting factor of biomass productivity in new tropical rice lines. Soil. Sci. Plant Nutr. 2004, 50, 545–554. [Google Scholar] [CrossRef]
  49. Huang, R.; Sun, H.; Liu, S.; Song, W.; Liu, Y.; Yu, C.; Mao, Y.; Zhang, Y.; Xu, G. Rice Root Growth and Auxin Concentration in Response to Phosphate Deficiency. Chin. J. Rice Sci. 2012, 26, 563–568. (In Chinese) [Google Scholar]
  50. Ding, Y.; Wang, Z.; Mo, S.; Liu, J.; Xing, Y.; Wang, Y.; Ge, C.; Wang, Y. Mechanism of low phosphorus inducing the main root lengthening of rice. J. Plant Growth Regul. 2021, 40, 1032–1043. [Google Scholar] [CrossRef]
  51. Goncalves, B.X.; Lima-Melo, Y.; dos Santos Maraschin, F.; Margis-Pinheiro, M. Phosphate starvation responses in crop roots: From well-known players to novel candidates. Environ. Exp. Bot. 2020, 178, 104162. [Google Scholar] [CrossRef]
  52. Liu, D. Root developmental responses to phosphorus nutrition. J. Integr. Plant Biol. 2021, 63, 1065–1090. [Google Scholar] [CrossRef] [PubMed]
  53. Wendrich, J.R.; Yang, B.; Vandamme, N.; Verstaen, K.; Smet, W.; Van de Velde, C.; De Rybel, B. Vascular transcription factors guide plant epidermal responses to limiting phosphate conditions. Science 2020, 370, eaay4970. [Google Scholar] [CrossRef] [PubMed]
  54. Lin, D.L.; Yao, H.Y.; Jia, L.H.; Tan, J.F.; Xu, Z.H.; Zheng, W.M.; Xue, H.W. Phospholipase D-derived phosphatidic acid promotes root hair development under phosphorus deficiency by suppressing vacuolar degradation of PIN-FORMED2. New Phytol. 2020, 226, 142–155. [Google Scholar] [CrossRef] [PubMed]
  55. Fu, J.; Huang, Z.; Wang, Z.; Yang, J.; Zhang, J. Pre-anthesis non-structural carbohydrate reserve in the stem enhances the sink strength of inferior spikelets during grain filling of rice. Field Crop. Res. 2011, 123, 170–182. [Google Scholar] [CrossRef]
  56. Katsura, K.; Maeda, S.; Horie, T.; Shiraiwa, T. Analysis of yield attributes and crop physiological traits of Liangyoupeijiu, a hybrid rice recently bred in China. Field Crop. Res. 2007, 103, 170–177. [Google Scholar] [CrossRef]
  57. Wang, L.; Zhang, L.; George, T.S.; Feng, G. A core microbiome in the hyphosphere of arbuscular mycorrhizal fungi has functional significance in organic phosphorus mineralization. New Phytol. 2023, 238, 859–873. [Google Scholar] [CrossRef]
  58. Wang, G.; Jin, Z.; George, T.S.; Feng, G.; Zhang, L. Arbuscular mycorrhizal fungi enhance plant phosphorus uptake through stimulating hyphosphere soil microbiome functional profiles for phosphorus turnover. New Phytol. 2023, 238, 2578–2593. [Google Scholar] [CrossRef]
  59. Bhatta, B.B.; Panda, R.K.; Anandan, A.; Pradhan, N.S.N.; Mahender, A.; Rout, K.K.; Ali, J. Improvement of phosphorus use efficiency in rice by adopting image-based phenotyping and tolerant indices. Front. Plant Sci. 2021, 12, 717107. [Google Scholar] [CrossRef]
Figure 1. Phosphorus accumulation of indica rice varieties differing in tolerance to LP in 2020 and 2021. NP and LP represent the normal P level and the low P level, respectively. HGX and IR24 are rice varieties with weak tolerance to low P, and Y2 and IIY 084 are rice varieties with strong tolerance to low P. BJ, JH, and HM represent before-jointing, jointing-heading, and heading-maturity. Vertical bars represent standard deviation of the mean (n = 3). Different letters above the column during the same growth period are significant at p = 0.05 level.
Agronomy 14 00041 g001
Figure 2. Leaf photosynthetic rate (A,B) and LAI (C,D) of indica rice varieties differing in tolerance to LP in 2020 and 2021. NP and LP represent the normal P level and the low P level, respectively. HGX and IR24 are rice varieties with weak tolerance to low P, and Y2 and IIY 084 are rice varieties with strong tolerance to low P. MT, PI, HD, and MA represent mid-tillering, panicle initiation, heading, and maturity, respectively. Vertical bars represent standard deviation of the mean (n = 3). Different letters above the column at the same growth stage are significant at p = 0.05 level.
Agronomy 14 00041 g002
Figure 3. Shoot dry weight (A,B), root dry weight (C,D), and the ratio of root to shoot (E,F) of indica rice varieties differing in tolerance to LP in 2020 and 2021. NP and LP represent the normal P level and the low P level, respectively. HGX and IR24 are rice varieties with weak tolerance to low P, and Y2 and IIY 084 are rice varieties with strong tolerance to low P. MT, PI, HD, and MA represent mid-tillering, panicle initiation, heading, and maturity, respectively. Vertical bars represent standard deviation of the mean (n = 3). Different letters above the column at the same growth stage are significant at p = 0.05 level.
Agronomy 14 00041 g003
Figure 4. Root oxidation activity (A,B) and root acid phosphatase activity (C,D) of indica rice varieties differing in tolerance to LP in 2020 and 2021. NP and LP represent the normal P level and the low P level, respectively. HGX and IR24 are rice varieties with weak tolerance to low P, and Y2 and IIY 084 are rice varieties with strong tolerance to low P. MT, PI, HD, and MA represent mid-tillering, panicle initiation, heading, and maturity, respectively. Vertical bars represent standard deviation of the mean (n = 3). Different letters above the column at the same growth stage are significant at p = 0.05 level.
Agronomy 14 00041 g004
Figure 5. Indole-3-acetic acid (IAA) content in roots (A,B) and leaves (C,D) of indica rice varieties differing in tolerance to LP in 2020 and 2021. NP and LP represent the normal P level and the low P level, respectively. HGX and IR24 are rice varieties with weak tolerance to low P, and Y2 and IIY 084 are rice varieties with strong tolerance to low P. MT, PI, HD, and MA represent mid-tillering, panicle initiation, heading, and maturity, respectively. Vertical bars represent standard deviation of the mean (n = 3). Different letters above the column at the same growth stage represent significance at p = 0.05 level.
Agronomy 14 00041 g005
Figure 6. Zeatin + zeatin riboside (Z + ZR) contents in roots (A,B) and leaves (C,D) of indica rice varieties differing in tolerance to LP in 2020 and 2021. NP and LP represent the normal P level and the low P level, respectively. HGX and IR24 are rice varieties with weak tolerance to low P, and Y2 and IIY 084 are rice varieties with strong tolerance to low P. MT, PI, HD, and MA represent mid-tillering, panicle initiation, heading, and maturity, respectively. Vertical bars represent standard deviation of the mean (n = 3). Different letters above the column at the same growth stage are significant at p = 0.05 level.
Agronomy 14 00041 g006
Figure 7. Correlation analysis of plant traits with grain yield, internal P use efficiency (IPE), P translocation efficiency (PTE), and P accumulation (PA) at the growth stages of mid-tillering (A), panicle initiation (B), heading (C) and maturity (D). SDW, shoot dry weight; RDW, root dry weight; Pn, leaf photosynthetic rate; LAI, leaf area index; ROA, root oxidation activity; RAP, root acid phosphatase, IAA, indole-3-acetic acid; Z + ZR, zeatin + zeatin riboside; *, significant at p = 0.05 level, **, significant at p = 0.01 level, ***, significant at p = 0.001 level.
Agronomy 14 00041 g007
Table 1. Grain yield and its components of indica rice varieties differing in tolerance to LP in 2020 and 2021.
Year/TreatmentVarietyPanicles per
(m2)
Spikelet per
Panicle
Total Spikelets
(×103 m2)
1000-Grain Weight (g)Filled Grains (%)Grain Yield
(g m−2)
2020
NPHGX310.17 c108.87 d33.77 d24.48 e67.82 d561.69 e
IR24294.98 d113.17 d33.39 d24.08 f59.18 e476.48 f
Y2291.98 d161.57 a47.18 c25.43 c76.75 c921.09 c
IIY 084392.24 a156.86 b61.53 a24.99 d83.13 ab1278.45 a
LPHGX252.89 f95.68 e24.2 e24.96 d70.23 d424.44 fg
IR24254.77 f86.91 f22.15 f24.84 d66.14 d364.05 g
Y2282.78 e121.59 c34.38 d26.46 b79.89 bc726.60 d
IIY 084324.48 b152.37 b49.44 b26.85 a86.68 a1150.66 b
2021
NPHGX313.90 c116.33 d36.5 cd24.95 e70.40 d640.78 e
IR24308.80 c115.03 d35.52 d24.38 g61.50 e524.39 f
Y2303.61 c166.32 a50.51 b25.21 c79.22 c999.41 c
IIY 084393.35 a165.35 a65.03 a25.06 d82.56 b1319.31 a
LPHGX255.46 e99.35 e25.71 e24.65 f72.93 d451.62 g
IR24259.30 e91.02 f23.57 f25.07 d71.40 d410.91 g
Y2288.90 d127.00 c37.87 c26.96 a83.68 b775.02 d
IIY 084329.40 b158.41 b52.16 b26.68 b86.89 a1196.22 b
Analysis of variance
Year (Y)**********
Treatment (T)************
Variety (V)************
Y × TNSNSNSNSNSNS
Y × VNSNSNSNSNSNS
T × V********NS
Y × T × VNSNSNS**NSNS
NP and LP represent the normal P level and the low P level, respectively. HGX and IR24 are rice varieties with weak tolerance to low P, and Y2 and IIY 084 are rice varieties with strong tolerance to low P. Different letters indicate statistical significance at p = 0.05 level within the same column. *, significant at p = 0.05 level. **, significant at p = 0.01 level. NS means not significant at the p = 0.05 level.
Table 2. Phosphorus translocation efficiency (PTE), internal phosphorus use efficiency (IPE), and phosphorus harvest index (PHI) of indica rice varieties differing in tolerance to LP in 2020 and 2021.
Year/TreatmentVarietyPTE (%)IPE (kg kg−1)PHI (%)
2020
NPHGX34.54 d99.40 h39.97 h
IR2428.74 e127.09 g41.02 g
Y241.12 c139.19 f42.16 f
IIY 08440.93 c164.77 e50.54 e
LPHGX45.50 b246.90 d53.47 d
IR2441.27 c306.18 c56.86 c
Y248.00 b360.33 b58.19 b
IIY 08451.12 a403.91 a63.83 a
2021
NPHGX38.21 d110.27 h40.95 f
IR2437.32 d128.52 g40.09 f
Y242.06 c152.18 f43.11 e
IIY 08441.51 c171.90 e46.21 d
LPHGX51.12 b274.38 d55.53 c
IR2442.18 c316.41 c59.00 b
Y252.71 ab411.35 b61.05 a
IIY 08457.08 a445.47 a61.60 a
Analysis of variance
Year (Y)**NS**
Treatment (T)******
Variety (V)******
Y × T***NS
Y × VNS**NS
T × V****NS
Y × T × VNSNS*
NP and LP represent the normal P level and the low P level, respectively. HGX and IR24 are rice varieties with weak tolerance to low P, and Y2 and IIY 084 are rice varieties with strong tolerance to low P. Different letters indicate statistical significance at p = 0.05 level within the same column. *, significant at p = 0.05 level. **, significant at p = 0.01 level. NS means not significant at the p = 0.05 level.
Table 3. Non-Structural Carbohydrates (NSC) remobilization and NSC per spikelet of indica rice varieties differing in tolerance to LP in 2020 and 2021.
Year/TreatmentVarietyNSC at HD (kg·m−2)NSC at MA (kg·m−2)NSC Remobilization (%)NSC Contribution to the Grain (%)NSC per Spikelet (mg Spikelet−1)
2020
NPHGX0.20 e0.17 e18.84 e5.88 e5.76 e
IR240.13 g0.11 g16.16 f4.04 f3.84 g
Y20.39 b0.28 b28.99 c15.03 b8.09 b
IIY 0840.45 a0.29 a34.23 b10.61 c6.94 c
LPHGX0.16 f0.13 f21.85 d8.49 d6.40 d
IR240.10 h0.09 h17.80 e6.26 e4.48 f
Y20.37 d0.24 d34.98 b21.87 a9.27 a
IIY 0840.43 c0.26 c40.16 a15.46 b8.34 b
2021
NPHGX0.19 d0.17 d13.19 f4.59 e5.30 d
IR240.14 f0.12 e13.70 f3.99 e4.00 e
Y20.41 b0.27 a34.10 c16.38 b8.22 b
IIY 0840.42 a0.25 b40.02 ab12.69 c6.65 c
LPHGX0.17 e0.13 e25.16 d9.84 d6.71 c
IR240.13 g0.10 f20.27 e8.40 d5.45 d
Y20.38 c0.24 c37.77 bc23.68 a9.17 a
IIY 0840.41 ab0.23 c44.05 a16.45 b8.03 b
Analysis of variance
Year (Y)NS*****NS
Treatment (T)**********
Variety (V)**********
Y × T****NS
Y × V*****NS*
T × V***NS**NS
Y × T × VNS**NSNS
NP and LP represent the normal P level and the low P level, respectively. HGX and IR24 are rice varieties with weak tolerance to low P, and Y2 and IIY 084 are rice varieties with strong tolerance to low P. Different letters indicate statistical significance at p = 0.05 level within the same column. *, significant at p = 0.05 level. **, significant at p = 0.01 level. NS means not significant at the p = 0.05 level.
Table 4. Number of tillers and the percentage of productive stems and tillers (PPST) of indica rice varieties differing in tolerance to LP in 2020 and 2021.
Year/TreatmentVarietyNumber of Tillers and Main Stems (m−2)PPST(%)
Mid-TilleringPanicle InitiationHeadingMaturity
2020
NPHGX392.13 a525.18 a508.37 a317.05 a68.27 d
IR24345.78 b450.39 b417.20 b310.55 a61.30 e
Y2389.16 a535.45 a508.37 a311.50 a55.99 f
IIY 084333.50 b418.26 c400.16 c312.25 a71.69 c
LPHGX208.96 d386.53 d357.12 d269.87 c83.95 a
IR24163.96 e317.63 e308.81 e272.84 c68.34 d
Y2257.34 c411.21 cd401.00 c295.87 b71.77 c
IIY 084215.49 d322.61 e317.68 e312.12 a81.84 b
2021
NPHGX398.31 a524.74 b508.37 a317.90 b68.50 e
IR24350.20 b451.29 c417.20 b305.69 c62.02 f
Y2386.43 a536.27 a508.37 a306.50 c55.99 g
IIY 084333.81 c416.79 d398.00 c390.00 a71.70 c
LPHGX208.02 e383.13 e357.12 d268.63 e83.88 a
IR24163.45 f316.67 f308.81 e274.45 d69.98 d
Y2254.80 d411.41 d401.00 c297.66 c70.78 cd
IIY 084217.92 e323.29 f315.00 e309.68 c81.25 b
Analysis of variance
Year (Y)NSNSNSNSNS
Treatment (T)**********
Variety (V)**********
Y × TNSNSNSNSNS
Y × VNSNSNSNSNS
T × V**********
Y × T × VNSNSNSNSNS
NP and LP represent the normal P level and the low P level, respectively. HGX and IR24 are rice varieties with weak tolerance to low P, and Y2 and IIY 084 are rice varieties with strong tolerance to low P. Different letters indicate statistical significance at p = 0.05 level within the same column. **, significant at p = 0.01 level. NS means not significant at the p = 0.05 level.
Table 5. Matter accumulation and translocation of indica rice varieties differing in tolerance to LP in 2020 and 2021.
Year/TreatmentVarietyStem + Leaf Dry
Matter at Heading (g/m2)
Stem + Leaf Dry
Matter at Maturity (g/m2)
Dry Matter
Translocation Amount (g/m2)
Dry Matter
Translocation Rate (%)
2020
NPHGX894 d815 d79 e8.85 f
IR24866 e775 e91 e10.5 e
Y21283 a1152 a131 c10.22 ef
IIY 0841222 b1066 b156 b12.76 d
LPHGX717 g601 g116 d16.13 b
IR24617 h528 h89 e14.41 c
Y2817 f654 f163 b19.92 a
IIY 0841037 c839 c198 a19.08 a
2021
NPHGX903 d811 d91 f10.09 e
IR24875 e775 e100 ef11.4 d
Y21284 a1146 a138 d10.73 de
IIY 0841217 b1048 b169 c13.89 c
LPHGX705 g596 g109 e15.47 b
IR24619 h525 h94 f15.19 b
Y2824 f644 f180 b21.82 a
IIY 0841038 c821 c217 a20.93 a
Analysis of variance
Year (Y)NS***
Treatment (T)********
Variety (V)********
Y × TNSNSNSNS
Y × VNSNSNSNS
T × V*******
Y × T × VNSNSNSNS
NP and LP represent the normal P level and the low P level, respectively. HGX and IR24 are rice varieties with weak tolerance to low P, and Y2 and IIY 084 are rice varieties with strong tolerance to low P. Different letters indicate statistical significance at p = 0.05 level within the same column. *, significant at p = 0.05 level. **, significant at p = 0.01 level. NS means not significant at the p = 0.05 level.
Disclaimer/Publisher’s Note: The statements, opinions and data contained in all publications are solely those of the individual author(s) and contributor(s) and not of MDPI and/or the editor(s). MDPI and/or the editor(s) disclaim responsibility for any injury to people or property resulting from any ideas, methods, instructions or products referred to in the content.

