Article

Grape Endophytic Microbial Community Structures and Berry Volatile Components Response to the Variation of Vineyard Sites

by
Ruihua Ren
1,
Maoyu Zeng
1,
Yunqi Liu
2,
Jingjing Shi
1,
Zhuowu Wan
1,
Miaomiao Wang
1,
Shibo Zhang
3,*,
Zhenwen Zhang
1,* and
Qingqing Zeng
1,*
1
College of Enology, Northwest A&F University, No. 22 Xinong Road, Yangling, Xianyang 712100, China
2
Ningxia Xige Estate Co., Ltd., No. 1 Xige Road, Gezi Mountain, Qingtongxia City, Wuzhong 751600, China
3
School of Agriculture, Ningxia University, Yinchuan 750021, China
*
Authors to whom correspondence should be addressed.
Agronomy 2024, 14(10), 2186; https://doi.org/10.3390/agronomy14102186
Submission received: 30 July 2024 / Revised: 6 September 2024 / Accepted: 18 September 2024 / Published: 24 September 2024

Abstract

:
Vitis vinifera L. is a commercially important horticultural plant with abundant microbial resources. However, the impact of grape-associated microbiota on grape quality and flavor has been largely overlooked. We integrated volatomics and microbiomics to explore temporal variations in berry volatiles and microbial diversity of ‘Cabernet Sauvignon’ in Ningxia (NX) and Shanxi (SX), and the correlation between microbial communities and volatiles. A total of 38 and 35 free and bound aroma compounds, respectively, were identified in NX berries and SX berries. For free aroma, these 38 compounds were classified into aldehydes (69%), alcohols (22%), acids (4%), aromatics (4%), terpenes (0.6%), esters (0.37%), and norisoprenoids (0.3%). Similarly, the 35 bound aromas were attributed to aromatics (58%), acids (29%), terpenes (4%), esters (3%), alcohols (2.82%), aldehydes (2.78%), and norisoprenoids (0.4%). Additionally, a total of 616 bacterial genera and 254 fungal genera were detected in all samples from both regions. The results demonstrated that vineyard sites significantly shaped the characteristics of berry volatiles and microbial biogeographic patterns. SX berries exhibited more abundant free aroma and higher microbial diversity than NX berries, with three key taxa (Sphingomonas, Massilia, and Bacillus) identified in the bacterial network. Correlation analysis results highlighted that these key taxa might play an important role in berry-free aroma. This study reveals the crucial role of microbes in shaping grape flavor and uncovers the link between microbial diversity and the regional attributes of grapes and wine.

1. Introduction

Grapes are a highly valued fruit globally, and they can be consumed directly or processed into wine. The volatile aroma compounds in grapes are significant in relation to the olfactory aspects of grapes and wine flavors, and these impact both their quality and consumer preference. Extensive studies have identified numerous volatiles that contribute to the primary aroma profile of grape berries, and these belong to various families, including terpenes, alcohols, aldehydes, acids, esters, aromatics, and norisoprenoids. The inherent volatiles of grapes contribute to the unique “varietal character” of each grape cultivar, which determines the distinctive flavor of the wine [1]. Muscat cultivars are reportedly rich in terpenoids and norisoprenoids, contributing to their floral and fruity aromas. Vitis vinifera and V. amurensis cultivars, known for their leafy “green” aroma, contain significant C6/C9 alcohol and aldehyde proportions among the total grape and wine volatiles. Conversely, V. labrusca (Concord grapes), V. riparia, and M. rotundifolia cultivars are characterized by the presence of esters, which are responsible for their distinct “foxy” odor [2].
Grape berry growth follows a double-sigmoid curve, encompassing fruit set, berry expansion, veraison, and ripening. Τhe biosynthesis of volatiles and other crucial flavor metabolites occurs typically during the veraison stage and gradually increases throughout berry ripening. However, the accumulation of aroma compounds is influenced by several factors, such as cultivar, soil type, region, and viticultural practices. These factors contribute to the concept of “terroir”, shaping the unique aroma profiles of grapes and wines from specific regions [3]. Among these factors, the geographical location of a vineyard is the most significant regarding the expression of “terroir”. Many studies have found significant regional differences in wine volatiles and sensory traits among sub-regions and geographic origins [4]. These differences are associated with regional climates, soil types, and microorganisms. During grape ripening, spatial variations in day and night temperatures reportedly modify the grape maturation and aroma accumulation, resulting in distinct differences among wine-producing regions [5]. In Greece, wines produced in East Attica exhibit higher ester, terpene, and alcohol levels with more intense fruit and floral flavors than those of wines produced in North Attica. The latter have rich mineral and herbaceous aromas primarily due to soil effects [6].
Plant microbiota, comprising primarily bacterial and fungal communities, have recently gained significant attention because of their potential influences on the phenotype, stress resistance, growth promotion, productivity, and quality of crops [7,8]. Numerous studies have shown that the plant microorganism plays key roles in nutrient acquisition and the control of post-harvest diseases in fruits. Furthermore, plant microbiota regulates fruit flavor by influencing secondary metabolites in their hosts, including flavonoids and volatile compounds [9,10]. Nasopoulou et al. (2014) reported that methylotrophic bacteria of endophytes can improve strawberry flavor owing to their ethanol dehydrogenase activity [11]. The composition of fruit-associated bacterial communities, as determined through the cultivation method, correlates with the levels of volatile aroma compounds in tomato and raspberry berries [12,13]. Additionally, introducing an artificial bacterial inoculum caused the release of terpenoid compounds in raspberries [10]. Recent studies have conducted endophyte isolation work, and these isolates demonstrate the important roles of endophytes on the accumulation of plant secondary metabolites. Semwal et al. (2023) isolated 23 plant growth-promoting bacterial endophytes from Gloriosa superba L., and two (NBRI HYL5 and NBRI HYL8) were related to high colchicine levels [14]. Tripathi et al. (2020) isolated Pseudomonas fluorescens from Artemisia annua, and they were found to increase the terpene content [15]. Endophytes living within plant tissues rely on the internal conditions of their hosts and do not cause apparent symptoms that are crucial to symbiotic systems. Previous studies have shown that endophytes contribute to the overall plant composition, and their diversity and abundance are influenced by factors such as plant genotype, developmental stage, agricultural practices, and climate. Recently, several researchers have elucidated the roles of plant endophytes in producing host secondary metabolites [9]. However, the assembly patterns of grape endophytic microbial communities and their impact on berry quality in different geographical regions remain unknown.
In this study, the microbial community and volatile profiles of ‘Cabernet Sauvignon’ grape berries from two wine-producing regions in China during grape ripening was characterized extensively using high-throughput sequencing technology and headspace solid-phase microextraction/gas chromatography–mass spectrometry (HS-SPME/GC–MS). We also employed three different methods to identify key species in the microbial networks and evaluated their impacts on berry volatiles through linear regression analysis. Furthermore, pairwise Spearman’s correlations and a two-way orthogonal partial least squares (O2PLS) model were established to reveal the potential roles of microbial communities in berry aroma profiles. To the best of our knowledge, this is the first study to explore the effects of regional variation on the endophytic microbial community structure and berry volatiles of grapes, thereby laying the foundation for studying the roles of plant–endophyte interactions in viticulture and grape flavor.

2. Materials and Methods

2.1. Site Description and Sample Collection

The same international grapevine cultivar, Vitis vinifera L. cv. ‘Cabernet Sauvignon’, which is grown in two commercial vineyards—‘Yaojing’ winery in Xiangfen (Shanxi) and ‘Hejinzun’ winery in Yongning (Ningxia), China—was employed in this study [16] (Figure 1). These vineyards have distinct climatic conditions. Grape samples were collected between June and October 2022. The vines from both regions were self-rooted, oriented in a north-south direction, and spaced at 3.0 m × 1.0 m, and only vines with uniform growth vigor were sampled. All vines from both regions were trained in a vertical shoot-positioning trellis system with a sloped trunk. The vineyards from both regions were drip-irrigated using the same vinicultural methods. Meteorological data of the two vineyard sites in 2022 were obtained from the China Meteorological Data Service Center (https://data.cma.cn/en, accessed on 5 December 2022) (Supplementary Table S1).
In each vineyard, five regular sampling points at equal diagonal distances were selected for five biological replicates; at each point, five grapevines were labeled. Grape samples were collected at three developmental stages (early version [E-L 35], mid-maturity [E-L 37], and harvest [E-L 38]), according to the E–L system to evaluate changes in volatile compounds and microbial communities during grape ripening [17]. Healthy grapes were randomly selected from five clusters per replicate using a five-point sampling method (upper, middle, lower, front, and back positions of each cluster) and mixed into separate samples. Five biological replicates were prepared, and 30 samples were collected. Each sample was placed in a sterile bag and transported to the laboratory on ice. Half of the grapes from each sample were stored at 4 °C for microbial community analysis within 24 h, while the rest were stored at −80 °C for physicochemical index and volatile compound analysis.

2.2. Analysis of the Physicochemical Parameters of Berries

In each replicate, 20 intact berries were weighed using an electronic scale (JH810-3; JEHE, Beijing, China). There were five replicates per sample. The berries were manually pressed to extract juice. The total soluble solids (TSS) of the grape juice were measured using a portable refractometer (PAL-1; Atago, Tokyo, Japan). The juice pH was determined using a pH meter (Sartorius PB-10, Sartorius, Göttingen, Germany) [18]. The results are shown in Supplementary Table S1.

2.3. Volatile Compound Analysis Using HS-SPME/GC-MS

We analyzed the free aroma using clear juice prepared from grapes pre-sterilized on the surface stored at −80 °C as described in Section 2.4 of this study, and the same samples were used for microbial amplicon sequencing analysis following the method described by [17,19]. There were five replicates per sample. Each replicate of 50 berries was ground into powder under liquid nitrogen protection, with a portion used for microbial amplicon sequencing. The remaining berry powder was transferred to a 50 mL centrifuge tube, and 1 g of polyvinylpyrrolidone (PVPP) and 0.5 g of D-(+)-gluconic acid delta lactone were added. After homogenization, volatile was extracted at 4 °C for 4 h. The mixture was then centrifuged at 8000× g and 4 °C for 15 min to obtain a clear fruit juice. The bound aroma was extracted by adding 5 mL of juice to a Cleanert PEP-SPE cartridge (Agela, Hayward, CA, USA) [17], and the extract was concentrated to dryness and dissolved in a citric acid solution. Subsequently, the bound aroma was released by incubating the solution with 100 μL of AR 2000 enzyme (Creative-Enzymes, Shirley, NY, USA) at 40 °C for 16 h. Finally, a 5 mL sample, 10 μL of 4-methyl-2-pentanol (internal standard), and 1 g of NaCl were added to a 20 mL vial for further analysis.
Volatile compounds were initially enriched using HS-SPME and subsequently separated and detected using an Agilent 6890 gas chromatograph coupled with an Agilent 5975 mass spectrometer (MS) (Agilent Technologies, Santa Clara, CA, USA), as described by [17]. Volatile compounds were identified by comparing the mass spectrum information and retention index obtained from the automated mass spectral deconvolution and identification system with reference standards in the NIST 14 MS database. The volatile compound concentrations were determined using external standards. Quantification was performed by calculating the peak area ratio of the target compound to the internal standard (4-methyl-2-pentanol) based on the calibration curves. Results were expressed as μg L−1 of juice in grape berries [17].

2.4. Sample Preparation for Microbial Community Analysis

The sample surface was disinfected to remove epiphytic microorganisms from the grape skin using a modified method described by [20]. First, each replicate of 50 berries was placed in sterile water for 30 s and 70% ethanol for 2 min and treated with 2.5% NaClO (containing 0.1% Tween80) for 5 min. Subsequently, the samples were transferred to 70% sterile ethanol for 30 s. Finally, the plant tissues were washed thrice with sterile water. To confirm the effectiveness of the disinfection process, 200 μL of the third rinse was plated on potato dextrose agar plates (Aobox Biotech Co., Ltd., Beijing, China), and no microbial growth was observed after several days of incubation at 28 °C. Next, the surface-sterilized plant tissues were quick-frozen with liquid nitrogen and stored at −80 °C, and the same sterile grapes were used in nucleic acid extraction and volatile extraction. There were five replicates per sample.

2.5. DNA Extraction, Microbial Amplicon Sequence Analysis

DNA was extracted from each sample using an E.Z.N.A.® soil DNA Kit (Omega Bio-tek, Norcross, GA, USA), following the manufacturer’s instructions. There were five replicates per sample. We used the primer pairs ITS1F (5′-CTTGGTCATTTAGAGGAAGTAA-3′) and ITS2R (5′-GCTGCGTTCTTCATCGATGC-3′) to amplify the fungal ITS1 region (rDNA) and 799F (5′-AACMGGATTAGATACCCKG-3′) and 1193R (5′-ACGTCATCCCCACCTTCC-3′) to amplify the bacterial 16S rRNA genes (V5–V7 region) using the T100 Thermal Cycler PCR thermocycler (BIO-RAD, Hercules, CA, USA), following a previously described PCR protocol. Paired-end sequencing was performed using an Illumina PE300 platform (Illumina, San Diego, CA, USA). The raw FASTQ files were quality-filtered using FASTP (version 0.19.6), and the sequences were spliced using FLASH (version 1.2.7). The UCHIME algorithm was used to eliminate chimeric sequences from the trimmed sequences [21]. High-quality sequences were clustered into operational taxonomic units (OTUs) using the UPARSE algorithm with a 97% similarity threshold [21]. The OTU table was manually filtered to remove chloroplast and mitochondria DNA sequences from all samples. To minimize the effects of sequencing depth on the alpha and beta diversity measures, the OTU abundance in each sample was normalized based on the minimum sequence number of samples, which still yielded an average good’s coverage of 99.09%, respectively [22]. All subsequent analyses were conducted using the normalized data. The most abundant sequence of each OTU was selected as the representative sequence. The taxonomy of each representative OTU sequence was annotated using the Silva database based on the Mothur algorithm. The raw sequencing data were deposited in the National Center for Biotechnology Information database under BioProject number PRJNA1083792.

2.6. Statistical Analyses

Analysis of variance was conducted using SPSS (version 22.0; Duncan’s test, p < 0.05) (IBM, Amonk, NY, USA), with five replicates per sample. The figures were visualized using GraphPad Prism 8.0.2 (GraphPad Software, San Diego, CA, USA) and ImageGP (http://www.ehbio.com/ImageGP/, accessed on 5 March 2023) [23]. Orthogonal partial least-squares discrimination analysis (OPLS-DA) was performed to identify biomarkers among the volatile metabolites in berries from the two regions using the Simca 14.1 software (UMETRICS, Malmo, Sweden). Alpha diversity of the microbial community was calculated using the Shannon index in the R vegan package. Principal coordinate analysis (PCoA) was conducted to assess the distribution patterns of microbial communities and volatile compounds in different samples using the R LabDSV package based on Bray–Curtis dissimilarity. Bar plots depicted the compositions and dynamics of dominant microbial taxa (average relative abundance ≥ 1.0%). Taxa with significant differential abundances among groups were identified by the factorial Kruskal–Wallis sum-rank test (α = 0.05). Venn diagrams were generated using the R Venn Diagram package to illustrate shared and unique microbial taxa. Co-occurrence networks were constructed to investigate the internal community relationships among the samples using a Spearman’s correlation coefficient threshold of |r| > 0.7 and p < 0.01, and the results were visualized using Gephi 0.10.1 software (https://gephi.org, accessed on 5 March 2023) based on the correlation between two nodes. Following [24], we combined three methods to identify potential core species in the network. We calculated the within-module connectivity (Zi) and among-module connectivity (Pi) (Zi-Pi) of each node, and module hubs (Zi ≥ 2.5; Pi < 0.62), connectors (Zi < 2.5; Pi ≥ 0.62), and network hubs (Zi ≥ 2.5; Pi ≥ 0.62) were defined as keystone nodes, while the rest were categorized as peripherals. Specificity–occupancy (SPEC–OCCU) plots were used to identify potential specialist species in each community. For each region, the 1594 and 483 most abundant OTUs were selected from the bacteria and fungi OTU tables, respectively. Furthermore, specificity and occupancy were calculated, and OTUs with specificity and occupancy values ≥ 0.7 were selected as specialist OTUs. Shared OTUs were generated from the Venn diagrams. The associations between the abundant microbial taxa and volatile compounds were calculated using pairwise Spearman’s correlations in the psych package (|r| > 0.6 and p < 0.05), and they were visualized using the Cytoscape 3.10.0 software (https://cytoscape.org, accessed on 5 March 2023). We performed O2PLS analysis using the SIMCA-14.1 software to identify the vital microbial taxa (X) correlated with volatile compounds (Y) during grape ripening. Variables with variable importance in projection (VIP; pred) scores > 1 were considered the most representative taxa for explaining Y.

3. Results and Discussion

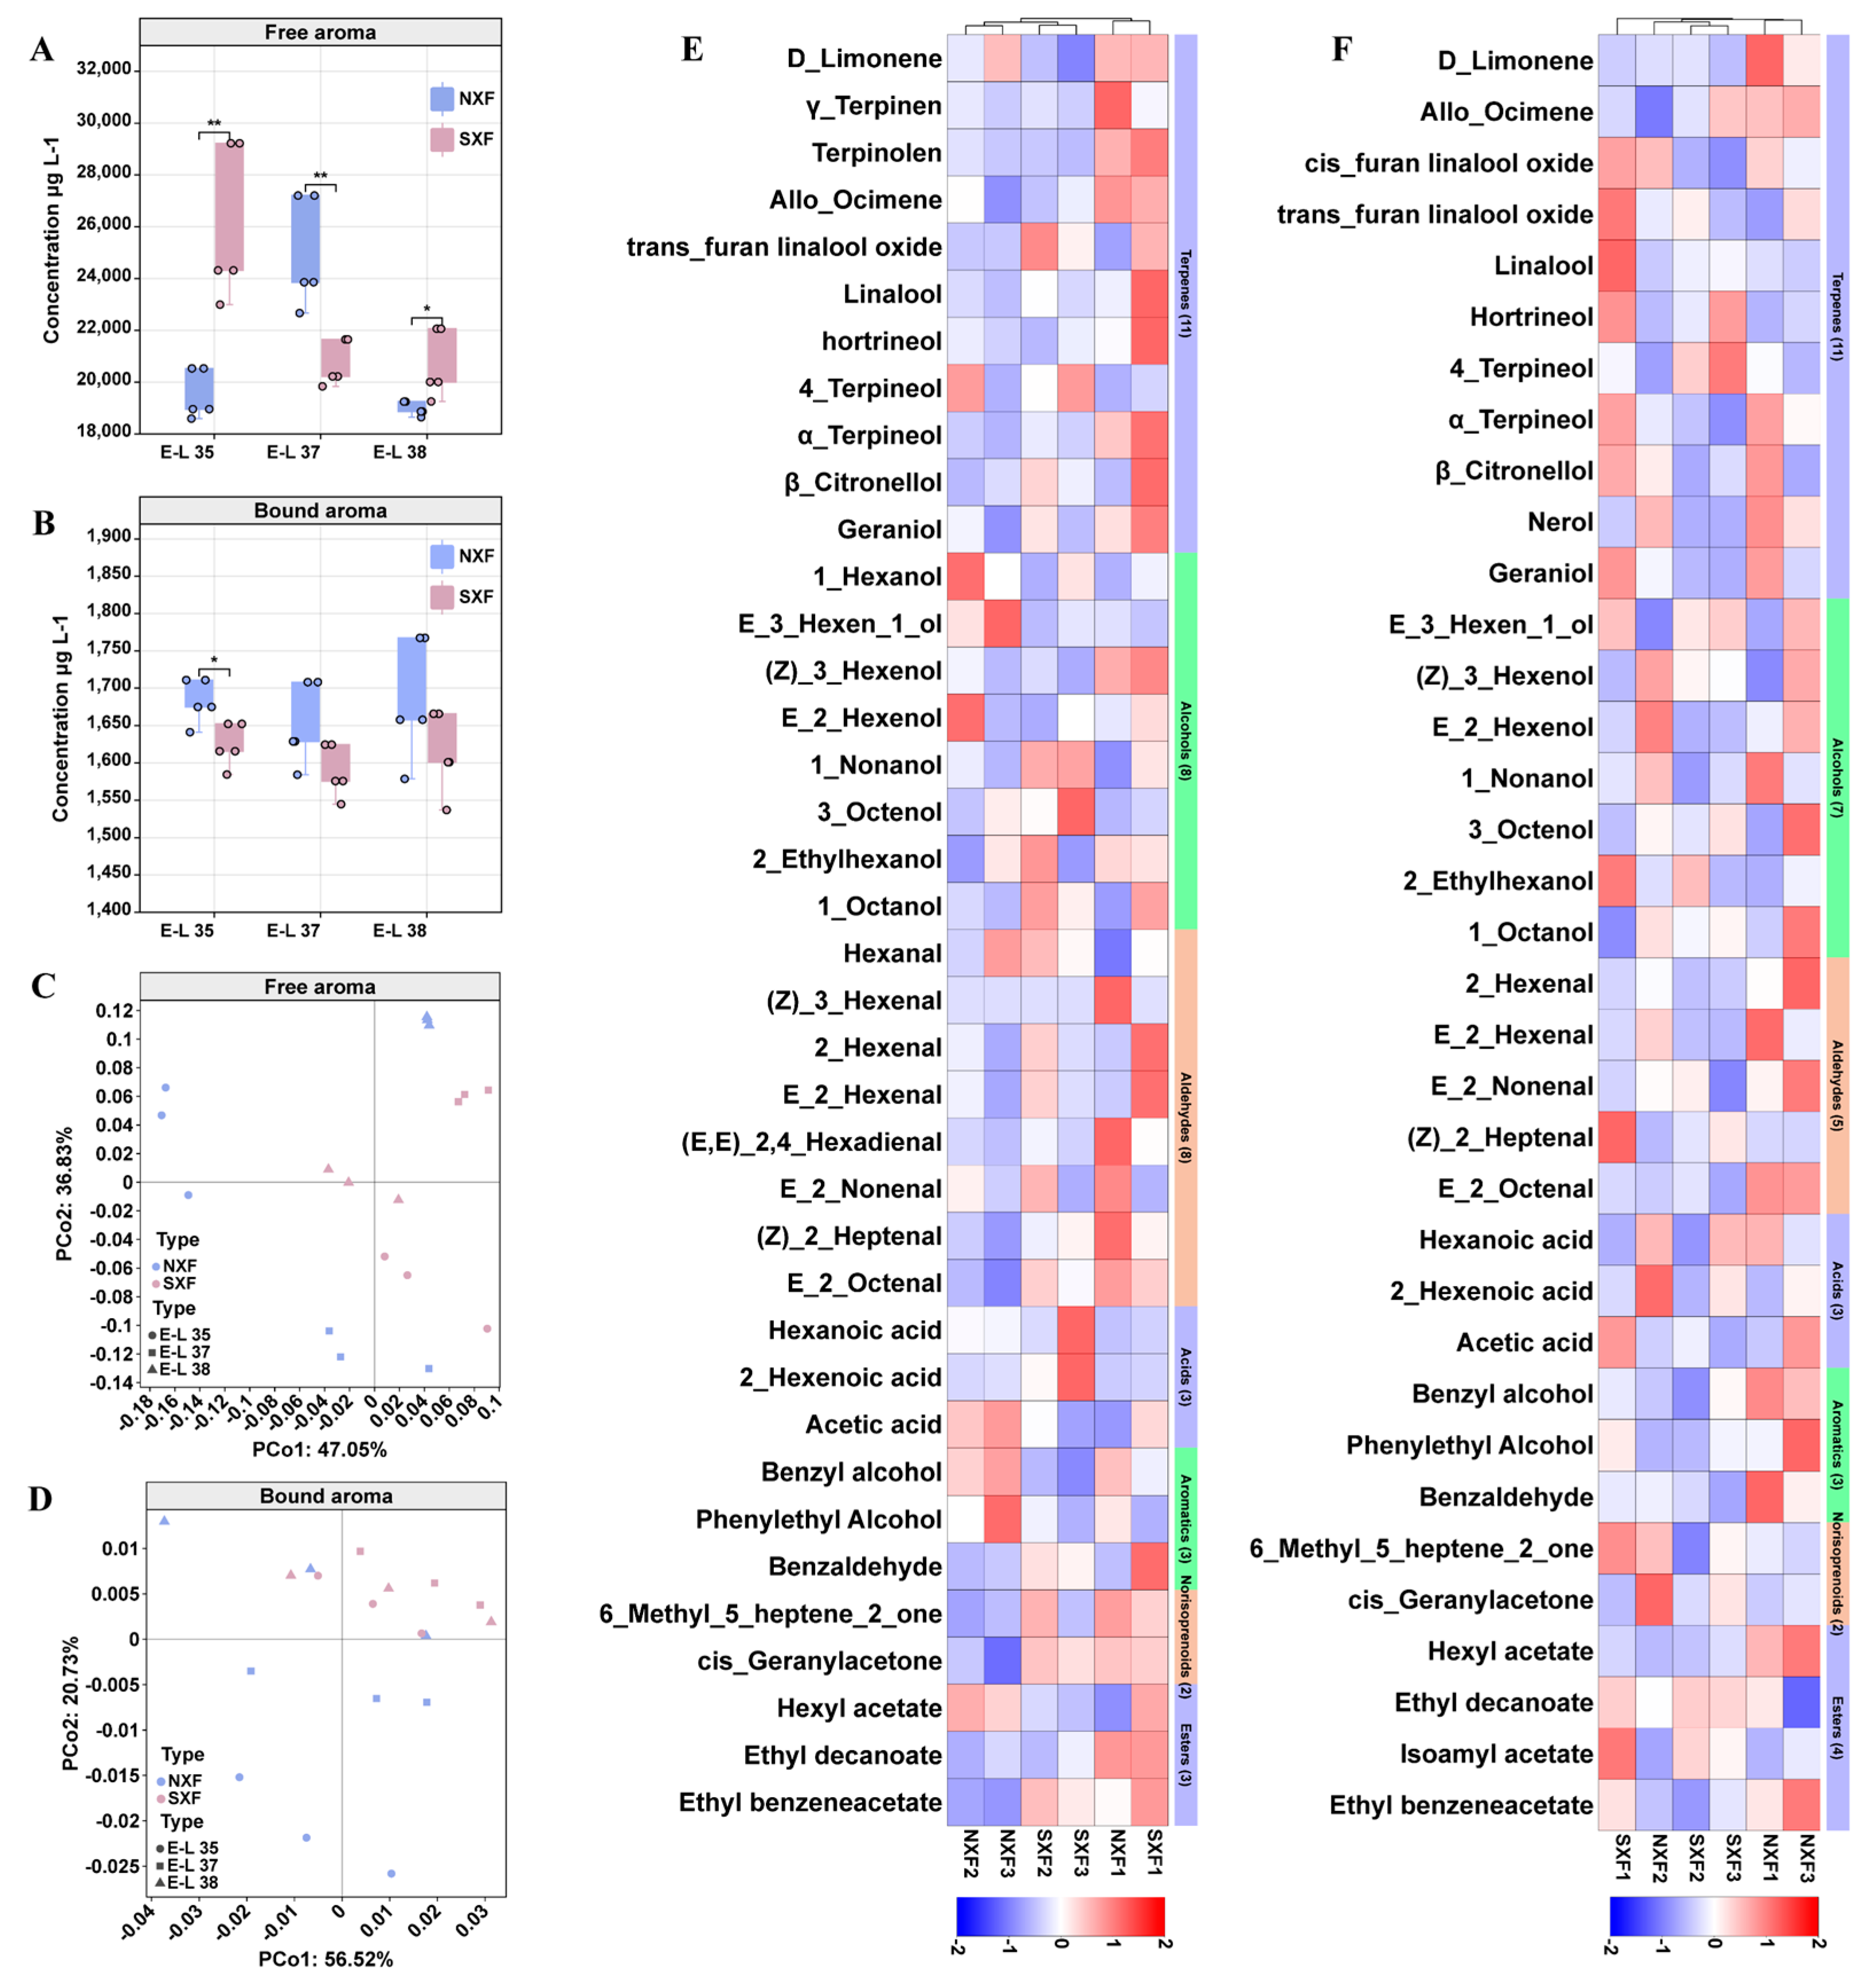
3.1. Comparison of Volatile Compounds during Grape Ripening

Volatile aroma compounds in plants comprise “free” and “bound” forms, with the latter being attached to a sugar moiety. In this study, we identified 38 and 35 free and bound aroma compounds, respectively, in the Ningxia berries (NXF) and Shanxi berries (SXF) (Figure 2E,F). During grape ripening, the total amount of free aroma compounds in NXF initially increased and then decreased, whereas that in SXF decreased (Figure 2A). The concentrations of the bound aroma compounds in both NXF and SXF initially decreased slightly and subsequently increased, maximizing at harvest (Figure 2B). The total concentration of free aroma compounds in SXF was higher than that in NXF, except at the E-L 37 stage, whereas the opposite trend was observed for the bound aroma compounds. Yue et al. (2024) reported that the ‘Muscat Hamburg’ grapes from the Shanxi (Xiangfen) region had a higher total free monoterpene content than that of grapes from the Ningxia (Xixia) region [25], and this agrees with our findings. PCoA for the free aroma was used to significantly distinguish samples based on their regions and developmental stages, with grapes from different production regions exhibiting distinct aroma profiles (Figure 2C). PCoA 1 (47.05%) was used to identify NXF from the rest at the E-L 35 stage, whereas using PCoA 2 (36.38%), NXF, and SXF were significantly identified at different stages. In contrast with the case of the free aroma, NXF was significantly identified from the rest at the E-L 35 and E-L 37 stages only using PCoA 2 (20.73%) of the bound aroma (Figure 2D). Similarly, Xie et al. (2019) reported that the vineyard sites had significant influences on the volatile profiles of grapes [26]. These distinct aroma characteristics are associated with the geographical characteristics of the grapes.
The aroma compounds were classified as terpenes, alcohols, aldehydes, acids, aromatics, norisoprenoids, and esters, in accordance with previous studies [17] (Figure S1A,B). In this study, aldehydes (69%), alcohols (22%), and acids (4%) were the most abundant free aromatic compounds. Similarly, alcohols contributed to the primary differences in berries from different regions. Their concentrations were 52% and 69% higher in SXF than in NXF at E-L 35 and E-L 38 stages, respectively, owing to the differences in 1-hexanol, E-2-hexenol, and (Z)-3-hexenol concentrations (Figure 2E,F). Second, aldehyde concentrations were 30% and 22% higher in SXF than in NXF at the E-L 35 and E-L 37 stages, respectively, primarily including 2-hexenal and E-2-hexenal (Figure 2E,F). Terpene concentrations were 12–21% higher in SXF than in NXF during ripening, primarily in geraniol and β-Citronellol.
Glycoside-bound compounds are essential grape volatile precursors; they can improve the aroma of grapes and wines by producing volatile aromatic compounds directly upon hydrolysis [25]. In contrast with the case of free aroma, 91% of the bound aroma in this study was attributed to aromatics (58%), acids (29%), and terpenes (4%) (Figure S1A,B). Consistent with the total concentration of bound aroma compounds, the concentrations of bound alcohols and aldehydes in NXF were higher than those in SXF. Alcohols contributed to 60% and 58% of the differences at the E-L 37 and E-L 38 stages, respectively; aldehydes contributed to 73–118% of the differences during grape ripening owing to differences in the (Z)-3-hexenol, E-2-hexenol, 2-hexenal, and E-2-hexenal concentrations (Figure 2E,F).
OPLS-DA was conducted to further understand the influences of vineyard sites on grape aroma composition. The models were considered to have acceptable fits and predictive abilities for R2Y > 0.9 and Q2 > 0.9, respectively. Results indicated a significant separation between samples from SXF and NXF (Figure S1C,D), consistent with the results of PCoA. Moreover, five and six significant differential compounds (VIP scores > 1) were identified in the free and bound aromas, respectively (Figure S1E,F). The most significant compounds in the free aroma were E-2-hexenal, E-2-hexenol, hexanal, (Z)-3-hexenal, and 1-hexanol, and those in the bound aroma were E-2-hexenal, benzyl alcohol, E-2-hexenol, phenylethyl alcohol, E-2-hexenal, and (Z)-3-hexenol. Among these compounds, E-2-hexenal exhibited the highest VIP score and was consistently identified as a vital biomarker. E-2-hexenal belongs to the C6 aldehydes, which contribute to green, apple-like, and fruity flavors and influence the overall aroma of wine grapes [19]. According to previous reports, vineyard environmental factors and microorganisms affect the compositions and other properties of grapes and wine [25]. Therefore, variations in volatile traits can be attributed to the responses of grapes to biotic and abiotic cues in different locations.

3.2. Comparison of Microbial Diversity during Grape Ripening

The diversity of endophytic microorganisms in grape berries during ripening was investigated using amplicon sequencing. The rarefaction curves were based on the species abundance of fungi and bacteria after flattening and indicated that the sequencing depth achieved sufficient coverage of the overall OTUs (Figure S2). In all samples, 24,335 and 33,462 high-quality sequences were identified for bacterial and fungal communities, respectively, in accordance with previous studies [27]. These sequences were classified into 1607 and 493 OTUs, respectively, based on 97% sequence similarity. However, the detectable sequences of endophytic microorganisms in grapes are significantly lower than those of root endophytic microorganisms and soil microorganisms [28]. The grape-related microorganisms originated primarily from the vineyard soil, and nearly 60% of the bacterial genera were present in both the soil and grapes. This is because, compared with the underground organs (i.e., roots), the above-ground organs (i.e., leaves, flowers, and fruits) experience poor nutritional conditions and are exposed to variable abiotic factors (such as light, temperature, and humidity) [16]. Furthermore, previous studies have reported that soil microorganisms, which are the primary reservoirs of endophytes, enter the above-ground organs through air transmission or the vertical propagation of vascular bundles. This results in a lower density of endophytes in the leaves, flowers, and fruits than that in the roots [29].
The Shannon index revealed dynamic changes in the alpha diversities of both the NXF and SXF microbial communities throughout grape ripening (Figure 3A,B). The alpha diversities of both the NXF and SXF bacteria initially increased and peaked at the E-L 37 stage before decreasing at the E-L 38 stage. The alpha diversity of fungi exhibited a gradual increase during grape ripening, except for that of SXF at the E-L 35 stage, consistent with the pattern of fungal community changes in the V. vinifera cv. ‘Pinot Noir’ [30]. In terms of region, the alpha diversities of the SXF microbial community at the E-L 37 and E-L 38 stages for bacteria and at the E-L 35 stage for fungi were higher than those of the NXF microbial community. PCoA revealed differences in the beta diversities of bacterial and fungal communities among samples from different developmental stages and regions (Figure 3C,D). For bacteria and fungi, most NXF samples were differentiated from SXF samples primarily along the first dimension (PCo1; 34.75–39.37%). However, there was no significant differentiation among samples from different developmental stages. Previous research has identified significant effects of geographic distance on the compositions of endophytic bacterial and fungal communities. Li et al. (2023), using PCoA and ADONIS analysis, reported that endogenetic microbial communities are differentially clustered by site [31]. These results indicate that endophytic microorganisms are largely shaped by the vineyard sites.

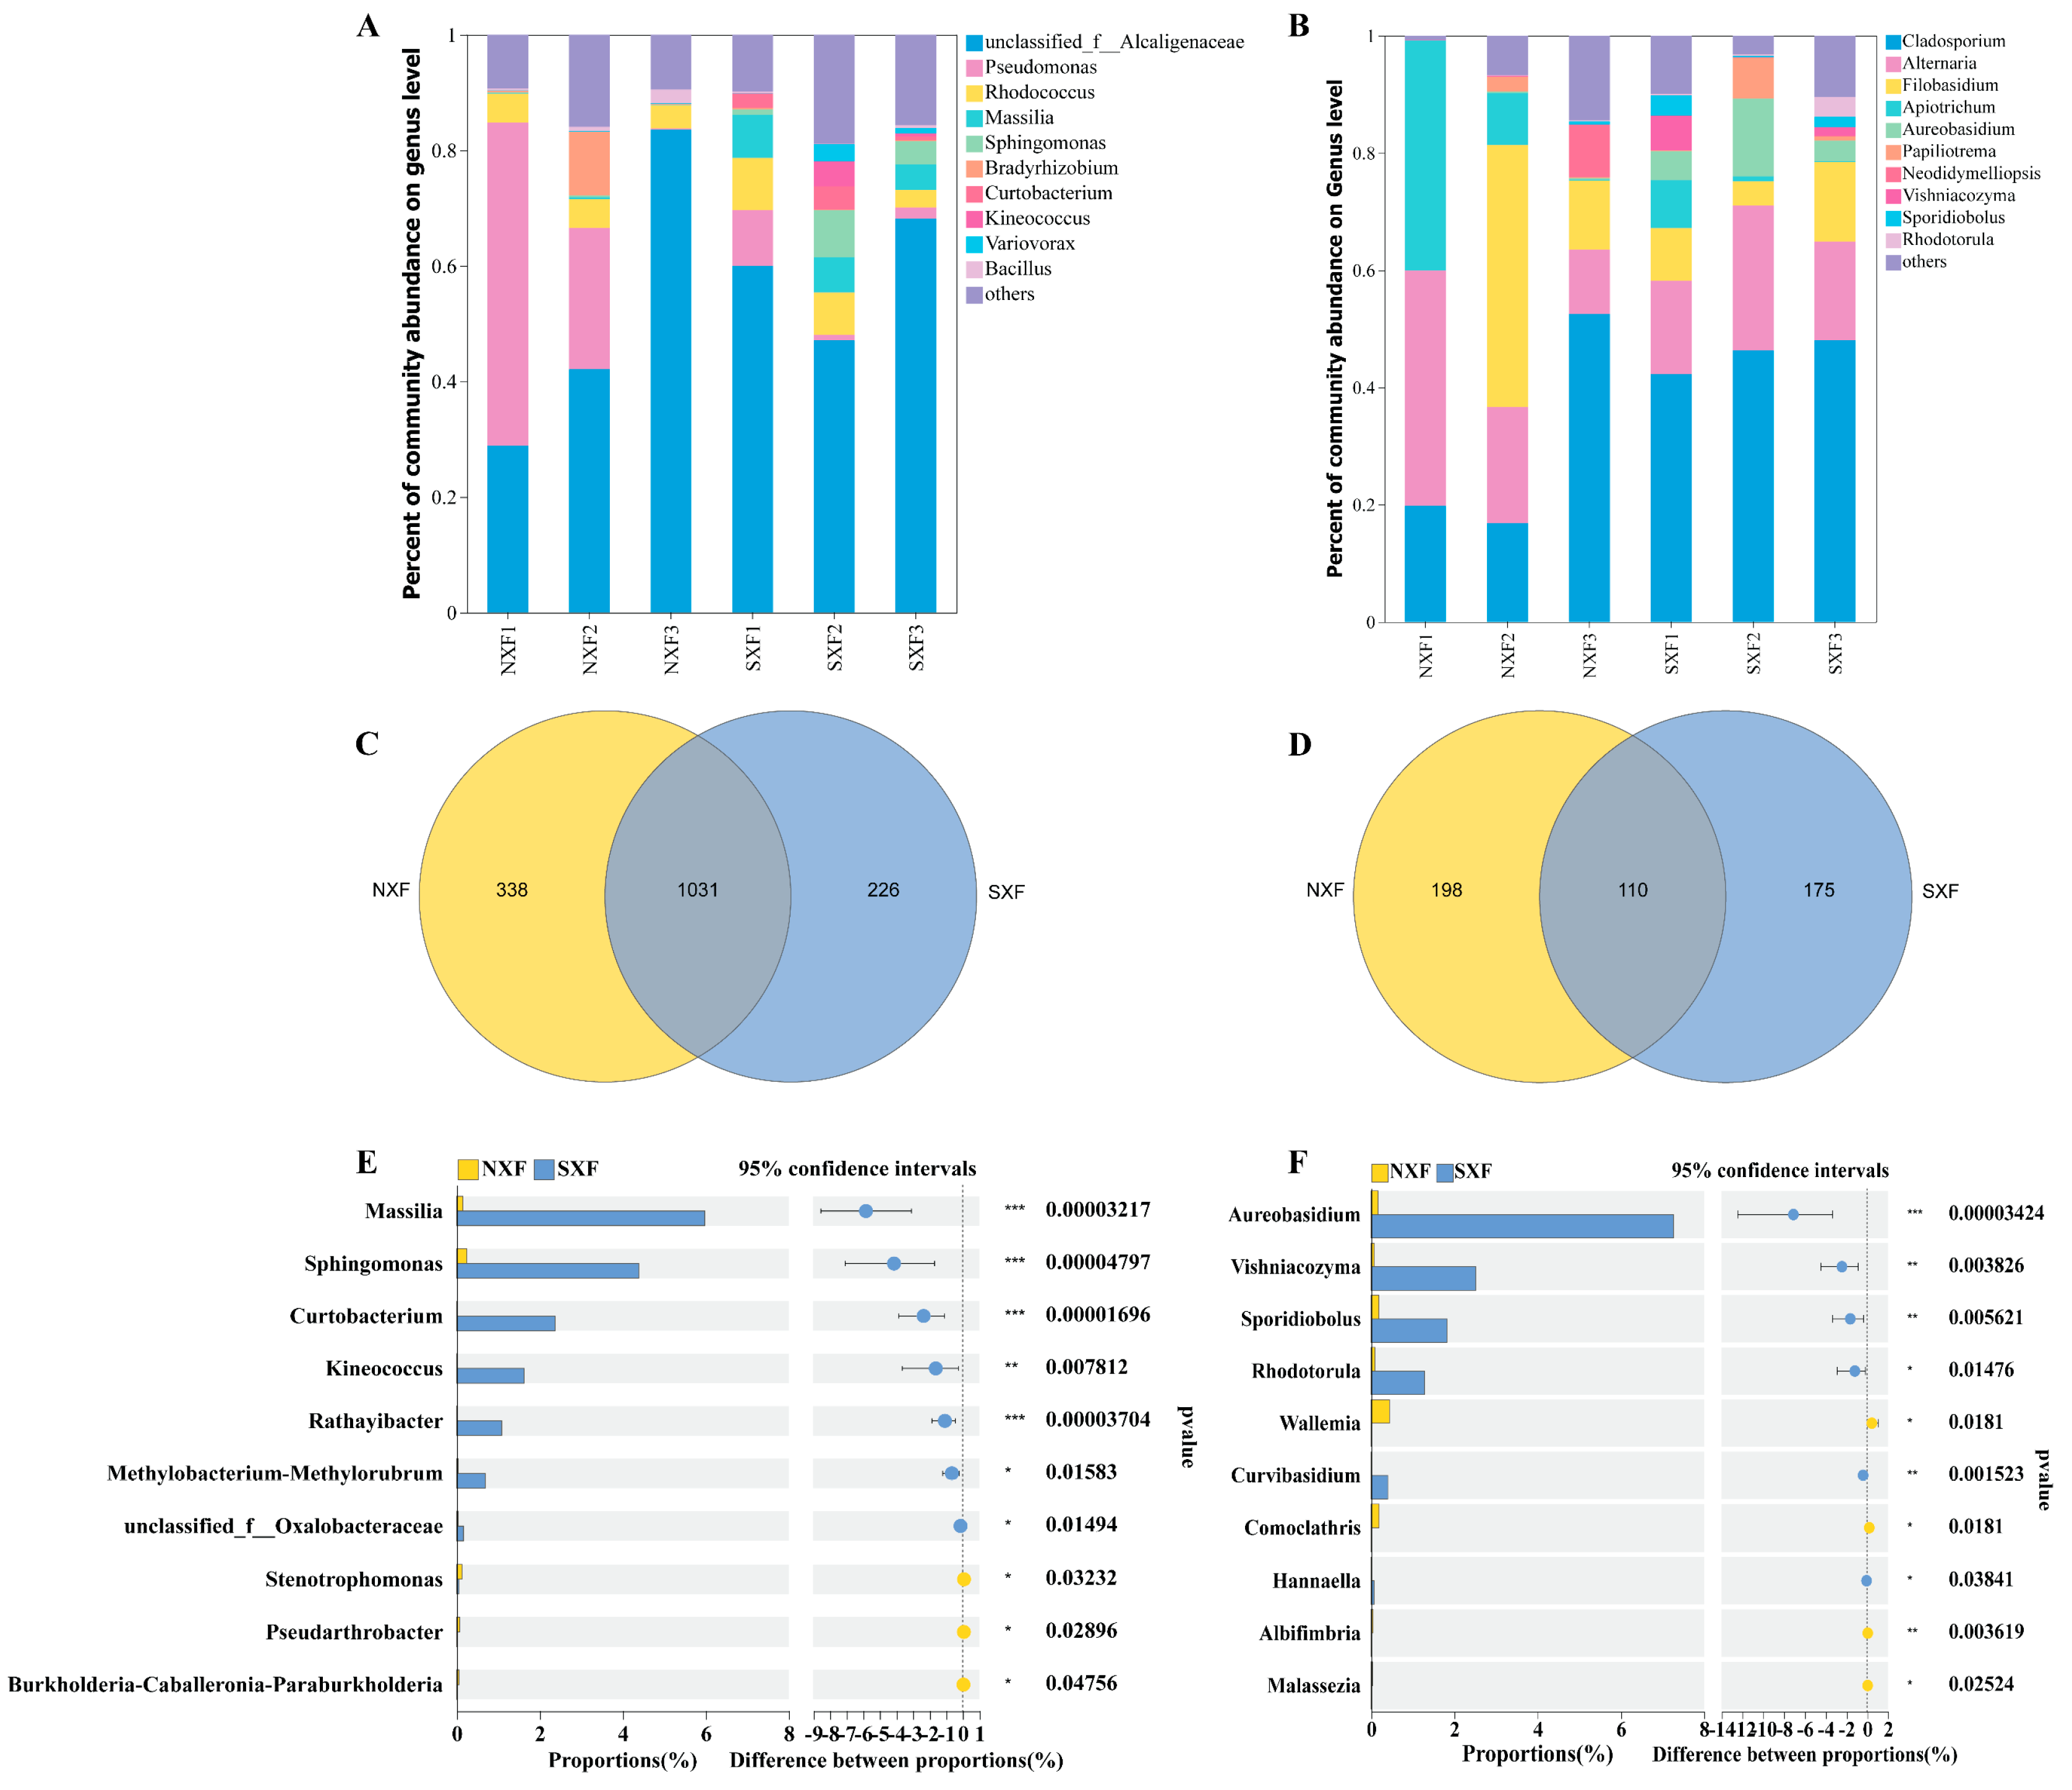
3.3. Comparison of Microbial Community Structure during Grape Ripening

According to an analysis of the microbial community components at the genus level, grape endophytes exhibited distinct temporal dynamics and succession patterns during berry development (Figure 4A,B). Furthermore, their relative abundances varied significantly across the different stages and regions (p < 0.05). The most abundant bacterial genus was unclassified_f__Alcaligenaceae, accounting for 29–84% and 47–68% of OTUs in NXF and SXF, respectively (Figure 4A). Pseudomonas was the second most abundant bacterial genus, with its abundance in NXF being higher than that in SXF. Conversely, Massilia and Sphingomonas in SXF were more abundant than those in NXF, showing 19–214- and 3.5–39-fold differences during grape ripening, respectively. These findings are consistent with those of research on V. amurensis endophytes growing in the Russian Far East and strawberry fruit endophytes during different developmental stages [7,27]. Cladosporium and Alternaria were the two most abundant fungal genera among all samples (Figure 4B). During grape ripening, these two taxa showed average relative abundances of 30% and 24% in NXF and 46% and 19% in SXF, respectively. Wijekoon et al. (2020) discovered that Alternaria spp. and Cladosporium spp. constituted most of the culturable fungal strains isolated from table grapes [28]. These fungi are significant in the production of various novel metabolites, including resveratrol, which can influence the chemical compositions of grapevines. Additionally, the relative abundance of Apiotrichum in NXF was higher than that in SXF, with 5- and 11-fold differences at the E-L 35 and E-L 37 stages, respectively. Conversely, Aureobasidium and Vishniacozyma manifested predominantly in SXF during grape ripening and to a lesser extent in NXF. These distinct fungal genera have been detected in different grapevine organs [30].
In this study, we annotated all bacterial cleaning sequences to nine phyla (Figure S3A). Proteobacteria and Actinobacteria were the top two phyla, accounting for 83.8% and 11.5% of annotated sequences, respectively. Consistent with the findings of [31], Ascomycota and Basidiomycota were the dominant fungal communities at the phylum level, representing 69% and 30% of annotated sequences, respectively (Figure S3B). These results were in accordance with the abundant Proteobacteria and Ascomycetes in plant endophytic microbial communities under selective excretion that occur through plant–microorganism co-evolution, suggesting that the internal environment of the grape berries provides a suitable habitat for these taxa [32]. Based on the species taxa of the OTUs, NXF and SXF shared 1031 bacterial and 110 fungal OTUs during grape ripening. NXF had 338 and 198 unique bacterial and fungal OTUs, respectively, whereas SXF had 226 and 175 unique bacterial and fungal OTUs, respectively (Figure 4C,D). A study based on the global vineyard soil microbial diversity also reported similar results, where the number of soil core bacteria from five continents was 5.4-fold that of soil core fungi [33]. The higher number of core bacterial OTUs suggests more complex connections among the bacterial community than those among the fungal community. Further investigation is needed to obtain detailed information.
Intergroup comparative analysis at the genus level further confirmed the differences in microbial community composition between NXF and SXF. We found that the relative abundances of the top 10 taxa in NXF were significantly different from those in SXF (Figure 4E,F). The relative abundances of the top five bacterial taxa—Massilia, Sphingomonas, Curtobacterium, Kineococcus, and Rathayibacter—in SXF were significantly higher than those in NXF (p < 0.01) (Figure 4E). Conversely, the relative abundances of Stenotrophomonas and Pseudarthrobacter in NXF were significantly higher than those in SXF (p < 0.05) (Figure 4E). Similarly, the relative abundances of fungi such as Aureobasidium, Vishniacozyma, Sporidiobolus, and Curvibasidium in SXF were significantly higher than those in NXF (p < 0.01) (Figure 4F). The results of intergroup comparative analysis at the top 10 taxa from two regions at the species level were shown in Figure S8. In line with our results, the compositions of the bacterial and fungal communities in ‘Chardonnay’ and ‘Cabernet Sauvignon’ also show significant geographical differences [3]. Previous studies have reported that endophytes can be regarded as fingerprints to trace the geographical origin of fruits [34]. These microbial taxa variations corroborate the results of Li et al. (2023) [31], indicating that the cultivation location significantly affects the assembly of endogenous microbial communities in plants. According to biogeography, climate is the primary determinant influencing the microbial communities in grape berries. Moreover, microbial populations are associated with specific climatic conditions, implying strong correlations between vineyard environments and microbial communities [33]. Therefore, in this study, redundancy analysis (RDA) of microbial diversity and environmental factors was conducted to determine the factors contributing to the difference in microbial diversity. The results indicated that microbes were influenced by environmental factors, and most bacterial genera were significantly correlated with environmental temperature, humidity, and berry weight (Figure S9).

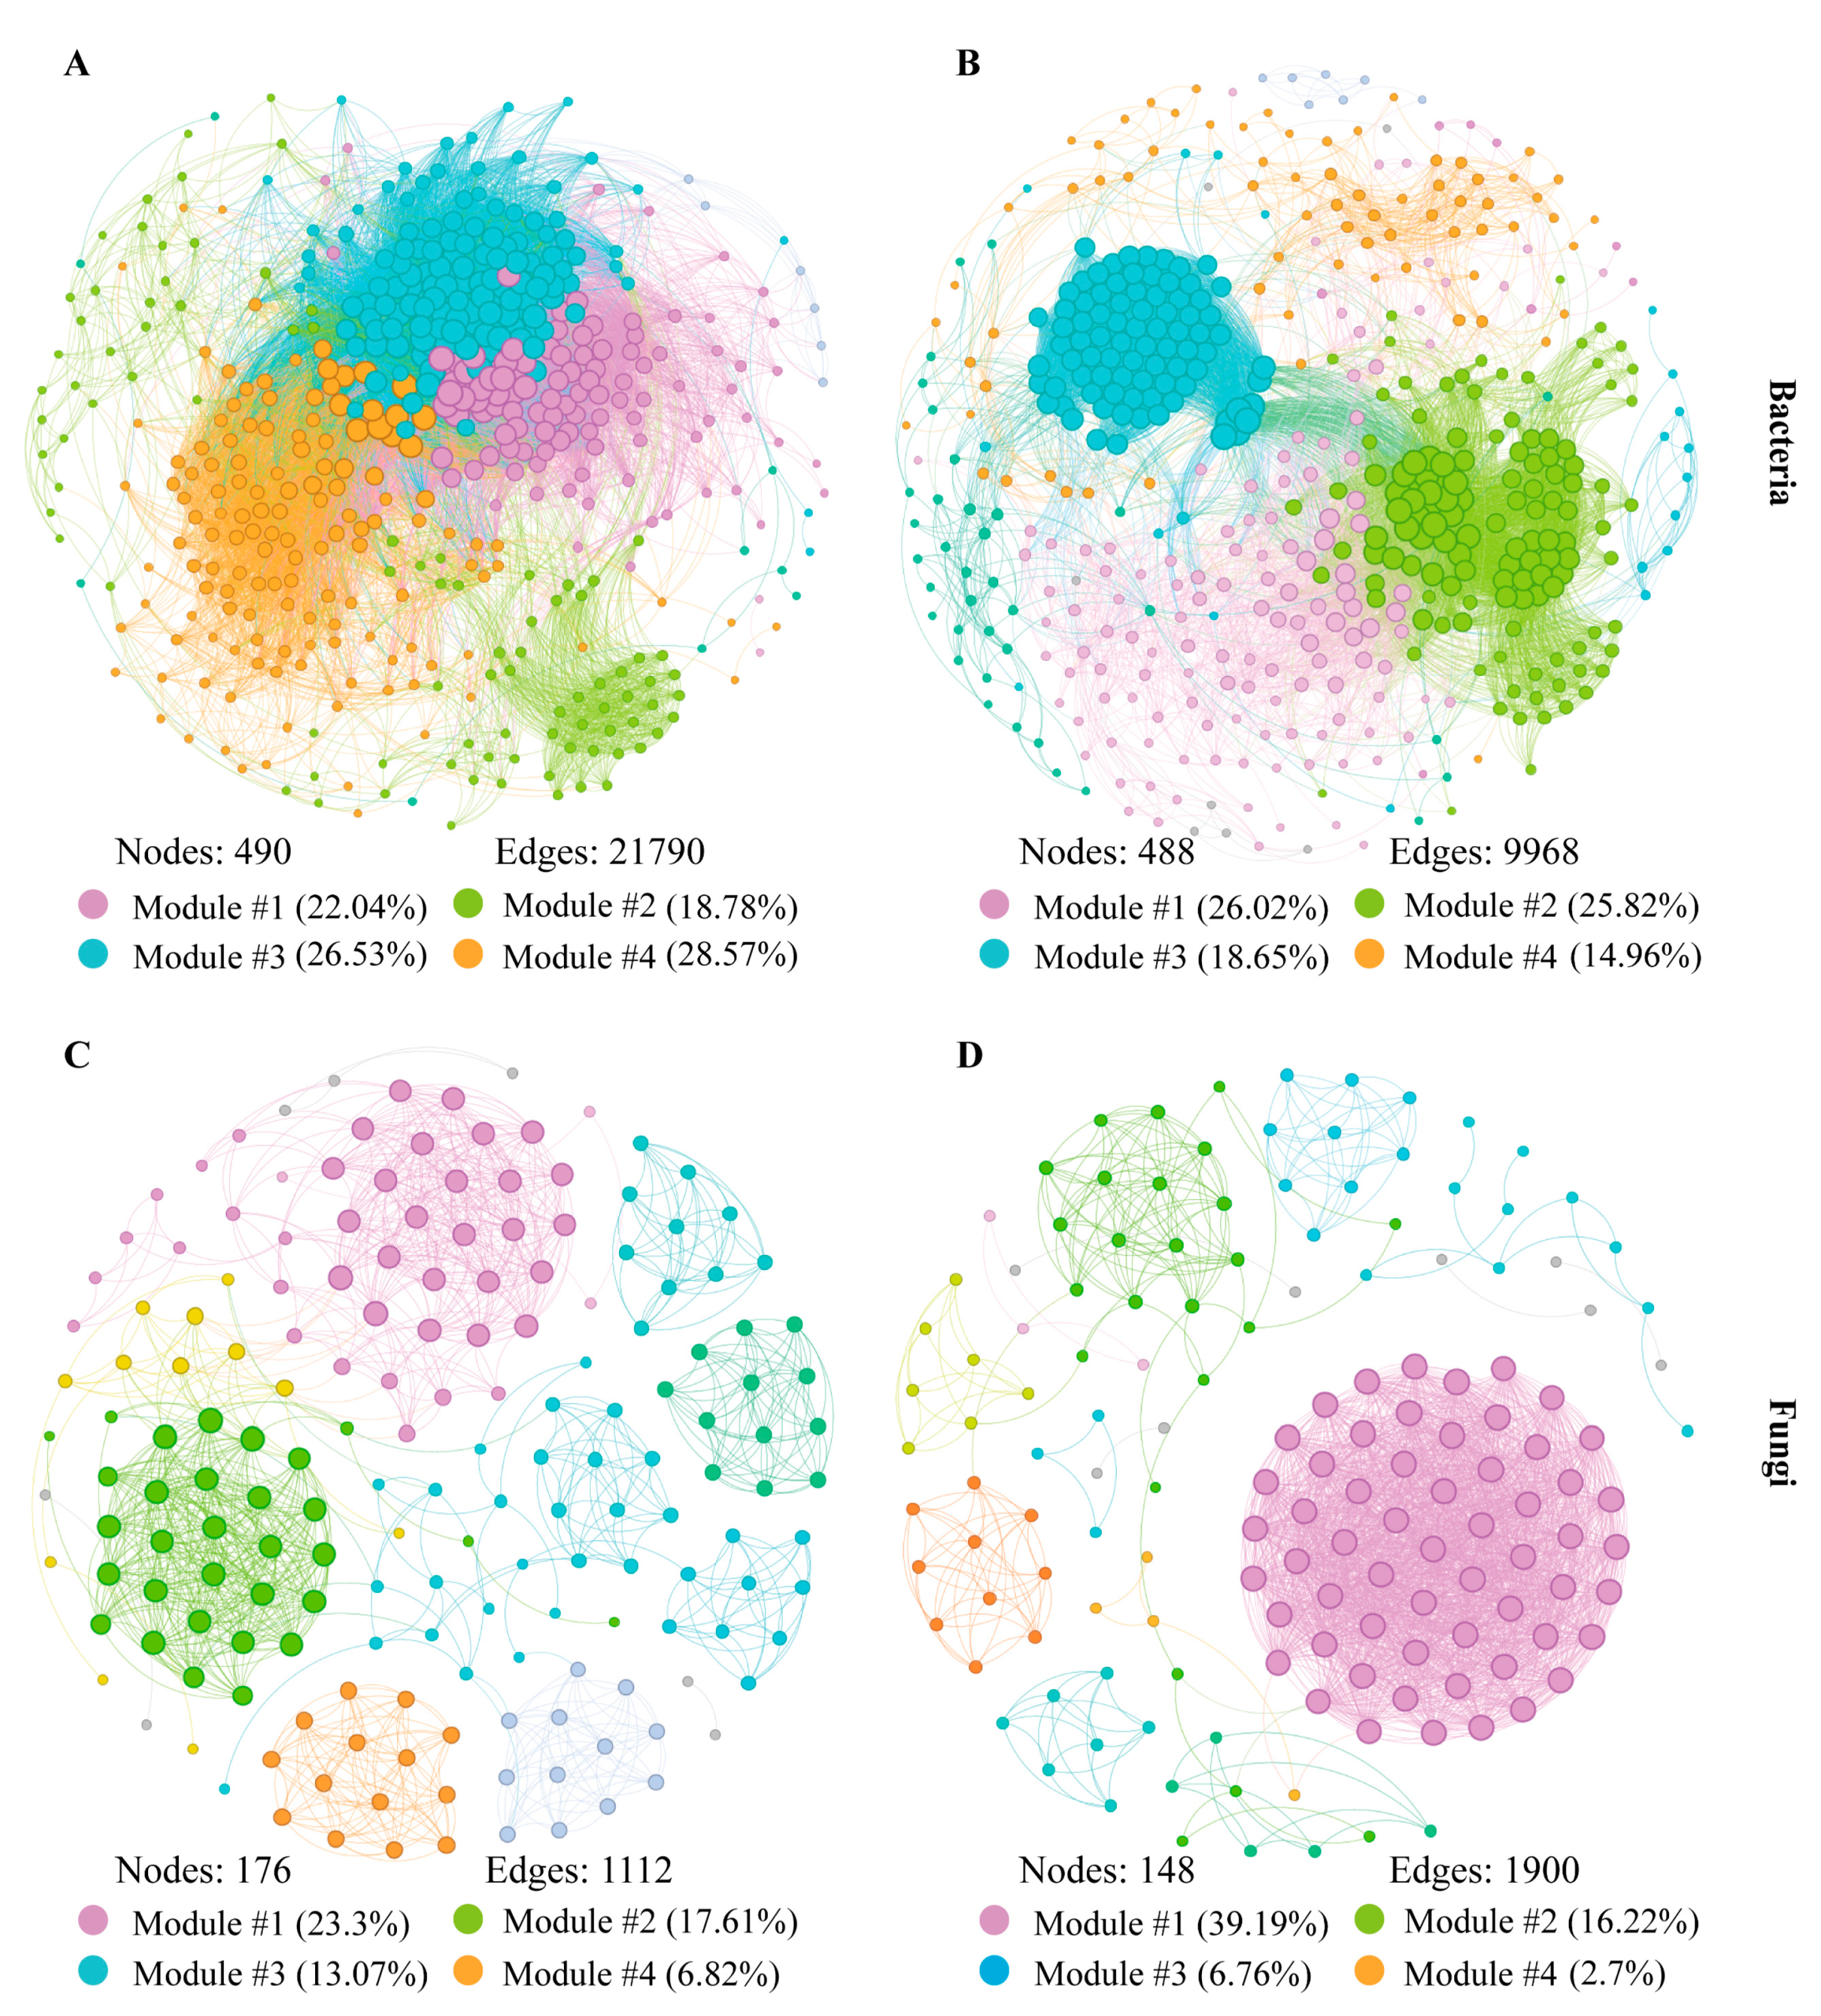
3.4. Distinct Endophytic Bacteria and Fungi Co-Occurrence Networks in Grape Berries

Microbial interactions significantly affect the structures of microbial communities. Recently, co-occurrence patterns among microbial community components have been visualized using microbial networks [35]. In this study, we constructed four co-occurrence networks (Figure 5A–D) to assess the interaction patterns of microorganisms in grape berries from the two distinct regions. The endophytic bacterial network in NXF comprised 490 nodes with 21,669 positive and 121 negative edges, whereas that in SXF comprised 488 nodes with 9930 positive and 38 negative edges (Figure 5A,B; Supplementary Table S2). The endophytic fungal network of grape berries exhibited smaller network sizes than those of the endophytic bacterial network, with 176 nodes (1102 positive and 10 negative edges) in NXF and 148 nodes (1899 positive and one negative edge) in SXF (Figure 5C,D; Supplementary Table S2). Bacterial and fungal interactions consistently show co-occurrence patterns rather than co-exclusion modes, with over 99% of the relationships being positive, irrespective of the influence of vineyard sites [36]. Using the module-selection strategy, we identified four primary modules from microbial networks both in NXF and SXF. These modules represented 95.92% and 85.45% of the total number of modules in the NXF and SXF bacterial networks, respectively, and 60.8% and 64.87% of the total number of modules in the NXF and SXF fungal networks, respectively.
We estimated the network topological features of the bacterial and fungal communities. The average clustering coefficient, network density, and average degree in the NXF bacterial network (average clustering coefficient = 0.645; average degree = 88.939; network density = 0.182) were higher than those in the SXF bacterial network (average clustering coefficient = 0.637; average degree = 40.852; network density = 0.084) (Supplementary Table S2). In contrast, the positive correlation, modularity, and betweenness centrality values of the top 30 bacterial species in the SXF bacterial network (99.62%, 0.526, and 1229.1) were higher than those in the NXF bacterial network (99.44%, 0.271, and 424.9) (Supplementary Tables S2 and S3). However, the opposite was true for the NXF and SXF fungal community networks, suggesting that the module more enriched in the NXF bacterial network exhibited a higher level of interconnectedness than that of the module in the SXF bacterial network. Co-occurrence networks are commonly used to assess the potential interrelationships among microbial taxa. Many studies have demonstrated that the co-occurrence patterns of endophytic microbial communities are affected by diverse agronomic practices, such as nitrogen fertilization [37]. A recent study confirmed that the geographical distance drives the differential assembly of bacterial and fungal communities in Agave species [38]. In this study, the endophytic microbial networks exhibited significant regional differences, i.e., the NXF bacterial network was more complex and stable than the SXF bacterial network, whereas the SXF bacterial network showed stronger niche differentiation due to the high modularity values. These regional variations in the microbial co-occurrence patterns are in accordance with observations of plant-endophytic bacteria and fungi of Astragalus mongholicus, suggesting that region affects the composition of endophytic bacterial communities [31].

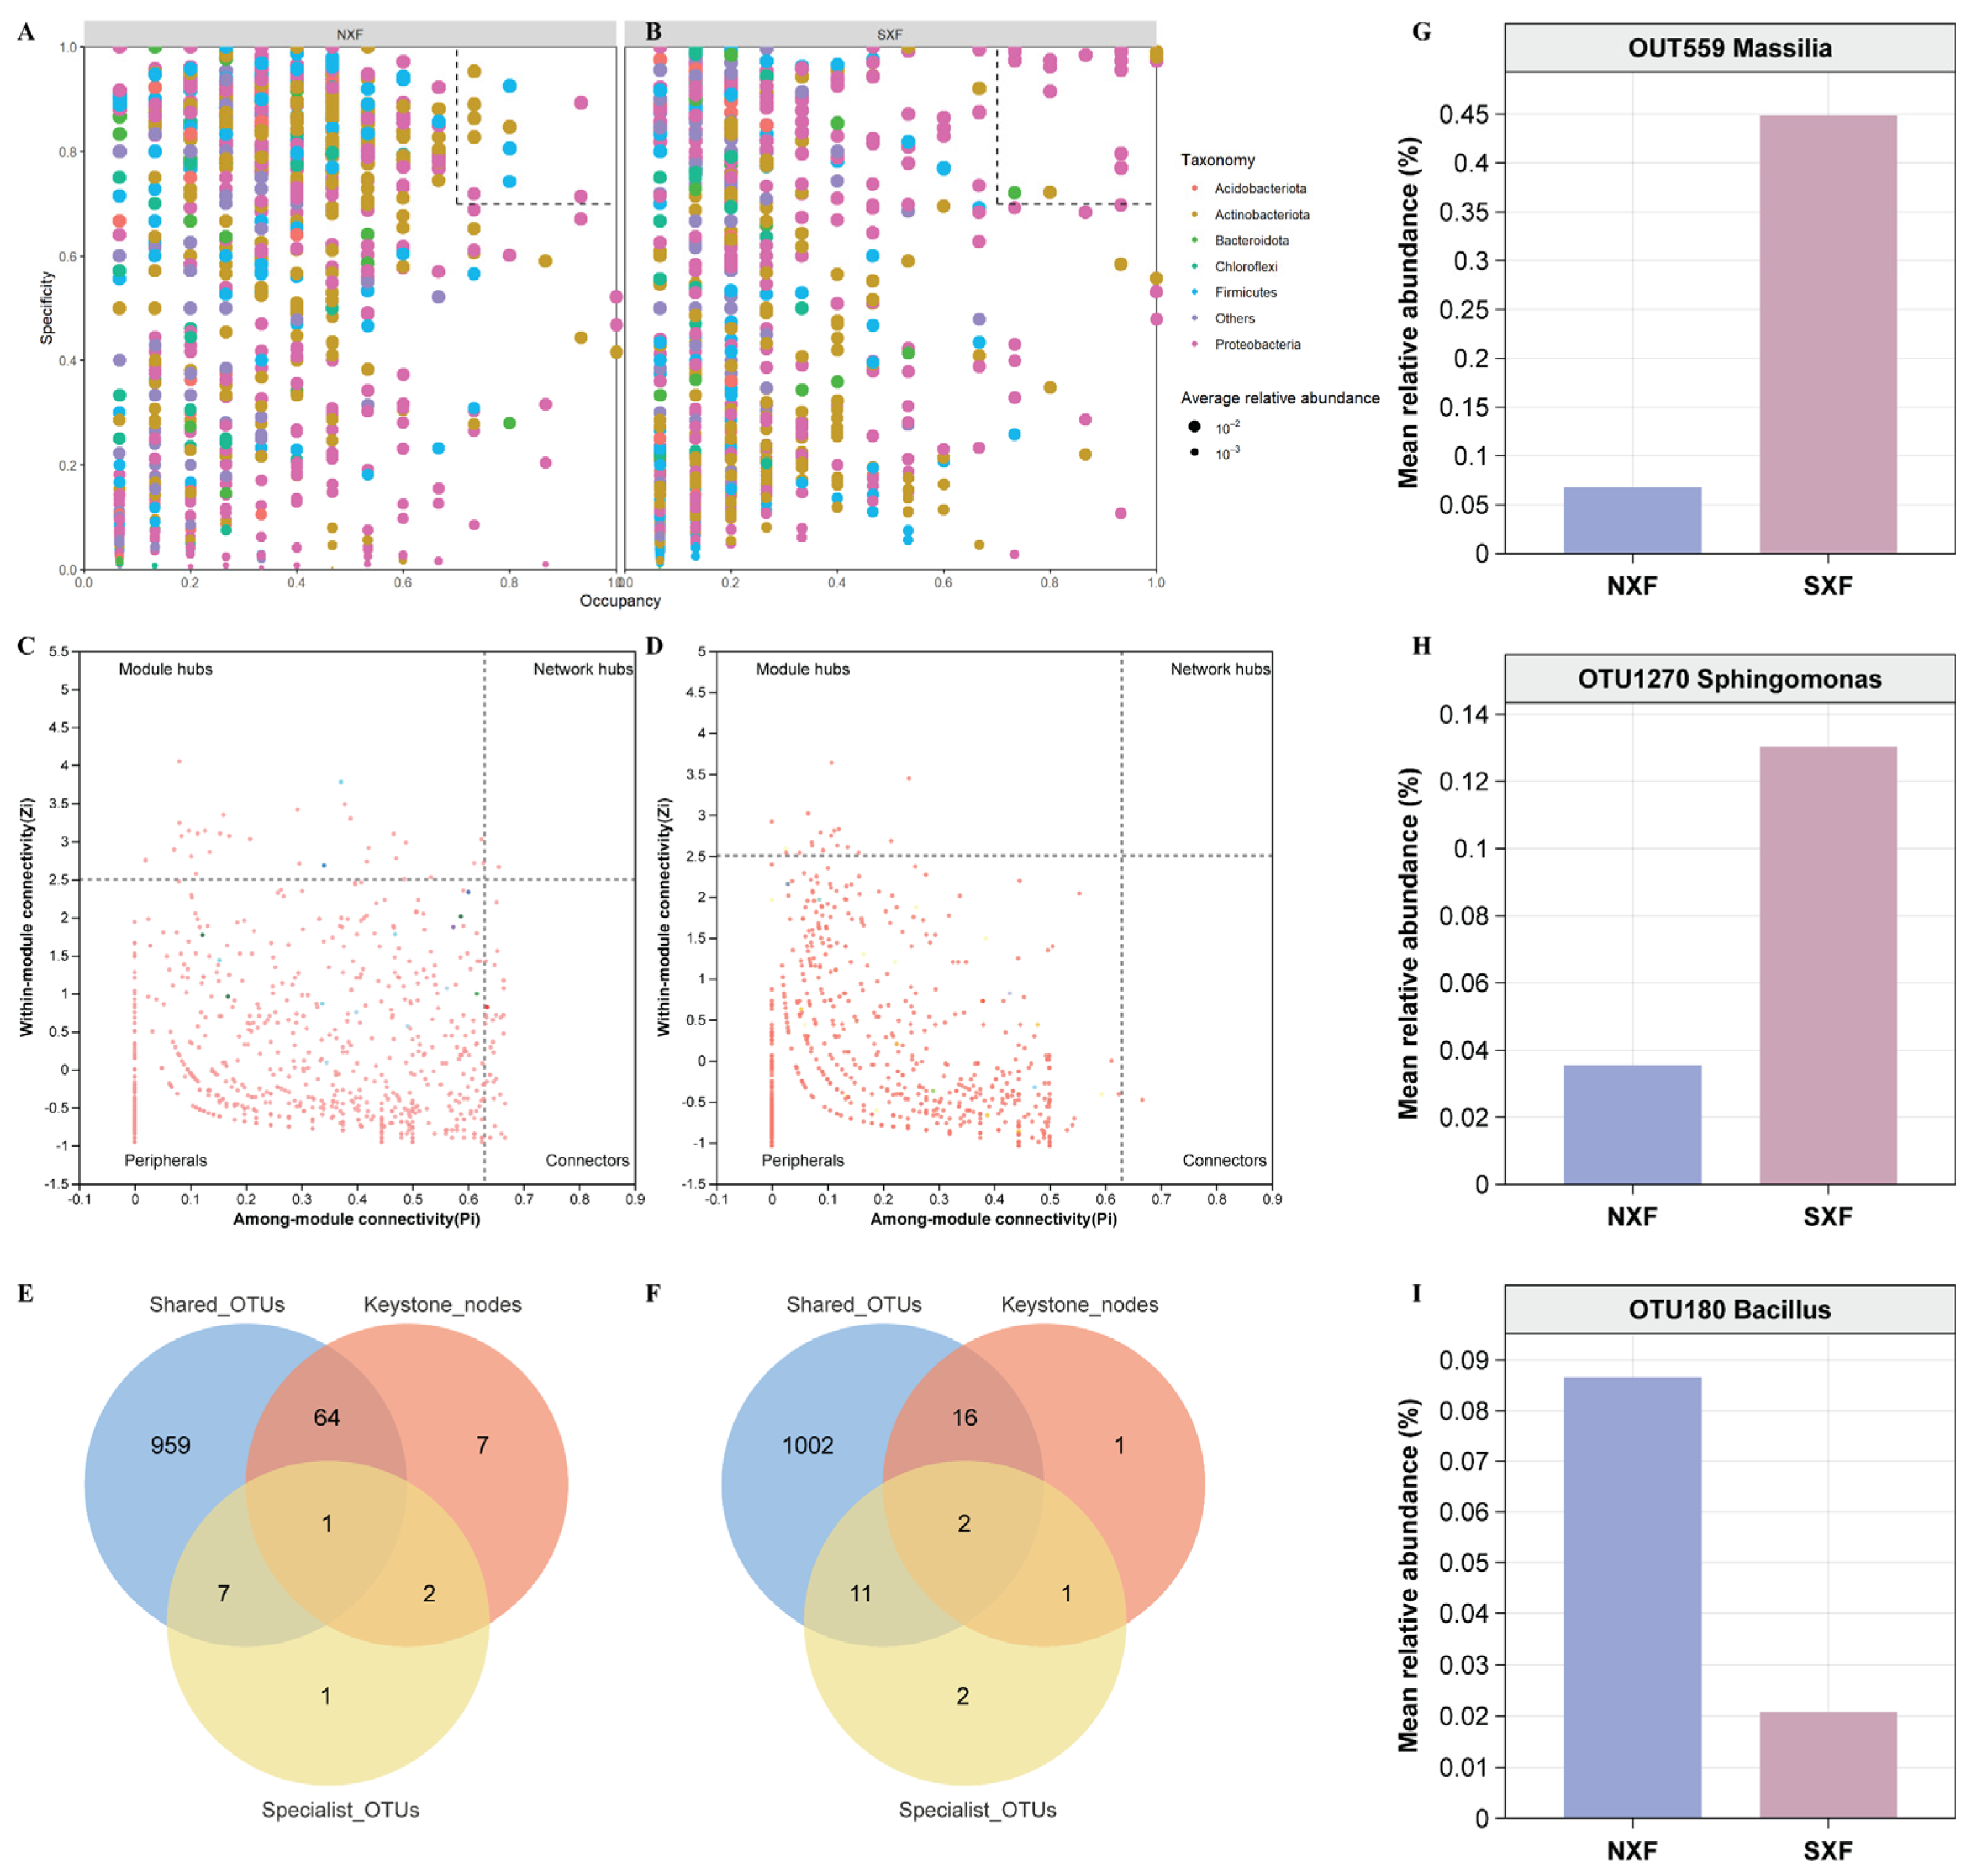
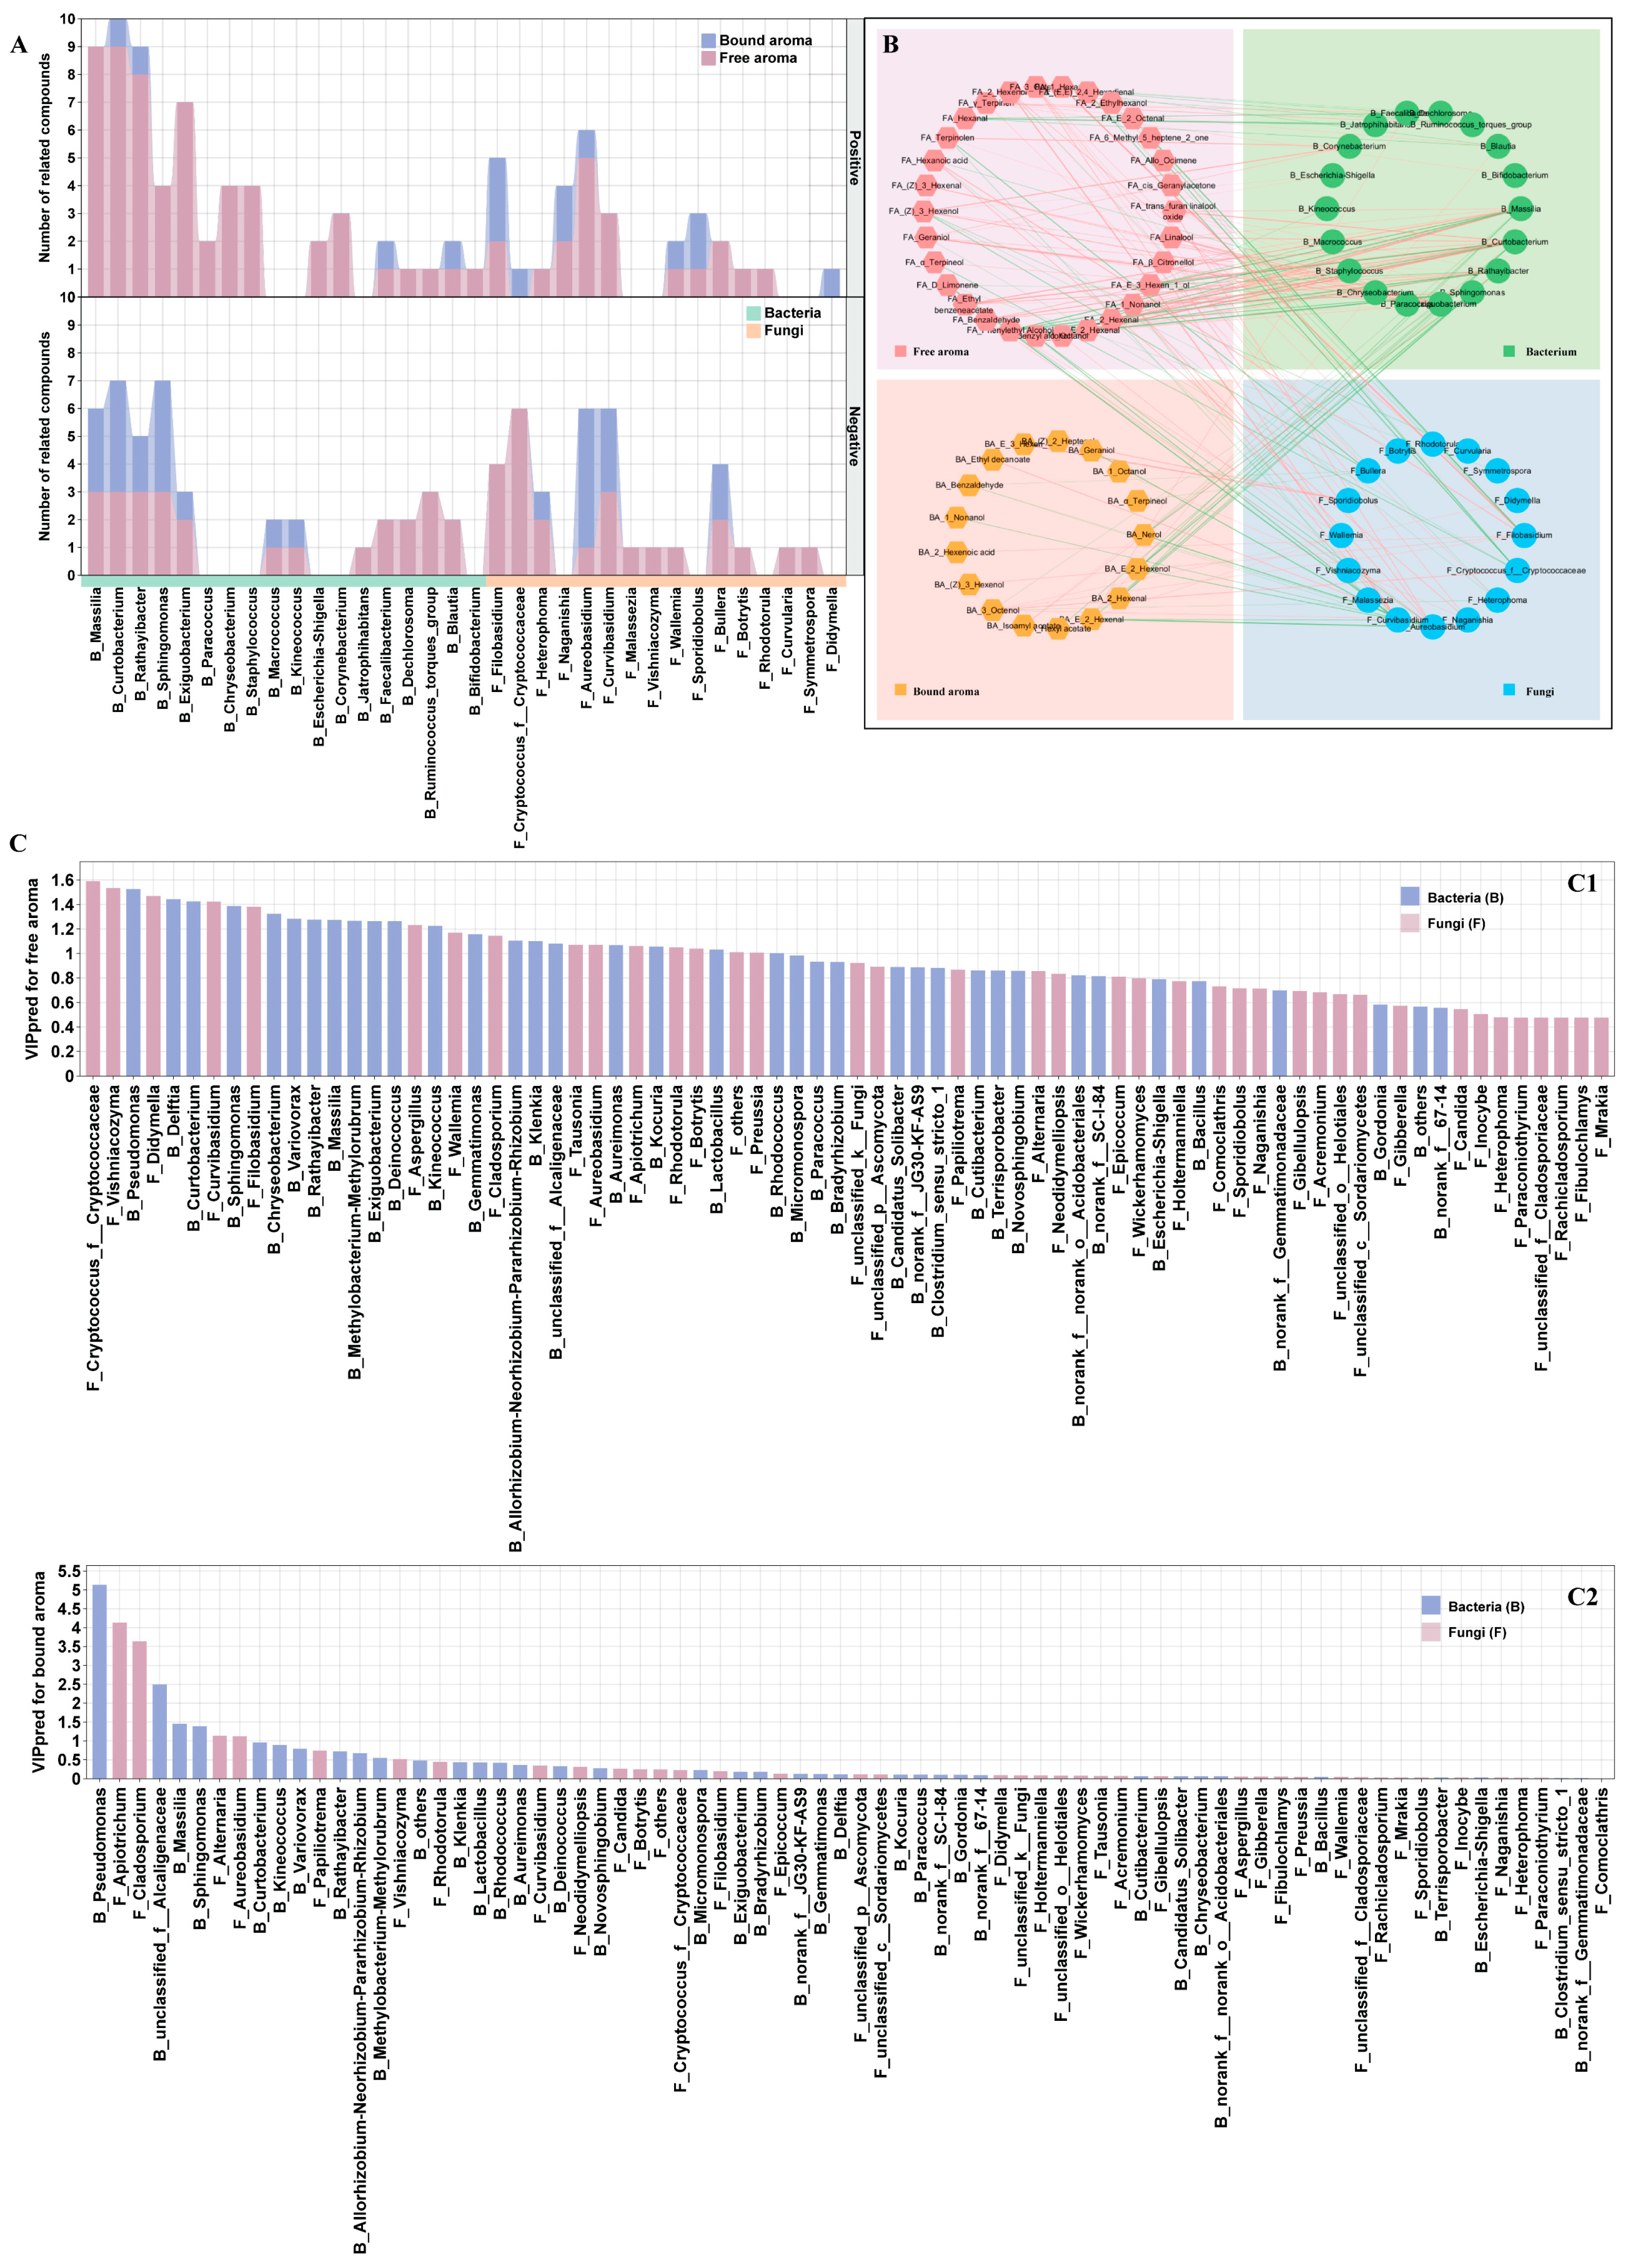
3.5. Identifying Core Taxa and Their Effects on Berry Volatiles

Key species play important roles in influencing the composition and function of microbial communities and are therefore considered “ecosystem engineers” [35]. To identify potentially key species within the network and their effects on berry volatiles, three different strategies were combined, including specialist OTUs calculated by SPEC–OCCU, network keystone nodes calculated by Zi-Pi, and shared OTUs [24]. A total of 11 and 16 OTUs were detected as specialist OTUs with specificity and occupancy values ≥ 0.7 in the NXF and SXF bacterial networks, respectively (Figure 6A,B). Additionally, Zi-Pi analysis suggested that most of the nodes in the NXF and SXF bacterial networks belong to peripherals, with most of the links for these nodes being within their modules (Figure 6C,D). There were 74 keystone nodes consisting of 42 connectors, 29 module hubs, and three network hubs in the NXF bacterial network, belonging to Actinobacteriota (25), Proteobacteria (28), Firmicutes (14), Myxococcota (2), Bacteroidota (1), Chloroflexi (1), Verrucomicrobiota (1), Gemmatimonadota (1), and unclassified_k__norank_d__Bacteria (1) at the phylum level. In the SXF bacterial network, 18 module hubs and two connectors were identified as keystone nodes, belonging to Proteobacteria (10), Actinobacteriota (3), Chloroflexi (3), Deinococcota (2), Firmicutes (1), and Gemmatimonadota (1). These results are similar to those for Schisandraceae plants [39]. Notably, only Bacillus (OTU180) in the NXF bacterial network and Massilia (OTU559) and Sphingomonas (OTU1270) in the SXF bacterial network simultaneously met the above three criteria, suggesting that these three species were the potential core species in the NXF and SXF bacterial networks, respectively (Figure 6E,F). The average relative abundances of Massilia and Sphingomonas in the SXF bacterial network were higher than those in the NXF bacterial network (Figure 6G,H), whereas Bacillus showed opposite results in these two networks (Figure 6I). Conversely, the specialist OTUs and keystone nodes identified in fungal networks were fewer than those in bacterial networks (Figure S4). Only Cladosporium (OTU65) was defined as the potential core species in the SXF fungal network (Figure S4), being more abundant in the SXF fungal network than in the NXF fungal network (Figure S7E). Previous research reported that key species utilize particular strategies to influence the microbial community, including secreting secondary metabolites to inhibit pathogenic microorganisms and establishing synergistic relationships, influencing the abundance of their cooperator [36]. Therefore, the distributions of these key species in this study may explain the distinct microbial network characteristics and community components between the two regions in relation to adaptation to various environments.
Correlation analysis was further conducted to explore the impacts of core species on berry volatiles. Results showed that the relative abundances of Massilia, Sphingomonas, and Bacillus were significantly positively correlated with free aroma compounds both in the NXF bacterial networks (Figure S5A, R2 = 0.57, p = 0.03; Figure S5C, R2 = 0.78, p = 0.00683; Figure S5E, R2 = 0.70, p = 0.039) and the SXF bacterial networks (Figure S5B, R2 = 0.76, p = 0.00109; Figure S5D, R2 = 0.63, p = 0.01; Figure S5F, R2 = 0.43, p = 0.11). Conversely, there were no significant correlations between the relative abundances of those three core species and bound aroma compounds (Figure S6). In terms of fungi, the relative abundance of Cladosporium was negatively correlated with both the free and bound aromas in the NXF fungal network and negatively correlated with the bound aroma in the SXF fungal network (Figure S7). These results were further supported by the regression analysis between microbial diversity and berry volatile compounds (Supplementary Table S4). There were significant positive correlations between bacterial richness and free aroma compounds and between bacterial Shannon index and free aroma compounds both in NXF and SXF (p < 0.05 and p < 0.01). However, no significant correlations were found between those two indexes and bound aroma compounds. In terms of fungi, fungal richness was significantly negatively correlated with free aroma compounds both in NXF and SXF and with bound aroma compounds in SXF. Similarly, the fungal Shannon index showed a significant negative correlation with the accumulation of bound aroma compounds both in NXF and SXF (p < 0.05). These results are consistent with research findings on cigar tobacco leaves, where bacterial communities significantly contribute to the formation of tobacco flavor [40].
Plant endophytes are mutualistic and potentially interact with their host to influence plant physiology and metabolism. Bacterial endophytes have been reported to play important roles in improving the content of secondary metabolites in their host plants [14]. The endophytic bacteria of the Bacillus genus colonized in G. superba rhizome and shoot promotes the accumulation of colchicine and gloriosine [14]. Sphingomonas of endophytic bacteria shows significant positive correlations with 6-methoxykynurenic and phydroxybenzonic acids in stems of Ephedra sinica [41]. This may be attributed to their function in secreting glycosidases and producing aroma precursors [40]. Similarly, other studies have found that keystone endophytic bacteria in the above-ground part of Astragalus mongholicus may contribute to regulate the production of flavonoid in the roots [31]. In this study, endophytic bacteria (key species, bacterial richness, and Shannon index) exhibited stronger correlations with berry-free aroma than those exhibited by fungi, which highlights that specific components of bacterial communities may be involved in the accumulation of plant volatiles.

3.6. Correlations between Microbial Community and Berry Volatile Profiles

Plant endophytes have been reported to acquire the ability to synthesize bioactive metabolites similar to those produced by their hosts or to release compounds through enzymatic activities during their long-term evolution with the host. This ability is associated with the microbial-mediated modulation of fruit flavor [12]. Section 3.5 of this study also indicates significant correlations between key species in microbial networks and the accumulation of berry volatiles. To further reveal the influences of microbial communities on the berry volatile components and flavor formation, Spearman’s correlation was used to analyze the dominant taxa (top 100 taxa in relative abundance) and volatile profiles of grape berries at |r| > 0.6 and p < 0.05 (Figure 7A,B). Finally, a correlation network was constructed using 18 bacterial taxa, 16 fungal taxa, 30 free aroma compounds, and 17 bound aroma compounds (Figure 7B). These bacterial taxa showed strong positive correlations with most free aroma profiles and negative correlations with most bound aroma profiles. Conversely, fungal taxa exhibited more negative correlations with aroma compounds (Figure 7A; Supplementary Table S5). Regarding free aroma compounds, Massilia, Sphingomonas, Rathayibacter, and Curtobacterium among the bacterial taxa, and Aureobasidium and Curvibasidium among the fungal taxa, showed strong positive correlations with nine, four, eight, nine, five, and three volatiles, respectively. These volatiles primarily included alcohols and aldehydes (2-hexenal, E-2-hexenal, 1-octanol, 1-nonanol), terpenes (β-citronellol, trans-furan linalool oxide, linalool), aromatics (benzaldehyde), and esters (ethyl benzeneacetate). Conversely, negative correlations were observed between these taxa and bound aromas, including 2-hexenal, E-2-hexenal, 1-nonanol, and benzaldehyde. Furthermore, O2PLS analysis was conducted to investigate the impact of highly abundant microorganisms (relative abundance > 0.1%) on the berry volatiles (Figure 7C). There were more taxa with VIP (pred) scores > 1 related to free aroma (35 taxa) than to bound aroma (eight taxa) (Figure 7C1,C2). These results are similar to the findings in Section 3.5, which means that endophytic bacterial community may be the primary contributors to the presence of free aroma compounds. In addition, this study also conducted metabolic traceability analysis through online websites http://metorigin.met-bioinformatics.cn/, accessed on 15 December 2023 (Figure S10). The results indicated that Massilia and Sphingomonas may produce compounds similar to the berry itself, such as benzaldehyde and phenylethyl alcohol, through the metabolic pathways of ko00623: toluene degradation, ko00627: aminobenzoate degradation, and ko00360: phenylalanine metabolism.
Sphingomonas naturally inhabits soil and plants, performing reportedly multifaceted positive functions. For example, it produces gibberellins and secretes ACC deaminase, mediating ethylene reduction in the host plants. This may delay late fruit ripening and organic acid degradation [12]. Massilia has shown important roles in root development and nitrogen nutrition of maize [42]. Escobar et al. (2021) and Sangiorgio et al. (2021) recently reported a significant correlation between Sphingomonas and Massilia, which are indicator taxa in soil-grown tomatoes and raspberries under integrated pest management, and the emission of aldehydes, including E-2-hexenal and nonyl aldehyde, which contribute to the green leaf flavor of the fruit [12,13]. In this study, these taxa were more dominant in SXF than in NXF during grape ripening (Figure 6G,H). Furthermore, based on the significant correlations between the abundance of dominant taxa and volatile compounds in the berries, our results indicate that these distinct taxa may be the essential contributors to improving the free aroma. Overall, this study suggests that vineyard regionality significantly affects the assembly of endophytic microorganisms in grape berries, and endophytic bacteria are significantly correlated with berry volatiles. These findings provide insights into studying the potential role of the grape-associated microbiota in influencing grape flavor. However, these hypotheses need to be further confirmed by key species inoculation of pot experiments in the future, and even investigation of the function of the active taxa of grape microbiota by dual unique molecular identifier–RNA sequencing (dual-UMI RNA-seq) technology to reveal the interaction mechanism between microorganisms and plants.

4. Conclusions

We combined volatomics and microbiomics analyses to explore the volatile compounds and microbiota profiles of Vitis vinifera L. cv. ‘Cabernet Sauvignon’ grapes in two regions. A total of 38 free and 35 bound aroma compounds were identified in grapes, including terpenes, alcohols, aldehydes, acids, aromatics, norisoprenoids, and esters. The concentration of berry volatiles exhibited significant differences in different vineyards during grape ripening, and SXF had a higher abundance of free aroma compounds than NXF, particularly alcohols, aldehydes, and terpenes, which will contribute to evaluate grape quality from different regions. Significant regional variations were also observed in microbial diversity, community structure, and network co-occurrence mode among the two vineyards. Additionally, the keystone species of bacteria (Sphingomonas, Massilia, and Bacillus) varied in abundance between the vineyards and played an important role in the accumulation of free aroma berry compounds. Spearman’s correlation and O2PLS analyses further revealed that these key taxa were positively associated with free-alcohols, aldehydes, and terpenes of berries. Overall, this study systematically reveals the impact of vineyard-site variation on berry volatiles and the endophytic microbial structure and shows the contribution of endophytic bacteria to the berry flavor. The results provide insights into understanding endophytes–grape interactions that can assist potential beneficial microbes in promoting sustainable grape cultivation.

Supplementary Materials

The following supporting information can be downloaded at: https://www.mdpi.com/article/10.3390/agronomy14102186/s1, Figure S1: Volatile profiles of grape berries during ripening at two different regions; Figure S2: The rarefaction curve of the microbial community; Figure S3: Barplots of the microbial community during grape ripening at two different regions; Figure S4: Identification of core species; Figure S5: Linear regression analysis between the relative abundance of core bacterial species and volatile concentration (free aroma) in berries; Figure S6: Linear regression analysis between the relative abundance of core bacterial species and volatile concentration (bound aroma) in berries; Figure S7: Linear regression analysis between the relative abundance of core fungal species and volatile concentration in berries; Figure S8: The comparison of microbial relative abundances at the species level between two regions; Figure S9: The relationship between environmental factors and microbial communities during grape ripening at two different regions; Figure S10: Metabolic tracing analysis of microbes and volatile compounds. Table S1: Meteorological data and berry physicochemical parameters during grape ripening; Table S2: Network topological parameters of co-occurrence networks of the bacteria and fungi community during grape ripening at two different regions; Table S3: Network topological features with high degree Species (top 30) of microbial interaction during grape ripening at two different regions; Table S4: Linear regression analysis of bacterial and fungal richness and Shannon index in different regions on the berry volatiles; Table S5: Correlation network parameters between the microbial community and volatiles during grape ripening at two different regions.

Author Contributions

Conceptualization, R.R. and Z.Z.; methodology, R.R.; software, R.R. and S.Z.; validation, R.R. and S.Z.; formal analysis, R.R.; investigation, R.R., M.Z., Y.L., J.S., Z.W. and M.W.; resources, R.R.; data curation, R.R.; writing—original draft preparation, R.R.; writing—review and editing, R.R.; visualization, R.R. and S.Z.; supervision, Q.Z.; project administration, Z.Z.; funding acquisition, Z.Z. All authors have read and agreed to the published version of the manuscript.

Funding

The authors declared that this study received funding from the key research and development project of the Ningxia Hui Autonomous Region, grant number 2023BCF01001 and National Modern Grape Industry Technology System Construction Special Project, grant number CARS-29-zp-6. The funder was not involved in the study design, collection, analysis, interpretation of data, the writing of this article, or the decision to submit it for publication.

Data Availability Statement

Data will be made available upon request.

Acknowledgments

The experiments were finished in the Key Laboratory of Viticulture and Enology, Ministry of Agriculture, China. We are very grateful to Juan Jiang for providing professional technical assistance, Grape and Wine Engineering Technology Research Center, Northwest A&F University, Yangling, China.

Conflicts of Interest

Author Yunqi Liu was employed by the company Ningxia Xige Estate Co., Ltd. The remaining authors declared that the research was conducted in the absence of any commercial or financial relationships and declared that there were no other conflicts of interest.

References

  1. Lund, S.; Bohlmann, J. The molecular basis for wine grape quality-a volatile subject. Science 2006, 311, 804–805. [Google Scholar] [CrossRef] [PubMed]
  2. Wang, J.; De Luca, V. The biosynthesis and regulation of biosynthesis of Concord grape fruit esters, including ‘Foxy’ methylanthranilate. Plant J. 2005, 44, 606–619. [Google Scholar] [CrossRef]
  3. Bokulich, N.; Thorngate, J.; Richardson, P.; Mills, D. Microbial biogeography of wine grapes is conditioned by cultivar, vintage, and climate. Proc. Natl. Acad. Sci. USA 2013, 111, 605–619. [Google Scholar] [CrossRef] [PubMed]
  4. Kustos, M.; Gambetta, J.; Jeffery, D.; Heymann, H.; Goodman, S.; Bastian, S. A matter of place: Sensory and chemical characterisation of fine Australian Chardonnay and Shiraz wines of provenance. Food Res. Int. 2020, 130, 108903. [Google Scholar] [CrossRef]
  5. Priori, S.; Pellegrini, S.; Perria, R.; Puccioni, S.; Storchi, P.; Valboa, G.; Costantini, E. Scale effect of terroir under three contrasting vintages in the Chianti Classico Area (Tuscany, Italy). Geoderma 2019, 334, 99–112. [Google Scholar] [CrossRef]
  6. Lola, D.; Miliordos, D.; Goulioti, E.; Kontoudakis, N.; Myrtsi, E.; Haroutounian, S.; Kotseridis, Y. Assessment of the volatile and non-volatile profile of Savatiano PGI wines as affected by various terroirs in Attica, Greece. Food Res. Int. 2023, 174, 113649. [Google Scholar] [CrossRef] [PubMed]
  7. Olimi, E.; Kusstatscher, P.; Wicaksono, W.; Abdelfattah, A.; Cernava, T.; Berg, G. Insights into the microbiome assembly during different growth stages and storage of strawberry plants. Environ. Microbiome 2022, 17, 21. [Google Scholar] [CrossRef]
  8. Gao, Y.; Li, D.; Liu, Y. Microbiome research outlook: Past, present, and future. Protein Cell 2023, 14, 709–712. [Google Scholar] [CrossRef]
  9. Li, Z.; Wen, W.; Qin, M.; He, Y.; Xu, D.; Li, L. Biosynthetic mechanisms of secondary metabolites promoted by the interaction between endophytes and plant hosts. Front. Microbiol. 2022, 13, 928967. [Google Scholar] [CrossRef]
  10. Sangiorgio, D.; Cellini, A.; Spinelli, F.; Pastore, C.; Farneti, B.; Savioli, S.; Rodriguez-Estrada, M.; Donati, I. Contribution of fruit microbiome to raspberry volatile organic compounds emission. Postharvest Biol. Technol. 2022, 183, 111742. [Google Scholar] [CrossRef]
  11. Nasopoulou, C.; Pohjanen, J.; Koskimäki, J.; Pirttilä, A. Localization of strawberry (Fragaria x Ananassa) and methylobacterium extorquens genes of strawberry flavor biosynthesis in strawberry tissue by in situ hybridization. J. Plant Physiol. 2014, 171, 1099–1105. [Google Scholar] [CrossRef] [PubMed]
  12. Escobar Rodríguez, C.; Novak, J.; Buchholz, F.; Uetz, P.; Bragagna, L.; Gumze, M.; Antonielli, L.; Mitter, B. The bacterial microbiome of the tomato fruit is highly dependent on the cultivation approach and correlates with flavor chemistry. Front. Plant Sci. 2021, 12, 775722. [Google Scholar] [CrossRef]
  13. Sangiorgio, D.; Cellini, A.; Spinelli, F.; Farneti, B.; Khomenko, I.; Muzzi, E.; Savioli, S.; Pastore, C.; María, T.; Rodriguez-Estrada, M. Does organic farming increase raspberry quality, aroma and beneficial bacterial biodiversity? Microorganisms 2021, 9, 1617. [Google Scholar] [CrossRef] [PubMed]
  14. Semwal, P.; Misra, S.; Misra, A.; Kar, S.; Majhi, B.; Mishra, S.; Srivastava, S.; Chauhan, P. Endophytic Bacillus strains enhance biomass and bioactive metabolites of Gloriosa Superba. Ind. Crops Prod. 2023, 204, 117296. [Google Scholar] [CrossRef]
  15. Tripathi, A.; Awasthi, A.; Singh, S.; Sah, K.; Maji, D.; Patel, V.K.; Verma, R.; Kalra, A. Enhancing artemisinin yields through an ecologically functional community of endophytes in Artemisia annua. Ind. Crop. Prod. 2020, 150, 112375. [Google Scholar] [CrossRef]
  16. Mezzasalma, V.; Sandionigi, A.; Guzzetti, L.; Galimberti, A.; Grando, M.; Tardaguila, J.; Labra, M. Geographical and cultivar features differentiate grape microbiota in Northern Italy and Spain vineyards. Front. Microbiol. 2018, 9, 946. [Google Scholar] [CrossRef]
  17. Yue, X.; Liu, S.; Wei, S.; Fang, Y.; Zhang, Z.; Ju, Y. Transcriptomic and metabolic analyses provide new insights into the effects of exogenous sucrose on monoterpene synthesis in “Muscat Hamburg” grapes. J. Agric. Food Chem. 2021, 69, 4164–4176. [Google Scholar] [CrossRef]
  18. Tian, M.; Ma, W.; Xia, N.; Peng, J.; Hu, R.; Duan, C.; He, F. Soil variables and reflected light revealed the plasticity of grape and wine composition: Regulation of the flavoromics under inner row gravel covering. Food Chem. 2023, 414, 135659. [Google Scholar] [CrossRef]
  19. Yue, X.; Ju, Y.; Cui, Y.; Wei, S.; Xu, H.; Zhang, Z. Evolution of green leaf volatile profile and aroma potential during the berry development in five Vitis vinifera L. Cultivars. Food Chem. X 2023, 18, 100676. [Google Scholar] [CrossRef]
  20. Ren, J.; Dong, G.; Yan, dh. Organs, cultivars, soil, and fruit properties affect structure of endophytic mycobiota of Pinggu peach trees. Microorganisms 2019, 7, 322. [Google Scholar] [CrossRef]
  21. Edgar, R.; Haas, B.; Clemente, J.; Quince, C.; Knight, R. Uchime improves sensitivity and speed of chimera detection. Bioinformatics 2011, 27, 2194–2200. [Google Scholar] [CrossRef] [PubMed]
  22. Liu, Y.; Chen, L.; Ma, T. Easy Amplicon: An easy-to-use, open-source, reproducible, and community-based pipeline for amplicon data analysis in microbiome research. iMeta 2023, 2, e83. [Google Scholar] [CrossRef] [PubMed]
  23. Chen, T.; Liu, Y.; Huang, L. ImageGP: An easy-to-use data visualization web server for scientific researchers. iMeta 2022, 1, e5. [Google Scholar] [CrossRef] [PubMed]
  24. Qiao, Y.; Wang, T.; Huang, Q.; Hanyue, G.; Zhang, H.; Xu, Q.; Shen, Q.; Ling, N. Core species impact plant health by enhancing soil microbial cooperation and network complexity during community coalescence. Soil Biol. Biochem. 2024, 188, 109231. [Google Scholar] [CrossRef]
  25. Yue, X.; Wang, S.; Dong, Y.; Chen, W.; Wang, Y.; Xu, H.; Zhang, Z.; Fang, Y.; Ju, Y. Targeted metabolomics analysis based on HS-SPME-GC-MS to discriminate geographical origin of ‘Muscat Hamburg’ grape and wine. Food Res. Int. 2024, 181, 114120. [Google Scholar] [CrossRef]
  26. Xie, S.; Lei, Y.; Wang, Y.; Wang, X.; Ren, R.; Zhang, Z. Influence of continental climates on the volatile profile of Cabernet Sauvignon grapes from five Chinese viticulture regions. Plant Growth Regul. 2019, 87, 83–92. [Google Scholar] [CrossRef]
  27. Aleynova, O.; Nityagovsky, N.; Ananev, A.; Suprun, A.; Ogneva, Z.; Dneprovskaya, A.; Beresh, A.; Dubrovina, A.; Chebukin, P.; Kiselev, K. Bacterial and fungal endophytes of grapevine cultivars growing in Primorsky Krai of Russia. Horticulturae 2023, 9, 1257. [Google Scholar] [CrossRef]
  28. Wijekoon, C.; Quill, Z. Fungal endophyte diversity in table grapes. Can. J. Microbiol. 2020, 67, 29–36. [Google Scholar] [CrossRef]
  29. Compant, S.; Clément, C.; Sessitsch, A. Plant growth-promoting bacteria in the rhizo- and endosphere of plants: Their role, colonization, mechanisms involved and prospects for utilization. Soil Biol. Biochem. 2010, 42, 669–678. [Google Scholar] [CrossRef]
  30. Liu, D.; Howell, K. Community succession of the grapevine fungal microbiome in the annual growth cycle. Environ. Microbiol. 2020, 23, 1842–1857. [Google Scholar] [CrossRef]
  31. Li, Y.; Jin, J.; Li, P.; Wang, Q.; Xu, L.; Wei, G. Regional variations and plant compartments shape the community structures of the endophytic microbiome and secondary metabolites of Astragalus mongholicus. Ind. Crops Prod. 2023, 192, 116037. [Google Scholar] [CrossRef]
  32. Trivedi, P.; Leach, J.; Tringe, S.; Sa, T.; Singh, B. Plant–microbiome interactions: From community assembly to plant health. Nat. Rev. Microbiol. 2020, 18, 607–621. [Google Scholar] [CrossRef] [PubMed]
  33. Gobbi, A.; Acedo, A.; Imam, N.; Santini, R.; Ortiz Álvarez, R.; Ellegaard-Jensen, L.; Belda, I.; Hansen, L. A global microbiome survey of vineyard soils highlights the microbial dimension of viticultural terroirs. Commun. Biol. 2022, 5, 241. [Google Scholar] [CrossRef] [PubMed]
  34. Nguyen, M.; Lehosmaa, K.; Toth, K.; Koskimäki, J.; Häggman, H.; Pirttilä, A. Weather in two climatic regions shapes the diversity and drives the structure of fungal endophytic community of bilberry (Vaccinium myrtillus L.) fruit. Environ. Microbiome 2024, 19, 7. [Google Scholar] [CrossRef]
  35. Banerjee, S.; Schlaeppi, K.; van der Heijden, M. Keystone taxa as drivers of microbiome structure and functioning. Nat. Rev. Microbiol. 2018, 16, 567–576. [Google Scholar] [CrossRef] [PubMed]
  36. Liu, J.; Abdelfattah, A.; Wasserman, B.; Wisniewski, M.; Droby, S.; Fazio, G.; Mazzola, M.; Wu, X. Contrasting effects of genotype and root size on the fungal and bacterial communities associated with apple rootstocks. Hortic. Res. 2022, 9, 1842–1857. [Google Scholar] [CrossRef]
  37. Liu, Y.; Chu, G.; Stirling, E.; Zhang, H.; Chen, S.; Xu, C.; Zhang, X.; Ge, T.; Wang, D. Nitrogen fertilization modulates rice seed endophytic microbiomes and grain quality. Sci. Total Environ. 2023, 857, 159181. [Google Scholar] [CrossRef]
  38. Coleman-Derr, D.; Desgarennes, D.; Fonseca, C.; Gross, S.; Clingenpeel, S.; Woyke, T.; North, G.; Visel, A.; Partida Martinez, L.; Tringe, S. Plant compartment and biogeography affect microbiome composition in cultivated and native agave species. New Phytol. 2015, 209, 798–811. [Google Scholar] [CrossRef]
  39. Qin, D.; You, C.; Lan, W.; Wang, Y.; Yu, B.; Peng, Y.; Xu, J.; Dong, J. Microbial assemblages of schisandraceae plants and the correlations between endophytic species and the accumulation of secondary metabolites. Plant Soil 2023, 483, 85–107. [Google Scholar] [CrossRef]
  40. Wang, H.; Guo, D.; Zhang, M.; Wu, G.; Shi, Y.; Zhou, J.; Ding, N.; Chen, X.; Li, X. Correlation study on microbial communities and volatile flavor compounds in Cigar Tobacco leaves of diverse origins. Appl. Microbiol. Biotechnol. 2024, 108, 236. [Google Scholar] [CrossRef]
  41. Miao, S.; Xia, Y.; Cui, J.; Wang, J.; Wang, M. Correlation analysis between differential metabolites and bacterial endophytes of Ephedra Sinica in different years. Ind. Crops Prod. 2022, 175, 114250. [Google Scholar] [CrossRef]
  42. He, X.; Wang, D.; Jiang, Y.; Li, M.; Delgado-Baquerizo, M.; McLaughlin, C.; Marcon, C.; Guo, L.; Baer, M.; Moya, Y. Heritable microbiome variation is correlated with source environment in locally adapted maize varieties. Nat. Plants 2024, 10, 598–617. [Google Scholar] [CrossRef] [PubMed]
Figure 1. Sample-collection diagram. The geographical distribution of two sampling sites in China (A); the location of sampling points in the Ningxia region (B); the location of sampling points in the Shanxi region (C).
Agronomy 14 02186 g001
Figure 2. Dynamic changes of volatile aroma compounds concentrations during grape ripening at two different regions. Total concentration of free aroma (A) and bound aroma (B). Principal coordinate analysis (PCoA) based on Bray–Curtis and weighted UniFrac showing the geographical distance of free aroma (C) and bound aroma (D) at two regions, respectively. Heat map of free aroma (E) and bound aroma (F). NXF, grapes from the Ningxia region; SXF, grapes from the Shanxi region. Grape samples collected at the E-L 35 stage (NXF1 and SXF1), at the E-L 37 stage (NXF2 and SXF2), and at the E-L 38 stage (NXF3 and SXF3).
Agronomy 14 02186 g002
Figure 3. The microbial community diversity of grape berries during ripening at two different regions. The Shannon indexes of bacteria (A) and fungi (B) showing alpha diversity of microbial communities, with results expressed as median ± SD of five biological replicates; ****, p < 0.0001. Principal coordinate analysis (PCoA) based on Bray–Curtis and weighted UniFrac showing the beta diversity of bacterial (C) and fungal (D) communities, respectively. NXF, grapes from the Ningxia region; SXF, grapes from the Shanxi region. Grape samples collected at the E-L 35 stage, at the E-L 37 stage, and at the E-L 38 stage, respectively.
Agronomy 14 02186 g003
Figure 4. The microbial community structure of grapes during ripening. Barplots showing the bacteria (A) and fungi (B) community composition characterized to the genus level (showing top 10). Venn diagrams showing the shared and unique OTUs of bacteria (C) and fungi (D). The significant differences of bacterial (E) and fungal (F) genera relative abundances between two different regions. ***, p < 0.001; **, p < 0.01; *, p < 0.05. NXF (NXF1, NXF2, NXF3), grapes from the Ningxia region; SXF (SXF1, SXF2, and SXF3), grapes from the Shanxi region. Grape samples collected at the E-L 35 stage (NXF1 and SXF1), at the E-L 37 stage (NXF2 and SXF2), and at the E-L 38 stage (NXF3 and SXF3).
Agronomy 14 02186 g004
Figure 5. Co-occurrences network of the bacterial communities in Ningxia (A) and Shanxi (B), and fungal communities in Ningxia (C) and Shanxi (D), respectively. The connections (edges) between nodes represents strong correlation (Spearman’s |r| > 0.7 and p < 0.01). The nodes represent taxa at different genus levels, and the size of each node is proportional to the number of connections (i.e., degrees). The nodes were colored according to different types of modularity classes at the phylum level. For interpretation of the references to color in this figure legend, the reader is referred to the web version of this article.
Agronomy 14 02186 g005
Figure 6. Identification of core species. The SPEC-OCCU plots of the bacterial network show 1594 most abundant OTUs in each habitat type; the x-axis represents occupancy: how well an OTU is distributed in NXF or SXF; and the y-axis represents specificity: whether they are also found in other regions. Here, to find specialist species attributable to NXF (A) or SXF (B), we selected OTUs with specificity and occupancy greater than or equal to 0.7. The Zi-Pi method to reveal core hubs of bacterial networks in NXF (C) and SXF (D). Screening for core species based on “Shared OTUs”, “Specialist OTUs”, and “Keystone nodes” in NXF (E) and SXF (F). The relative abundance of core species identified in the NXF (I) and SXF (G,H) bacterial network. Specificity is defined as the ratio of the average abundance of a species in a habitat and the sum of the average abundance of each habitat of this species across all habitats; that is, a higher specificity indicates that the species is specific to a habitat type relative to other habitats. Occupancy is defined as the ratio of the number of samples in which the species is present to the total number of samples in a habitat; that is, a higher occupancy indicates that the species is common in the habitat [24]. NXF, grapes from the Ningxia region; SXF, grapes from the Shanxi region.
Agronomy 14 02186 g006
Figure 7. Correlation analysis between abundant bacterial and fungal taxa and volatiles (free aroma and bound aroma) during grape ripening at two different regions. Summary of significantly positive- and negative- related volatiles (A). Correlation networks based on Spearman pairwise coefficients (|r| > 0.6 and p < 0.05) (B), with red and green lines representing positive and negative correlations, respectively. VIP (pred) (variable importance in projection) values of bacterial and fungal taxa (relative abundance > 0.1%) correlated with free aroma (C1) and bound aroma (C2) based on O2PLS analysis (microbial taxa, X; volatile compounds, Y). FA, free aroma; BA, bound aroma; F, fungi; B, bacteria. For interpretation of the references to color in this figure legend, the reader is referred to the web version of this article.
Agronomy 14 02186 g007
Disclaimer/Publisher’s Note: The statements, opinions and data contained in all publications are solely those of the individual author(s) and contributor(s) and not of MDPI and/or the editor(s). MDPI and/or the editor(s) disclaim responsibility for any injury to people or property resulting from any ideas, methods, instructions or products referred to in the content.

