Article

Design and Testing of a Fruit Tree Variable Spray System Based on ExG-AABB

by
Daozong Sun
1,2,3,
Zhiwei Quan
1,
Peiran Wu
4,
Weikang Liu
1,
Xiuyun Xue
1,2,3,*,
Shuran Song
1,2,3,
Jiaxing Xie
1,2,3 and
Sheng Jiang
1,2,3
1
College of Electronic Engineering (College of Artificial Intelligence), South China Agricultural University, Guangzhou 510642, China
2
Guangzhou Key Laboratory for Agricultural Information Acquisition and Application, Guangzhou 510642, China
3
Guangdong Provincial Agricultural Information Monitoring Engineering Technology Research Center, Guangzhou 510642, China
4
Beacon House, University of Bristol, Queens Road, Bristol BS8 1BU, UK
*
Author to whom correspondence should be addressed.
Agronomy 2024, 14(10), 2199; https://doi.org/10.3390/agronomy14102199
Submission received: 9 August 2024 / Revised: 19 September 2024 / Accepted: 20 September 2024 / Published: 25 September 2024
(This article belongs to the Section Precision and Digital Agriculture)

Abstract

:
This paper addresses the issue of pesticide waste and low utilization rates resulting from traditional plant protection via spraying operations, which apply equal dosages to different targets or to different parts of the same target. To tackle this problem, we designed a variable fruit tree spraying system based on the ExG-AABB (excess green and axis-aligned bounding box) algorithm. We used a Kinect depth camera to capture information about the fruit tree canopy and constructed a spray flow model using pulse width modulation and variable spray control technology. Variable multi-nozzle spraying was guided by combining this canopy data. We evaluated the accuracy of each model in calculating canopy volume by comparing the coefficient of determination (R2) and root mean square error (RMSE) of the ExG-AABB with the slice convex hull method, voxel method, three-dimensional alpha-shape method, and QuickHull method. The ExG-AABB algorithm had the highest R2 value (0.9334) and the lowest RMSE value (0.0353 m3) among the five models, indicating that it most accurately reflects the true volume of the fruit tree canopy. This validates the effectiveness of the ExG-AABB algorithm in calculating canopy volume. We established a correlation model between canopy volume and spray volume, designed a canopy-adaptive layering method based on point cloud processing, and achieved precise calculation of nozzle flow. Comparative field experiments were conducted to analyze the spray coverage rate and observed flow, thereby evaluating the spraying effect of this variable spraying system. The experimental results showed that compared to conventional continuous spraying, this variable spraying system not only achieves more uniform spray coverage but also significantly reduces pesticide usage by 48.1%. Furthermore, through system optimization, the average coverage rate of the middle layer of the canopy decreased by 17.53%, effectively reducing the phenomenon of overlapping spraying from multiple nozzles and improving spraying efficiency.

1. Introduction

The utilization of precision pesticide application technology holds substantial potential for enhancing the efficient use of pesticides, mitigating environmental pollution, and fostering the growth of plant protection agriculture. A significant component of this technology is variable spray technology, which achieves precise control over spray equipment by gathering environmental data and employing advanced control techniques, thereby facilitating a higher level of intelligent pesticide application [1,2]. Variable spray systems not only decrease the quantity of pesticide used and prevent liquid waste but also dynamically adjust the nozzle’s spray flow rate based on real-time environmental data to cater to the requirements of different crops, thereby improving the spraying effect. In orchards, the efficient and real-time acquisition of information on tree canopy characteristics is crucial for guiding variable spray technology [3,4].
Traditional methods of acquiring canopy information, such as ground surveys and vegetation plot investigations, often necessitate the use of substantial time and manpower resources and are geographically constrained [5]. The amalgamation of two-dimensional image processing and three-dimensional point-cloud processing technologies holds considerable potential for variable spray control systems in contemporary agriculture, offering comprehensive canopy data with enhanced efficiency [6]. In the realm of two-dimensional image processing, Hu Lian et al. [7] introduced the excess green (ExG) algorithm, which has demonstrated exemplary performance in crop identification, achieving accuracy rates of 95.8% in cotton seedling identification and 100% in lettuce seedling identification. This underscores the algorithm’s efficacy in extracting two-dimensional canopy information. The classification and recognition techniques for three-dimensional point clouds primarily encompass methods rooted in geometric features, statistical features, machine learning, deep learning, and graphics. Each technique possesses its unique strengths and weaknesses, making them suitable for varying application contexts. For instance, methods centered on geometric and statistical features prioritize traditional feature extraction and matching, whereas those based on machine learning and deep learning capitalize on extensive data training to process complex point-cloud data with heightened precision. Hu et al. [8,9] presented a novel large-scene semantic segmentation framework, RandLA-Net2, at CVPR 2020 and CVPR 2021, which exhibited remarkable performance on actual large-scene datasets. In comparison to the conventional PointNet approach, RandLA-Net demonstrated notable enhancements of 18.57% and 8.95% in the mean accuracy (mAcc) and mean intersection over union (mIoU) metrics, respectively. This suggests its potential for large-scale agricultural production information gathering. Nonetheless, the method necessitates approximately 600 work hours for data collection, model training, and segmentation labeling, which is notably constraining for small-scale agricultural operations. Consequently, for scenarios with a limited variety of three-dimensional point cloud objects, there is a need for an efficient classification technique that obviates extensive manual annotation. The machine learning classification method proposed by Li Haiting et al. [10] could be a viable solution. Once canopy data have been gathered, they require processing. Predominantly, scholars employ techniques like alpha-shape methods, convex hull algorithms, and cube grid methods for canopy volume estimation [11,12]. While these three-dimensional point-cloud volume computation methods offer high accuracy and the adept representation of intricate spatial structures, they also present challenges such as elevated computational demands, stringent data quality prerequisites, and vulnerability to environmental noise and sensor discrepancies.
In light of the aforementioned challenges, this paper employs a depth camera to ascertain the parameters of the fruit tree canopy. It synergizes two-dimensional image processing with three-dimensional point cloud techniques for an integrated analysis of multi-source heterogeneous data. By merging the spray flow model with these analytical outcomes, the derived canopy data inform the variable spray system’s operations. Notably, compared to relying on a singular data source, leveraging multi-source heterogeneous data fusion offers a more exhaustive and precise representation of the canopy.

2. Materials and Methods

2.1. Test Equipment

The vehicle-mounted system used here operates within a speed range of 0 to 2 m/s, adjustable by manipulating the motor. It is outfitted with a water tank holding 10 L and a flow meter for the real-time monitoring of spray volume. The aluminum alloy straight rod is outfitted with three variable nozzles. Each nozzle comprises a JJXP-010-PVDF conical atomizing nozzle, manufactured by H. Ikeuchi & Co., Ltd., Nishi-ku, Osaka, Japan. and a 2W025-08-DC12V-type solenoid valve from Zhejiang Delixi Group Co., Ltd. in China. The working pressure range for these nozzles is between 0.1 and 1 MPa. Furthermore, the system incorporates a depth camera model, Azure Kinect DK, to gather precise canopy data to enhance the spraying efficacy. Figure 1 illustrates the installation of the vehicle-mounted system.
The personal computer utilized in the experiment boasts an Intel 12th generation Core i5-12400F processor, a system memory capacity of 32 GB, a solid-state drive with a storage size of 1 TB, and a graphics card featuring a video memory size of 12 GB. The image processing was executed using the OpenCV 4.5.3 cross-platform computer vision library, while development was conducted within the PyCharm 2021.1.1 integrated development environment. The visualization of three-dimensional point clouds was successfully achieved through the use of CloudCompare v2.10.2.

2.2. Test Object

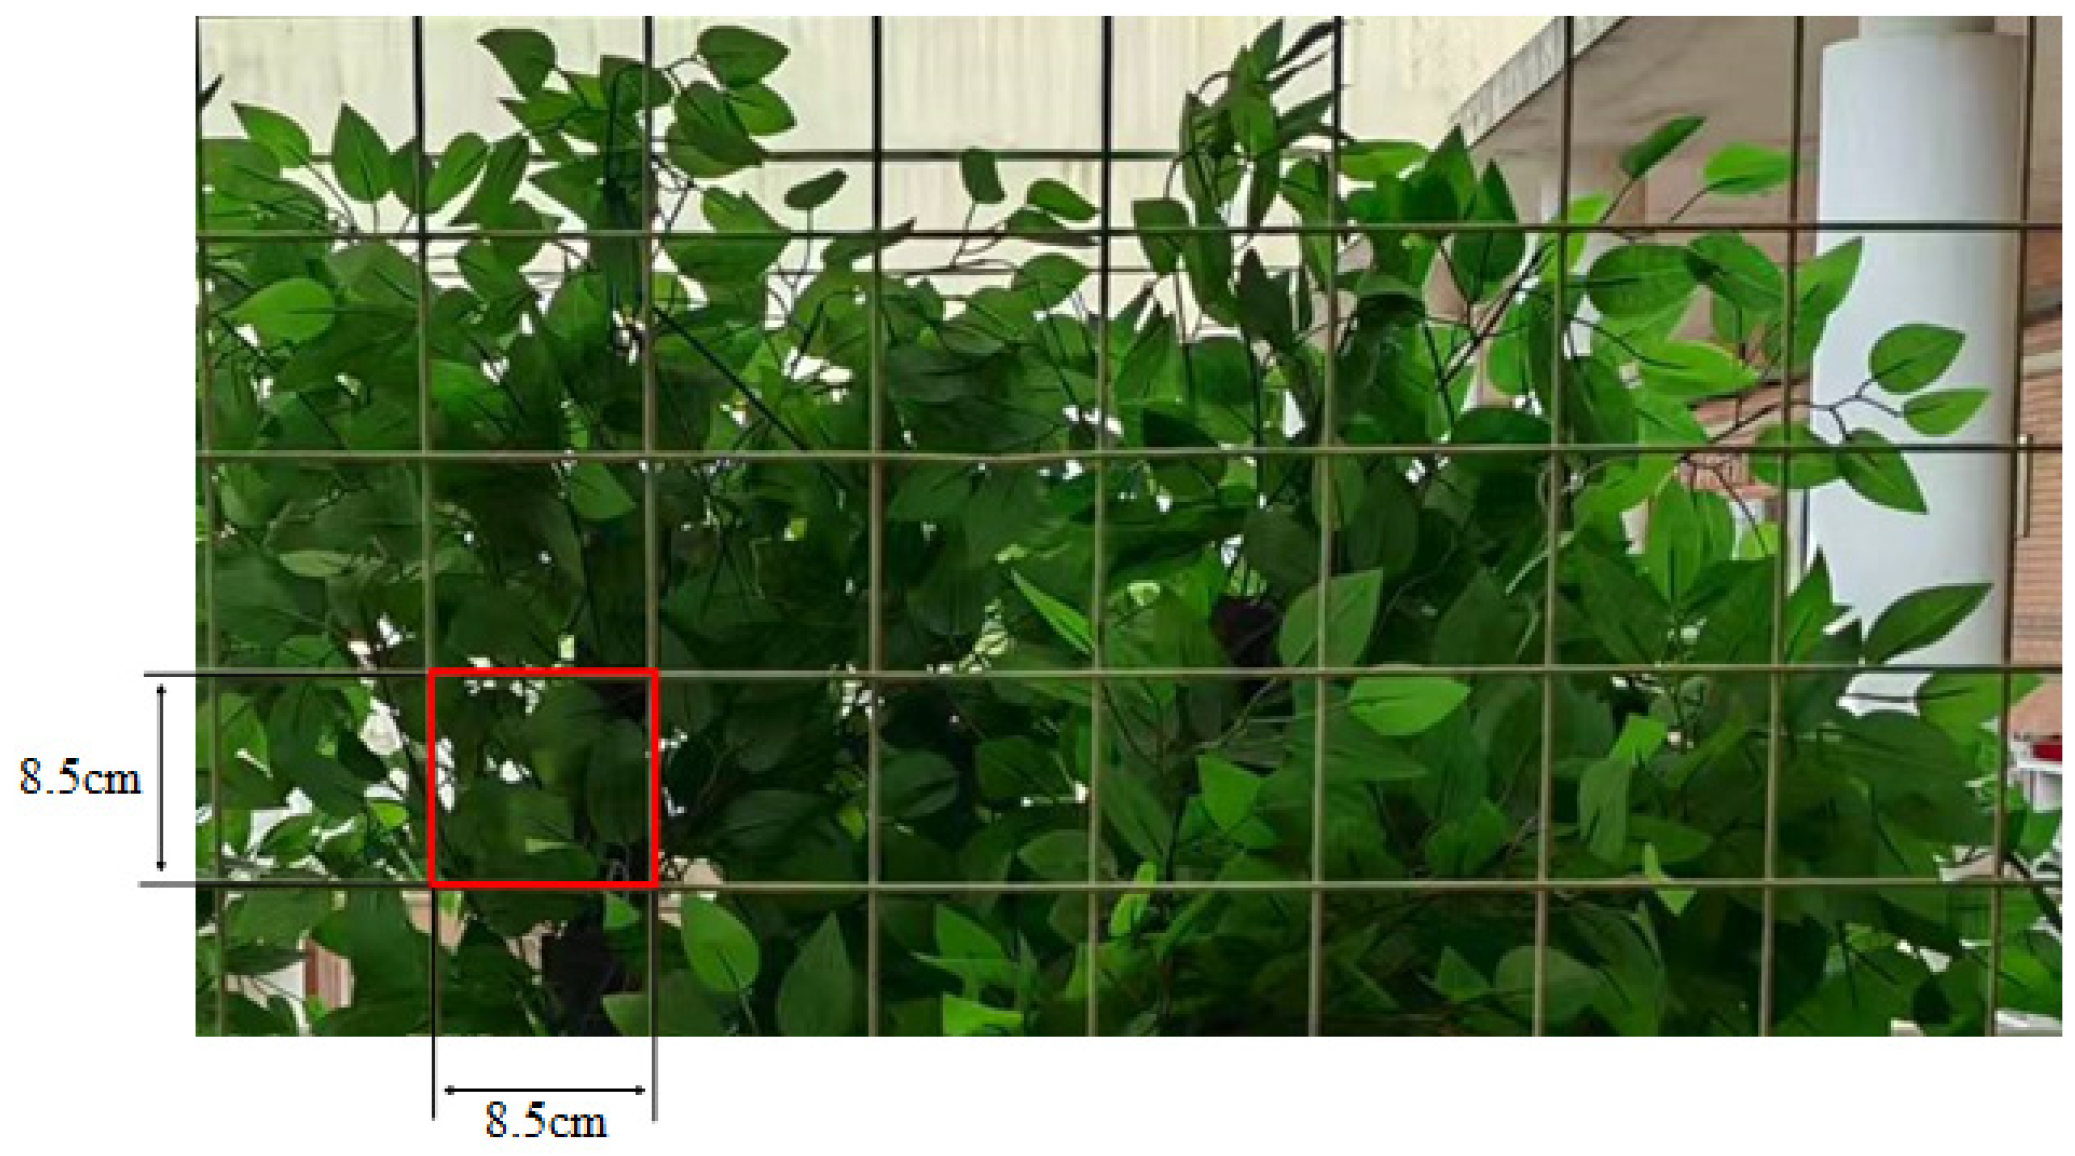
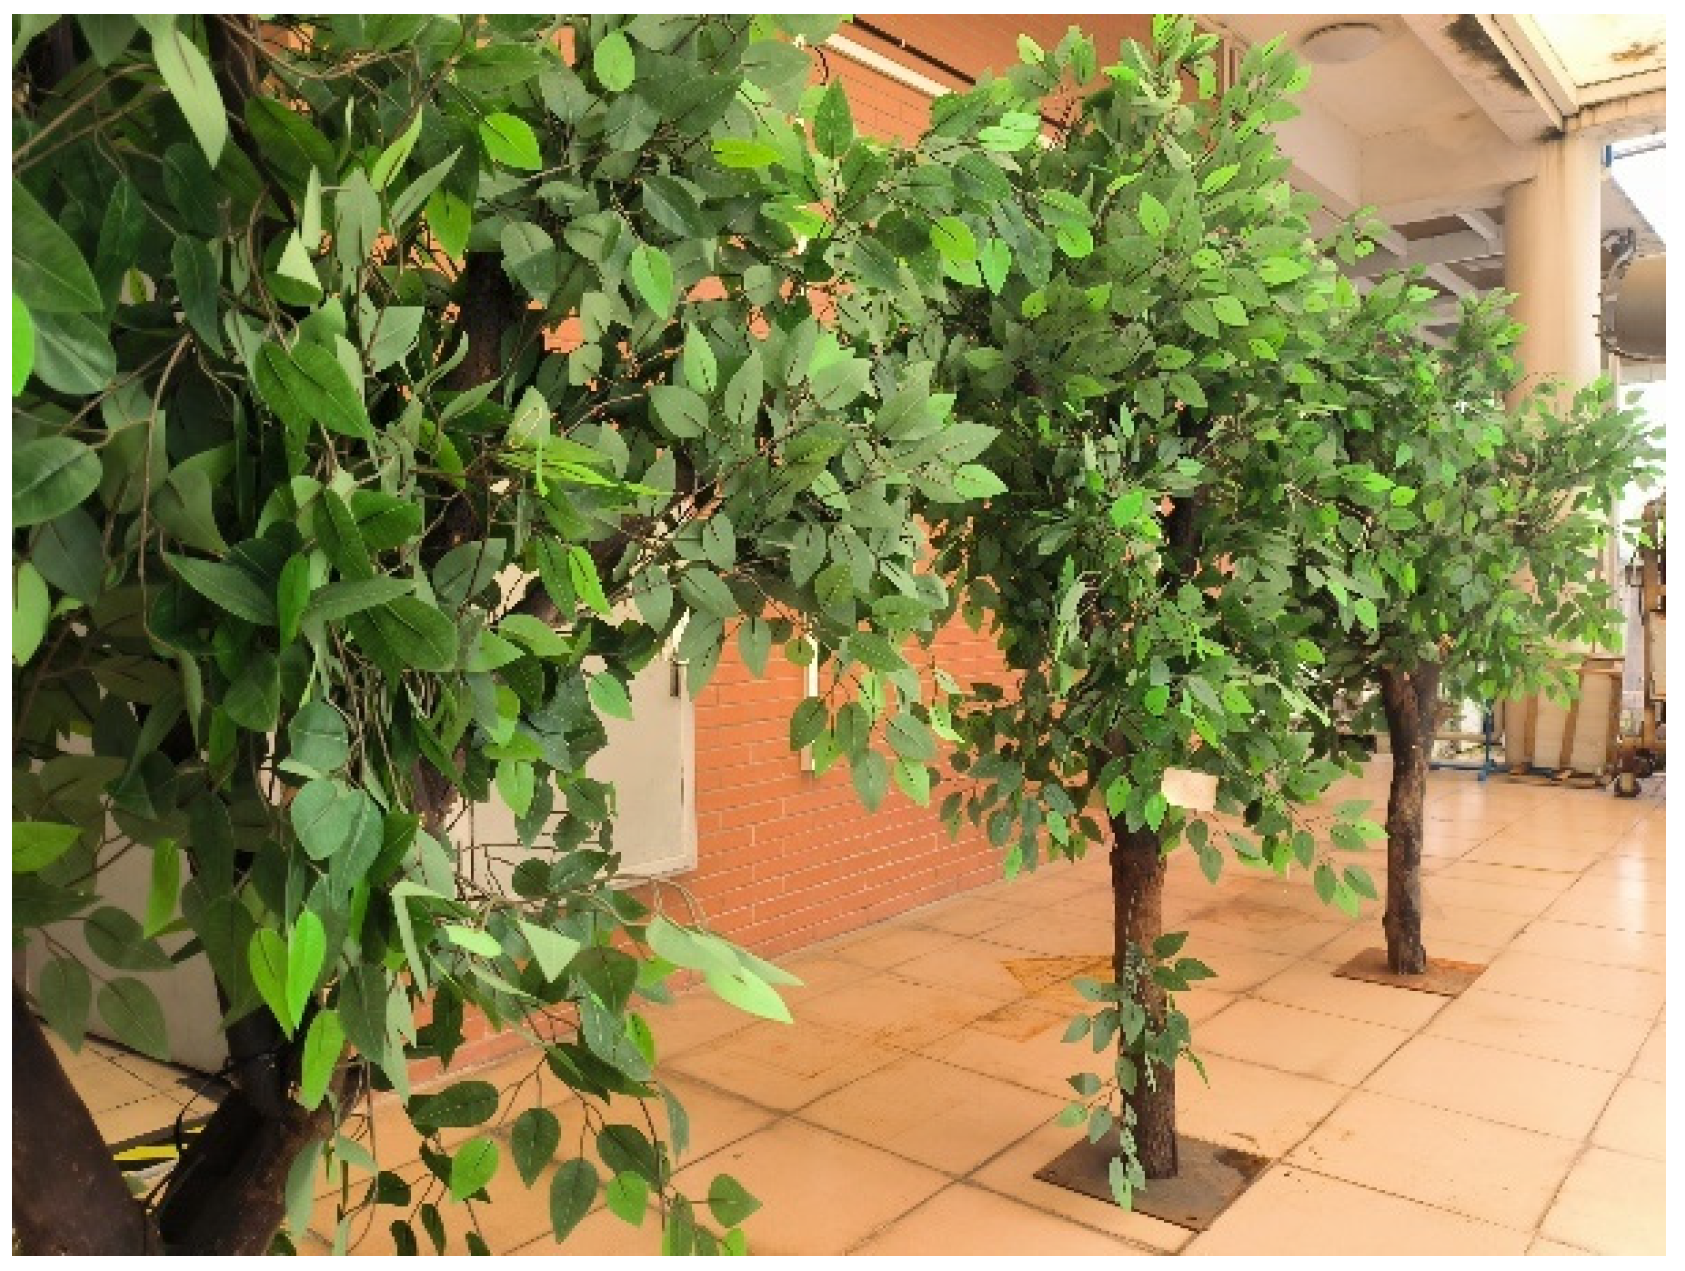
This paper aimed to validate the accuracy of the leaf wall area (LWA) and volume calculations derived from machine vision. Data were collected from 30 real trees with varying crown shapes at the Guangdong Academy of Agricultural Sciences Fruit Tree Research Institute, which served as the dataset for the algorithm model. During manual measurements of LWA and volume, the crown was segmented into units measuring 8.5 cm in both height and width from the bottom to the top, in both vertical and horizontal directions. If a unit’s height or width was insufficient at the edge, measurements were taken according to the actual dimensions. The leaf wall area was determined by summing the area of each unit, while the crown volume was calculated by averaging three measurements of the thickness of each crown unit. This average thickness was then multiplied by the corresponding unit area to calculate the crown volume of each unit, which was subsequently added together to obtain the total fruit tree crown volume. The actual manual measurements are presented in Figure 2. To assess the real-time spraying effect of the variable spray system under different crown volumes and to ensure the controllability of experimental conditions and objectivity of results, three simulated trees with significantly different crown volumes were selected for the experiment. Their manually measured one-sided crown volumes were 0.441 m3, 0.242 m3, and 0.326 m3, respectively. The choice of relatively larger trees was made to better match the height and configuration of the spray equipment. During testing, all three nozzles needed to be activated to accurately record spray usage with a flow meter. Smaller trees generally do not require all nozzles to be activated, which could affect data uniformity and comparability. The simulated trees in the orchard are depicted in Figure 3.

2.3. Experimental Design and Method

2.3.1. Data Collection and Preprocessing of the Fruit Tree Canopy

The authors employed a Kinect depth camera to capture both RGB and depth images for efficient canopy data processing using machine learning algorithms. The single shot multibox detector (SSD) [13], a single-stage object detection algorithm, was used to detect and classify objects directly from the images. SSD identifies the canopy region using bounding boxes, which are then used to crop the image accordingly.
To differentiate fruit tree canopies from environmental noise, the excess green algorithm (ExG) [6] is applied. This algorithm effectively extracts plant images by reducing background interference such as shadows, buildings, and the ground. The computational basis is given in Equation (1).
E x G = 2 G R B
In the equation, R, G, and B signify the pixel values corresponding to the red, green, and blue channels, respectively.
The algorithm conducts threshold division between the canopy segment and the background area, systematically examining and contrasting the grayscale values of each pixel within the two-dimensional image. Depending on the outcomes of these comparisons, each pixel is subsequently categorized as either plant or background. This paper employs Otsu’s thresholding method (Otsu) [14,15] to autonomously determine the optimal threshold. The classification equation is delineated in Equation (2).
F = 255     E x G T 0               E x G T
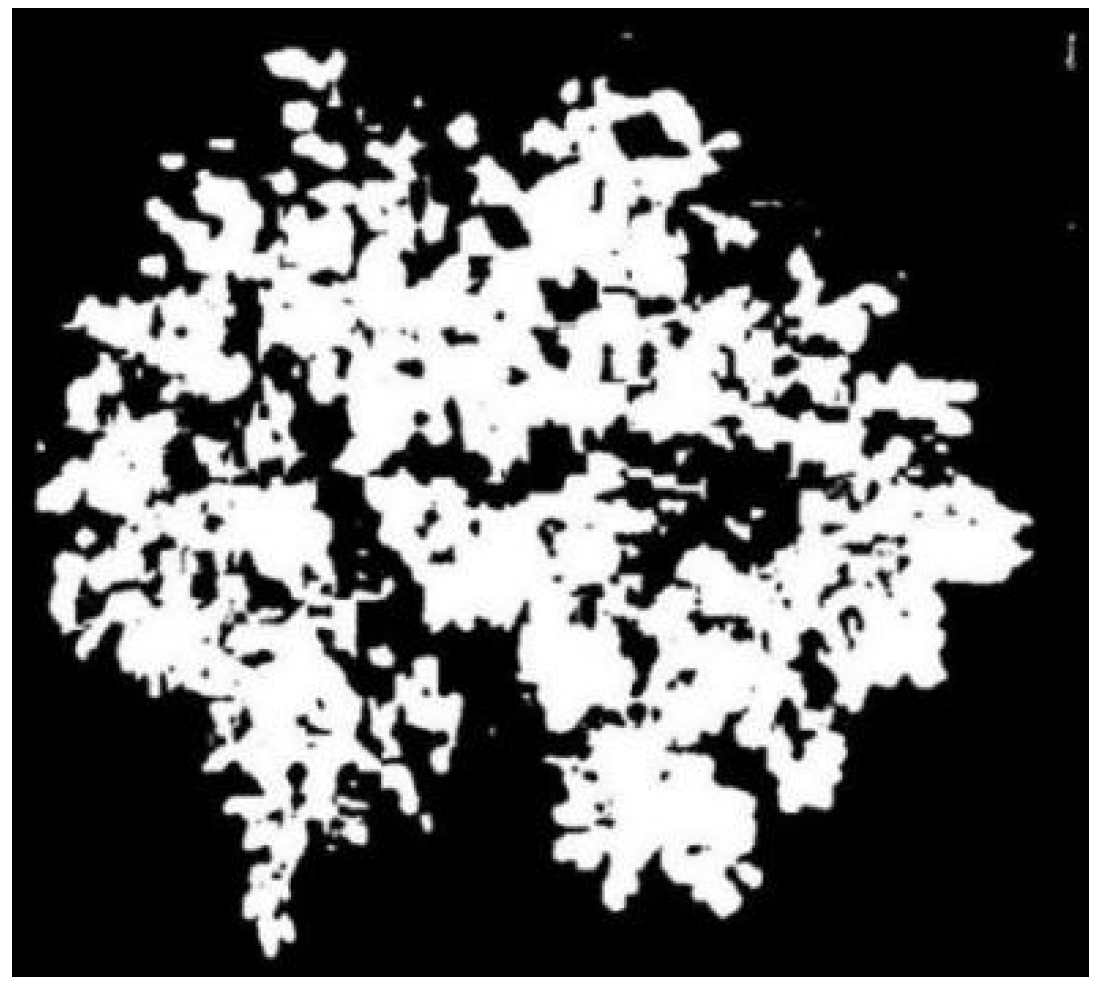
In the equation, F = 0 represents the background noise (black) and F = 255 represents the green canopy region (white). The processed image is shown in Figure 4.
The authors converted RGB-D images from a depth camera into 3D canopy point clouds. Canopy point clouds are extracted using two key parameters: point roughness and scattering index [16]. Point cloud roughness measures surface smoothness to reflect the texture of leaves and branches, while the scattering index assesses spatial distribution by calculating the eigenvalues of the covariance matrix. A higher scattering index indicates greater dispersion and more complex surface structures.
The calculation of point cloud roughness is based on the K-nearest neighbors method. The experiment involves approximating a dense point cloud into a vast set of points, identifying a plane for this set that is denoted as x 1 y 1 z 1 x 2 y 2 z 2 x n y n z n , which encompasses n points. This plane is then defined as z = a x + b y + c . Subsequently, a plane is fitted using the least-squares principle [17] (also known as the method of least squares). The minimum value is determined according to Equation (3).
i = 1 n ( z i z ) 2 = i = 1 n ( z i ( a x i + b y i + c ) ) 2
Let v i = z i z , and V = [ v 1 v 2 v n ] T . The objective is to achieve the minimum value of the inner product of V and its transpose, denoted as V T V . Based on Equation (3), when B = x 1 y 1 1 x 2 y 2 1 x n y n 1 , x = a b c , L = z 1 z 2 z n , this can be derived using Equation (4).
V = B x L
The function extremum is solved according to Equation (5).
V T V x = 2 V T V x = V T B = 0
Upon substituting V = B x L into Equation (5), a solution is obtained as x = ( B T B ) 1 B T L . This substitution is then applied to Equation (4) to yield V (m3). The final computation involves calculating the average of the sum of the squares of distances from all points in the given point set to this plane along the Z axis, which is represented by V T V n .
In real-world field applications, the background information frequently deviates from being entirely planar. This deviation can result in inaccurate roughness calculation outcomes. To mitigate this challenge, this paper employs the K-nearest neighbors (K-NN) algorithm. This method focuses solely on identifying the nearest n neighborhood points on the local surface of the point cloud, ensuring that all points utilized in the computation originate from a planar region. Consequently, this approach effectively bypasses potential inaccuracies introduced by non-planar regions in comprehensive point cloud calculations, thereby enhancing the precision and stability of the computation.
To accurately assess the roughness of point cloud surfaces, it is necessary to extract and analyze a range of data pertaining to the surface characteristics. The specific calculation process involves several steps. Firstly, we assume that the three-dimensional point cloud set is represented by:
A = P i | i = 1,2 , . . . , n
P i = ( x i , y i , z i )
The neighborhood of a 3D point P i is:
N i = { P j | d i s t a n c e ( p j p i ) < δ }
According to Equation (8), we can calculate P i as the neighborhood of the N i (centroid of the neighborhood).
P ¯ = 1 n P i
After obtaining the P ¯ value, we use it in Equation (9) to calculate the neighborhood covariance matrix of P i .
C = P 1 P ¯ P i P ¯ T P 1 P ¯ P i P ¯
The covariance matrix C derived from Equation (9) can then be used to calculate the eigenvectors using Equation (10).
λ = λ 1 λ 2 λ 3 ( λ 3 < λ 2 < λ 1 )
Utilizing Equation (11), the divergence index of the point clouds is computed to provide a quantitative assessment of the point cloud surface’s roughness.
S λ = λ 3 λ 1
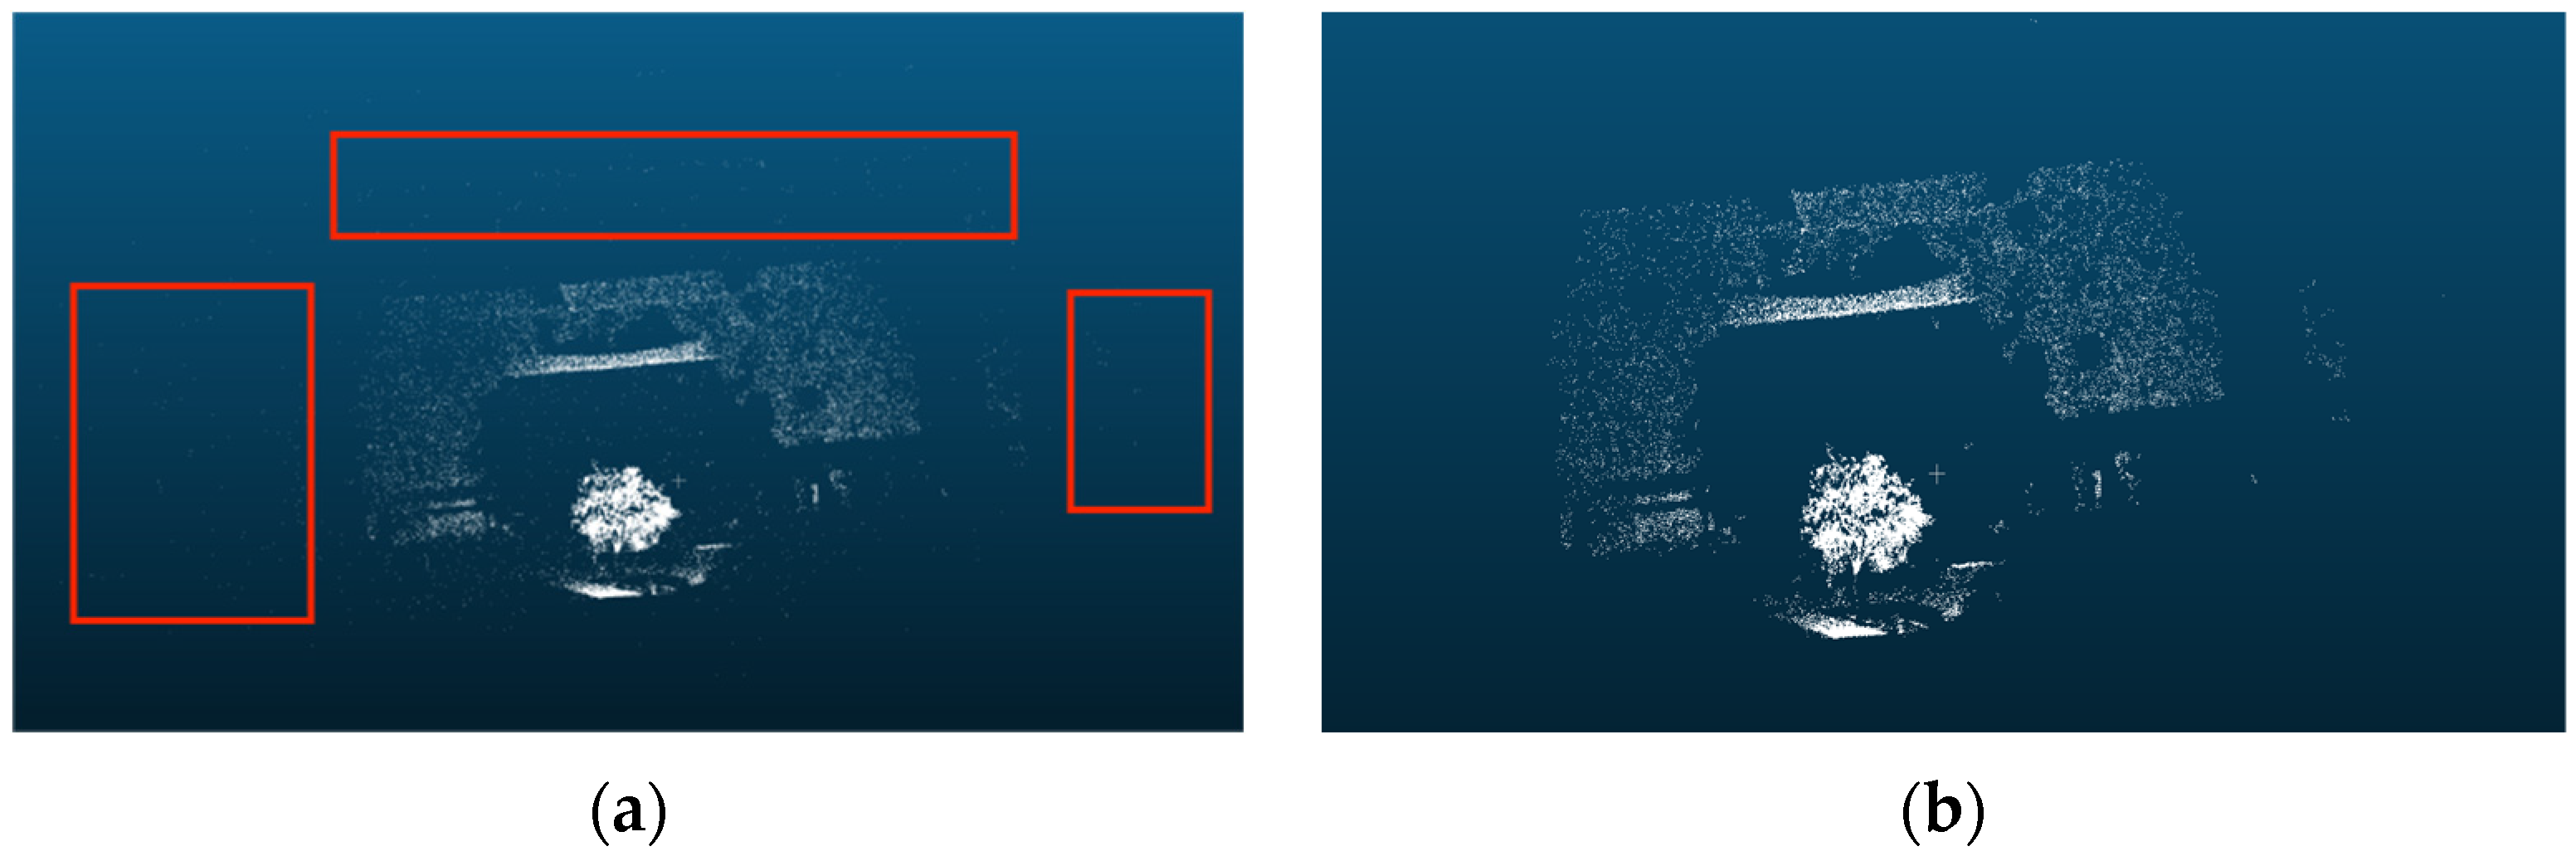
The three-dimensional point cloud images are often marred by various noises. To ensure the accuracy of subsequent classification, the experiment employs statistical filtering on the collected point clouds to eliminate isolated outliers. Figure 5 illustrates this process; the red box in (a) signifies the isolated outlier point cloud.
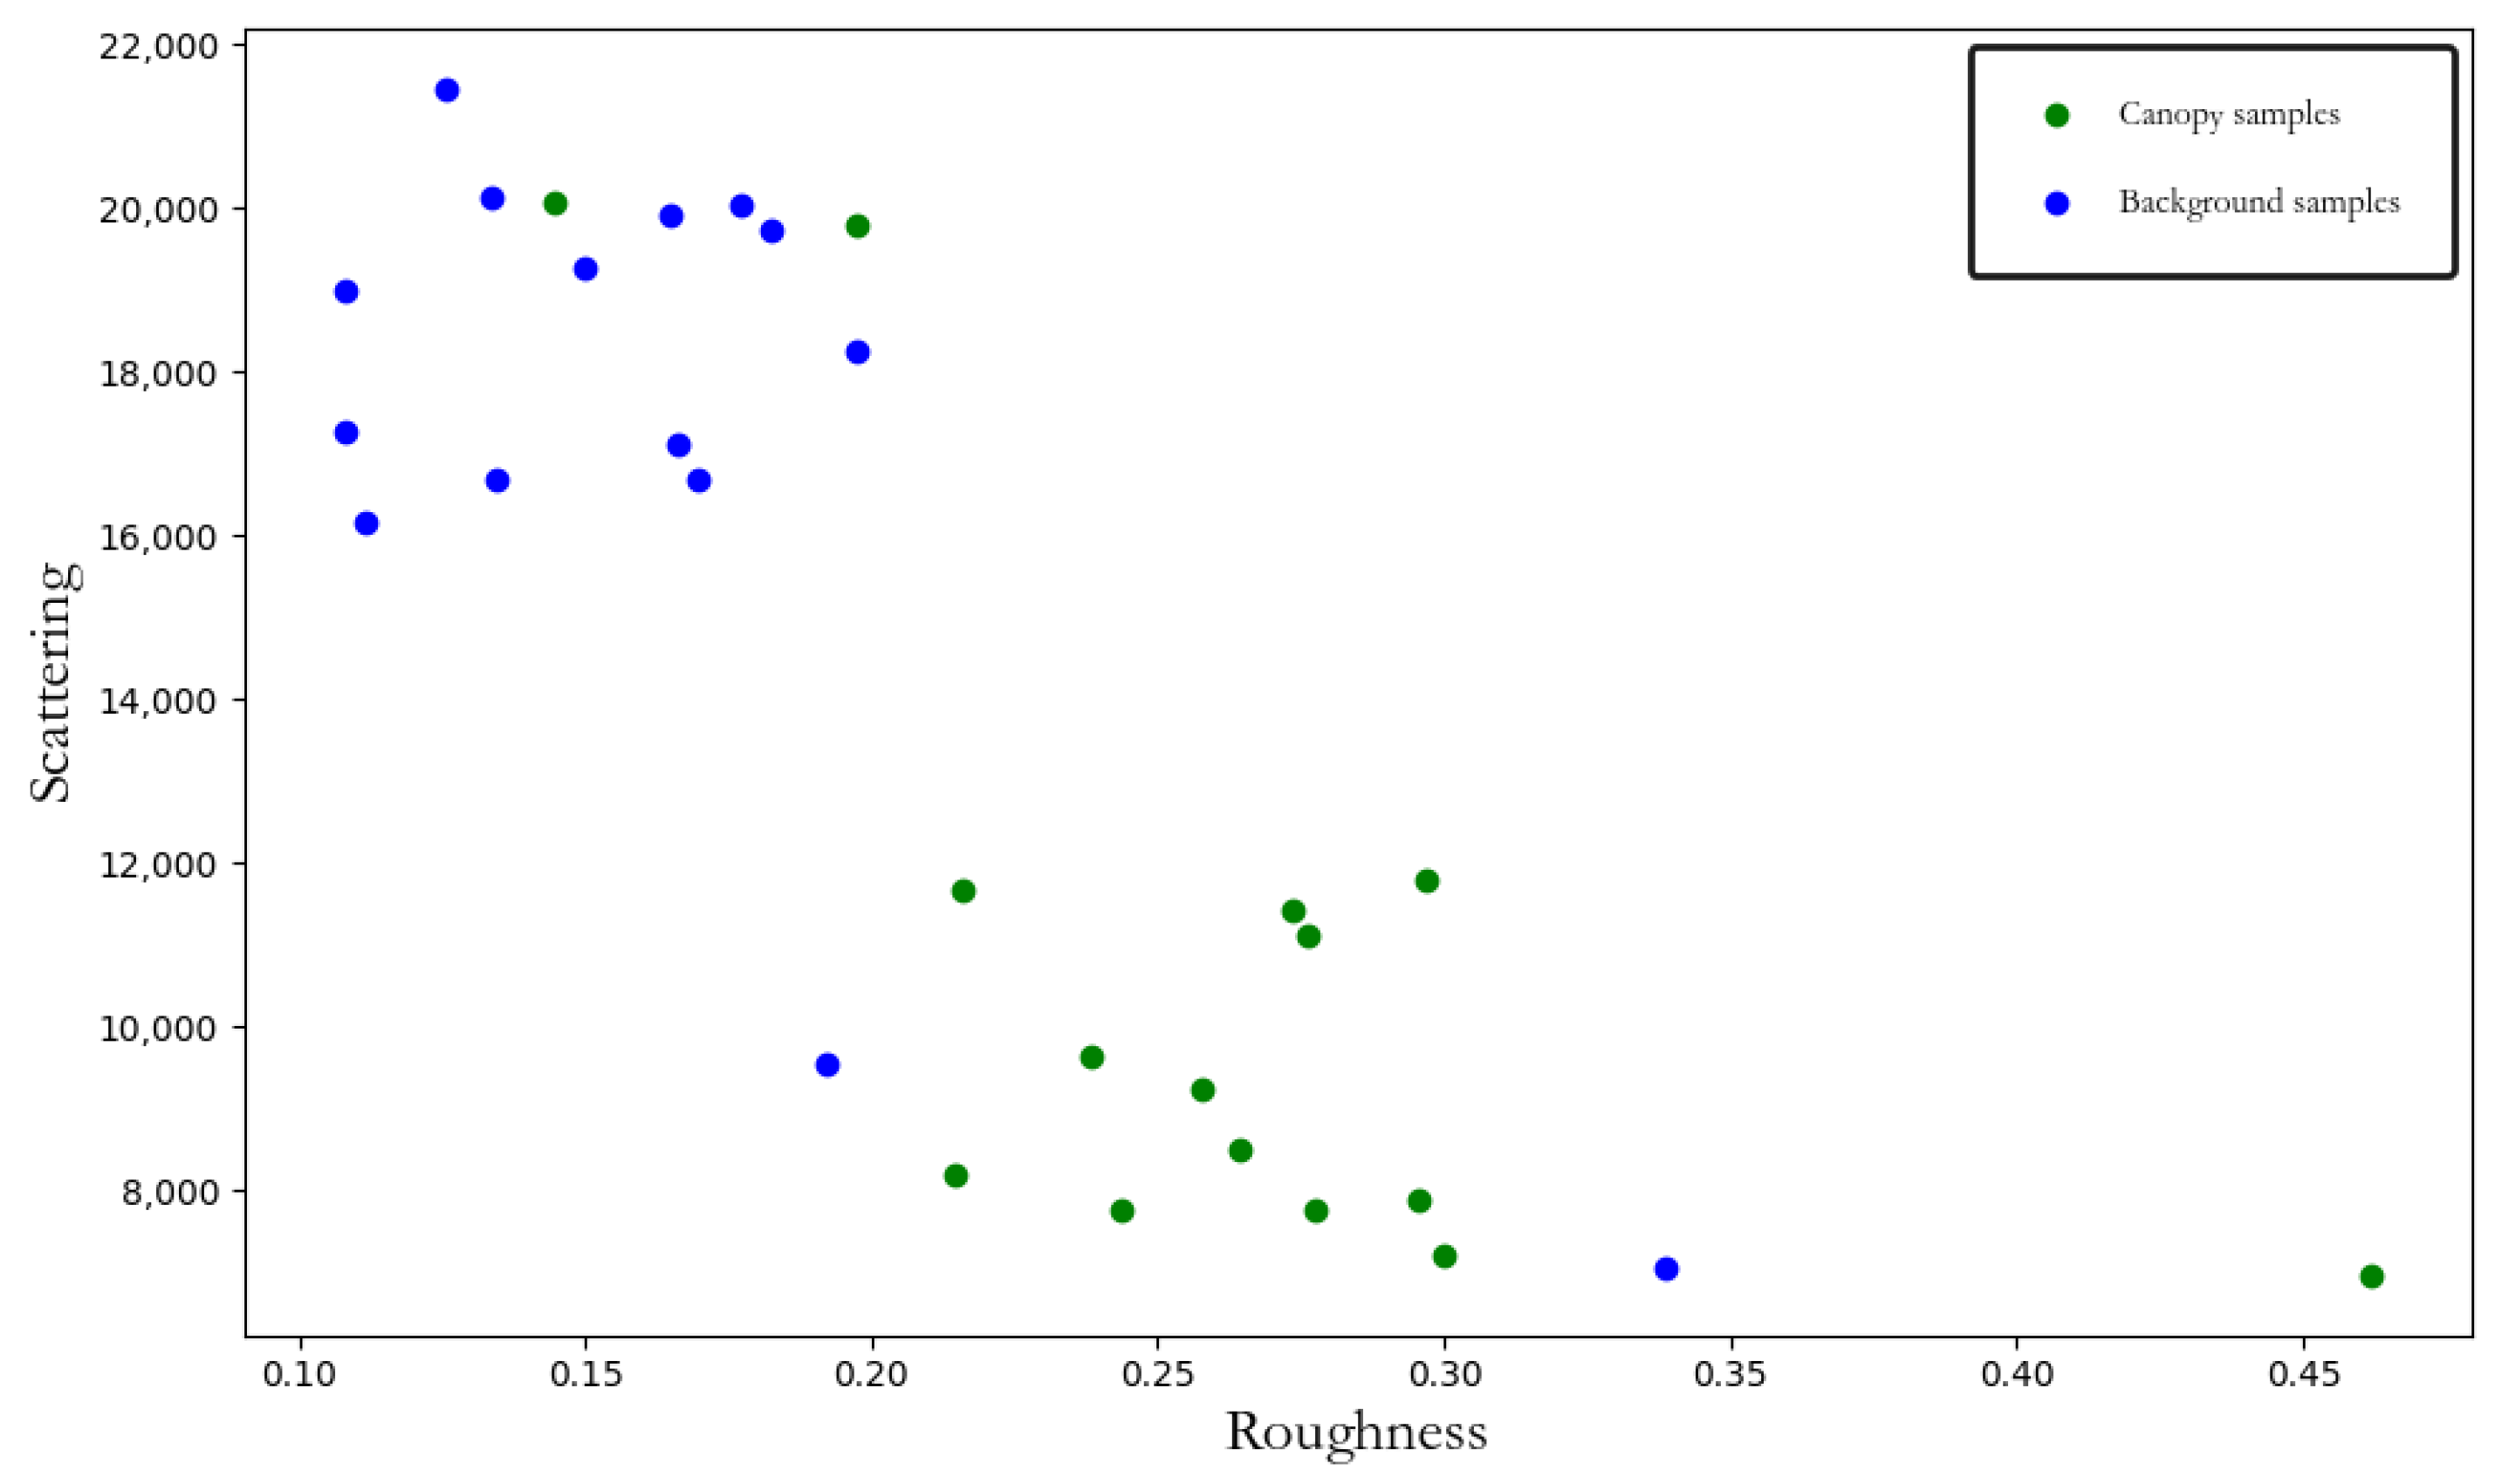
Random samples from both the background noise and fruit tree canopies are extracted to compute their roughness and divergence indices. These metrics are used to create a sample distribution map with roughness on the x-axis and divergence index on the y-axis, as shown in Figure 6. To identify the fruit tree canopy, non-canopy objects are treated as noise. A binary classification approach using a support vector machine (SVM) [18] is then applied. Despite some overlap in the scatter plots, the distribution of data points aligns with the SVM algorithm’s binary classification requirements.
The results of the SVM classification are depicted in Figure 7, wherein the green segment signifies the fruit tree canopy. This effectively illustrates the distinction between the canopy and the background.

2.3.2. Design of Canopy Volume Calculation Method Based on the Fusion of the Super Green Algorithm and Axis-Aligned Bounding Box

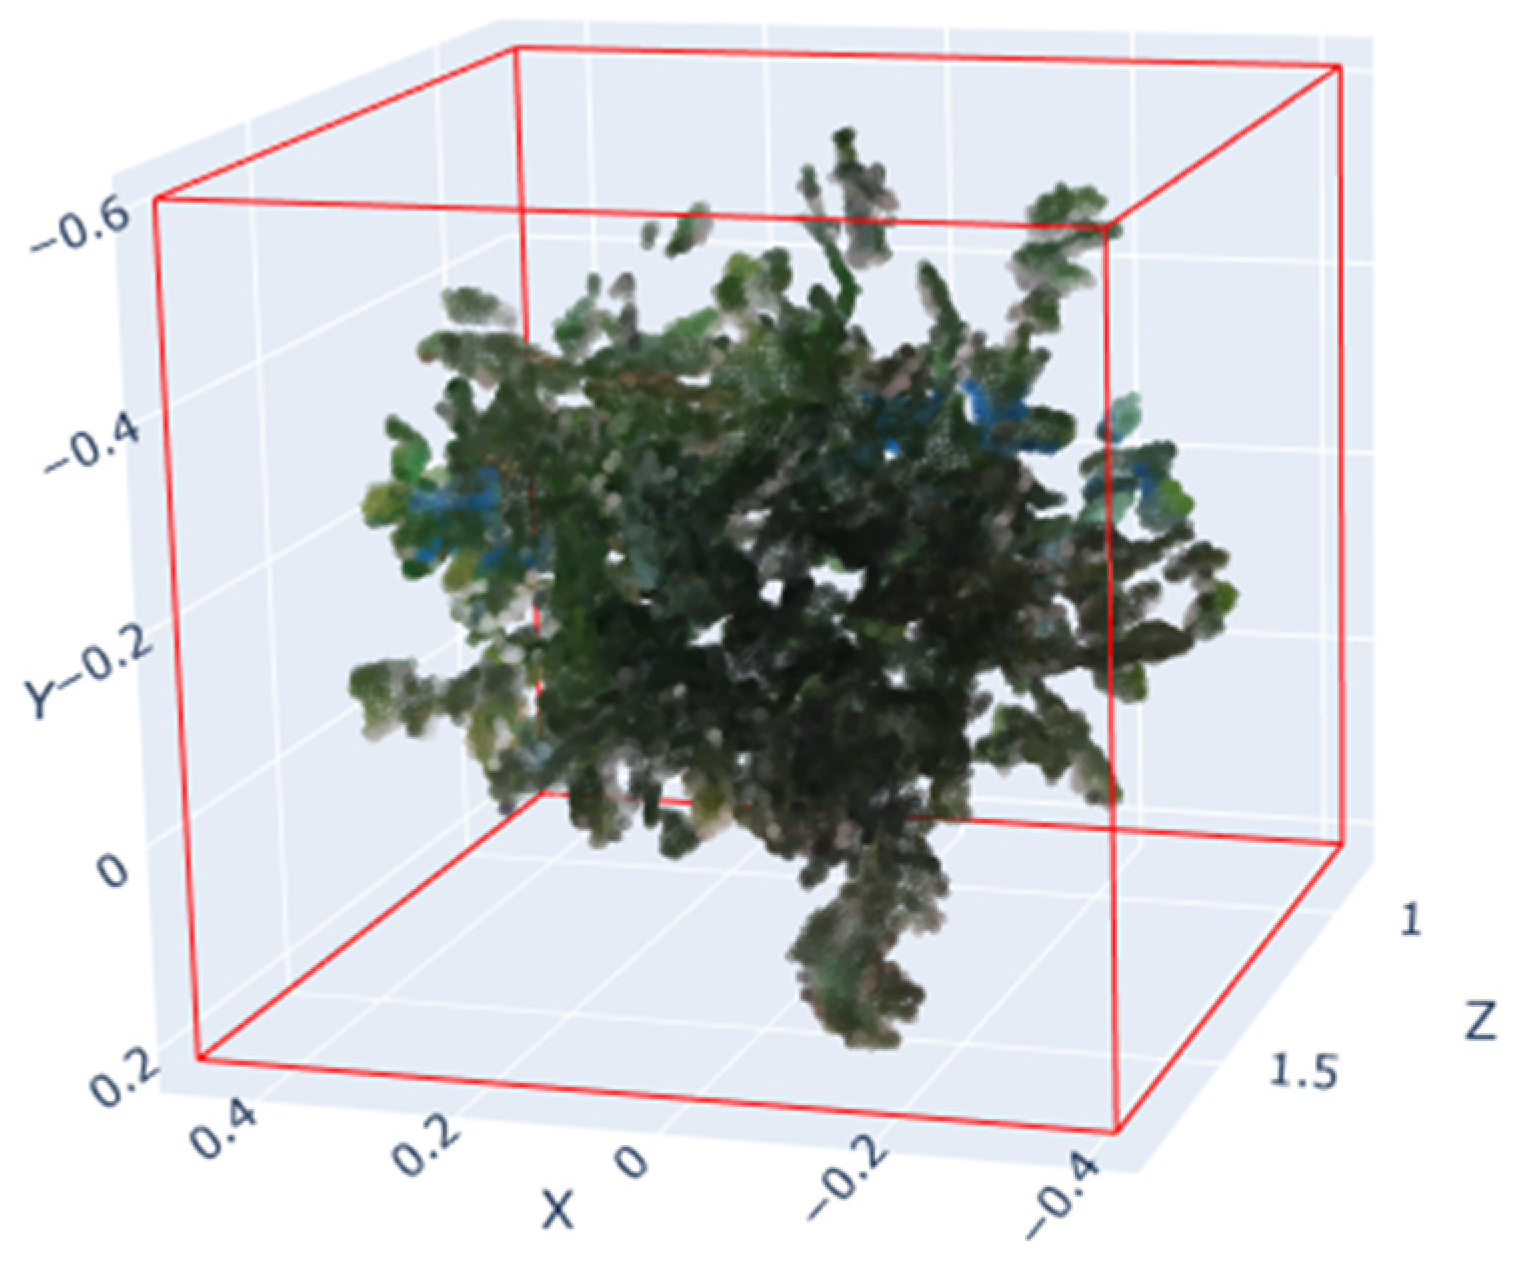
The canopy image mask was derived using the super green algorithm, as depicted in Figure 4. However, this mask is characterized by the pixel quantity of a two-dimensional image and fails to accurately represent the true parameters of the canopy. Consequently, it cannot provide a reliable basis for precise spraying decisions. When images are captured with a standard camera, the actual area per unit pixel is typically determined through a calibration method, which will be denoted as D in subsequent text. Given that each standard camera possesses unique internal parameters, obtaining an accurate D value necessitates complex calibration experiments. In this paper, a depth camera capable of capturing RGB-D images and point-cloud data was employed. As such, the axis-aligned bounding box (AABB) algorithm [19] was utilized to determine the minimum and maximum boundaries of the classified and processed canopy point-cloud data on each coordinate axis (X, Y, and Z), resulting in a box aligned with the coordinate axes. This box provides a simple yet accurate description of the spatial range and shape features of the data, as illustrated in Figure 8.
The precise dimensions of the bounding box are ascertained by integrating RGB-D images with the Euclidean distance computation technique. RGB-D images furnish both color data from the object’s surface and depth information from each pixel to the camera. The Euclidean distance method leverages this depth data to correlate image pixels with real-world distance metrics. By examining the coordinates of the bounding box vertices, one can determine the lengths along each coordinate axis, thus deriving the actual dimensions of the box. In a three-dimensional context, when using the Euclidean distance equation, the distances between the upper and lower boundary vertices of the box are computed to determine the true height of the canopy. Given the vertex coordinates x 1 , y 1 , z 1 and x 2 , y 2 , z 2 , the equation is represented as:
H = ( x 2 x 1 ) 2 + ( y 2 y 1 ) 2 + ( z 2 z 1 ) 2 × d u
In the equation, d u denotes the depth unit, which is typically millimeters (mm) for pixel values in the depth image. Given that the depth images acquired by the Azure Kinect DK camera are expressed in millimeters, they must be converted into meters (m) for further computation.
The methodology employed in this paper to calculate the canopy leaf wall area is as follows. The actual height of the canopy, along with the height of the canopy pixels within the RGB image, are both determined. The square of the ratio derived from these two values is represented by the D value. This D value is subsequently multiplied by the mask pixel area to yield the final canopy leaf wall area. The specific calculation process is articulated as follows:
D = ( H H p ) 2
S = D × S p
In the above equations, H is the actual height of the canopy in meters; H p is the pixel height of the canopy, expressed in pixels; D is the actual area per unit pixel, measured in m2/pixel2; S p is the mask pixel area, expressed in pixel2; and S is the area of the canopy leaf wall, measured in m2.
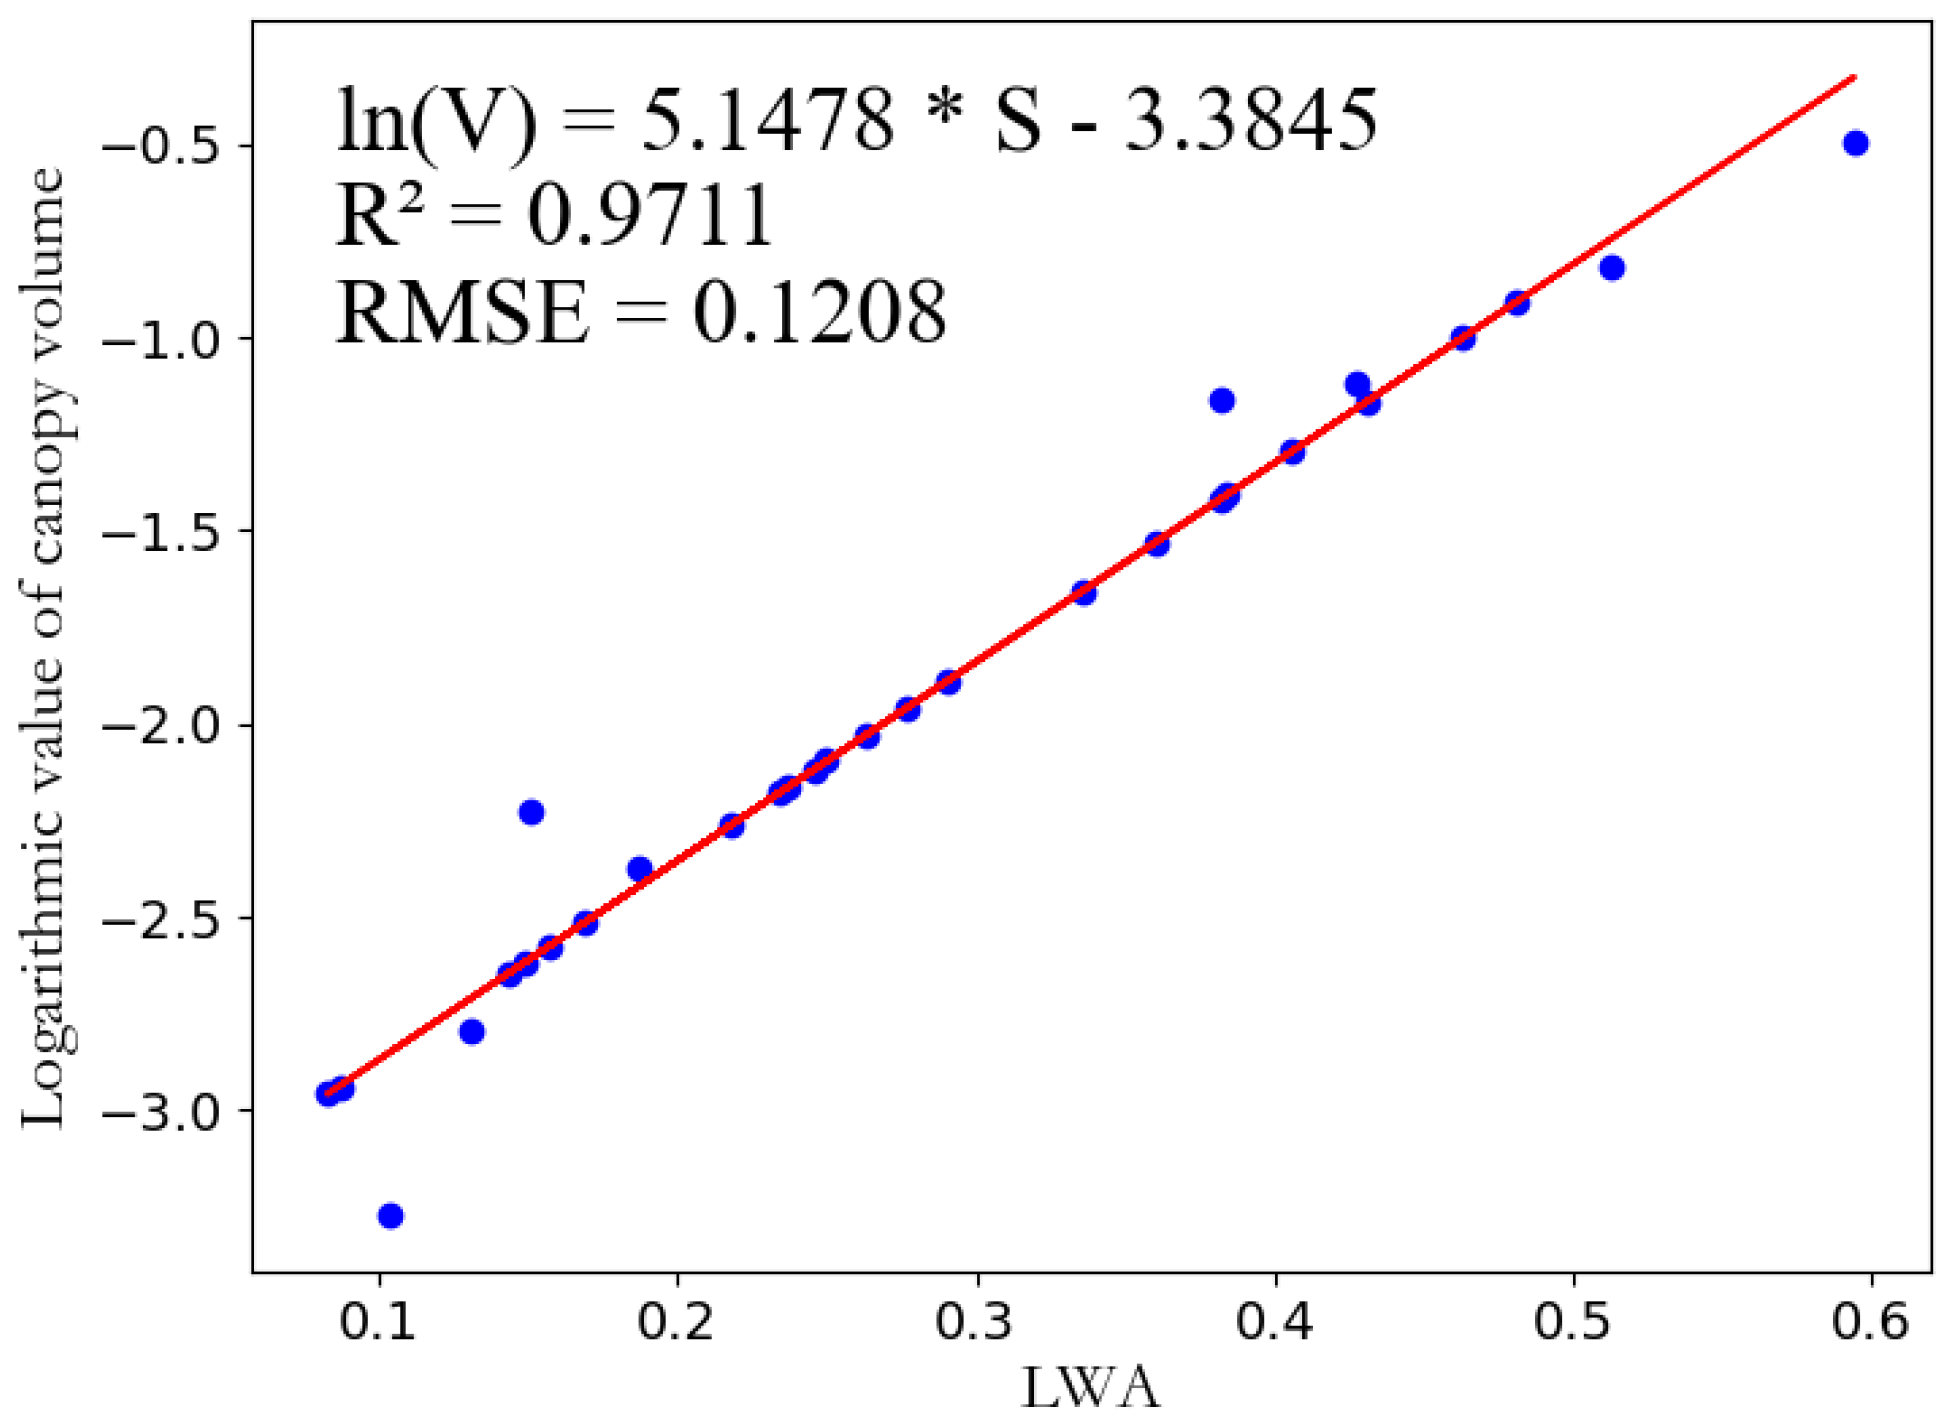
In order to precisely ascertain the canopy volume, it is imperative to establish a correlation between the leaf wall area and the canopy volume. Ding Weimin et al. [20] developed a model that explores the relationship between the actual vertical projection area of the tree crown and the logarithm of its volume. Their findings suggest that volume can be determined based on a known canopy area. Through rigorous experimentation, Ding Weimin’s team developed a canopy volume calculation model for fruit trees, including pear and osmanthus trees, with the determination coefficients consistently exceeding 0.9. The experimental outcomes reveal a significant correlation between the vertical projection area of the tree crown and its volume, further indicating that this linear relationship is consistent across different tree species. Building upon this research, this paper selects 30 sample trees and calculates the canopy leaf wall area (S) in conjunction with the accurately measured canopy volume (V) using manual measurement techniques. A least-squares method is employed to construct a relationship model between S and ln V in fruit-tree canopies, which is referred to as the excess green and axis-aligned bounding box fusion method (ExG-AABB). The correlation results are presented in Figure 9 with a determination coefficient (R2) exceeding 0.97, demonstrating a clear linear relationship between the canopy leaf wall area and volume logarithm.

2.3.3. Evaluation of the Accuracy of the Canopy Parameter Acquisition Model in Canopy Samples

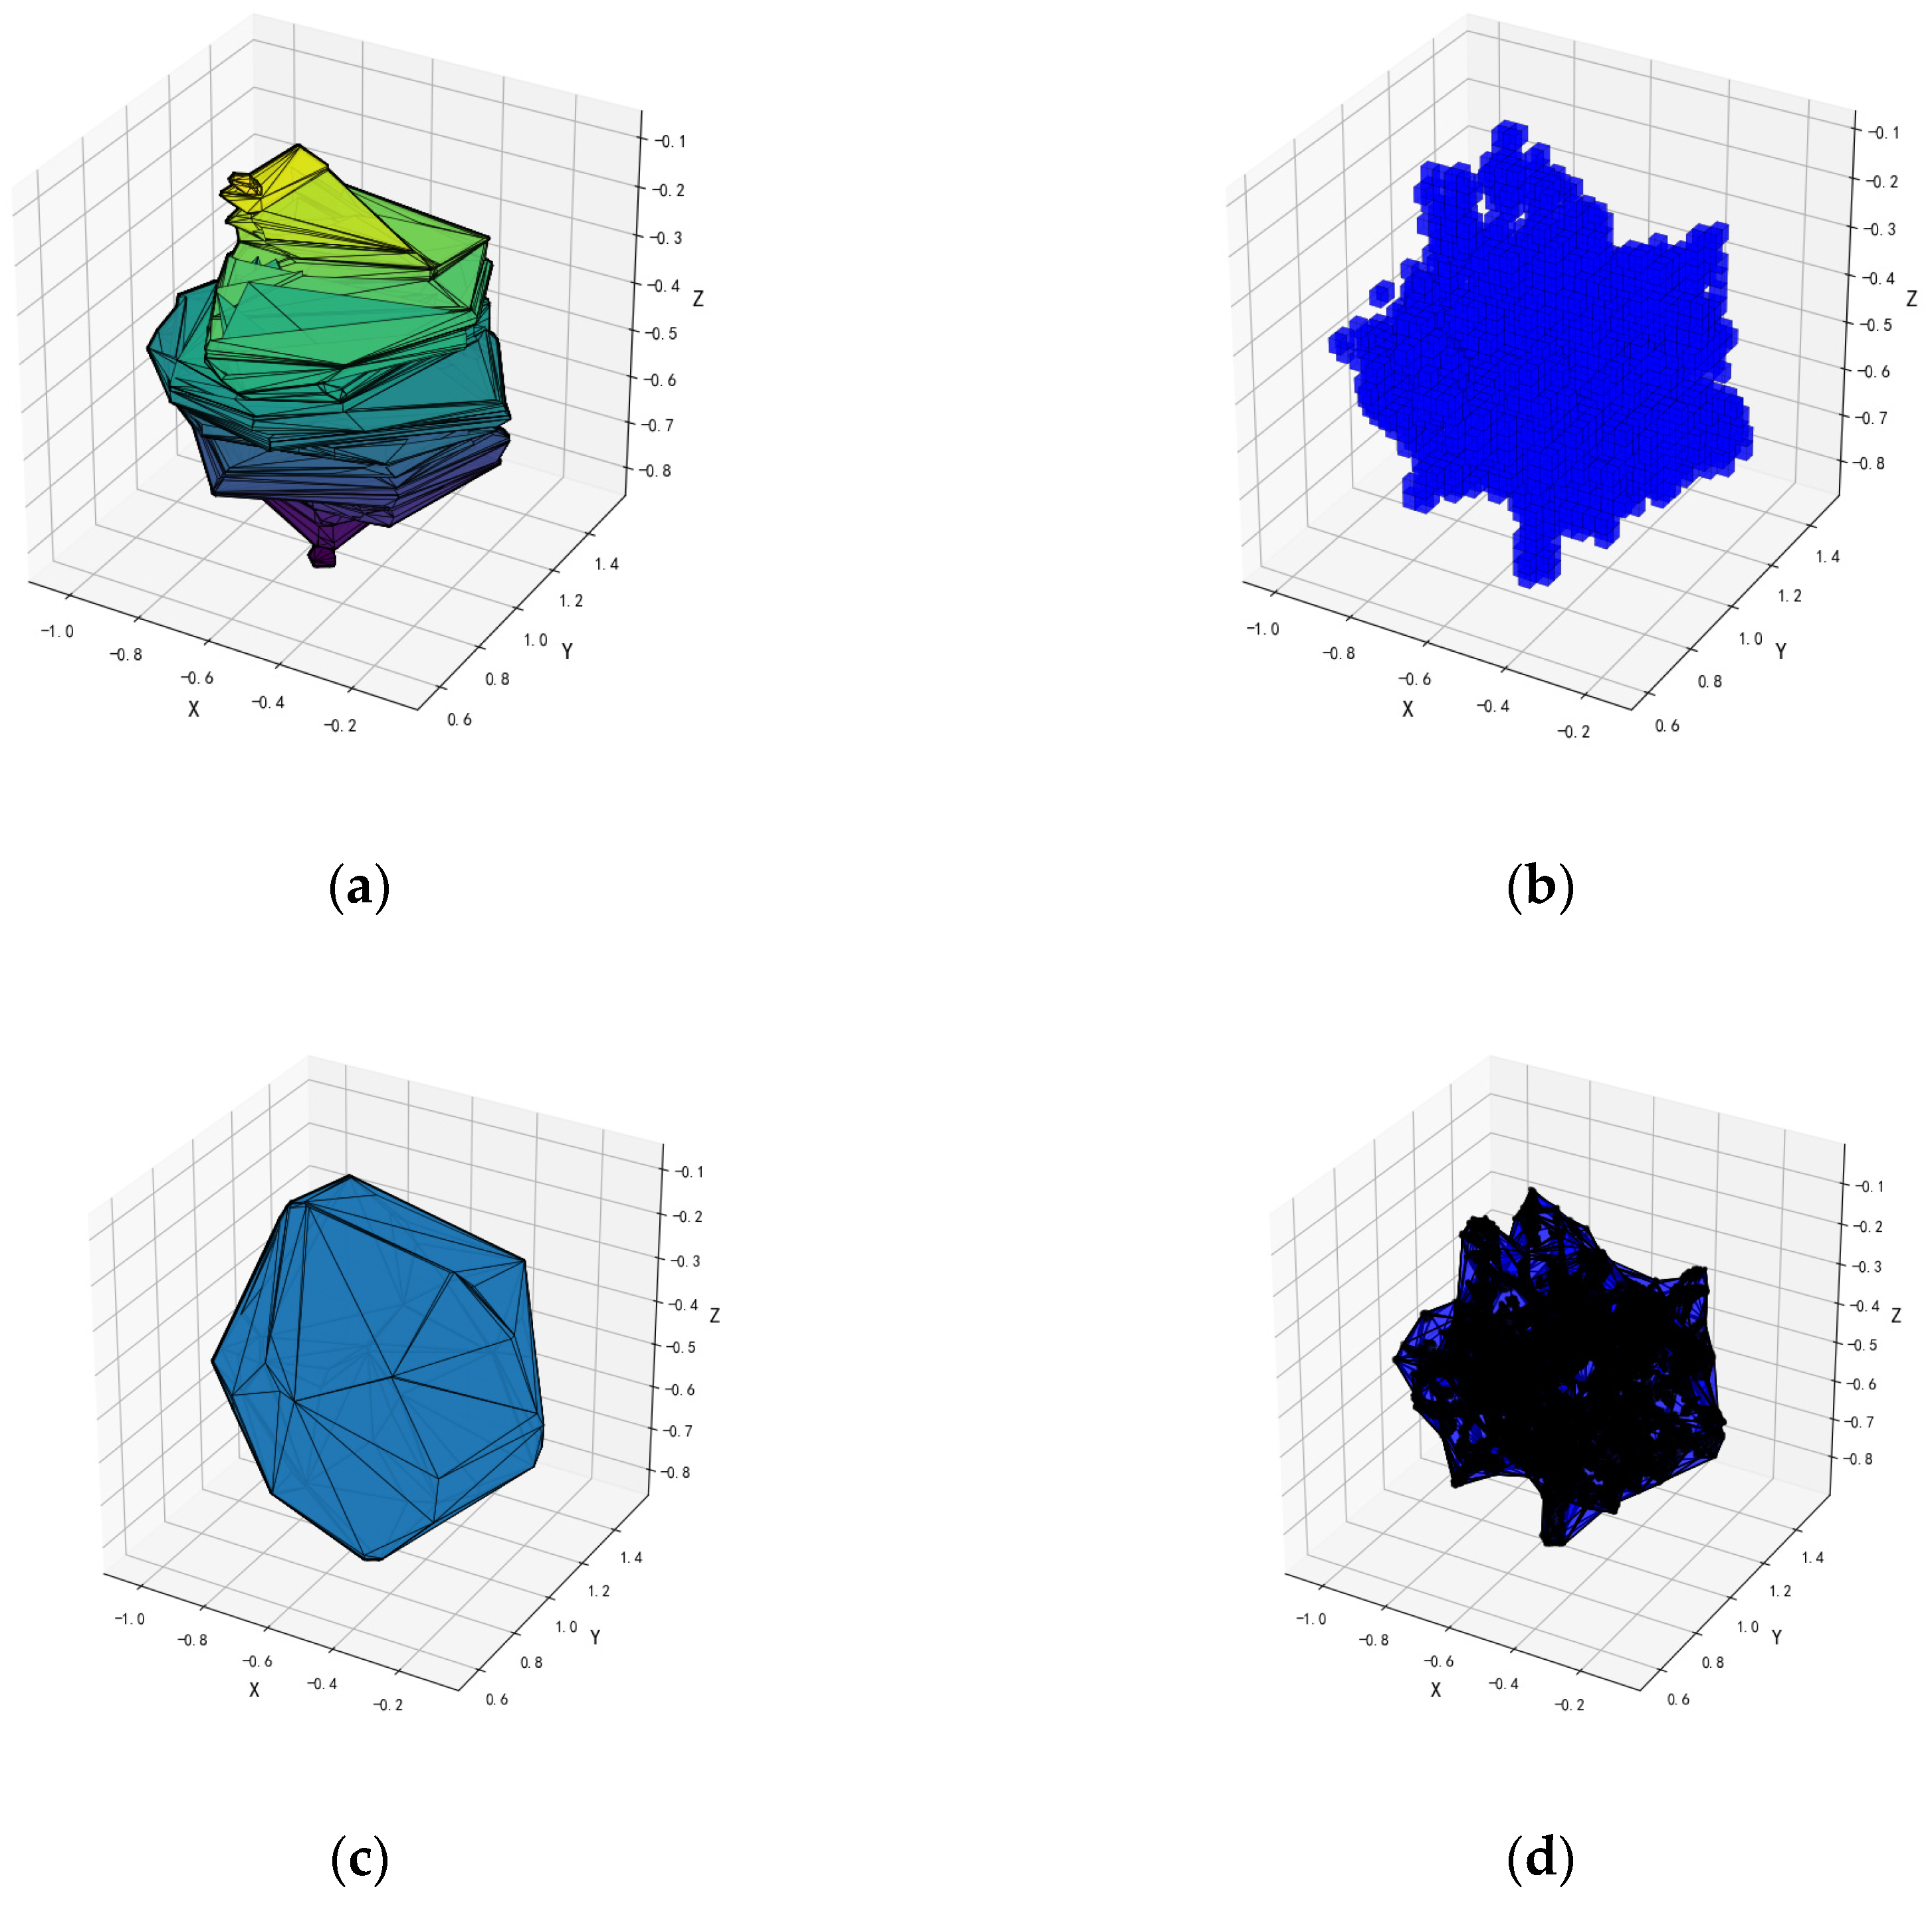
This paper utilizes six computational methods to compute the canopy volume of 30 sample trees, using manually measured canopy volume values as the true values. The results derived from the other five algorithms serve as comparative values. The coefficient of determination (R2) and root mean square error (RMSE) are calculated through linear regression analysis to assess the accuracy of each model, thereby validating the accuracy of ExG-AABB. The calculation principles of four point-cloud-based volume algorithms are illustrated in Figure 10. The convex hull by slices technique [21] segments the point-cloud data into several horizontal slices by performing height slicing on it. Points on each slice are used to calculate a two-dimensional convex hull, and are then vertically merged to form a three-dimensional convex hull. The total sum of all sliced convex hulls is employed to estimate the canopy volume of the point cloud. The voxel-based method [22] divides the point-cloud data into uniform three-dimensional voxels (such as cubes or cuboids), determining whether each voxel is included in the canopy volume based on the density of points within it. By counting the number of voxels containing points and estimating their volumes, the total volume of the canopy is obtained. QuickHull generates a polyhedral convex hull by selecting extreme points in the point cloud and recursively constructing convex hull boundaries, then estimates the canopy volume by calculating its volume. The three-dimensional alpha shape [23] technique controls the external boundary of the canopy by adjusting the shape parameter alpha. The algorithm first generates the Delaunay triangulation of the point cloud, then filters out triangular facets that meet the alpha parameter, constructs the outer shell of the point cloud, and estimates the canopy volume by calculating the volume enclosed by these facets.

2.3.4. Establishment of Spray Flow Model

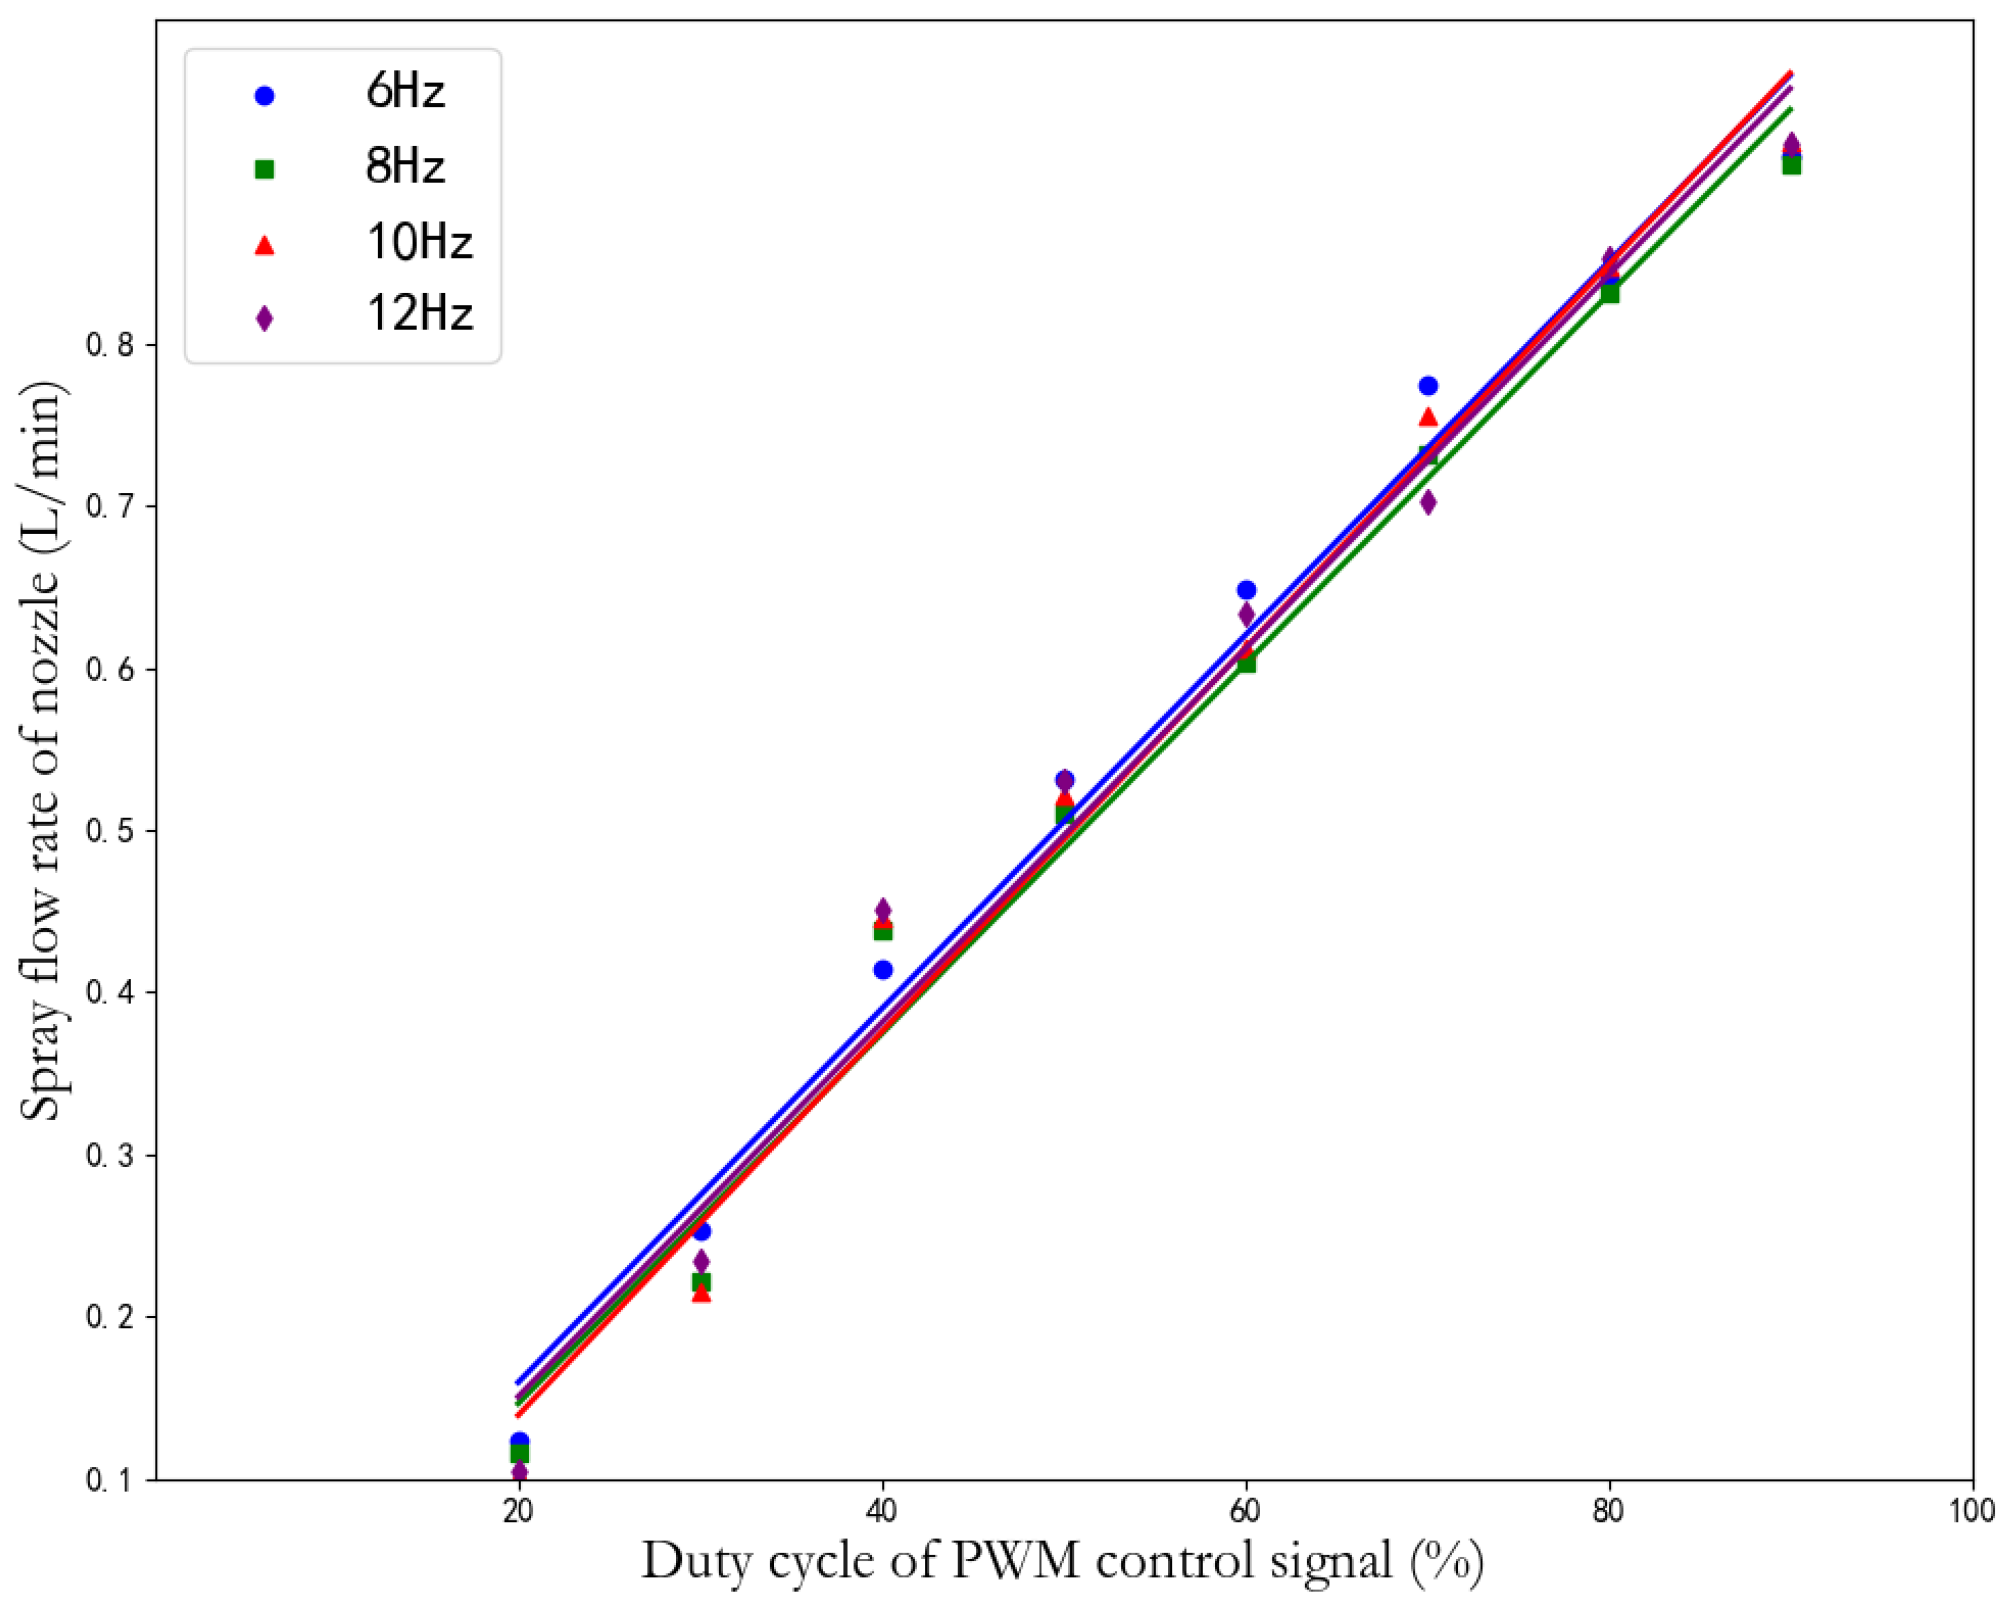
In the PWM variable spray of solenoid valves, the nozzle’s flow rate is predominantly influenced by the spray pressure and the PWM duty cycle. By controlling the spray pressure, one can achieve variable spraying through adjustments to the PWM duty cycle. However, due to the performance constraints of the solenoid valve, in multi-nozzle scenarios, a duty cycle below 30% results in suboptimal atomization, often rendering normal spraying unattainable. Conversely, a duty cycle exceeding 90% yields minimal changes in the spray flow rate. Consequently, when employing a spray flow-rate model, only the duty cycle ranging from 30% to 90% is taken into account. The relationship between flow rate and duty cycle at a pressure of 0.4 MPa for PWM signal frequencies of 6 Hz, 8 Hz, 10 Hz, and 12 Hz was linearly fitted, as depicted in Figure 11.
The linear fitting relationships for the four frequency groups of 6, 8, 10, and 12 Hz in the figure exhibit R2 values of 0.98574, 0.98496, 0.98103, and 0.97972, respectively. The spray flow model is constructed using the optimal linear fitting relationship (i.e., the one with the highest R2) at 6 Hz, as represented by Equation (15).
y 0.4 = 0.01152 α 0.07111
In the equation, y 0.4 denotes the spray flow rate of the nozzle at 0.4 MPa, expressed in L/min; α signifies the proportion of the PWM control signal, given as a percentage.
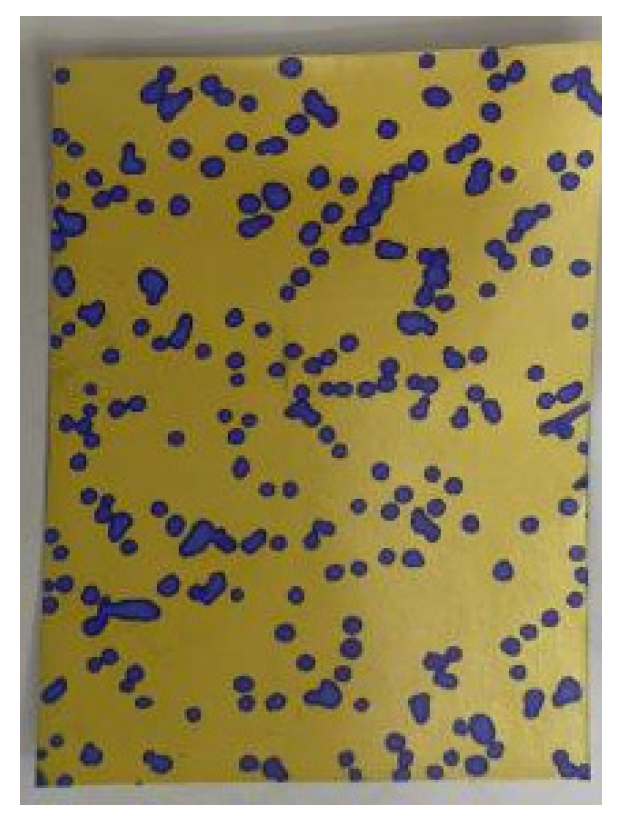
During a conventional continuous spraying process, instances of over-spraying or partial missed spraying frequently occur. This necessitates modifications to parameters such as water pump pressure and target distance. In this experiment, the nozzle pressure was calibrated at 0.4 Mpa, the target distance was set at 1.2 m, and the PWM signal frequency was maintained at 6 Hz. To establish a correlation model between canopy volume and spray volume, the experiment employed conventional continuous spraying methods to standardize fruit-tree spraying. The droplet deposition scenario is depicted in Figure 12.
The nozzle flow rate necessary for spraying the target can be determined by measuring both the volume of liquid consumed by the calibrated fruit tree and the unilateral canopy volume of the same tree. This calculation is based on Equation (16).
q T e s t = q V T e s t V L = u × V T e s t
In the equation, q denotes the nozzle flow rate necessary for spraying calibration for fruit trees, measured in L/min. Similarly, q T e s t signifies the nozzle flow rate required for spraying the test target, also in L/min. V L represents the volume of a single side canopy of the calibration fruit tree, expressed in m3, while V T e s t denotes the volume of the test target, also in m3. The required nozzle flow rate per unit volume of canopy, denoted as u , was determined to be 4.614 L/(min·m3), based on conventional continuous spraying results derived from multiple experiments and measurements. We conducted spraying experiments on several calibrated simulation fruit trees, documenting their spraying effects and liquid consumption data. Subsequently, we analyzed the relationship between liquid consumption and canopy volume.

2.3.5. Field Spray Test Design

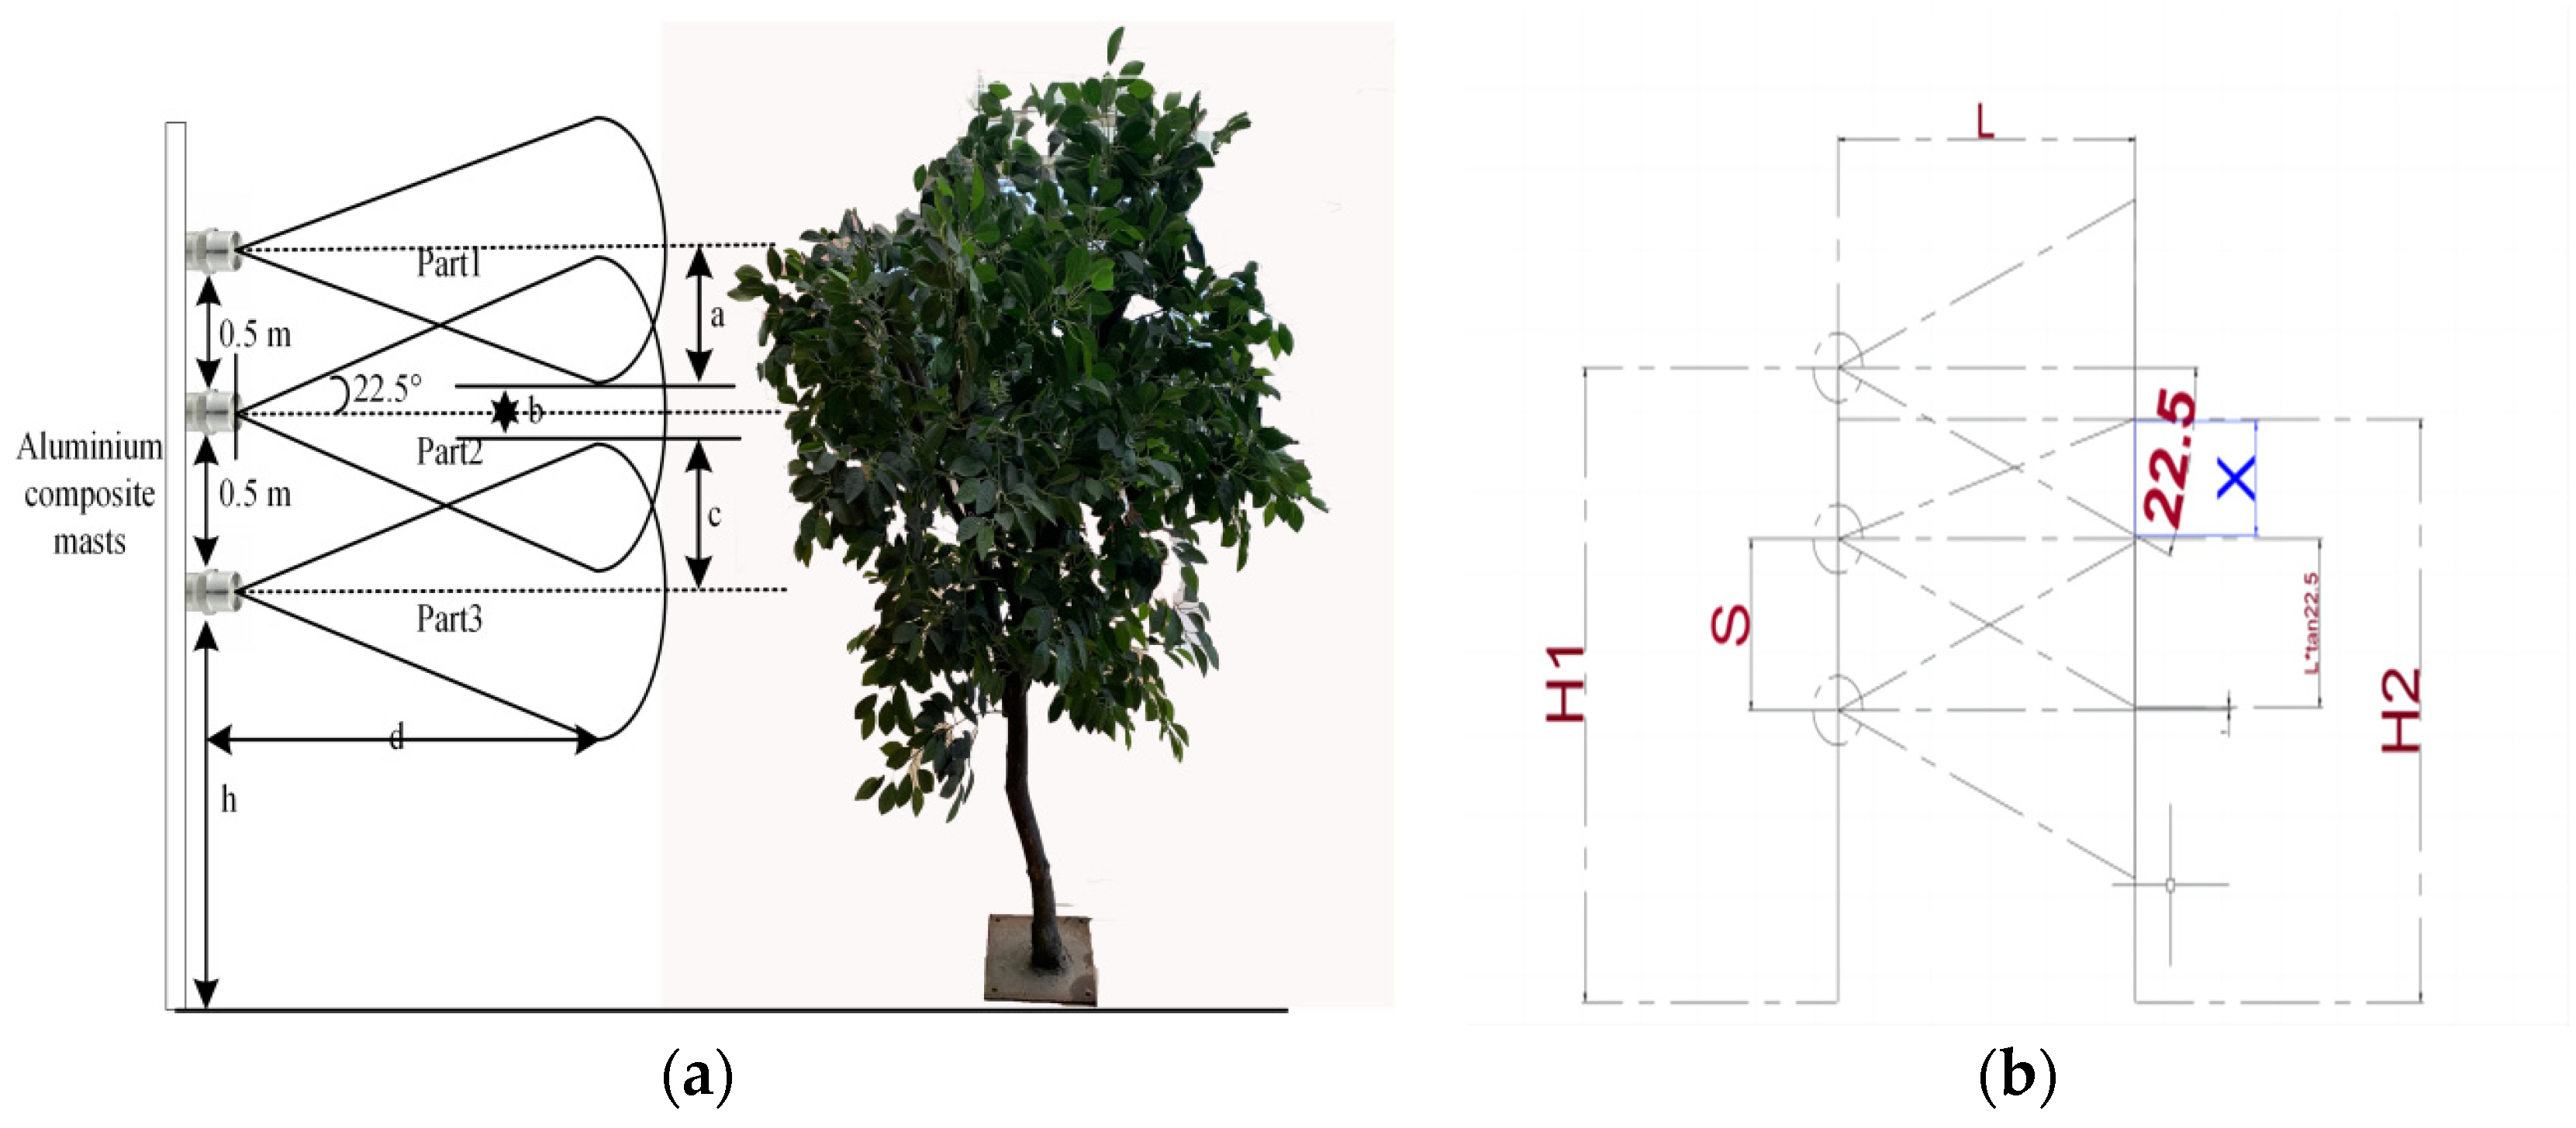
The design of the field spray test involves the distribution of three nozzles, with a high-speed camera measuring the atomization cone angle from each nozzle at 45° when horizontally sprayed under a pressure of 0.4 Mpa. The specific distribution structure is depicted in Figure 13a. As illustrated in the figure, when applied to fruit trees, the spray coverage area of the second nozzle overlaps with those of the first and third nozzles. Consequently, the flow rate of the second nozzle can be calculated using the following equations, which take into account the height of the overlapping spray area on the vertical projection surface, as shown in Figure 14b:
X = 2 L tan 22.5 S
a = X L tan 22.5
In the equations, S denotes the distance between the spray nozzles in meters, X signifies the height of the overlapping spraying area in meters, and L represents the distance between the spray nozzle and the tree canopy in meters. In Figure 13b, H 1 and H 2 represent the height of the spray system and of the tree, respectively. During operation, the Kinect depth camera employs time-of-flight (ToF) technology to measure the round-trip time of infrared light pulses, thereby calculating the distance between the target object and the sensor. This process allows for the determination of the distance between the spray nozzle and the tree canopy.
To precisely control the flow rate of each spray head, we integrate the parameters from Figure 13 and use the axis-aligned bounding box algorithm on the fruit tree’s canopy point cloud. This method allows for adaptive adjustments to the canopy’s spatial layers and calculates the volume proportion of each layer. Using the correlation between canopy volume and spray volume, we determine the required flow rate for each layer and adjust the secondary spray head flow rate based on overlapping areas, creating a lightweight and efficient adaptive spray system.
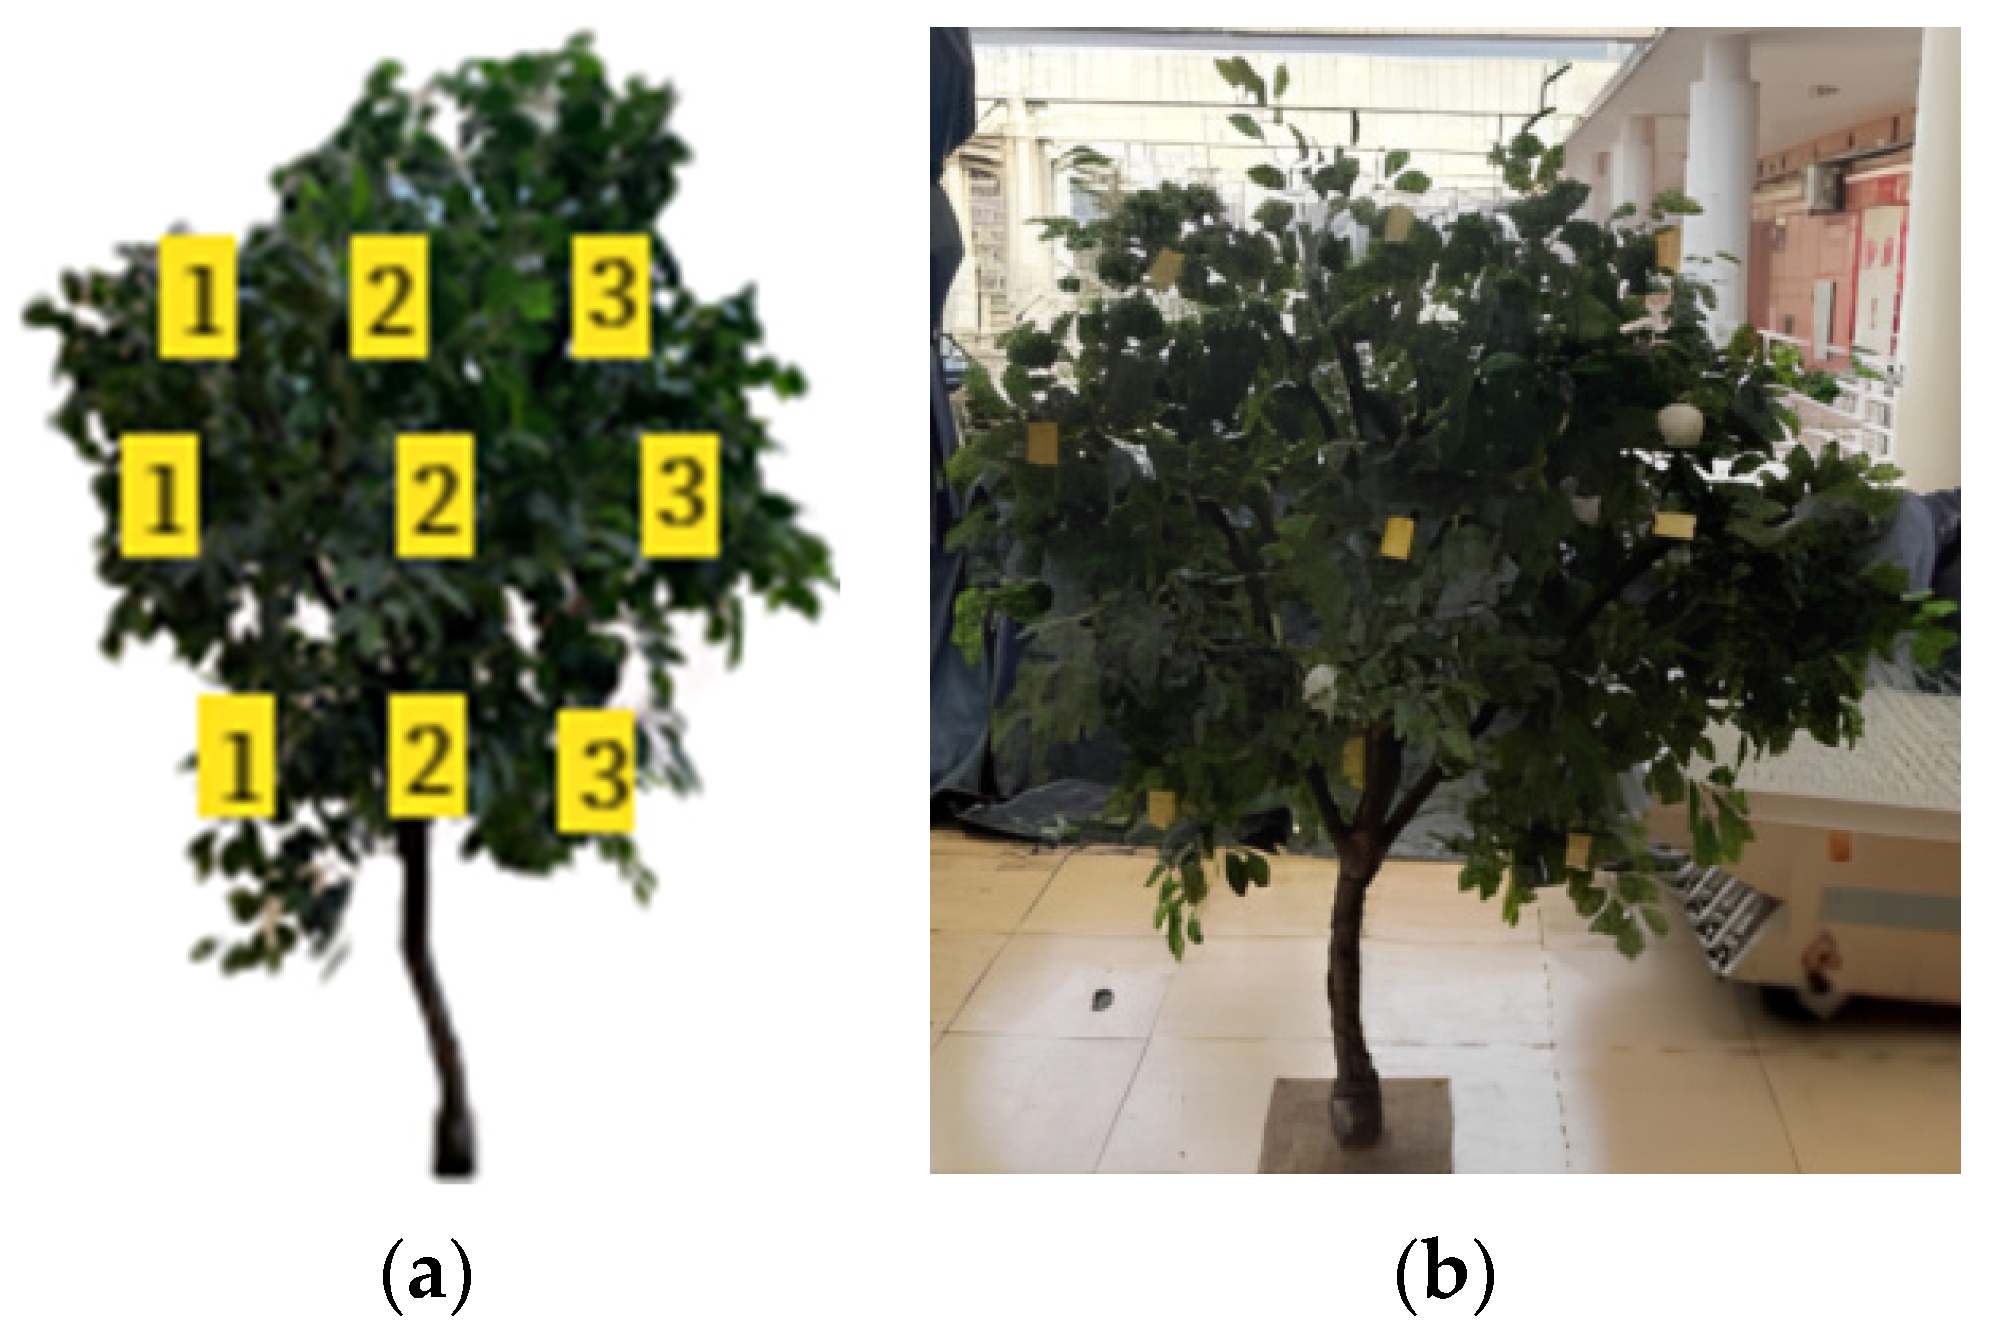
This research assessed the practicality of a variable spray system by conducting an experiment on three simulated trees. For ease of analysis and calculation, each tree was segmented into nine distinct regions. The vertical axis was divided into three layers from top to bottom, with three water-sensitive papers evenly distributed in each layer. These layers were numbered sequentially from 1–3, starting from the bottom. The first layer’s water-sensitive paper numbers ranged from 1–1 to 1–3 from left to right, with similar arrangements for the other layers. Each fruit tree underwent identical regionalization treatment, as depicted in Figure 14. The test trees were spaced at intervals of 3 m along a straight-line trajectory. A remote control was used to operate the crawler vehicle system, which moved through the fruit trees at a working speed of approximately 0.5 m/s from the starting position. This process involved both the conventional method of continuous spraying and the variable spraying method, covering a travel distance of 10 m. The liquid employed in the spraying process was distilled water. Subsequently, the deposition efficacy of droplets under the two spray techniques was assessed by examining the deposition patterns on water-sensitive paper. The system’s drug-conservation rate was analyzed by monitoring fluctuations in the flow meter.

3. Results

3.1. Analysis of Accuracy in Canopy Parameter Acquisition Models

The accuracy analysis of the canopy parameter acquisition model was derived from spray experiments conducted on individual fruit trees. Consequently, the specific numerical values of canopy volume discussed below pertain to the single-sided canopy volume of these trees. The calculation results derived from experimental measurement samples are presented in Table 1. The sample trees chosen for this paper exhibit crown heights that range from 0.62 to 1.59 m and crown diameters that span from 0.67 to 1.69 m. The manually measured canopy volume varies between 0.038 and 0.610 cubic meters, while the range calculated by the ExG-AABB algorithm extends from 0.054 to 0.770 cubic meters. The convex hull by slices method yields a range from 0.050 to 0.690 cubic meters, the voxel-based method provides a range from 0.119 to 0.577 cubic meters, the three-dimensional alpha-shape technique calculates a range from 0.013 to 0.343 cubic meters, and QuickHull calculates a range from 0.040 to 0.637 cubic meters. The significant disparities in calculation results are intimately linked to the characteristics of the various algorithms employed.
The data in the table reveal that the convex hull by slices method often overestimates the actual canopy volume during computation. This is due to its division of the point cloud into multiple slices, based on a preset thickness and number of slices. A large slice thickness may result in significant gaps in the distribution of points within the slice, thereby leading to an increased calculated volume. Furthermore, given the irregular and complex morphology of the canopy, it is impossible to accurately calculate the volume of each canopy using a fixed thickness and a set number of slices. The voxel-based method also presents inherent limitations when calculating the volume of fruit-tree canopies. This method divides the canopy into multiple voxels for computation, which may not accurately capture the fine structure of and gaps in complex and irregularly shaped canopies. Consequently, some voxels may be incorrectly included, and the size and boundary effects of voxels can impact calculation accuracy. Larger voxels cannot fit within the detailed boundaries of the canopy, potentially leading to an overestimation of the volume. The results calculated by the three-dimensional alpha shape method are often lower than the actual values. This discrepancy is primarily due to the method’s dependence on the alpha parameter when generating shape envelopes. The alpha value controls the tightness of the shape by adjusting it. Smaller alpha values result in tighter envelopes being generated, which is particularly evident in complex and irregular canopy structures. These tight envelopes ignore many details and protruding parts of the canopy, failing to fully reflect the actual volume of the canopy. As the three-dimensional alpha shape method tends to generate a contracted envelope, some external volumes of tree crowns may not be included in the calculation, resulting in an underestimation of the overall volume. However, this method performs well when calculating smaller fruit-tree canopies. The QuickHull algorithm typically generates a convex hull by closely encasing the outer contour of point-cloud data. However, due to the irregular shapes of tree crowns, which often contain numerous depressions and gaps, the convex hull thus created can only accurately represent the protruding parts. Consequently, it tends to fill all depressions and gaps within the hull, leading to a calculated volume that is larger than the actual canopy volume.
A linear regression analysis was performed to evaluate the accuracy of five volume estimation algorithms against manual measurements, as illustrated in Figure 15. The analysis revealed that the QuickHull algorithm achieved a coefficient of determination (R2) of 0.9277 and a root mean square error (RMSE) of 0.0368 m3, outperforming the slice-based convex hull method, the voxel-based method, and the three-dimensional alpha shape method. Nonetheless, the ExG-AABB algorithm exhibited the highest performance, with the strongest correlation coefficient of 0.9446 and the lowest RMSE of 0.0352 m3.

3.2. Analysis of the Practicality of Variable Spray Systems

The practicality analysis of the variable spray system incorporates the canopy volume, as calculated by ExG-AABB, as a pivotal parameter for field-trial spraying. In alignment with the adaptive layered variable spray system delineated in this paper, the specific operational parameters for individual trees and designated areas are presented in Table 2.
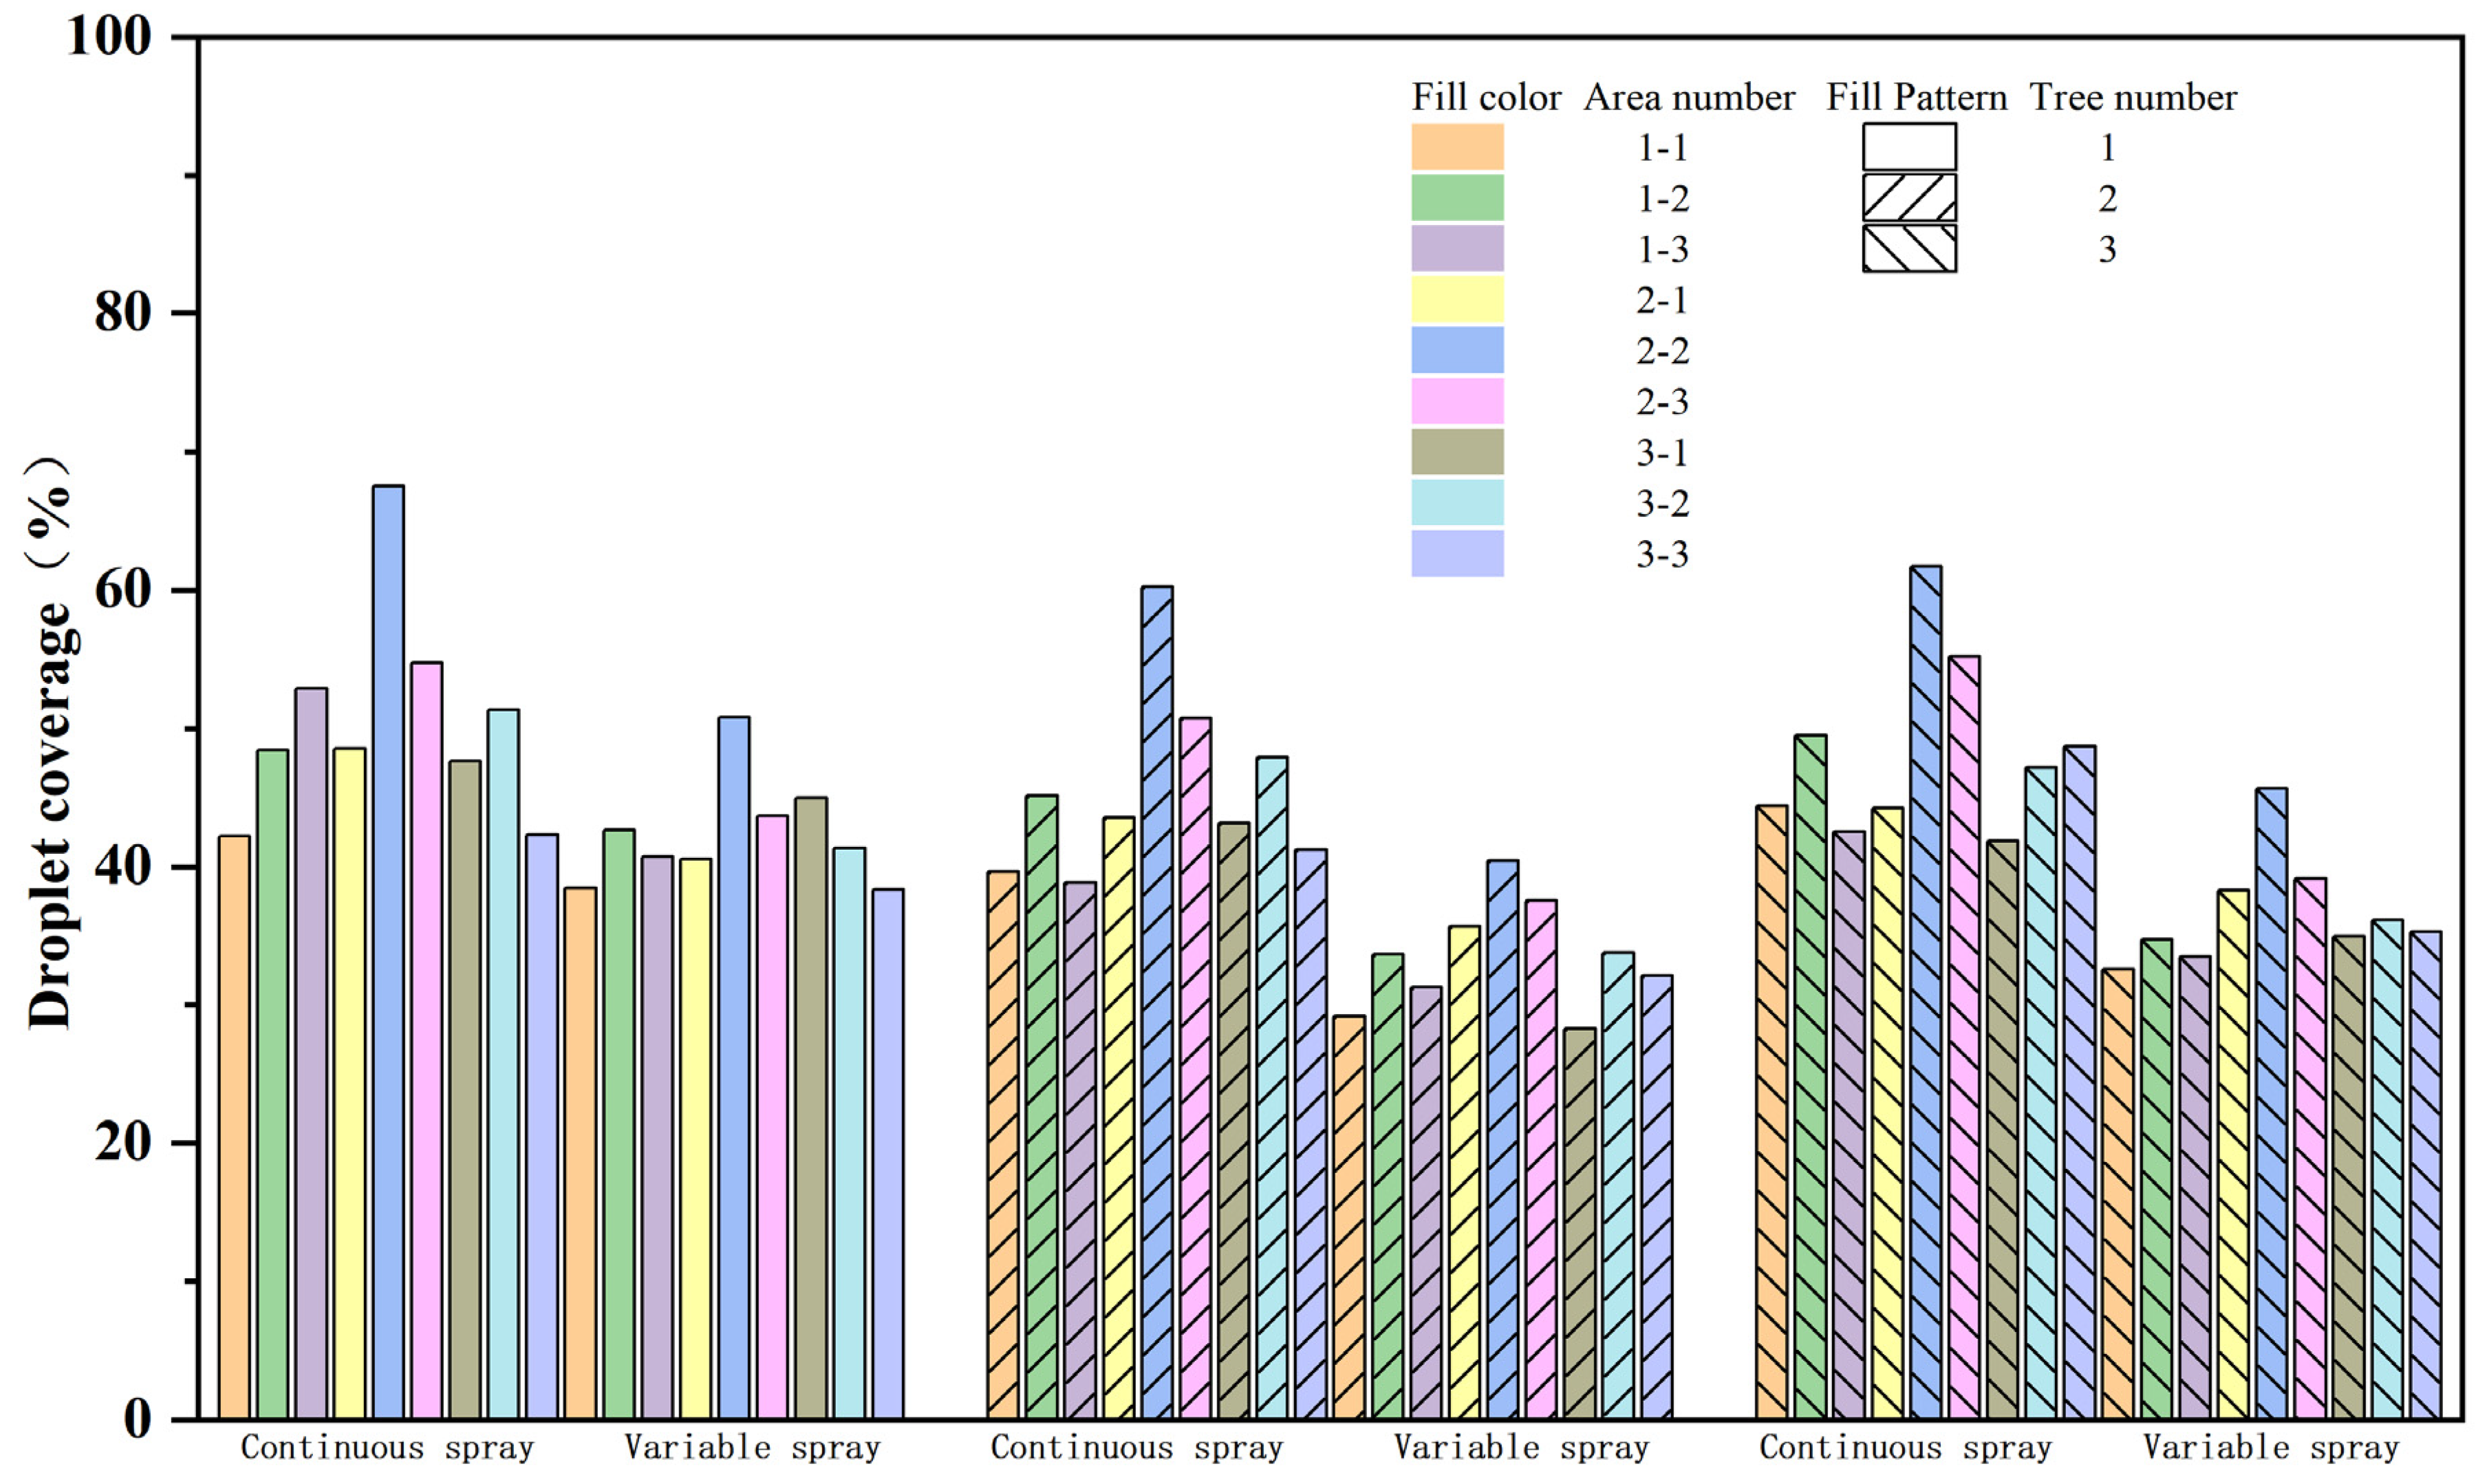
This paper compiles and contrasts the water-sensitive paper droplet data derived from both conventional continuous spraying and variable spraying at an identical target distance. The analysis focuses on the distribution of droplet deposition and other pertinent data. For analytical purposes, the mean spray coverage for each tree across all three trials was graphed in a bar format for the nine areas under both conventional continuous and variable spraying conditions, as depicted in Figure 16.
The droplet comparison of coverage rate, defined as the proportion of the deposition area on water-sensitive paper post-pesticide atomization, is indicative of the quantity of pesticide sprayed per unit of time. In accordance with the “JB/T 9782-2014 Pest Control Machinery General Test Method” of the People’s Republic of China, a 33% droplet coverage rate is employed as the critical benchmark for assessing the efficacy of a sprayer’s hydraulic spraying operation. The data clearly illustrate that under the conventional continuous spraying method, droplet coverage rates at all positions exceed 40%, peaking at 67.51%, and exhibit significant overlapping spraying in the middle layer of crown 2-2. In contrast, variable spraying methods result in significantly reduced droplet coverage rates across all positions on the simulated tree crown layers, demonstrating a more uniform coverage effect. Most positions yielded droplet coverage rates surpassing 33%. The average coverage rates for the three simulated trees were 42.38%, 35.54%, and 37.68%, respectively, all meeting the fundamental requirements for pest control. A comparison of the droplet coverage rate data from the three simulated trees under variable spraying reveals that a larger crown volume corresponded to higher PWM values, indicating increased spray application and correspondingly higher coverage rates.
To assess the consistency of drug application across the two spray modes, a one-way analysis of variance (ANOVA) was initially conducted. The findings revealed a significant disparity in the uniformity of drug distribution between the two modes (F = 15.70, p < 0.001). This suggests that variations in spray modes significantly influence the spatial distribution of drugs. To further quantify this disparity, the coefficient of variation (CV) was computed for both spray modes to assess the uniformity of pesticide distribution across various canopy layers. The CV, defined as the ratio of the standard deviation to the mean, serves as an indicator of data dispersion. Typically, a lower CV value signifies a more consistent data distribution. In the context of agricultural pesticide application research, a reduced CV value implies a more equitable distribution of pesticides across levels, thereby minimizing over-application and under-spraying.
The coefficient of variation in the trials was observed to be 15.24% in the continuous spraying mode and 10.87% in the variable spraying mode. The elevated coefficient of variation (15.24%) suggests significant fluctuations in pesticide distribution across different canopies under continuous spraying, potentially leading to over-application in some areas and under-application in others. Conversely, the variable spraying mode dynamically adjusts the spray quantity by real-time monitoring of the fruit tree canopy’s structure and density, resulting in more uniform pesticide distribution and a substantial reduction in the coefficient of variation (10.87%). This indicates that variable spraying technology can effectively minimize the dispersion of pesticide distribution, enhance the efficiency of pesticide utilization, and improve the precision of spraying.
Traffic monitoring was utilized to record pesticide usage under two application modes. The traditional continuous spraying method necessitates an average of approximately 2.874 L of pesticide solution. This approach, however, fails to differentiate between target and non-target areas, resulting in unnecessary spraying in the latter and the consequent waste of pesticide solution. In contrast, the variable spraying method requires only 1.382 L of pesticide solution, a reduction of 48.1%. The experiment demonstrates that the variable spraying system designed for this study can not only effectively minimize excessive spraying and enhance the uniformity of droplet coverage but also optimize the quantity of pesticide, based on canopy volume. This significantly improves both the efficiency and effectiveness of spraying.

4. Discussion

In this paper, the average coverage rate of the canopy’s middle layer under conventional continuous spraying (63.14%) was markedly higher than that of adjacent areas, exhibiting an anomalous distribution pattern that was disproportionate to the coverage distribution in other parts of the canopy. This distribution anomaly is analogous with the images of citrus orchard spray deposition distribution obtained by Garcerá et al. [24] using high-resolution images and computer simulations. The findings of Garcerá et al. also indicated that the spray deposition amount within the internal area of the canopy was significantly greater than that in the peripheral area, and similar disproportionate coverage distribution results were obtained using data from actual orchard-spraying experiments. This phenomenon can be attributed to the fact that the middle layer simultaneously receives spray liquid from the nozzles both above and below, resulting in a superimposed effect of spray volume. However, the variable spray system designed in this paper can dynamically control the spray volume in different areas based on three-dimensional structural information, thereby achieving more uniform coverage distribution and effectively reducing the occurrence of overspray problems in the middle layer.
The variable spray system presented in this paper achieves a 48.1% reduction in pesticide usage by integrating two-dimensional and three-dimensional canopy structure data, outperforming the 23% reduction achieved by Hoevar et al. [25] using only two-dimensional images. The fusion analysis of multi-source heterogeneous data, as opposed to relying on a single source, enhances the precision and efficiency of pesticide spraying. Beyond the use of images, sensor arrays can also be employed for canopy structure detection [26], and collaborative perception from multiple dimensions can further refine the quality of spray control. This paper, in conjunction with related research, collectively underscores the importance of the deep fusion of multi-source heterogeneous canopy structure data to achieving high-precision spraying.
The findings of this paper indicate that this variable spraying system, which is based on the ExG-AABB algorithm, exhibits superior performance in terms of pesticide distribution uniformity. This is particularly evident in the middle-layer area of the canopy, effectively mitigating the overspray issue commonly associated with traditional spraying methods. This underscores the significant potential of multi-source data fusion and intelligent control technology in precision agriculture. The system herein is capable of accurately capturing and analyzing the three-dimensional structural information of the canopy, and it can adjust the flow rate and spraying mode of the nozzle in real time. This significantly enhances both the spraying efficiency and the pesticide utilization rate. However, despite these technologies’ impressive performance under experimental conditions, they still encounter certain challenges in practical applications. For instance, sensors may be subjected to interference under varying operating environments and meteorological conditions, leading to a decrease in data quality. This, in turn, impacts the accuracy and stability of the system. Therefore, future research should prioritize the improvement of data acquisition and processing methods to bolster the system’s adaptability and robustness in diverse environmental conditions.
In conclusion, this research underscores the substantial potential of the variable spraying technique, which integrates two-dimensional image processing with three-dimensional point-cloud data. This approach not only diminishes pesticide consumption and environmental repercussions but also enhances spray uniformity and coverage efficacy, thereby offering a rigorous foundation for more precise agricultural practices.

5. Conclusions

This paper focuses on fruit trees, utilizing depth cameras to gather single-sided canopy data. By integrating these data with machine-vision technology, a multi-source heterogeneous data fusion canopy collection system is established. The research further explores the correlation model between canopy volume data and spray flow rate, to inform variable spraying implementation. In conjunction with a custom-built spraying device, a comprehensive multi-nozzle adaptive layered variable spraying system was developed. Comparative experiments between conventional continuous spraying and variable spraying were conducted to validate the system’s practicality.
The single shot multibox detector (SSD) object detection algorithm was employed to extract two-dimensional images of the fruit tree canopy, and a novel method for calculating canopy volume, termed the ExG-AABB method, was developed. This method initially employs the super-green algorithm to extract the vegetation mask from the RGB image. Subsequently, it utilizes the axis-aligned bounding box (AABB) algorithm to calculate the canopy characterization data. Finally, it estimates the canopy volume by investigating the linear relationship between the leaf wall area and the logarithm of the canopy volume. This method effectively integrates image processing with point-cloud data analysis, thereby achieving precise estimation of the fruit tree canopy volume.
This research utilized RGB-D images of fruit trees, captured via a depth camera and subsequently transformed into a three-dimensional point cloud. The roughness and divergence indices served as the classification parameters for this process. The support vector machine (SVM) algorithm was employed to classify the point cloud, thereby accurately isolating the canopy portion. Following this, the volume value of the manually measured canopy was taken as the true value. This value was then used to compare the accuracy of five different volume calculation methods: the ExG-AABB method, slice convex hull method, voxel method, three-dimensional alpha shape method, and QuickHull. The experimental results indicate that the ExG-AABB method exhibits superior performance in estimating the volume of the fruit tree canopy.
This paper presents the design of a spray flow model that manipulates the duty cycle of a solenoid valve via pulse width modulation, thereby enabling the variable spraying of a pesticide solution. Utilizing canopy characterization data and real-time parameter adjustments for the multi-nozzle vehicle-mounted spray system, the layering status of the canopy point cloud can be modified. This process controls the flow rate of each nozzle to achieve precise spraying, effectively diminishing the quantity of pesticide used. The spray test results indicate that, in comparison to traditional continuous spraying methods, variable spraying yields more uniform spray coverage. This method reduces pesticide usage by 48.1% while significantly minimizing the coverage of the middle canopy layer, thereby mitigating overlapping spraying phenomena.

Author Contributions

Conceptualization, D.S. and Z.Q.; methodology, D.S. and Z.Q.; software, S.J., W.L. and P.W.; validation, D.S. and Z.Q.; formal analysis, S.J.; investigation, D.S. and Z.Q.; resources, D.S., X.X. and S.S.; data curation, S.J., W.L. and J.X.; writing—original draft preparation, D.S. and Z.Q.; writing—review and editing, D.S. and Z.Q.; visualization, D.S.; supervision, X.X. and S.S.; project administration, D.S.; funding acquisition, D.S. All authors have read and agreed to the published version of the manuscript.

Funding

Key Research and Development Program in Guangdong Province (2023B0202090001), National Natural Science Foundation of China (32472020), Guangdong Province Modern Agricultural Industrial Technology System Innovation Team Construction Special Fund (2023KJ108), 2021 Provincial Rural Revitalization Strategy Special Project Implementation (Guangdong Finance and Agriculture [2021] No. 37).

Data Availability Statement

The data presented in this study are available on request from the corresponding author. The data are not publicly available due to the privacy policy of the organization.

Acknowledgments

We would like to express our gratitude to all authors for their technical assistance in this study, as well as to the anonymous reviewers for their valuable suggestions and critical comments.

Conflicts of Interest

The authors declare no conflicts of interest.

References

  1. Gu, C.; Wang, X.; Wang, X.; Yang, F.; Zhai, C. Research Progress on Variable-Rate Spraying Technology in Orchards. Appl. Eng. Agric. 2020, 36, 927–942. [Google Scholar] [CrossRef]
  2. Qin, W.; Chen, P. Analysis of the Research Progress on the Deposition and Drift of Spray Droplets by Plant Protection UAVs. Sci. Rep. 2023, 13, 14935. [Google Scholar] [CrossRef]
  3. Liu, L.; Liu, Y.; He, X.; Liu, W. Precision Variable-Rate Spraying Robot by Using Single 3D LIDAR in Orchards. Agronomy 2022, 12, 2509. [Google Scholar] [CrossRef]
  4. Abbas, I.; Liu, J.; Faheem, M.; Noor, R.S.; Ali, S.; Solangi, K.; Raza, S. Different Real-Time Sensor Technologies for the Application of Variable-Rate Spraying in Agriculture. Sens. Actuators A Phys. 2020, 316, 112265. [Google Scholar] [CrossRef]
  5. Yan, C.; Xu, L.; Yuan, Q.; Ma, S.; Niu, C.; Zhao, S. Design and experiments of vineyard variable spraying control system based on binocular vision. Trans. Chin. Soc. Agric. Eng. 2021, 37, 13–22. [Google Scholar] [CrossRef]
  6. Hu, L.; Luo, X.; Zeng, X.; Zhang, Z.; Chen, X.; Lin, L. Plant recognition and localization for intra-row mechanical weeding device based on machine vision. Trans. Chin. Soc. Agric. Eng. 2013, 29, 12–18. [Google Scholar]
  7. Hu, Q.; Yang, B.; Xie, L.; Rosa, S.; Guo, Y.; Wang, Z.; Trigoni, N.; Markham, A. RandLA-Net: Efficient Semantic Segmentation of Large-Scale Point Clouds. In Proceedings of the 2020 IEEE/CVF Conference on Computer Vision and Pattern Recognition (CVPR), Seattle, WA, USA, 13–19 June 2020; IEEE: Seattle, WA, USA, 2020; pp. 11105–11114. [Google Scholar]
  8. Mirzaei, K.; Arashpour, M.; Asadi, E.; Masoumi, H.; Bai, Y.; Behnood, A. 3D Point Cloud Data Processing with Machine Learning for Construction and Infrastructure Applications: A Comprehensive Review. Adv. Eng. Inform. 2022, 51, 101501. [Google Scholar] [CrossRef]
  9. Hu, Q.; Yang, B.; Khalid, S.; Xiao, W.; Trigoni, N.; Markham, A. Towards Semantic Segmentation of Urban-Scale 3D Point Clouds: A Dataset, Benchmarks and Challenges. In Proceedings of the 2021 IEEE/CVF Conference on Computer Vision and Pattern Recognition (CVPR), Nashville, TN, USA, 20–25 June 2021; pp. 4975–4985. [Google Scholar]
  10. Li, L.; He, X.; Song, J.; Zhong, C. Spray characteristics on pulse-width modulation variable application based on high frequency electromagnetic valve. Trans. Chin. Soc. Agric. Eng. 2016, 32, 97–103. [Google Scholar] [CrossRef]
  11. Sun, H.; Ye, Q.; Chen, Q.; Fu, L.; Xu, Z.; Hu, C. Tree Canopy Volume Extraction Fusing ALS and TLS Based on Improved PointNeXt. Remote Sens. 2024, 16, 2641. [Google Scholar] [CrossRef]
  12. Yang, Z.; Li, Y.; Duan, J.; Xu, X.; Yu, J.; Shen, D.; Yuan, H. Extraction of the crown information of single tree in orchard based on millimeter wave radar. Trans. Chin. Soc. Agric. Eng. 2021, 37, 173–182. [Google Scholar] [CrossRef]
  13. Qiang, J.; Liu, W.; Li, X.; Guan, P.; Du, Y.; Liu, B.; Xiao, G. Detection of Citrus Pests in Double Backbone Network Based on Single Shot Multibox Detector. Comput. Electron. Agric. 2023, 212, 108158. [Google Scholar] [CrossRef]
  14. Cao, Q.; Wang, K.; Li, H. Detection algorithm for crop target multi-lines of the field image based on machine vision. Trans. Chin. Soc. Agric. Eng. 2010, 26, 187–191. [Google Scholar]
  15. Chen, J.; Jiang, G.; Du, S.; Ke, X. Crop rows detection based on parallel characteristic of crop rows using visual navigation. Trans. Chin. Soc. Agric. Eng. 2009, 25, 107–113. [Google Scholar]
  16. Li, Q.; Yang, G.; Yan, S.; Fan, R.; Huang, Y.; Wang, C. Achieve Accurate Recognition of 3D Point Cloud Images by Studying the Scattering Characteristics of Typical Targets. Infrared Phys. Technol. 2021, 117, 103852. [Google Scholar] [CrossRef]
  17. Zhao, Y.; Tang, W.; Feng, J.; Wan, T.; Xi, L. Reweighted Discriminative Optimization for Least-Squares Problems with Point Cloud Registration. Neurocomputing 2021, 464, 48–71. [Google Scholar] [CrossRef]
  18. Zhang, C.; Zhang, K.; Ge, L.; Zou, K.; Wang, S.; Zhang, J.; Li, W. A Method for Organs Classification and Fruit Counting on Pomegranate Trees Based on Multi-Features Fusion and Support Vector Machine by 3D Point Cloud. Sci. Hortic. 2021, 278, 109791. [Google Scholar] [CrossRef]
  19. Cai, P.; Indhumathi, C.; Cai, Y.; Zheng, J.; Gong, Y.; Lim, T.S.; Wong, P. Collision Detection Using Axis Aligned Bounding Boxes. In Simulations, Serious Games and Their Applications; Cai, Y., Goei, S.L., Eds.; Springer: Singapore, 2014; pp. 1–14. ISBN 978-981-4560-32-0. [Google Scholar]
  20. Ding, W.; Zhao, S.; Gu, J.; Qiu, W.; Guo, B. Measurement Methods of Fruit Tree Canopy Volume Based on Machine Vision. Trans. Chin. Soc. Agric. Mach. 2016, 47, 1–10+20. [Google Scholar] [CrossRef]
  21. Lin, W.; Meng, Y.; Qiu, Z.; Zhang, S.; Wu, J. Measurement and Calculation of Crown Projection Area and Crown Volume of Individual Trees Based on 3D Laser-Scanned Point-Cloud Data. Int. J. Remote Sens. 2017, 38, 1083–1100. [Google Scholar] [CrossRef]
  22. Lecigne, B.; Delagrange, S.; Messier, C. Exploring Trees in Three Dimensions: VoxR, a Novel Voxel-Based R Package Dedicated to Analysing the Complex Arrangement of Tree Crowns. Ann. Bot. 2018, 121, 589–601. [Google Scholar] [CrossRef]
  23. Korhonen, L.; Vauhkonen, J.; Virolainen, A.; Hovi, A.; Korpela, I. Estimation of Tree Crown Volume from Airborne Lidar Data Using Computational Geometry. Int. J. Remote Sens. 2013, 34, 7236–7248. [Google Scholar] [CrossRef]
  24. Garcerá, C.; Moltó, E.; Chueca, P. Spray Pesticide Applications in Mediterranean Citrus Orchards: Canopy Deposition and off-Target Losses. Sci. Total Environ. 2017, 599–600, 1344–1362. [Google Scholar] [CrossRef] [PubMed]
  25. Hočevar, M.; Širok, B.; Jejčič, V.; Godeša, T.; Lešnika, M.; Stajnko, D. Design and Testing of an Automated System for Targeted Spraying in Orchards. J. Plant Dis. Prot. 2010, 117, 71–79. [Google Scholar] [CrossRef]
  26. Nan, Y.; Zhang, H.; Zheng, J.; Yang, K.; Ge, Y. Low-Volume Precision Spray for Plant Pest Control Using Profile Variable Rate Spraying and Ultrasonic Detection. Front. Plant Sci. 2022, 13, 1042769. [Google Scholar] [CrossRef] [PubMed]
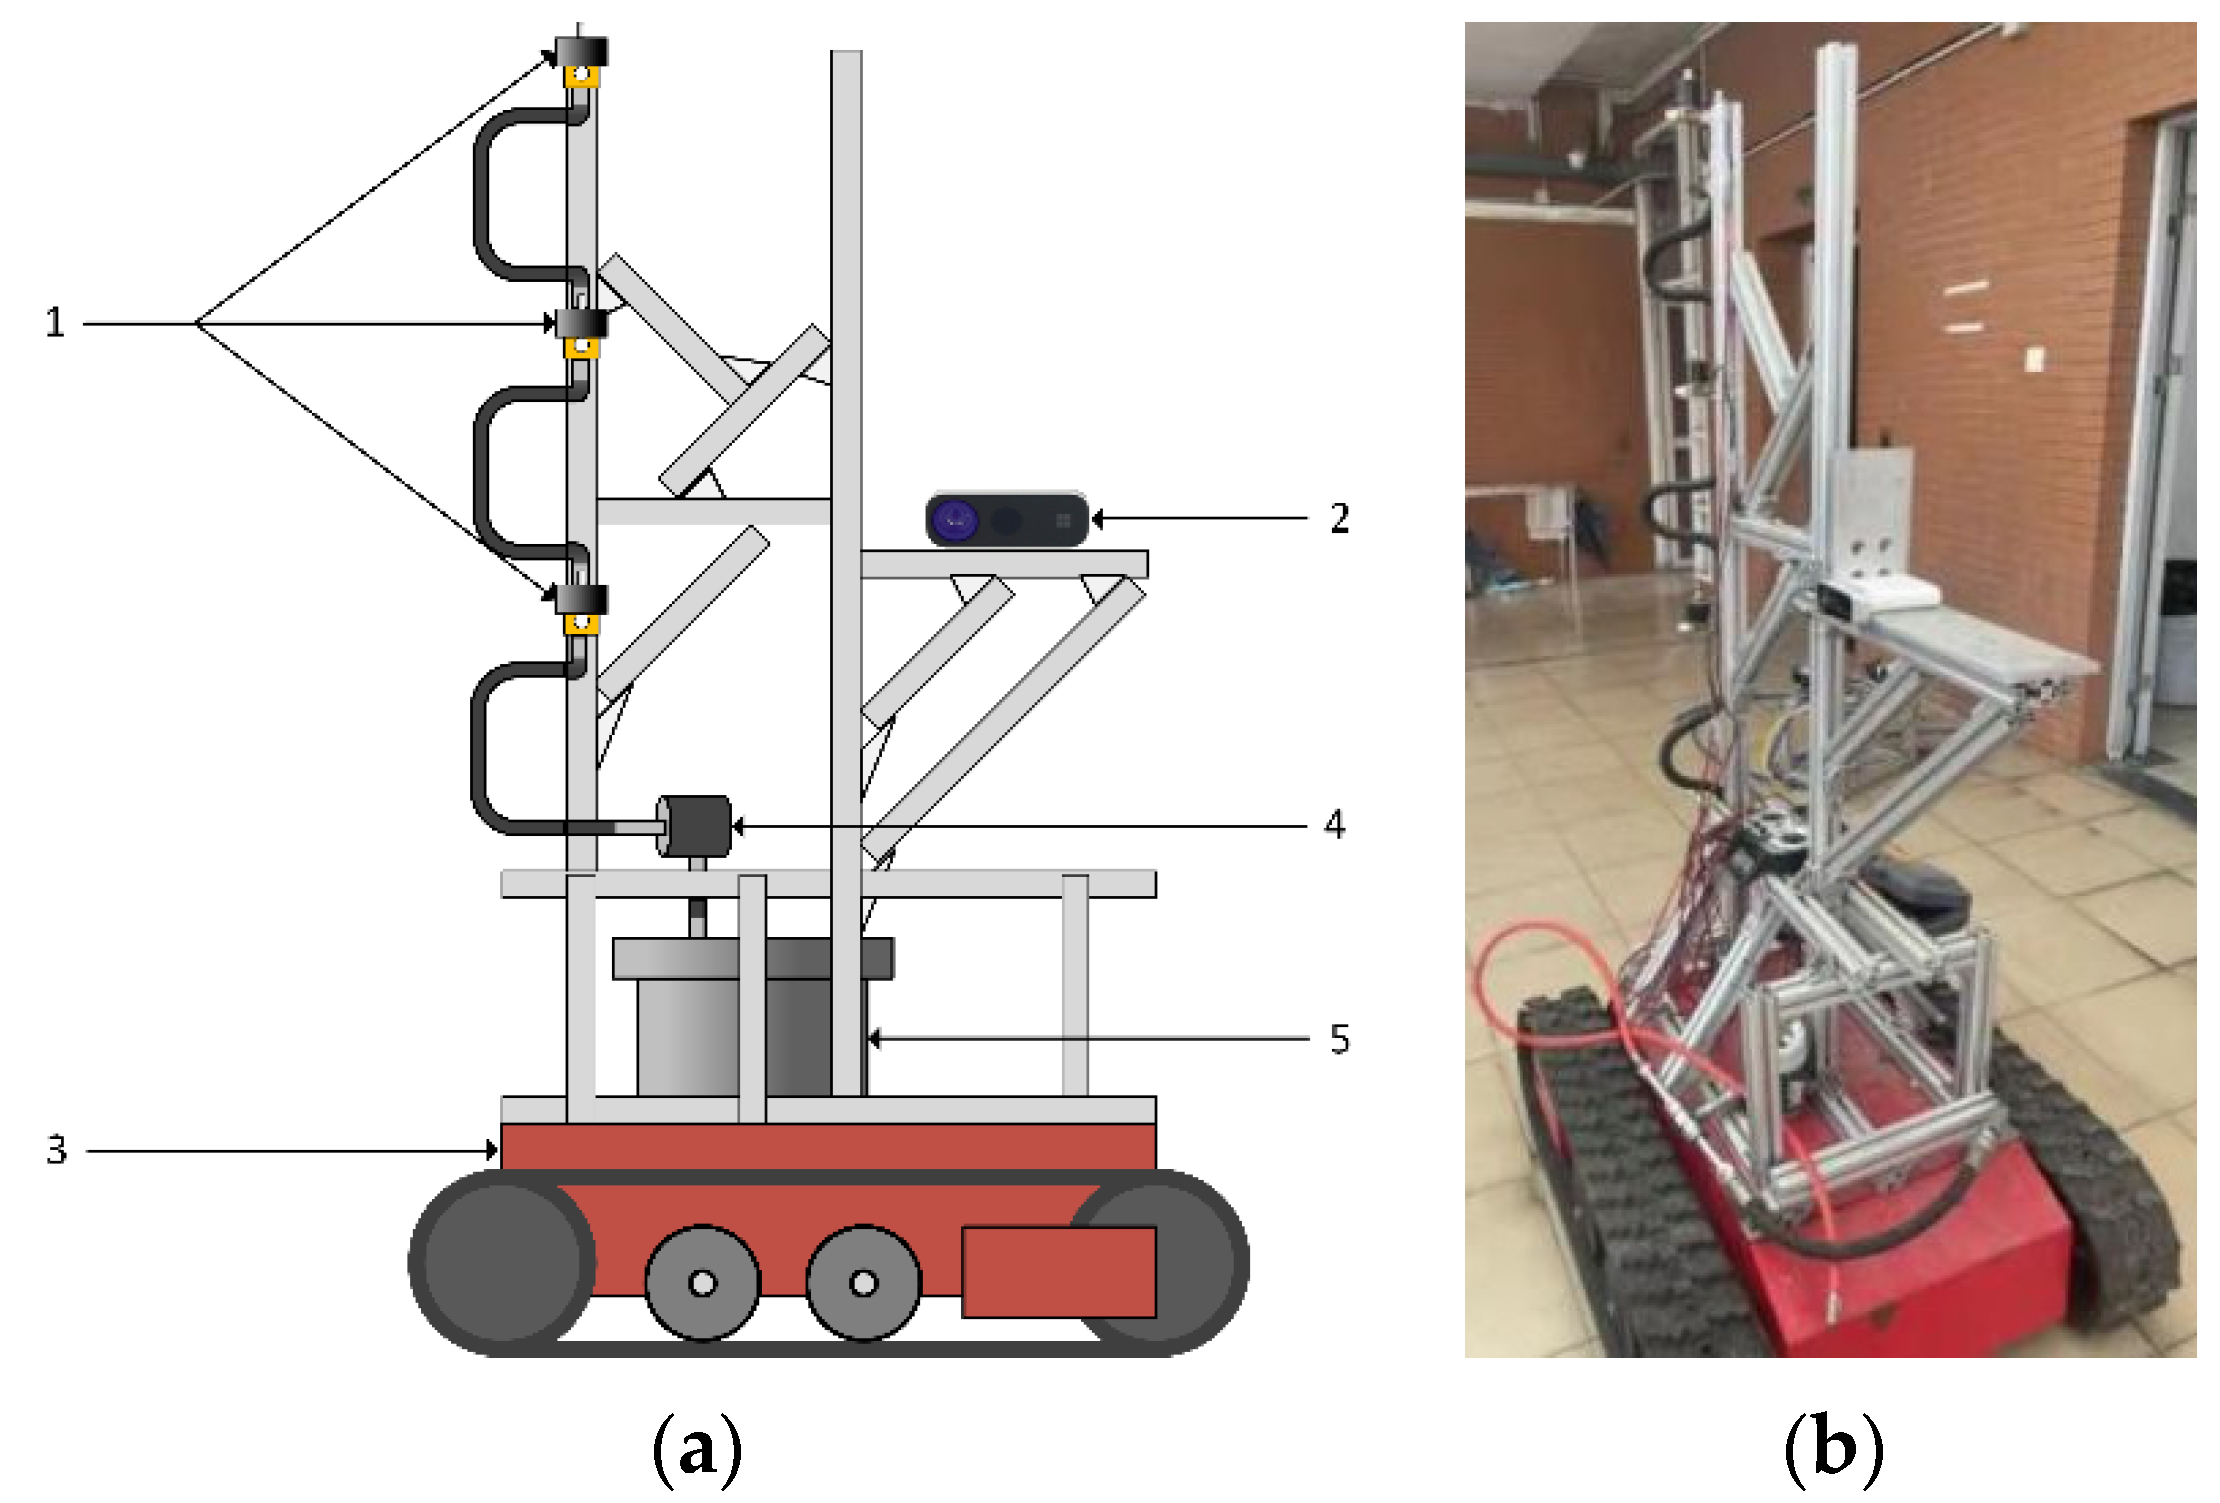
Figure 1. (a) Schematic diagram of the system and (b) physical diagram of the system. Note: (1) sprayer; (2) depth camera; (3) tracked vehicle; (4) flow meter; (5) water tank.
Agronomy 14 02199 g001
Figure 2. Manual measurement schematic of canopy volume.
Agronomy 14 02199 g002
Figure 3. Simulated trees.
Agronomy 14 02199 g003
Figure 4. Canopy profile.
Agronomy 14 02199 g004
Figure 5. (a) Three-dimensional point cloud scene of fruit trees before filtering and (b) after filtering.
Agronomy 14 02199 g005
Figure 6. Sample distribution diagram.
Agronomy 14 02199 g006
Figure 7. Canopy and background classification results.
Agronomy 14 02199 g007
Figure 8. Schematic diagram of the canopy point cloud after using the AABB algorithm.
Agronomy 14 02199 g008
Figure 9. Correlation between the canopy volume logarithm and leaf wall area of the fruit trees.
Agronomy 14 02199 g009
Figure 10. Schematic diagram of the results of three volume algorithms: (a) convex hull calculated in slices; (b) voxel-based method; (c) QuickHull (d) three-dimensional alpha shape.
Agronomy 14 02199 g010
Figure 11. Spray flow rate versus a PWM duty cycle at 0.4 MPa.
Agronomy 14 02199 g011
Figure 12. Water-sensitive paper droplet coverage.
Agronomy 14 02199 g012
Figure 13. (a) Distribution structure and (b) structural geometric plane diagram. Note: a, c: distance in the vertical direction of spraying, b: distance in the vertical direction of overlapping spraying area.
Agronomy 14 02199 g013
Figure 14. (a) Distribution of sampling points in the fruit tree canopy and (b) distribution of water-sensitive paper.
Agronomy 14 02199 g014
Figure 15. Scatter plots using five volume algorithms with manually measured volumes: (a) ExG-AABB method; (b) slicing convex hull method; (c) the volumetric method; (d) three-dimensional alpha shape; (e) QuickHull.
Agronomy 14 02199 g015
Figure 16. Variable spray coverage compared with continuous spray coverage.
Agronomy 14 02199 g016
Table 1. Calculation results for canopy volume for the tested samples.
Tree NumberCrown Height (m)Crown Diameter (m) Volume   ( m 3 )
M1M2M3M4M5M6
11.521.460.441 0.506 0.462 0.481 0.231 0.497
21.381.680.326 0.323 0.358 0.409 0.165 0.373
31.591.690.610 0.770 0.690 0.577 0.343 0.637
41.130.980.108 0.077 0.091 0.181 0.013 0.182
51.331.640.314 0.256 0.333 0.391 0.134 0.332
60.660.950.038 0.060 0.050 0.119 0.039 0.040
70.640.680.061 0.069 0.088 0.177 0.047 0.073
80.920.940.093 0.093 0.159 0.245 0.066 0.161
91.321.290.242 0.256 0.261 0.382 0.104 0.311
100.981.020.120 0.126 0.165 0.303 0.065 0.153
110.961.150.115 0.120 0.165 0.292 0.043 0.138
121.021.360.151 0.159 0.225 0.393 0.075 0.207
131.031.320.216 0.228 0.258 0.404 0.070 0.231
141.241.420.312 0.330 0.262 0.428 0.110 0.351
151.471.430.368 0.390 0.365 0.469 0.234 0.396
160.970.670.071 0.074 0.072 0.161 0.061 0.115
171.121.030.113 0.118 0.114 0.241 0.099 0.121
180.871.010.081 0.085 0.076 0.163 0.050 0.105
190.621.040.076 0.079 0.090 0.168 0.064 0.083
200.801.050.073 0.076 0.076 0.165 0.054 0.104
211.041.100.403 0.428 0.276 0.285 0.288 0.433
221.010.910.245 0.258 0.167 0.226 0.142 0.293
230.841.090.123 0.129 0.118 0.169 0.052 0.152
241.150.920.104 0.109 0.138 0.286 0.069 0.135
250.700.960.053 0.055 0.093 0.216 0.065 0.055
261.031.160.141 0.148 0.140 0.233 0.116 0.120
270.941.040.131 0.138 0.131 0.259 0.049 0.159
280.750.870.052 0.054 0.050 0.143 0.032 0.063
291.051.180.191 0.201 0.162 0.289 0.080 0.212
301.101.250.274 0.290 0.301 0.456 0.185 0.312
MAX1.591.690.610 0.770 0.690 0.577 0.343 0.637
MIN0.620.670.038 0.054 0.050 0.119 0.013 0.040
MEAN1.041.140.188 0.200 0.198 0.290 0.105 0.218
SD0.260.260.139 0.162 0.141 0.121 0.080 0.146
Note: M1, Manual measurement; M2, ExG-AABB; M3, convex hull by slices; M4, voxel-based method; M5, three-dimensional alpha shape method; M6, QuickHull.
Table 2. Variable spray test operational parameters.
Tree NumberLayer NumberNozzle Flow Rate (L/min)Canopy Volume (m3)PWM (%)
110.6830.15865.43
20.8730.20281.95
30.5880.14657.17
210.3150.07333.48
20.5100.11850.45
30.2810.06530.56
310.4540.10545.60
20.5710.13255.70
30.3720.08638.44
Disclaimer/Publisher’s Note: The statements, opinions and data contained in all publications are solely those of the individual author(s) and contributor(s) and not of MDPI and/or the editor(s). MDPI and/or the editor(s) disclaim responsibility for any injury to people or property resulting from any ideas, methods, instructions or products referred to in the content.