Article

Effects of Xerophytic Vegetation-Salix on Soil Water Redistribution in Semiarid Region

1
School of Land Engineering, Chang’an University, Xi’an 710054, China
2
Shaanxi Key Laboratory of Land Reclamation Engineering, Xi’an 710054, China
3
Key Laboratory of Subsurface Hydrology and Ecological Effects in Arid Regionan University, Ministry of Education PR, Xi’an 710054, China
4
China Coal Technology & Engineering Group, Beijing 100013, China
5
CCTEG Xi’an Research Institute (Group) Co., Ltd., Xi’an 710077, China
*
Author to whom correspondence should be addressed.
Agronomy 2024, 14(10), 2200; https://doi.org/10.3390/agronomy14102200
Submission received: 27 July 2024 / Revised: 20 September 2024 / Accepted: 23 September 2024 / Published: 25 September 2024
(This article belongs to the Section Plant-Crop Biology and Biochemistry)

Abstract

:
Xerophytic vegetation re-regulates and allocates water resources through canopy interception, root water uptake and transpiration, and changes the water budget among precipitation, runoff, interception and infiltration, thus having a significant impact on the processes of the hydrological cycle. In this study, we investigated the effect of xerophytic shrub-Salix on soil water redistribution and water budget through an in situ monitoring experiment combined with two-dimensional vegetation water consumption modeling. The results showed that, due to the interception effect of root water uptake, it was difficult for precipitation infiltration to recharge deep soil water and groundwater. The measured data of soil moisture content, hydraulic head and precipitation were used to verify and calibrate the performance of the soil water flow model in the vadose zone by HYDRUS-2D. The effect of roots system on soil water was simulated, and the appropriate spacing of Salix replanting was estimated. Combined with the relationship between the transverse roots system and the crown width obtained by the investigation, it was determined that the spacing between the Salix should be greater than five times the crown width, so that the balance between the water consumption of Salix and the water supply of deep soil by precipitation could be considered. The results of this study are important for estimating groundwater recharge in arid areas and provide practical vegetation replanting options for similar regions.

1. Introduction

Philip proposed the concept of a soil-plant-atmosphere continuum (SPAC) system in 1966 [1]. The energy flow and material transformation in SPAC systems are extremely intense. In arid and semiarid areas, when the groundwater table depth is shallow, the soil water in the SPAC system is bound to be associated with groundwater under the drive of water potential gradient [2]. However, many studies have not explicitly paid enough attention to groundwater. Yang Jianfeng (1999) incorporated saturated aquifers into SPAC to form a groundwater-soil-plant-atmosphere continuum (GSPAC) system, highlighting the important role of groundwater in the system [3]. There are several interfaces for water exchange in GSPAC, one of which is the soil–root interface that controls the evapotranspiration process. Water exchange at the soil–root interface is the amount of water absorbed by the roots system, which usually accounts for more than two thirds of soil water consumption. More importantly, 65% of precipitation returns to the atmosphere through evapotranspiration, and more than 50% of transpiration flows through the soil–root interface [4]. In the processes of water transformation in GSPAC, root water uptake is affected by atmospheric, soil water conditions and groundwater level, which is one of the most difficult problems in soil water transformation.
Vegetation directly or indirectly changes soil water flow through canopy interception and root water uptake [5,6,7,8]. Especially in dry years, vegetation tends to increase the spatial variability of soil water [9]. Compared with other xerophytic vegetation, shrubs have an extensive roots system and high water consumption characteristics, which result in severe water deficit in deep soil and the formation of soil dry layers [10,11]. Some soil dry layers cannot be recharged through precipitation, which leads to changes in the structure and function of a vegetation ecosystem [12]. At the same time, xerophytic vegetation also affects groundwater recharge. For example, Huang et al. (2010) and Gates et al. (2011) found that the change in land use type from grassland to forest land/forest will lead to the decrease of groundwater recharge [13,14]. Allen (2001) found that although vegetation enhanced the water holding capacity of soil, the groundwater recharge rate was reduced by one tenth [15]. The root water uptake is similar to a water pump, intercepting and extracting a large amount of soil water and groundwater supplemented by precipitation [16,17]. Especially when the root depth exceeds the groundwater table depth, the roots system even directly consumes groundwater, causing the decline in groundwater level [18]. Although previous studies have shown that vegetation affects groundwater recharge, groundwater recharge in arid and semiarid areas is relatively small, and is difficult to quantify accurately [19,20].
To sum up, vegetation, as an important regulator of terrestrial water cycle, plays an important role in water cycle and water budget in the GSPAC system. Therefore, in this study, a typical xerophytic shrub in the Mu Us sandy land, Salix, was selected to study the impact of vegetation water consumption on soil water redistribution, and quantify soil water budget under the influence of vegetation at the individual plant scale. It is expected to provide support for vegetation restoration and water resource management in the study area.

2. Methods and Materials

2.1. Study Area

The study area is located in the southern edge of the Mu Us sandy land, which is 108°17′36″–109°40′22″ E and 37°38′54″–39°23′50″ N (Figure 1). Its administrative division belongs to Galutu Town, Wushen Banner, Ordos City, Inner Mongolia. Ordos city is an important energy and chemical base, and a typical agricultural and pastoral interlacing area. With the development of the economy and society, the demand for water resources is increasing, and the shortage of groundwater resources has become the main bottleneck restricting economic and social development and ecological construction. The study area belongs to a temperate continental monsoon climate, with large diurnal temperature difference, low humidity, sparse and uneven distribution of precipitation and strong evaporation. The annual potential evapotranspiration ranged from 1900 mm to 2500 mm. The average annual precipitation is 350–400 mm, mainly concentrated in July to September, with large inter-annual variation. The annual average temperature is 7.8 °C, and the annual sunshine is 2800~3000 h. In the past 20 years (2000–2020), the average annual precipitation is 378 mm, the average annual temperature is 8.7 °C and the climate is developing towards a warm and humid trend.
The study area is dominated by aeolian sand landform, with fixed and semi-fixed dunes distributed. The dune topography is highly undulating, and most of them appear alone or in the form of dune–dune depression, with shrubs or no vegetation cover. The soil of aeolian sand landform in Mu Us sandy land is mainly aeolian sand, and its constituent particles have coarse particle size, loose structure, uniform texture, little organic matter content and soil bulk density is 1.45 g·cm3, which is measured by SEDIMAT4-12 (UGT, Müncheberg, Germany) (Table 1). The water retention capacity of aeolian sand is weak, and the field water retention capacity is 6.85%, and the maximum water retention capacity is 14.82%, but the hydraulic permeability is strong, and the saturated hydraulic permeability coefficient is 580 cm·day−1. The growth period of most vegetation in Mu Us sandy land is from May to November every year, among which May to mid-June is the germination period, mid-June to late July is the growing period, August to September is the maturing period and October to November is the wilting period. During the growth period, the roots system of vegetation has a strong water consumption, and the internal transformation of precipitation, soil water and groundwater is intense. The period from November to April of the following year is the dormant period of vegetation and the soil freezing period, during which precipitation and vegetation water consumption are almost zero.

2.2. Field Monitoring Experiment

The field monitoring experiment site was set on a dune with a relatively flat surface of about 25 m2 (Figure 2), and the vegetation type was dominated by Salix. There was a mature perennial Salix with a height of about 3.5 m and a crown width of about 5.6 m in the experiment site, surrounded by bare aeolian sand. The soil moisture content and temperature sensors (ECH2O-5 TM (±1–2%), Decagon, Pullman, WA, USA) were installed in the soil inside the experiment site, and the location was as follows: the horizontal direction was 60 cm, 200 cm, 500 cm away from the center of Salix; the vertical depth was 3 cm, 10 cm, 20 cm, 30 cm, 50 cm, 100 cm, 200 cm, 300 cm. The monitoring frequency was 1 h/time. The specific field monitoring experiment site and the sensor installation details could be seen in Figure 2. The experiment was implemented from 2 June 2019 to 6 November 2019.
There was a weather station (MetproTM, Campbell, CA, USA) approximately 200 m away from the experiment site, which could provide atmospheric pressure, net solar radiation, precipitation, temperature, humidity, wind speed and direction, sunshine hours, etc., and the recording frequency was 1 h/time.

2.3. Determination of Soil Hydraulic Parameters

Laboratory experiments were conducted according to the soil samples obtained in the field to determine the soil hydraulic parameters. The saturated soil moisture content and residual soil moisture content of aeolian sand were obtained by a ring knife and immersed in water until saturated and then measured by drying method. The saturation permeability coefficient of aeolian sand was measured in situ by double ring experiment. The soil–water characteristic curve of aeolian sand was observed by a Ku-pF unsaturated conductivity measurement system (ku-pF MP10, UGT, Müncheberg, Germany), and the soil–water curve was fitted by Matlab (9.2.0.538062(R2017a)). The results of soil hydraulic parameters measurement are detailed in Table 2.

2.4. Modeling

The Hydrus-2D model can simulate water flow, heat, and solute transport in a two-dimensional variable-saturation watershed. In addition, the model can be used to estimate root water uptake and thus assess the spatial distribution of soil moisture content. Under the assumption of ignoring the air phase and the soil thermal gradient, the modified form of Richards equation is used to describe the water movement in the soil, and the Richards equation is solved numerically by Galerkin finite element method.
θ h t = x K h h x + z K h h z + K h S h
where θ(h) is the volumetric soil moisture content (cm3·cm−3); h is the pressure head (cm); K(h) is the unsaturated hydraulic conductivity (cm·day−1); t is time (d); x and z are the spatial locations (cm).
The root water uptake is calculated according to the Feddes model:
S h = τ h β x , z T P L t
where Tp is the potential transpiration rate (cm·day−1); Lt is the surface length associated with transpiration (cm); β(x, z) is the root water uptake distribution function (cm−2); and τ(h) is the root water uptake stress reduction function.
The soil water retention curve θ(h) and hydraulic conductivity function K(h) need to be known for the model. The van Genuchten equation is used to describe the hydraulic characteristics between soil moisture content and pressure head, as well as the relationship between unsaturated hydraulic conductivity coefficient and soil pressure head [7]:
θ h = θ r + θ s θ r 1 + α h n 1 1 n   h < 0     θ s   h 0
K h = K s 1 α h ) n 1 1 + α h n m 2 1 + α h n m 2
where θs is the saturated soil moisture content (cm3·cm−3); θr is the residual soil moisture content (cm3·cm−3); Ks is the saturated hydraulic conductivity (cm·day−1); α is the air inlet parameter (cm−1); n is the pore size distribution parameter (-). α and n are the empirical coefficients that determine the shape of the soil water retention curve.
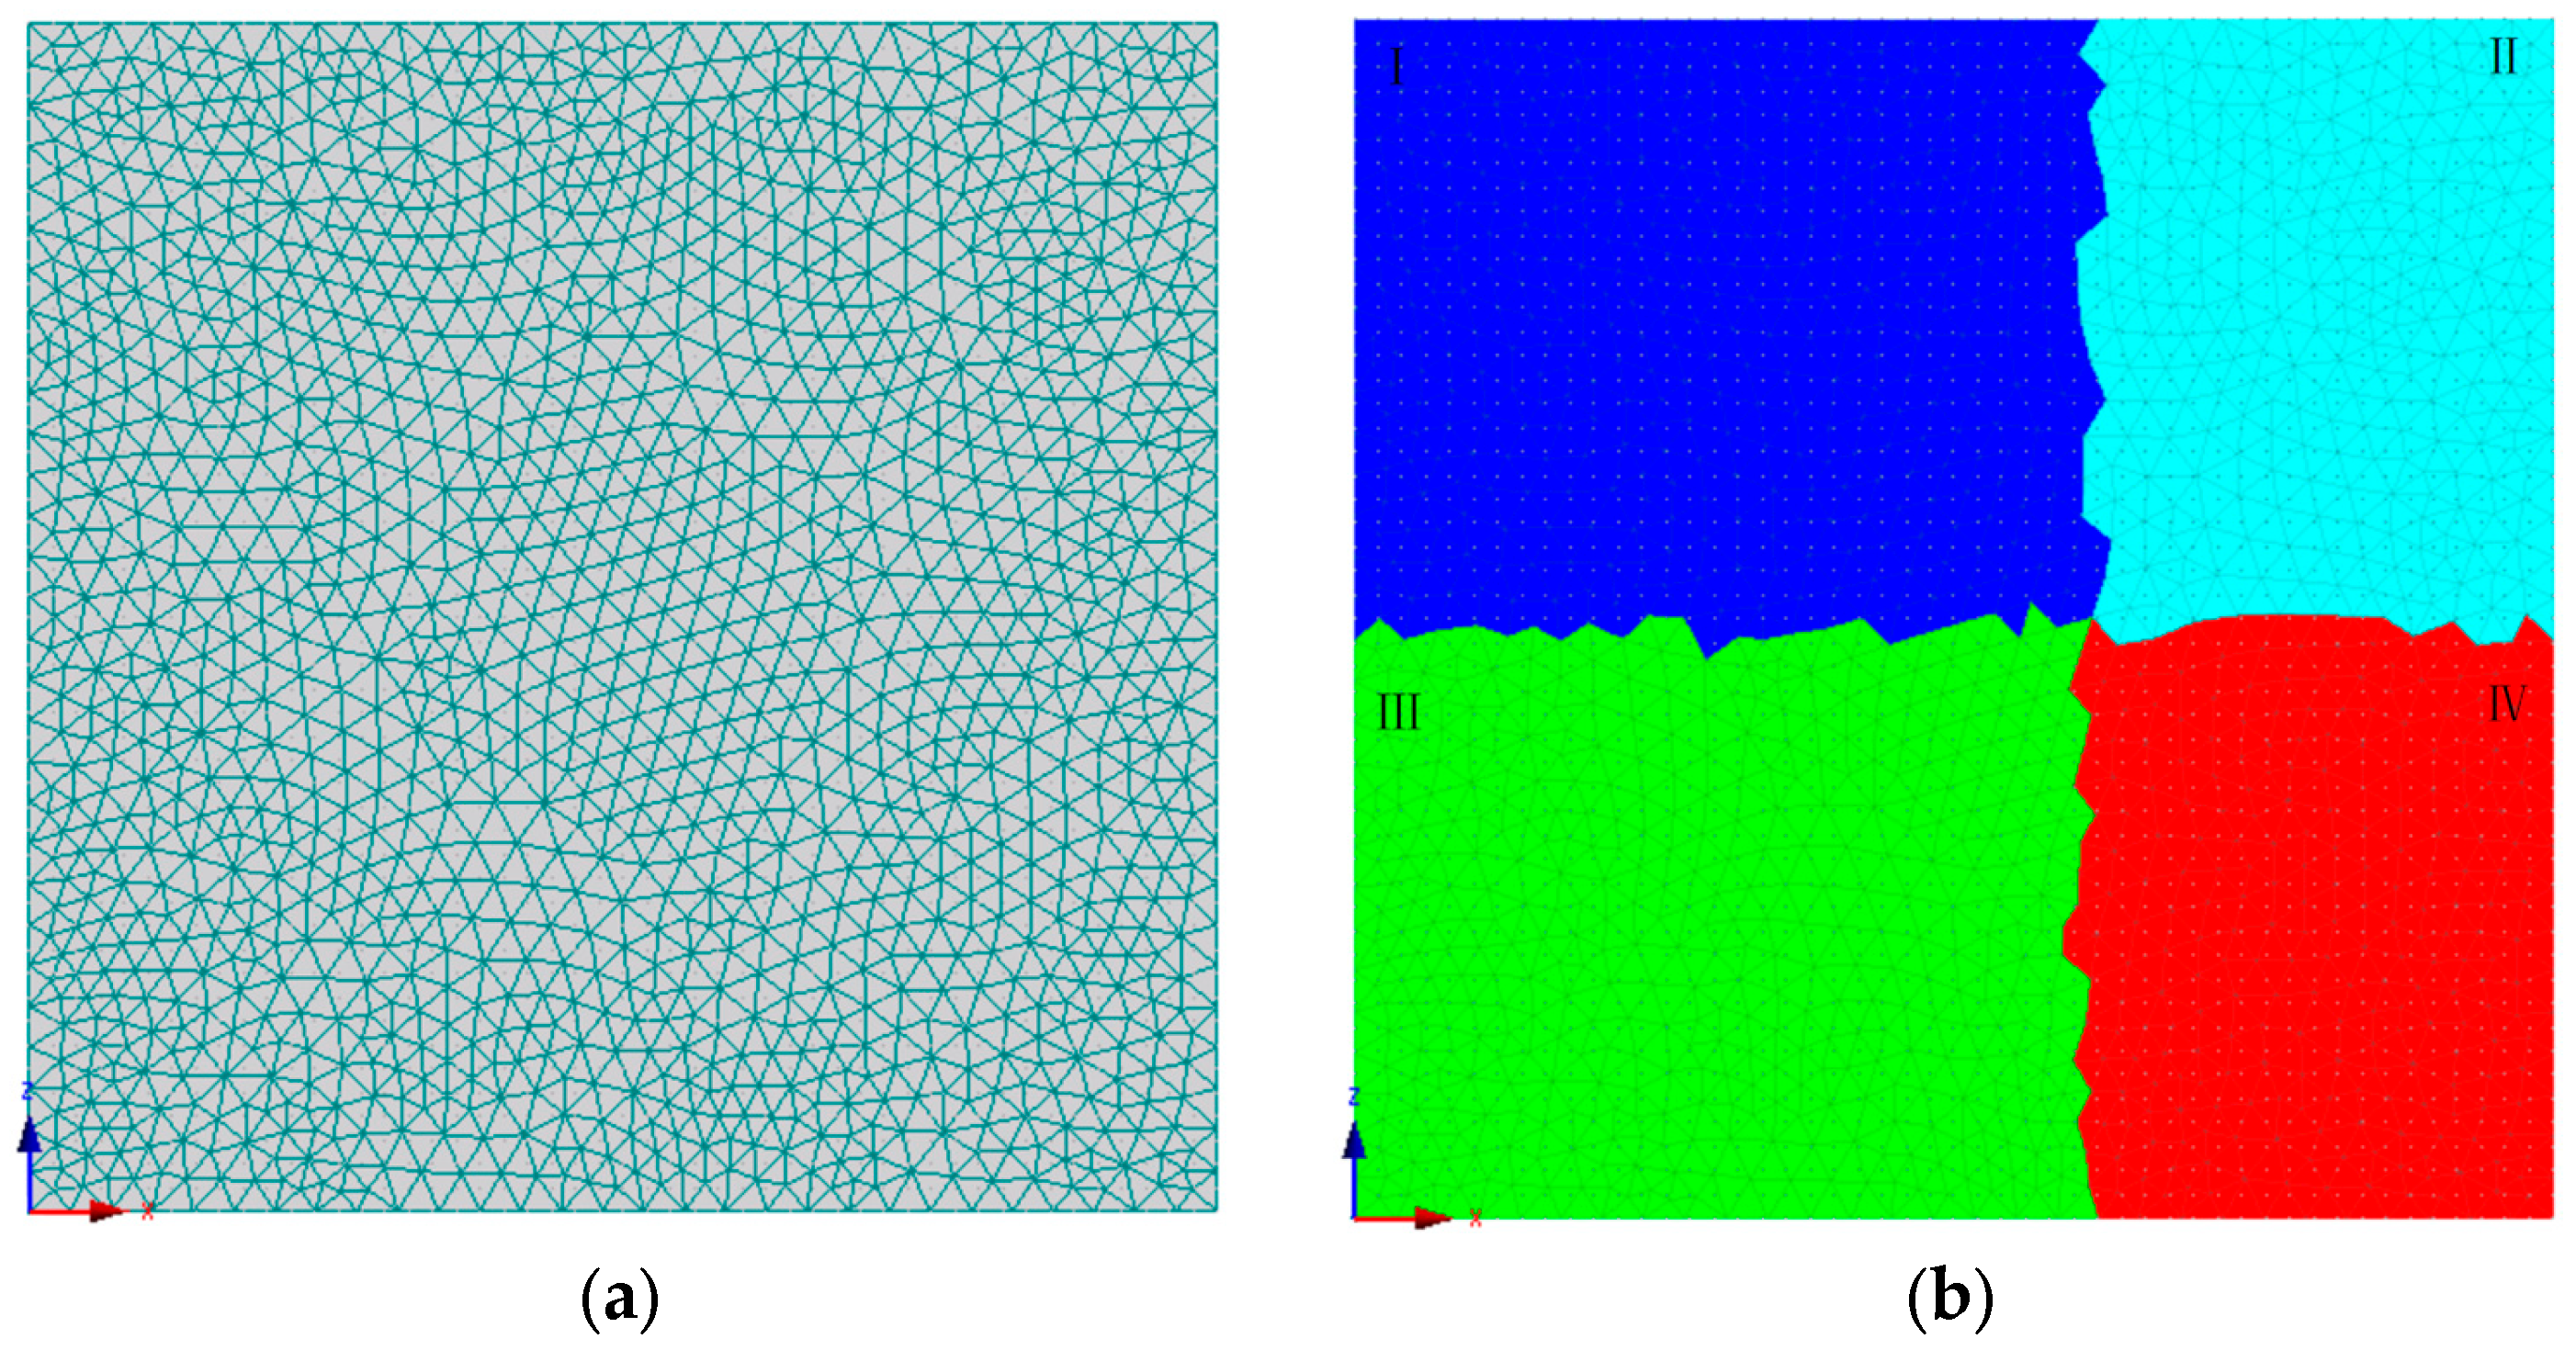
HYDRUS-2D also includes a Marquardt–Levenberg-type parameter optimization algorithm for retrieving soil hydraulic parameters from measured data. In this study, HYDRUS-2D was used to construct a simplified conceptual model to analyze the transport process of soil water in vegetated and non-vegetated soils, and to calibrate the model parameters. The purpose of calibration is not to obtain a model that can accurately reproduce the in situ monitoring experiment process, but to obtain a reasonable and credible model. The model domain is 10 m × 10 m vertical two-dimensional volume, which is divided by triangular mesh. The model distinguishes the upper soil, which is dominated by rapid evaporation and infiltration, from the deep soil, where mainly root water uptake occurs, and has four soil zones: the shallow and deep layer of non-vegetated soil, and the shallow and deep layer of vegetated soil, as shown in Figure 3. In this study, zone I was defined as the root water uptake zone, zone II was the infiltration zone, zone III was the subroot zone and zone IV was the deep recharge zone. This partition can easily represent evaporation from shallow soil layers and distinguish soil water from vegetated land and bare land.
The upper boundary condition of the model is the realistic atmospheric boundary condition, and daily precipitation, as well as potential evaporation and transpiration rates, needs to be specified. The lower boundary condition of the model is defined as the free drainage boundary. The lateral boundary condition is set to the zero flux boundary. The initial conditions of the model are linear differences based on the pressure head converted from the measured soil moisture content through the soil water retention curve.
Since the Salix selected for the experiment was an adult vegetation, it was assumed that the roots system of the Salix was fully developed and did not change with time. The observed root density distribution profile of Salix: the root density decreased linearly in both vertical and horizontal directions, and the maximum root density was located at a certain deep position in the vertical direction within the root zone. Therefore, the maximum root depth of Salix is set as 5.0 m, the location of maximum root density is 0.4 m, the radius of horizontal root distribution is 3.0 m and the location of the maximum radius is 0.4 m.
The reliability of vegetation root water uptake model was analyzed by R2, RMSE and MAE. The higher correlation coefficient R2 indicates that the simulated value is more reliable. The accuracy of the model can be reflected in RMSE because it is very sensitive to any error (large or small) in the measurement set. MAE is the simulated value that deviates from the measured value and reflects the reliability of the model. The calculation formula of RMSE and MAE is as follows:
R M S E = 1 n i = 1 n S i C i 2
M A E = 1 n i = 1 n S i C i C i
where n is the number of observation points, S is the simulated value and C is the calculated value.

2.5. Water Budget

According to the soil water balance method in vertical two dimensions, the relationship among precipitation inputs, changes in soil water storage, evapotranspiration (ETa) and deep recharge are determined as follows:
W = Q i n Q o u t
where W is changes in soil water storage (cm2), Q i n is the flux of water into the soil medium (cm2) and Q o u t is the flux of water flowing out of the soil medium (cm2). When the upper boundary of the soil medium is the surface, Q i n represents precipitation, and Q o u t represents evaporation and water flux flowing out of the bottom boundary.
In order to analyze the drive processes of rainfall on soil water better, the variability of all rainfall events in this year was analyzed. The result shows that the rainfall events; variation coefficient over 15-days on average is large (see Figure 4), which will bring uncertainty; although the rainfall events variation coefficient less than 10 days on average is small, it will increase the computing efforts. So, rainfall events at 15 days on average is the optimal and 15 days was set as the time step in this study.

3. Results and Discussion

3.1. Identification of the Model

During the simulation, the soil hydraulic parameters, such as the residual soil moisture content (θr) and saturated soil moisture content (θs), were not sensitive to the model results. Therefore, in the process of parameter inversion, θr and θs were set as fixed values. The other parameters were optimized by inversion. Moreover, the medium was homogeneous silty sand and its hydraulic parameters were uniform in theory. But the soil characteristics varied slightly with depth after many simulation analyses. Therefore, the domain was stratified properly in order to achieve the best fitting effect. The aeolian soil land was divided into five layers: 0–60 cm, 60–120 cm, 120–200 cm, 200–250 cm, 250–300 cm. The hydraulic parameters of each soil layer were slightly different, and the optimized hydraulic parameters are shown in Table 3.
To further analyze the accuracy of the model simulation results, the statistical values, ME, RMSE and MAE, of the measured soil moisture content and its simulated values were calculated (Table 4). The results indicate that the simulated results are basically consistent with the measured values at each depth except for the slight deviation for shallow soil moisture content. Therefore, this model can be used to analyze the soil water redistribution and water budget under the influence of Salix.

3.2. Distribution of Soil Water in Bare Land and Vegetated Land

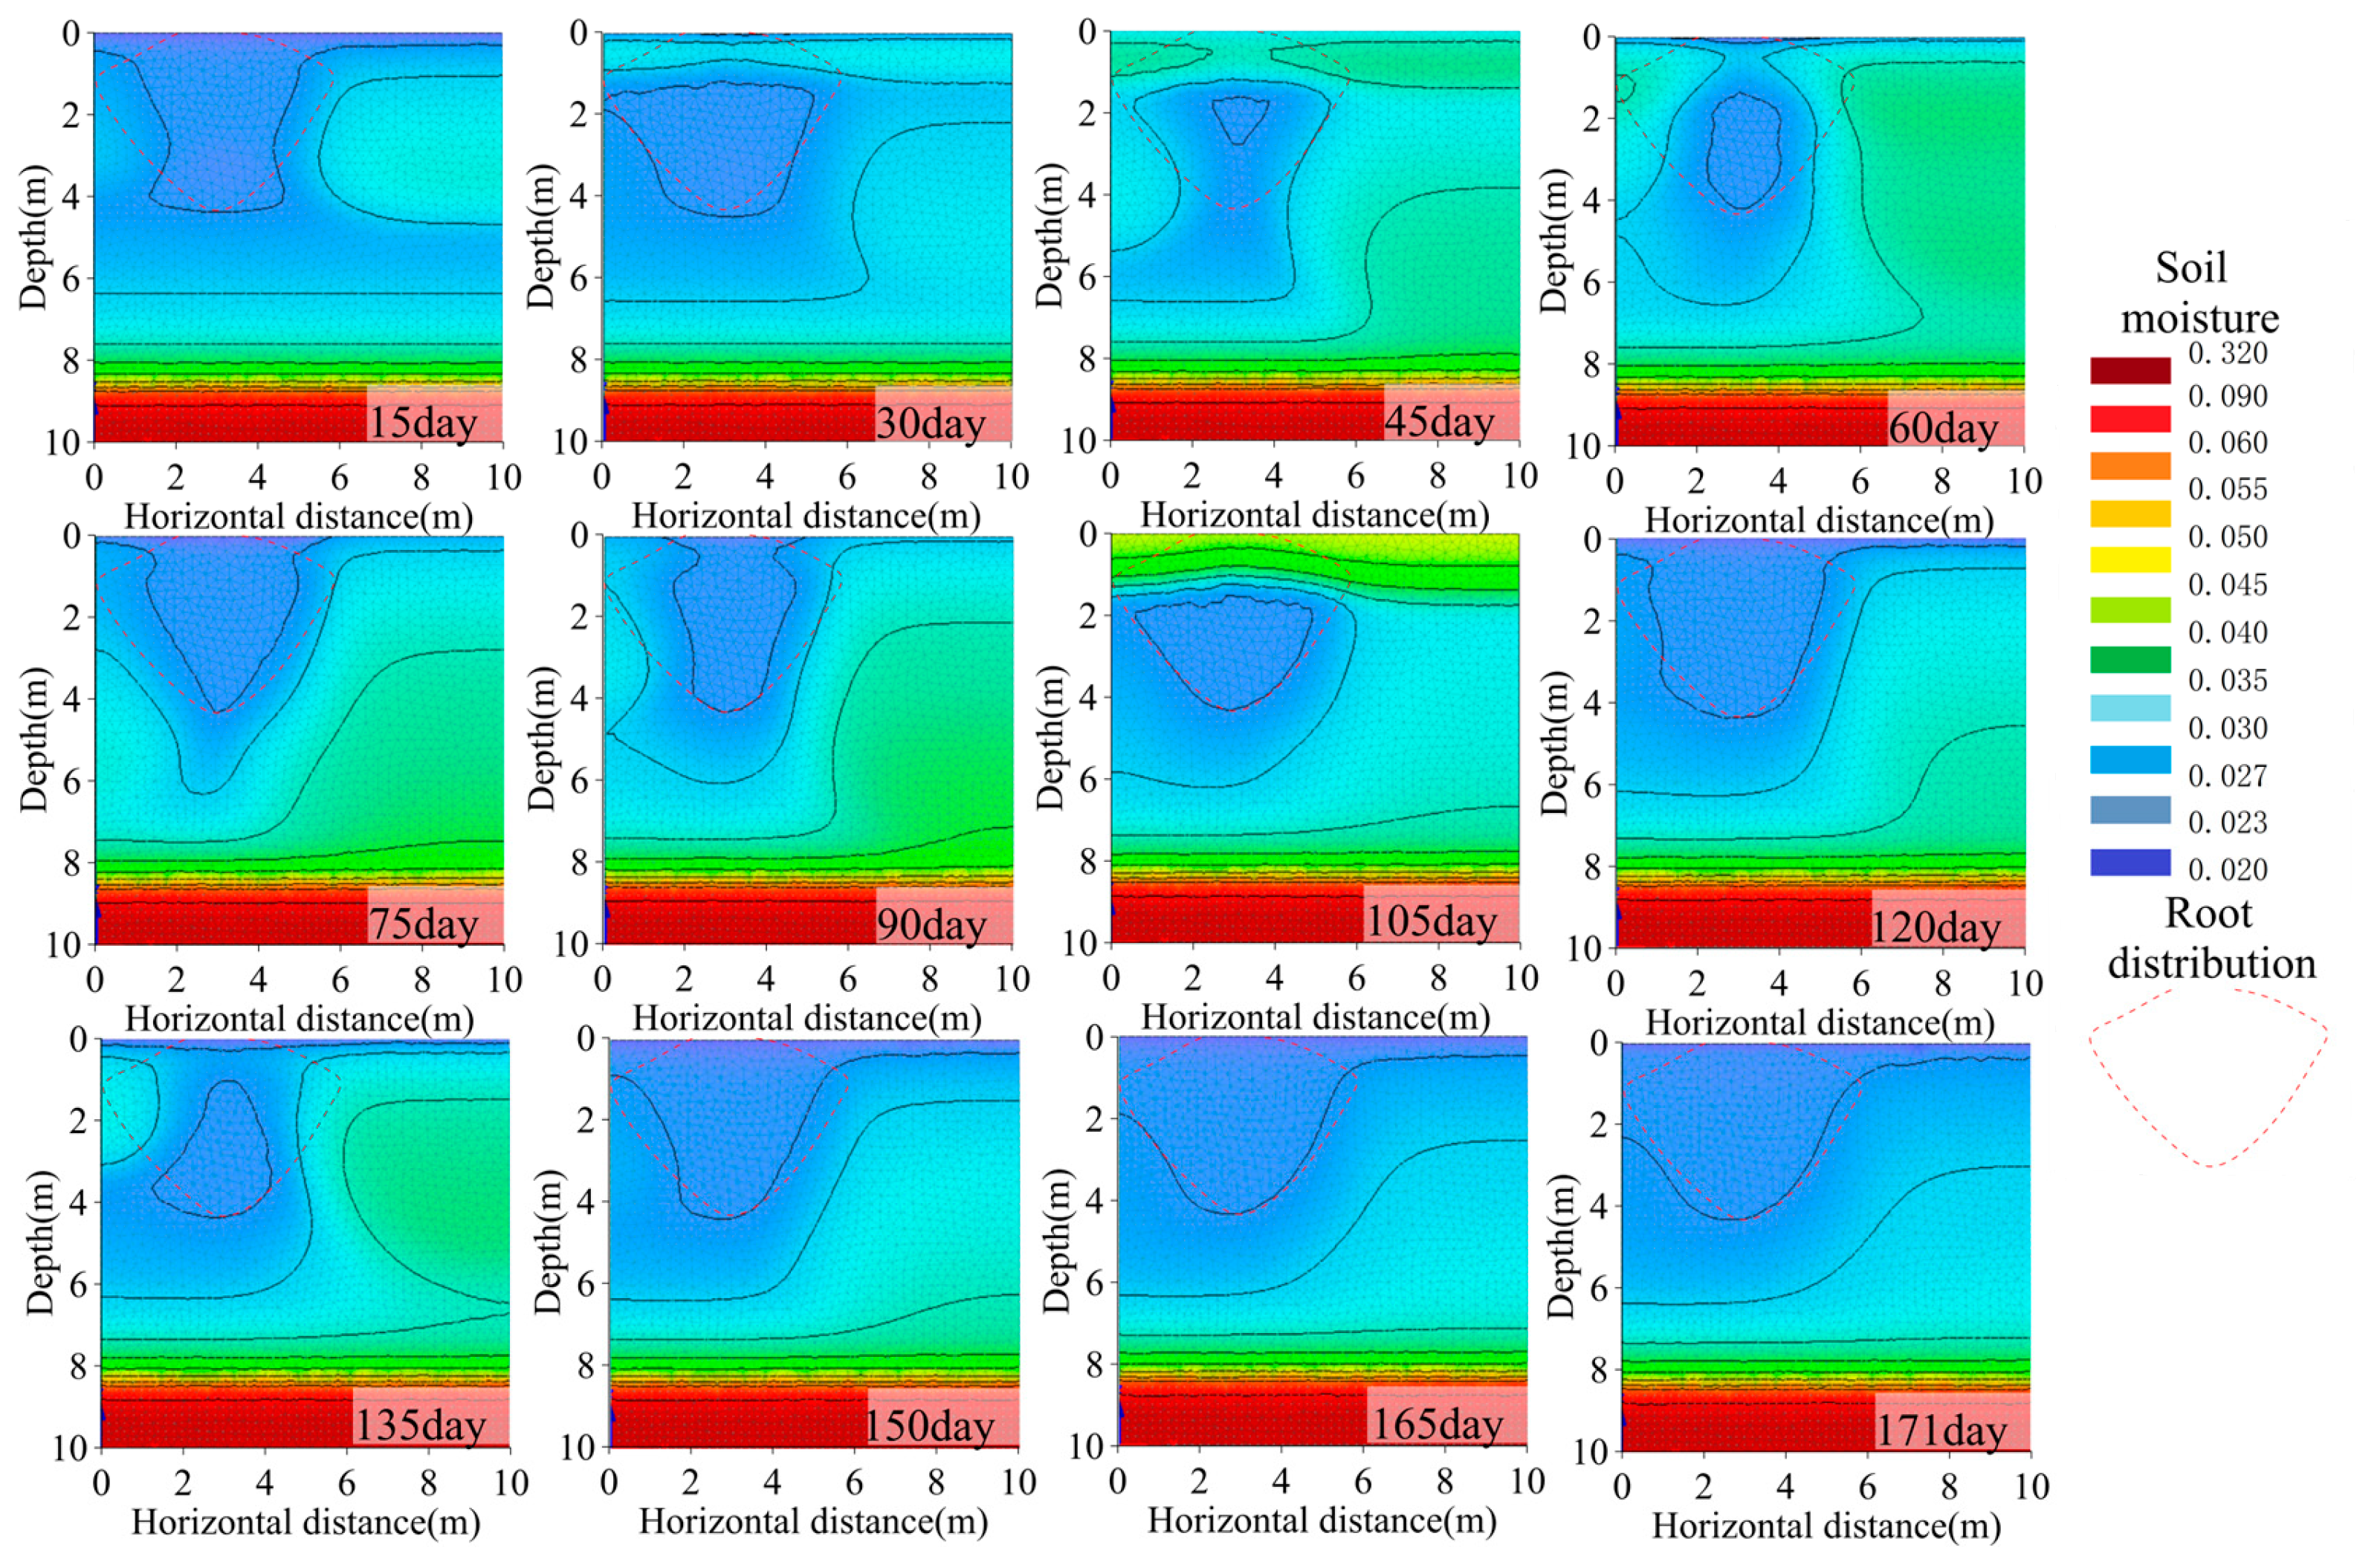
Figure 5 shows the evolution of soil moisture content under the influence of root water uptake. It can be seen that the soil moisture content in the root zone changed mostly, and the root water uptake resulted in serious soil water loss in the root zone. Soil moisture content in the non-root zone was generally higher than that in the root zone, and soil water was driven to transfer to the root zone under the action of hydraulic head gradient, resulting in a decrease in soil moisture content in the non-root zone indirectly. In the vertical direction, the maximum depth of root water uptake was more than 7 m. In the horizontal direction, the influence range of root water uptake on soil water reached 8 m, which was 1.7 times the horizontal distribution of the roots system. Under continuous drought conditions, the range of soil water deficit induced by root water uptake was similar to the distribution of roots density. When precipitation occurred, the soil moisture content near the edge of horizontal roots system was higher than that in the core root zone of the same depth. This is because the root density in the edge of horizontal roots system is small, and the interception of roots system on infiltration precipitation is limited. Therefore, the infiltrated precipitation can penetrate down and replenish the deep soil layers and even groundwater.
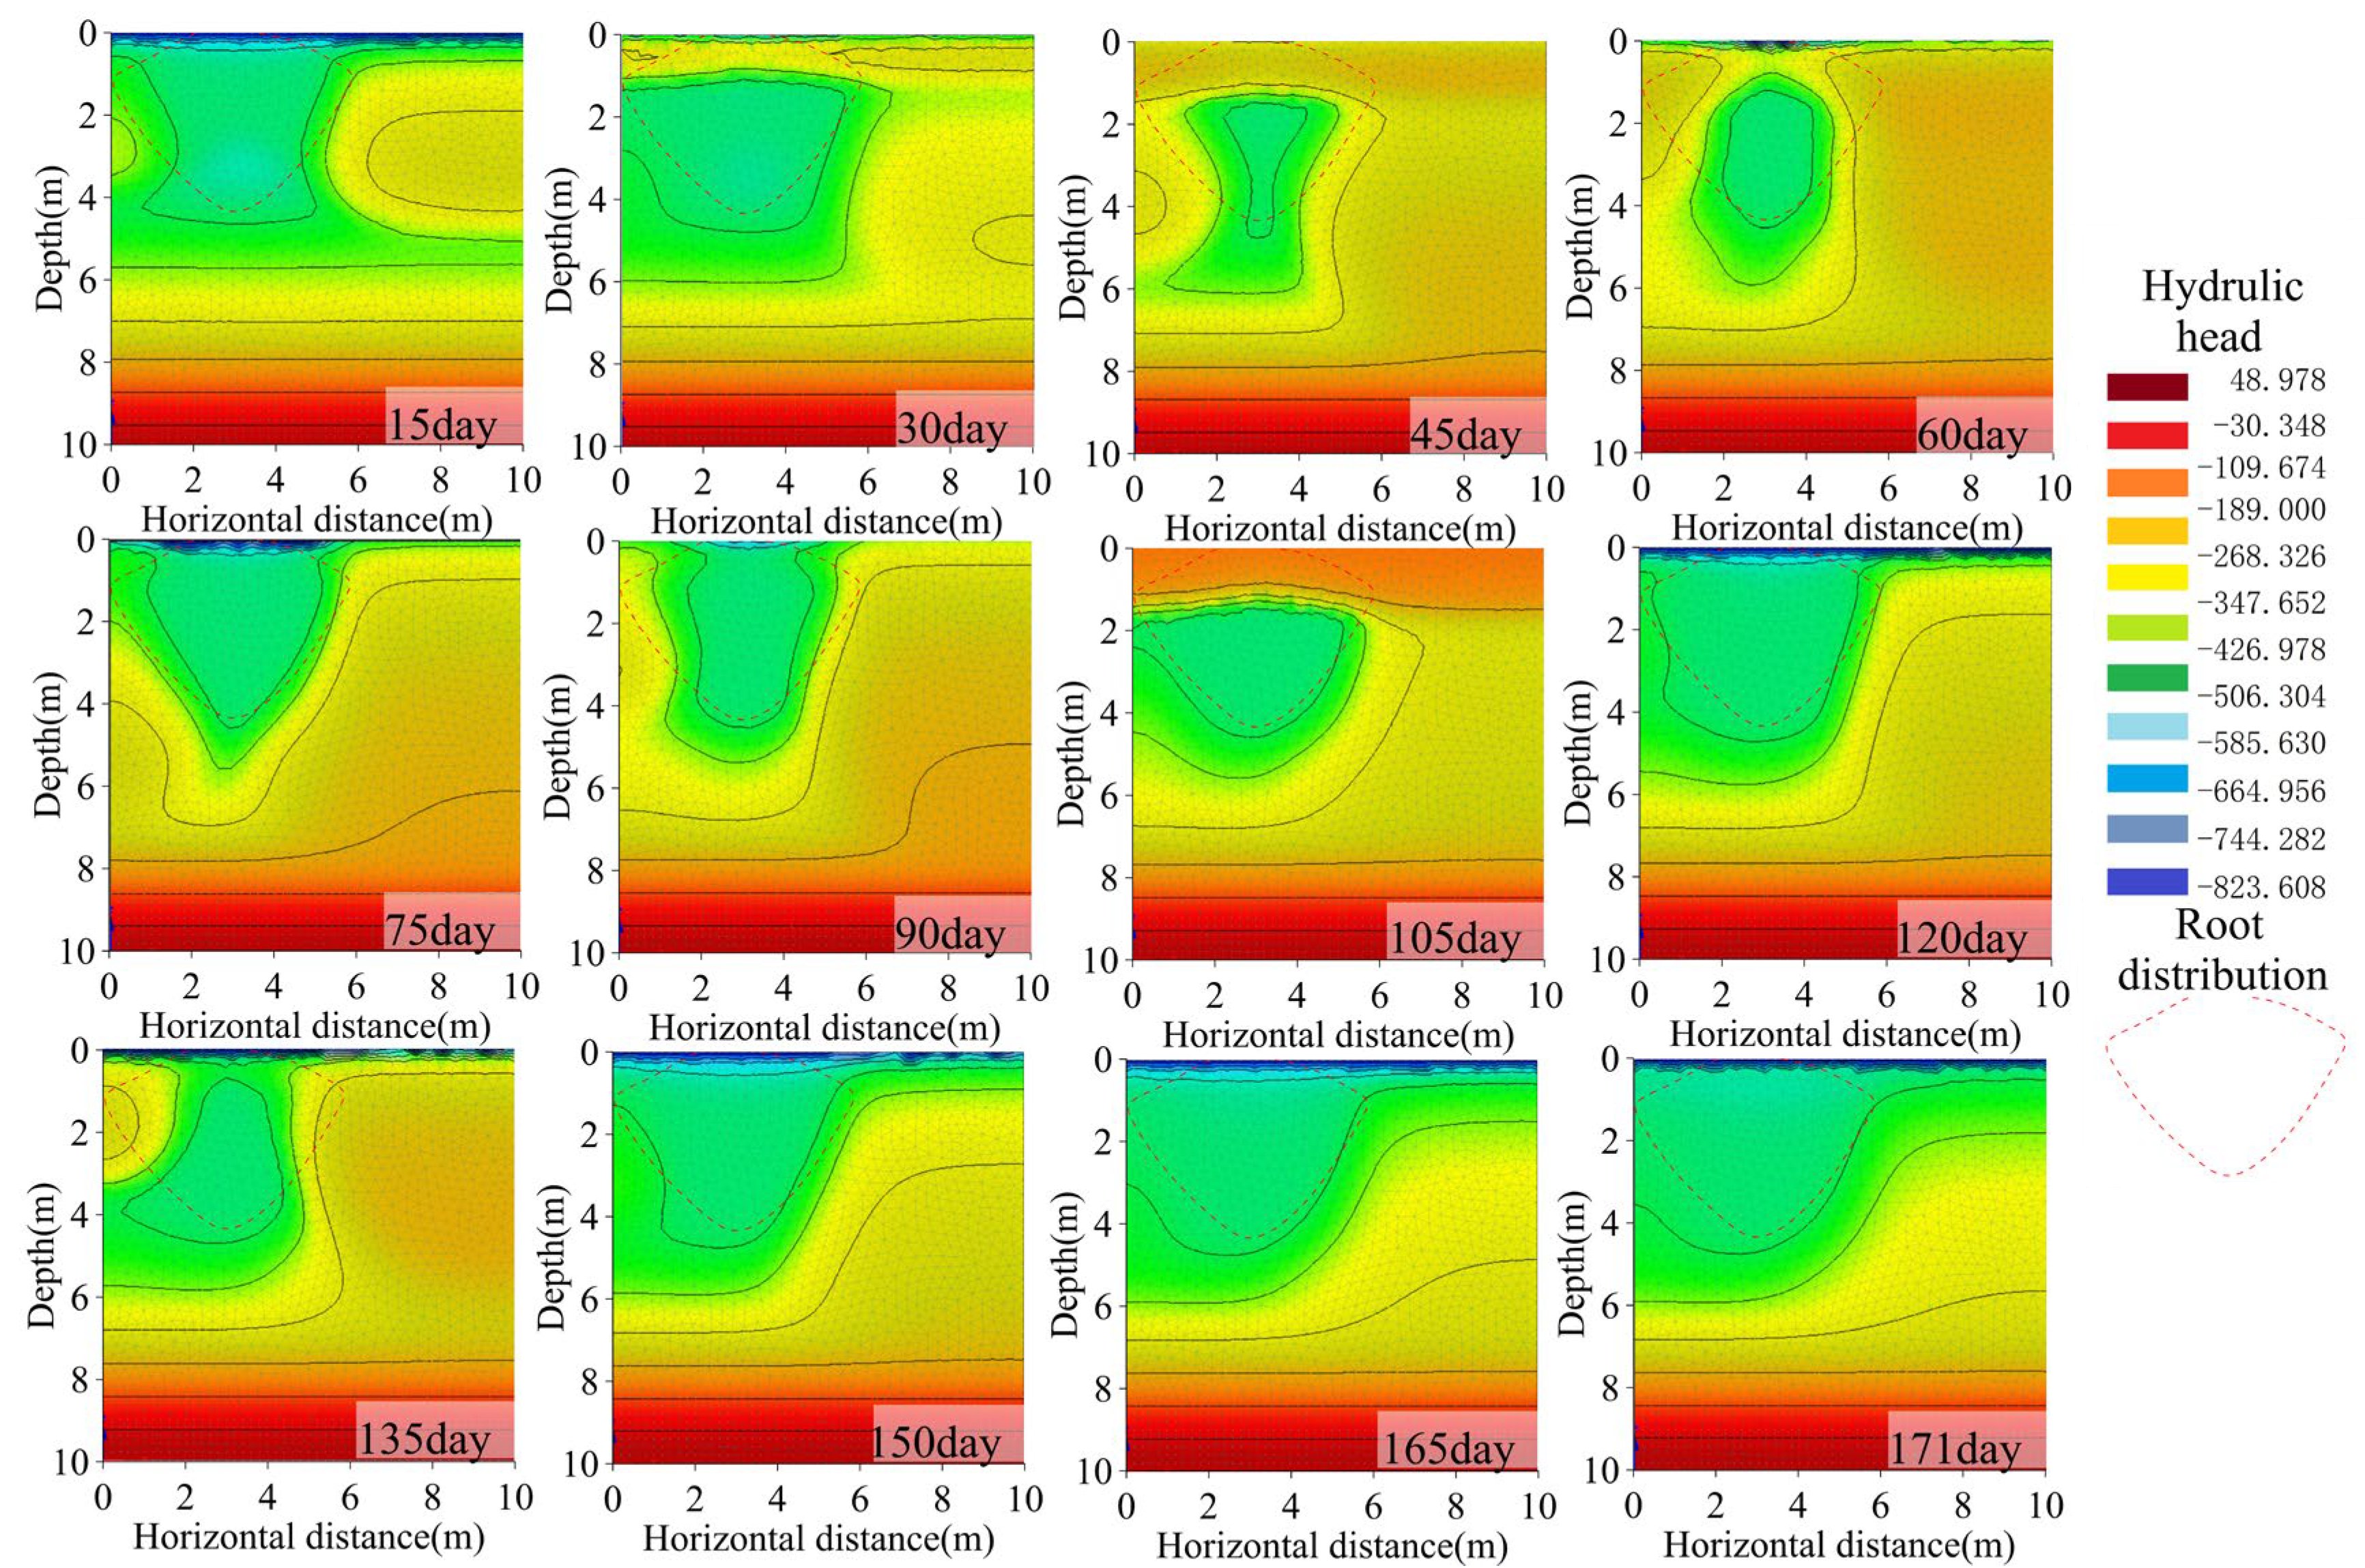
Figure 6 shows the hydraulic head distribution of the soil profile under the influence of root water uptake. It can be seen that the hydraulic head in the root zone was the lowest, and when precipitation occurred, the hydraulic head in the shallow root zone increased significantly. The hydraulic head of soil in the non-root zone was higher than that in the root zone, and soil water transferred to the root zone under the effect of hydraulic head gradient, which supports the results shown in Figure 4.
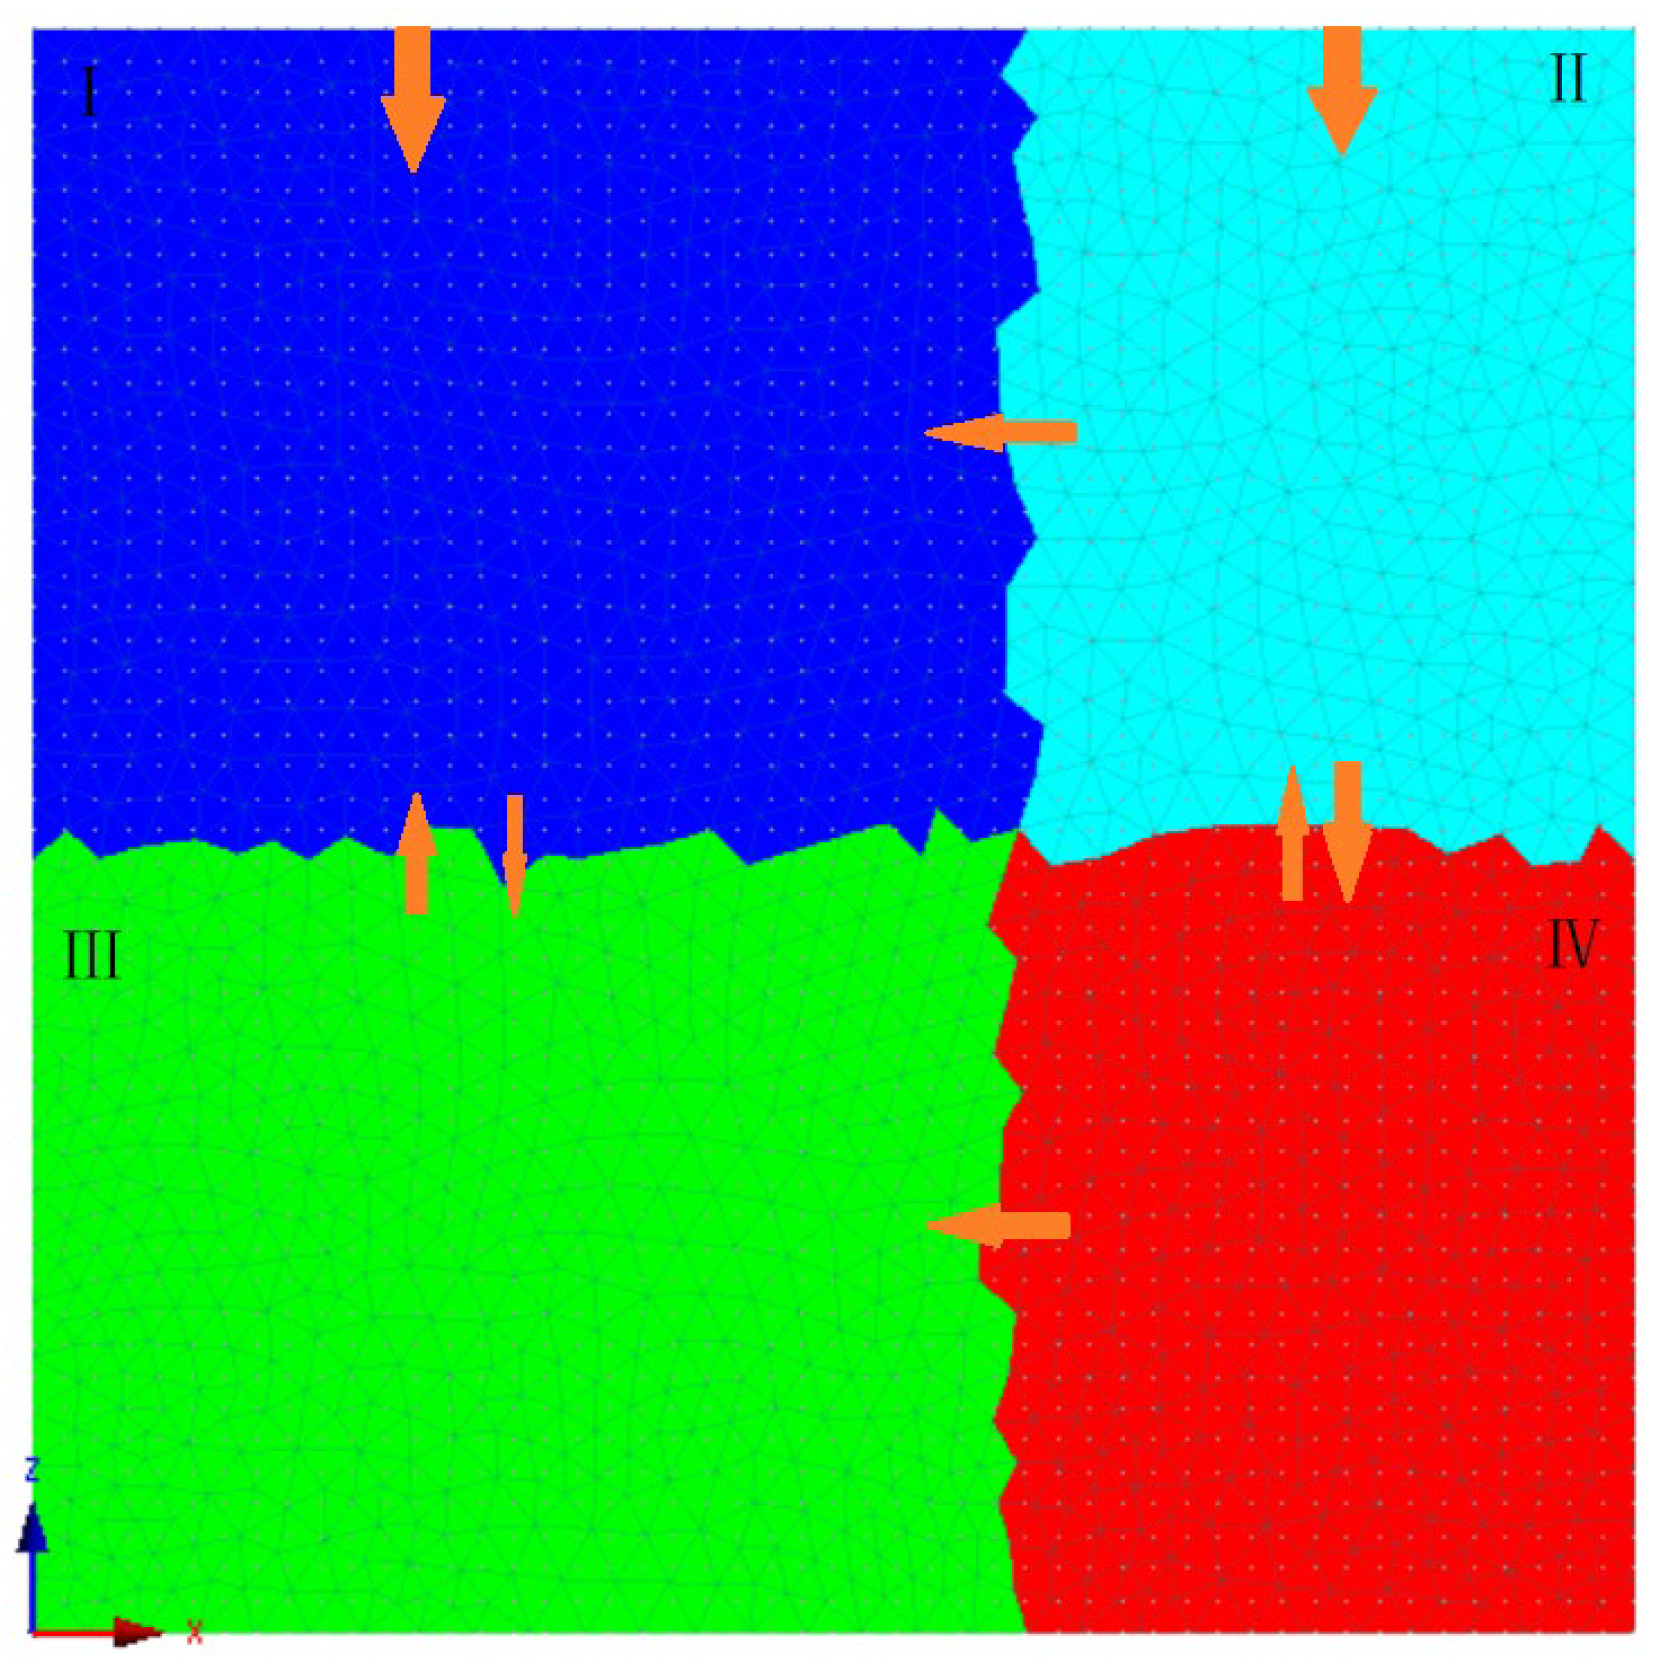
The movement of soil water can be generalized to the pattern shown in Figure 7. That is, the infiltrated precipitation was mainly intercepted and absorbed by the roots system in the root water uptake zone, and soil water was consumed, resulting in a water deficit zone, without excess soil water transferring to deeper layers. While in the infiltration zone, infiltrated precipitation was used for evaporation and infiltration mainly. Under the indirect effect of root water uptake, soil water in this zone gradually transferred to the root zone under the drive of horizontal hydraulic head gradient. In the subroot zone, soil water transferred to the water deficit zone driven by vertical hydraulic head gradient, which was caused by root water uptake. In the deep recharge zone, the infiltrated precipitation can further transport to the deep soil until it recharges to the groundwater.

3.3. Effects of Root Water Uptake on Water Budget

Water budget refers to the change in the amount of water inflow, outflow and storage within the GSPAC system. Soil water budget refers specifically to the relationship between the water obtained in a certain soil volume and the water consumed by vegetation in a certain period of time, which is an important factor affecting the ecological environment [21,22]. Figure 8 shows the water budget of the four sub-regions of the land. The water budget in both the root water uptake zone and infiltration zone showed a trend of first increasing and then decreasing, which was attributed to the fact that soil water was supplemented with the increase in precipitation, and then was consumed due to the continuous effect of vegetation transpiration and soil evaporation after a precipitation event. In addition, the increment of soil water in the infiltration zone is higher than that in the root water uptake zone, which means that root water uptake is not conducive to soil water storage. The soil water increment in the subroot zone is much smaller than that in the deep recharge area under the bare soil, indicating that the infiltrated precipitation can effectively recharge the deep soil in the bare land, while in the vegetated land, the infiltrated precipitation is intercepted and absorbed in the root zone, which weakens the recharge amount to the deep soil layers.
From the changes in water budget in the vegetation land and the bare land shown in Figure 8b, it can be seen that the changes in water budget in the bare land show a trend of first increasing and then decreasing, and the water volume increases after a growing period. However, the water budget in the vegetation land changed slightly, and after one growing period, there was almost no change in water volume. It further confirms the interception effect of vegetation roots on soil water, which is very unfavorable for maintaining available soil water and groundwater recharge. Soil water budget is affected by climate, vegetation cover and soil types [23,24,25]. Vegetation has a strong influence on soil water budget through their water acquisition, transport and transpiration [26,27,28,29,30], and deep-rooted vegetation in particular consumes a large amount of deep soil water [31,32]. In addition, vegetation restoration and vegetation types will also have an impact on soil water budget [33,34]. In arid and semiarid regions, vegetation restoration is conducive to soil and water conservation, but after vegetation restoration, the underlying surface conditions will be changed. Due to the change in infiltration conditions and root water uptake, soil moisture content will be affected, thus affecting water budget. Therefore, it is of great significance to study the impact of vegetation on soil water budget for vegetation replanting, soil and water conservation and water resources protection [22,35,36].

3.4. Reasonable Estimation of Vegetation Replanting Interval

Vegetation reduces soil evaporation through canopy shading, and root water uptake prevents soil water infiltration, which all affect the distribution and transport processes of soil water. Therefore, vegetation spacing is a very important parameter. If the vegetation is close to each other, the shadow under the canopy will reduce the evaporation of shallow soil water [37,38,39,40]. If the vegetation is far apart, the surface soil temperature in the inter-space is higher than that in the canopy cover area, which promotes the increase in soil evaporation and aggravates water loss. However, for xerophytic vegetation, its lateral root system development, which exceeds the crown width, and has a wide range of influence on soil water. If vegetation spacing is close, the attack of soil water by vegetation will be intensified [40], while large vegetation spacing can reduce the water consumption by root water uptake. On the other hand, the soil’s hydraulic permeability under the vegetation canopy is enhanced due to the root channel effect [41,42], and the precipitation infiltration capacity decreases gradually with the increase in canopy distance. However, whether precipitation can effectively recharge groundwater in the vegetation land is largely unknown and has only been studied in a few xerophytic shrubs [43]. It can be seen that vegetation has many effects on soil water, especially in soil water conservation. There are both favorable and unfavorable effects, which should be analyzed synchronously in the study of hydrological functions of xerophytic vegetation.
The height of mature Salix is generally more than 2.5 m, the canopy width is more than 3 m, the extension depth of taproot can reach 5 m, the ratio of root depth to canopy can reach more than 2.34 times and the ratio of lateral root length to canopy can reach more than 1.5 times [44,45]. According to the results of this study, the lateral distance of roots affecting soil water is nearly 1.7 times that of horizontal roots length. Therefore, in order to ensure that precipitation can effectively infiltrate in the deep soil layers without being intercepted by the roots system, the spacing of Salix should be more than five times that of the canopy width. At present, a common measure to prevent wind and sand fixation is to plant Salix in the central position of the artificially laid “grass grid”. The side length of the “grass grid” is usually 1 m, so the spacing between Salix is also 1 m. When Salix survived, it could develop into mature vegetation in 2~3 years. If the vegetation spacing was not controlled reasonably, the recharge of deep soil water or groundwater would be affected, which would not be conducive to the sustainability of vegetation replanting.

4. Conclusions

In this study, a field in situ experiment was conducted on a sand dune in the Mu Us sandy land to investigate soil water redistribution affected by Salix. The measurements of soil moisture content, hydraulic head and precipitation were used to verify and calibrate the performance of a vadose zone soil water flow model. The modeling results highlight the role of the local precipitation as an essential source of vegetation and groundwater in the Mu Us sandy land. Due to the interception effect of root water uptake, it is difficult for precipitation infiltration to recharge deep soil water or even groundwater. Combined with the relationship between the transverse roots system and the canopy width obtained by the investigation, it was determined that the spacing between the Salix should be greater than five times that of the canopy width. The results tradeoff the balance between the water consumption of vegetation and the deep soil water supplied by precipitation.

Author Contributions

Conceptualization, M.Z.; methodology, M.Z. and Q.W.; formal analysis, Q.W.; investigation, Q.W.; resources, M.Z.; writing—original draft preparation, M.Z.; writing—review and editing, M.Z. and Q.W.; project administration, Q.W.; funding acquisition, M.Z. All authors have read and agreed to the published version of the manuscript.

Funding

This research was funded by the National Key R&D Program of China (grant number: 2023YFF1306002); State-sponsored Postdoctoral Researcher program (grant number: GZB20230622); General Grant of China Postdoctoral Science Foundation (grant number: 2022M720535); Shaanxi Key Research and Development Program (grant number: 2024SFYBXM-554).

Data Availability Statement

The data presented in this study are available in this article.

Conflicts of Interest

Author Qiangmin Wang was employed by the company CCTEG Xi’an Research Institute (Group) Co., Ltd. The remaining authors declare that the research was conducted in the absence of any commercial or financial relationships that could be construed as a potential conflict of interest.

References

  1. Philip, J.R. Plant water relations: Some physical aspects. Annu. Rev. Plant Physiol. 1966, 17, 245–268. [Google Scholar] [CrossRef]
  2. Kang, S.; Liu, X.; Xiong, Y. Soil-Plant-Atmosphere Continuum Theory; Water Resources and Electric Power Press: Beijing, China, 1994. [Google Scholar]
  3. Yang, J.; Li, B.; Li, Y.; Ma, Y.; Hong, B. Preliminary study on the effect of diving on SPAC system in shallow groundwater deep area. J. Hydraul. Eng. 1999, 7, 27–32. (In Chinese) [Google Scholar] [CrossRef]
  4. Oki, T.; Kanae, S. Global hydrological cycles and world water resources. Science 2006, 313, 1068–1072. [Google Scholar] [CrossRef] [PubMed]
  5. Chen, L.; Huang, Z.; Gong, J.; Fu, B.; Huang, Y. The effect of land cover/vegetation on soil water dynamic in the hilly area of the loess plateau, China. Catena 2007, 70, 200–208. [Google Scholar] [CrossRef]
  6. Yu, X.; Huang, Y.; Li, E.; Li, X.; Guo, W. Effects of rainfall and vegetation to soil water input and output processes in the mu us sandy land, northwest China. Catena 2018, 161, 96–103. [Google Scholar] [CrossRef]
  7. Jiménez-Martínez, J.; Skaggs, T.; van Genuchten, M.; Candela, L. A root zone modelling approach to estimating groundwater recharge from irrigated areas. J. Hydrol. 2009, 367, 138–149. [Google Scholar] [CrossRef]
  8. Zhu, Y.; Ren, L.; Skaggs, T.H.; Lü, H.; Yu, Z.; Wu, Y.; Fang, X. Simulation of Populus euphratica root uptake of groundwater in an arid woodland of the ejina basin, China. Hydrol. Process. 2010, 23, 2460–2469. [Google Scholar] [CrossRef]
  9. Baroni, G.; Ortuani, B.; Facchi, A.; Gandolfi, C. The role of vegetation and soil properties on the spatio-temporal variability of the surface soil moisture in a maize-cropped field. J. Hydrol. 2013, 489, 148–159. [Google Scholar] [CrossRef]
  10. Zhao, Y.; Zhou, Y.; Wang, H. Spatial heterogeneity of soil water under introduction to desert steppe shrub in eastern Ningxia. Chin. J. Appl. Ecol. 2018, 29, 3577–3586. (In Chinese) [Google Scholar] [CrossRef]
  11. Liu, B.; Ren, J.; Shao, M.; Jia, X. Study on soil desiccation process of artificial shrub vegetation in northern Loess Plateau. Acta Ecol. Sin. 2020, 40, 3795–3803. [Google Scholar] [CrossRef]
  12. Li, X.; Zhang, Z.; Liu, Y.; Li, X.; Yang, H. Ecological Hydrology Basis of Ecological Reconstruction and Restoration in Sandy Areas of China; Science Press: Beijing, China, 2016. [Google Scholar]
  13. Huang, T.; Pang, Z. Estimating groundwater recharge following land-use change using chloride mass balance of soil profiles: A case study at Guyuan and Xifeng in the Loess Plateau of China. Hydrogeol. J. 2010, 19, 177–186. [Google Scholar] [CrossRef]
  14. Gates, J.B.; Scanlon, B.R.; Mu, X.; Zhang, L. Impacts of soil conservation on groundwater recharge in the semi-arid Loess Plateau, China. Hydrogeol. J. 2011, 19, 865–875. [Google Scholar] [CrossRef]
  15. Allen, A.; Chapman, D. Impacts of afforestation on groundwater resources and quality. Hydrogeol. J. 2001, 9, 390–400. [Google Scholar] [CrossRef]
  16. Gao, Z.; Zhang, L.; Cheng, L.; Zhang, X.; Cowan, T.; Cai, W.; Brutsaert, W. Groundwater storage trends in the Loess Plateau of China estimated from streamflow records. J. Hydrol. 2015, 530, 281–290. [Google Scholar] [CrossRef]
  17. Banks, E.W.; Brunner, P.; Simmons, C.T. Vegetation controls on variably saturated processes between surface water and groundwater and their impact on the state of connection. Water Resour. Res. 2011, 47, 178–186. [Google Scholar] [CrossRef]
  18. Zhao, M.; Wang, W.; Wang, Z.; Chen, L.; Ma, Z.; Wang, Q. Water use of Salix in the variably unsaturated zone of a semiarid desert region based on in-situ observation. J. Hydrol. 2020, 591, 125579. [Google Scholar] [CrossRef]
  19. Allison, G.B.; Gee, G.W.; Tyler, S.W. Vadose-zone techniques for estimating groundwater recharge in arid and semiarid regions. Soil Sci. Soc. Am. J. 1994, 58, 6–14. [Google Scholar] [CrossRef]
  20. Gee, G.W.; Hillel, D. Groundwater recharge in arid regions: Review and critique of estimation methods. Hydrol. Process. 1988, 2, 255–266. [Google Scholar] [CrossRef]
  21. Yang, Y.; Sun, H.; Hu, K.; Geng, H. Soil water characteristics of slope land with different vegetation types in water source area of Middle Route of South-to-North Water Transfer: A case study of Zougou small watershed in Ningshan County, southern Slope of Qinling Mountains. Resour. Environ. Yangtze Basin 2008, 17, 212–216. (In Chinese) [Google Scholar] [CrossRef]
  22. Sun, Z.; Zhou, Q.; Luo, Y.; Wei, X.; Yu, J. Effects of vegetation coverage on soil moisture in yellow soil runoff plot. J. Water Resour. Water Eng. 2019, 30, 39–46. (In Chinese) [Google Scholar] [CrossRef]
  23. Fries, A.; Silva, K.; Pucha-Cofrep, F.; Oñate-Valdivieso, F.; Ochoa-Cueva, P. Water Balance and Soil Moisture Deficit of Different Vegetation Units under Semiarid Conditions in the Andes of Southern Ecuador. Climate 2020, 8, 30–38. [Google Scholar] [CrossRef]
  24. Farley, K.A.; Jobbágy, E.G.; Jackson, R.B. Effects of afforestation on water yield: A global synthesis with implications for policy. Glob. Chang. Biol. 2005, 11, 1565–1576. [Google Scholar] [CrossRef]
  25. Xue, Y.; Jin, X.; Zhu, X. Variation characteristics of evapotranspiration and verification of water balance method in Ningxia along the Yellow River Economic Zone. Hydrogeol. Eng. Geol. 2017, 44, 27–32. [Google Scholar] [CrossRef]
  26. Fang, W.; Lu, N.; Liu, J.; Jiao, L.; Zhang, Y.; Wang, M.; Fu, B. Canopy transpiration and stand water balance between two contrasting hydrological years in three typical shrub communities on the semiarid Loess Plateau of China. Ecohydrology 2019, 12, e2064. [Google Scholar] [CrossRef]
  27. Launiainen, S.; Guan, M.; Salmivaara, A.; Kieloaho, A.-J. Modeling boreal forest evapotranspiration and water balance at stand and catchment scales: A spatial approach. Hydrol. Earth Syst. Sci. 2019, 23, 3457–3480. [Google Scholar] [CrossRef]
  28. Zhang, C. Hydrodynamic and thermodynamic processes during evaporation from bare soils. Evaporation 2014. [Google Scholar] [CrossRef]
  29. Gerten, D.; Schaphoff, S.; Haberlandt, U.; Lucht, W.; Sitch, S. Terrestrial vegetation and water balance—Hydrological evaluation of a dynamic global vegetation model. J. Hydrol. 2003, 286, 249–270. [Google Scholar] [CrossRef]
  30. Granier, A.; Biron, P.; Lemoine, D. Water balance, transpiration and canopy conductance in two beech stands. Agric. For. Meteorol. 2000, 100, 291–308. [Google Scholar] [CrossRef]
  31. Li, H.; Shen, W.; Zou, C.; Jiang, J.; Fu, L.; She, G. Spatio-temporal variability of soil moisture and its effect on vegetation in a desertified aeolian riparian ecotone on the Tibetan Plateau, China. J. Hydrol. 2013, 479, 215–225. [Google Scholar] [CrossRef]
  32. Ge, J.; Pitman, A.J.; Guo, W.; Zan, B.; Fu, C. Impact of revegetation of the Loess Plateau of China on the regional growing season water balance. Hydrol. Earth Syst. Sci. 2020, 24, 515–533. [Google Scholar] [CrossRef]
  33. Wang, L.; Zhang, Q.; Bai, L.; Ma, A.; Zhang, H.; Li, L.; Zhang, J.; Fu, G.; Dong, Q. Effects of three artificial vegetation types on soil particle composition and carbon sequestration in Mu Us Sandy Land. Res. Soil Water Conserv. 2020, 27, 88–94. (In Chinese) [Google Scholar] [CrossRef]
  34. Jian, S.; Zhao, C.; Fang, S.; Yu, K. Effects of different vegetation restoration on soil water storage and water balance in the Chinese Loess Plateau. Agric. For. Meteorol. 2015, 206, 85–96. [Google Scholar] [CrossRef]
  35. Zhang, Z.; Wang, W.; Gong, C.; Zhao, M.; Franssen, H.-J.H.; Brunner, P. Salix psammophila afforestations can cause a decline of the water table, prevent groundwater recharge and reduce effective infiltration. Sci. Total. Environ. 2021, 780, 146336. [Google Scholar] [CrossRef]
  36. Wang, W.; Zhang, Z.; Yin, L.; Duan, L.; Huang, J. Topical Collection: Groundwater recharge and discharge in arid and semi-arid areas of China. Hydrogeol. J. 2021, 29, 521–524. [Google Scholar] [CrossRef]
  37. Moro, M.; Pugnaire, F.; Haase, P.; Puigdefábregas, J. Mechanisms of interaction between a leguminous shrub and its understorey in a semi-arid environment. Ecography 1997, 20, 175–184. [Google Scholar] [CrossRef]
  38. Madrigal, J.; García-Rodriguez, J.A.; Julian, R.; Puerto, A.; Fernández-Santos, B. Exploring the influence of shrubs on herbaceous communities in a Mediterranean climatic context of two spatial scales. Plant Ecol. 2008, 195, 225–234. [Google Scholar] [CrossRef]
  39. Zuo, X.; Zhao, H.; Zhao, X.; Zhang, T.; Guo, Y.; Wang, S.; Drake, S. Spatial pattern and heterogeneity of soil properties in sand dunes under grazing and restoration in Horqin Sandy Land, northern China. Soil Till. Res. 2008, 99, 202–212. [Google Scholar] [CrossRef]
  40. Mauchamp, A.; Janeau, J. Water funnelling by the crown of Flourensia cernua, a Chihuahuan Desert shrub. J. Arid. Environ. 1993, 25, 299–306. [Google Scholar] [CrossRef]
  41. Bhark, E.W.; Small, E.E. Association between plant canopies and the spatial patterns of infiltration in shrubland and grassland of the chihuahuan desert, New Mexico. Ecosystems 2003, 6, 185–196. [Google Scholar] [CrossRef]
  42. Rietkerk, M.; van de Koppel, J. Regular pattern formation in real ecosystems. Trends Ecol. Evol. 2008, 23, 169–175. [Google Scholar] [CrossRef]
  43. Dunkerley, D. Measuring interception loss and canopy storage in dryland vegetation: A brief review and evaluation of available research strategies. Hydrol. Process. 2015, 14, 669–678. [Google Scholar] [CrossRef]
  44. Zhao, C.; Zhang, Y.; Qin, S.; Lai, Z.; Liu, J.; Fa, K. NPP and its distribution pattern of three typical psammophytic shrubs. Beijing For. Univ. 2014, 36, 62–67. (In Chinese) [Google Scholar] [CrossRef]
  45. Liu, S.; Xu, G.; Li, Y.; Wu, X.; Liu, J.; Mi, X. Response of five sandy shrub species to groundwater depth change. Acta Ecol. Sin. 2021, 41, 615–625. (In Chinese) [Google Scholar] [CrossRef]
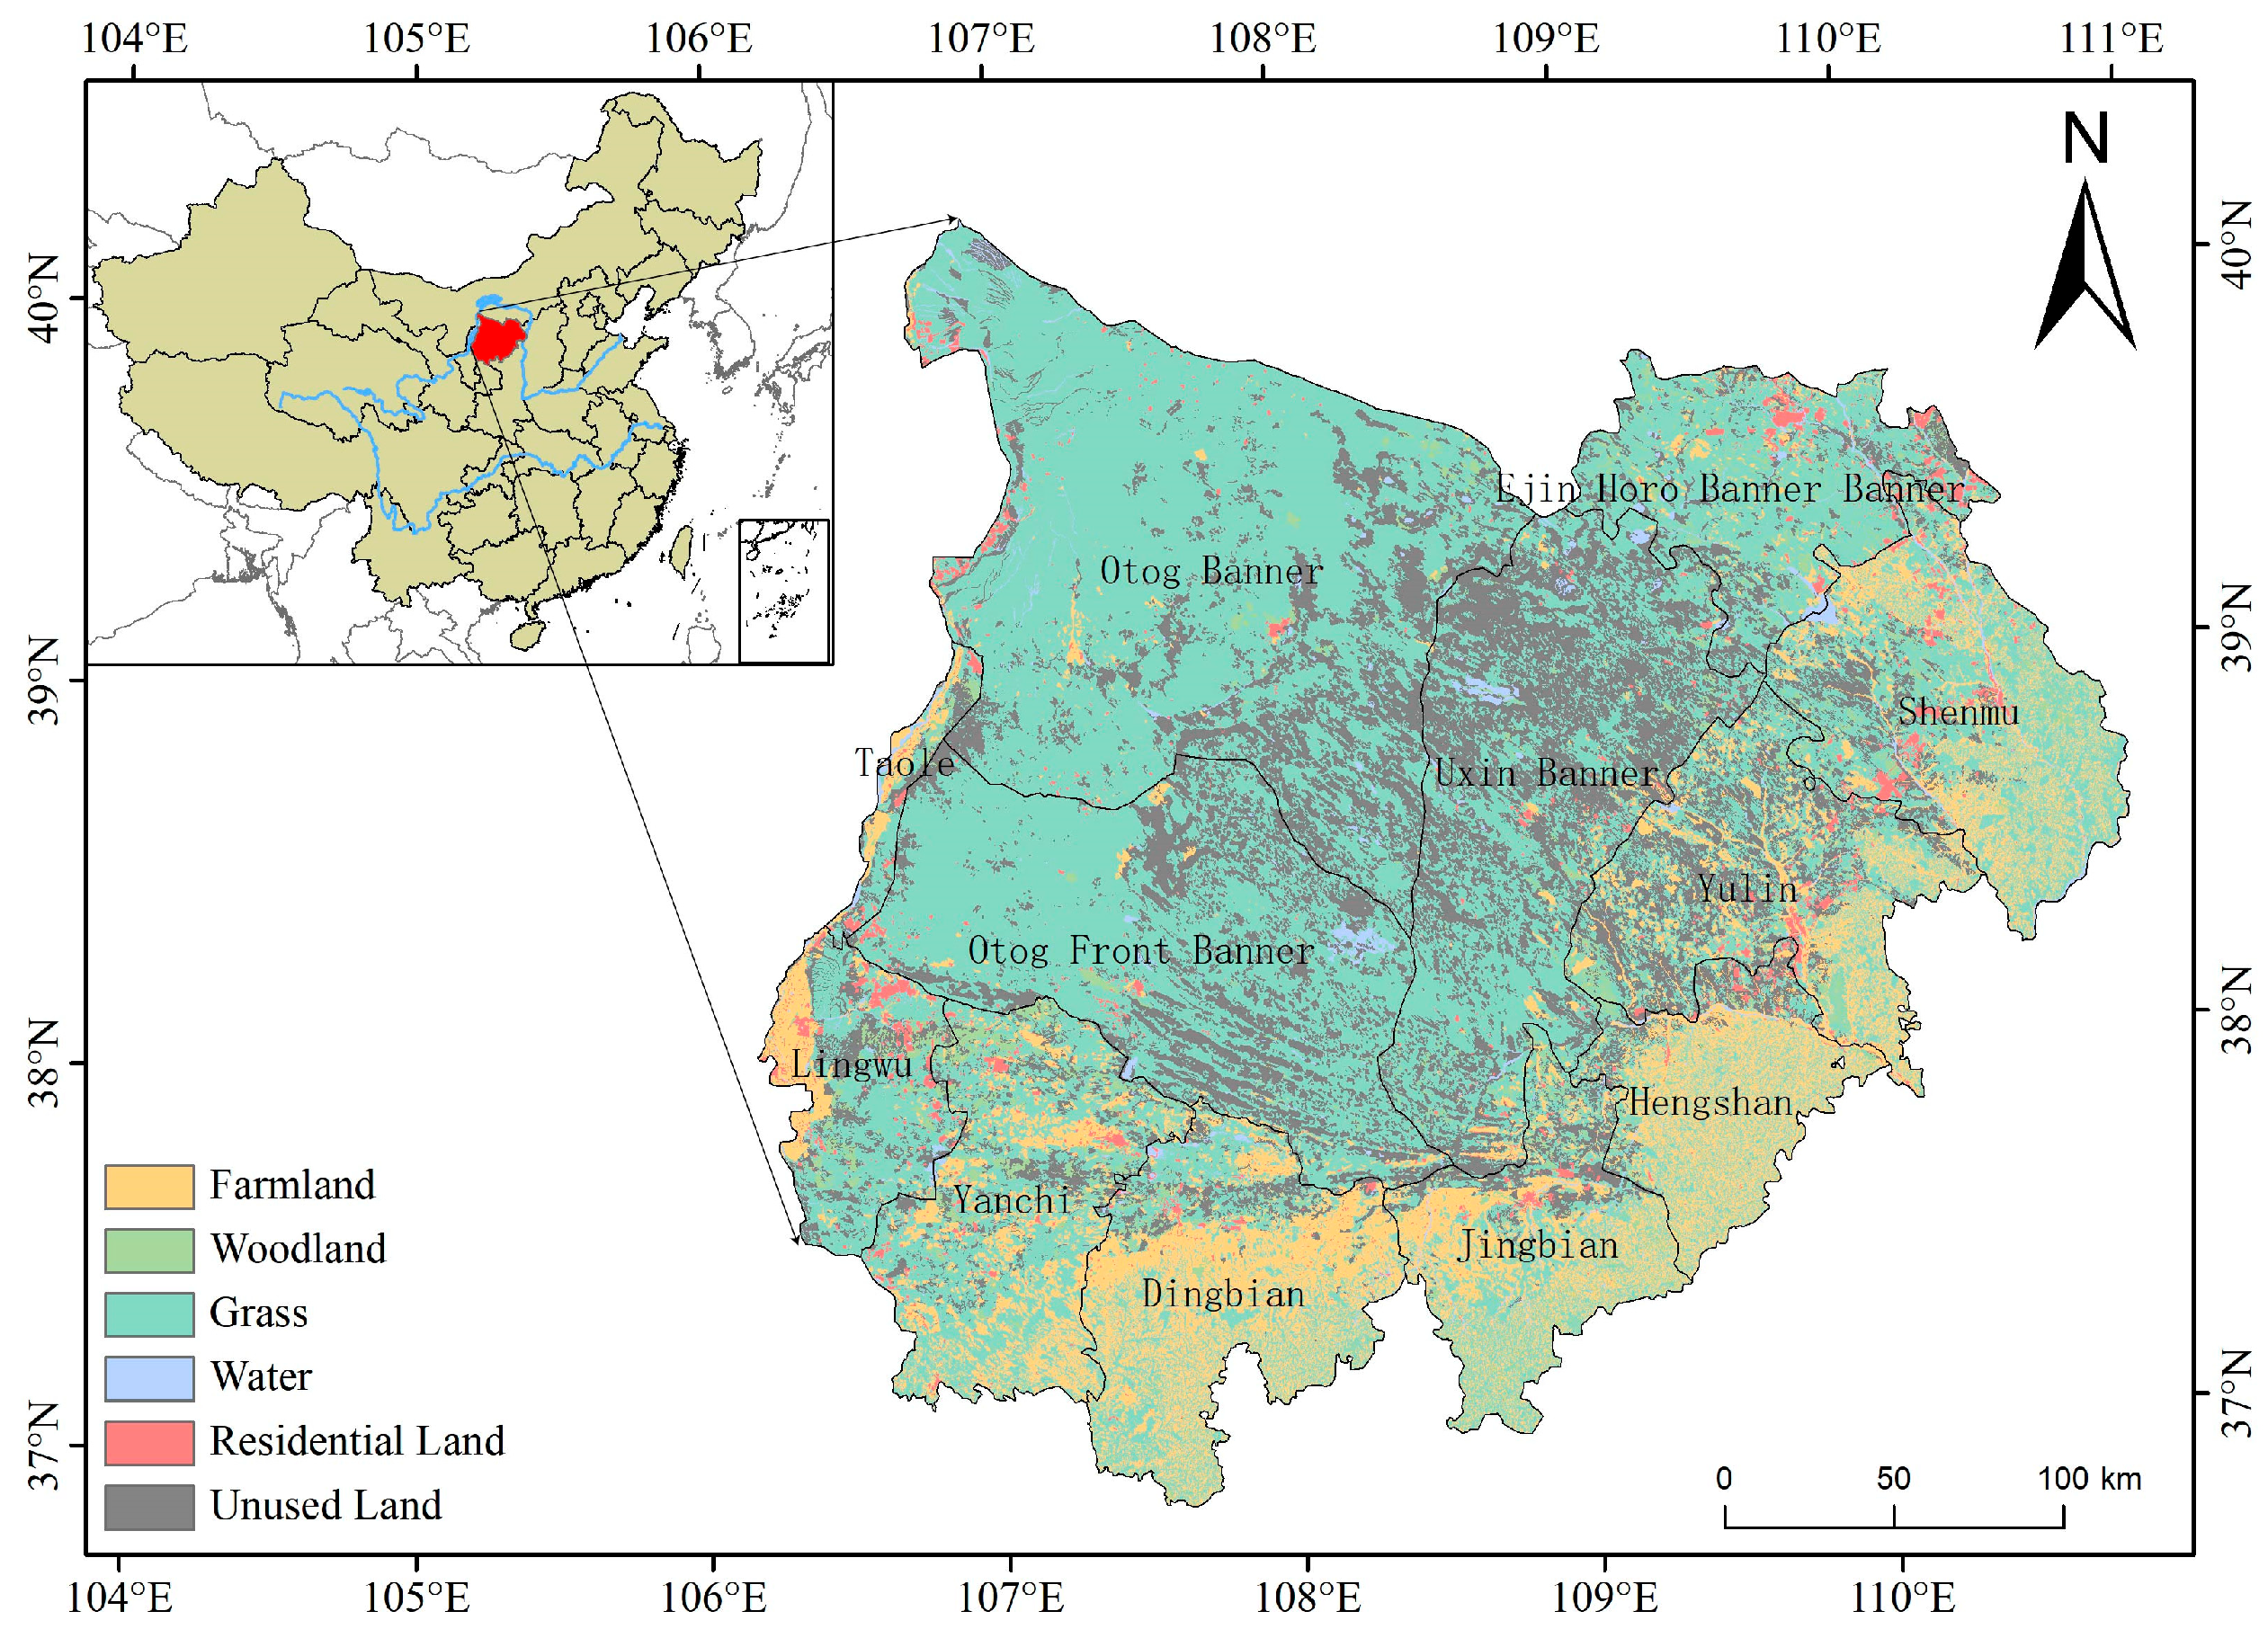
Figure 1. Study area and its land use types.
Agronomy 14 02200 g001
Figure 2. Schematic diagram of field monitoring test implementation and sensor installation.
Agronomy 14 02200 g002
Figure 3. Triangular mesh of the model domain (a), sub-region division of water budget (b) (I is the root water uptake zone; II is the infiltration zone; III is the subroot zone; IV is the deep recharge zone).
Agronomy 14 02200 g003
Figure 4. Rainfall variation coefficient within different days on average.
Agronomy 14 02200 g004
Figure 5. Spatio-temporal evolution of soil moisture content in soil profile during the growth stage.
Agronomy 14 02200 g005
Figure 6. Spatio-temporal evolution of hydraulic head in soil profile during the growth stage.
Agronomy 14 02200 g006
Figure 7. Schematic diagram of soil water flow pattern (arrow direction represents soil water flow direction, arrow size represents water flux magnitude).
Agronomy 14 02200 g007
Figure 8. Changes in water balance in different sub-regions. (a) represents water budget in the four subranges: the root water uptake zone, the infiltration zone, the subroot zone and the deep recharge zone; (b) represents water budget invegetation zone and bare zone, respectively).
Agronomy 14 02200 g008
Table 1. Physical parameters of aeolian sand.
Grain CompositionDry Density
(g·cm−3)
Porosity
(cm3·cm−3)
Name
0.5–0.250.25–0.0750.075–0.05
5.788.75.61.450.37silty-fine sand
Table 2. Hydraulic parameters of the aeolian sand.
Itemθr [cm3·cm−3]θs [cm3·cm−3]α [cm−1]n [-]Ks [cm·day−1]l [-]
Aeolian sand0.0230.320.0362.565600.5
Table 3. Optimized hydraulic parameters of aeolian sand.
Soil LayersDepth (cm)α [cm−1]n [-]Ks [cm·day−1]
10–600.01101.440450.0
260–1200.03661.611660.0
3120–2000.01993.230760.0
4200–2800.15514.617410.0
5280–4000.01702.800760.0
Table 4. Statistical analysis of error of model simulation results.
Depth (cm)
310203050100200300
ME0.0170.0130.0110.0120.0090.0180.0140.007
RMSE0.0220.0160.0140.0140.0110.0200.0190.009
MAE0.2350.1110.1090.1030.0750.1730.1000.026
Disclaimer/Publisher’s Note: The statements, opinions and data contained in all publications are solely those of the individual author(s) and contributor(s) and not of MDPI and/or the editor(s). MDPI and/or the editor(s) disclaim responsibility for any injury to people or property resulting from any ideas, methods, instructions or products referred to in the content.