
Design and Testing of a Fruit Tree Variable Spray System Based on ExG-AABB

 ,
,
Abstract
:1. Introduction
2. Materials and Methods
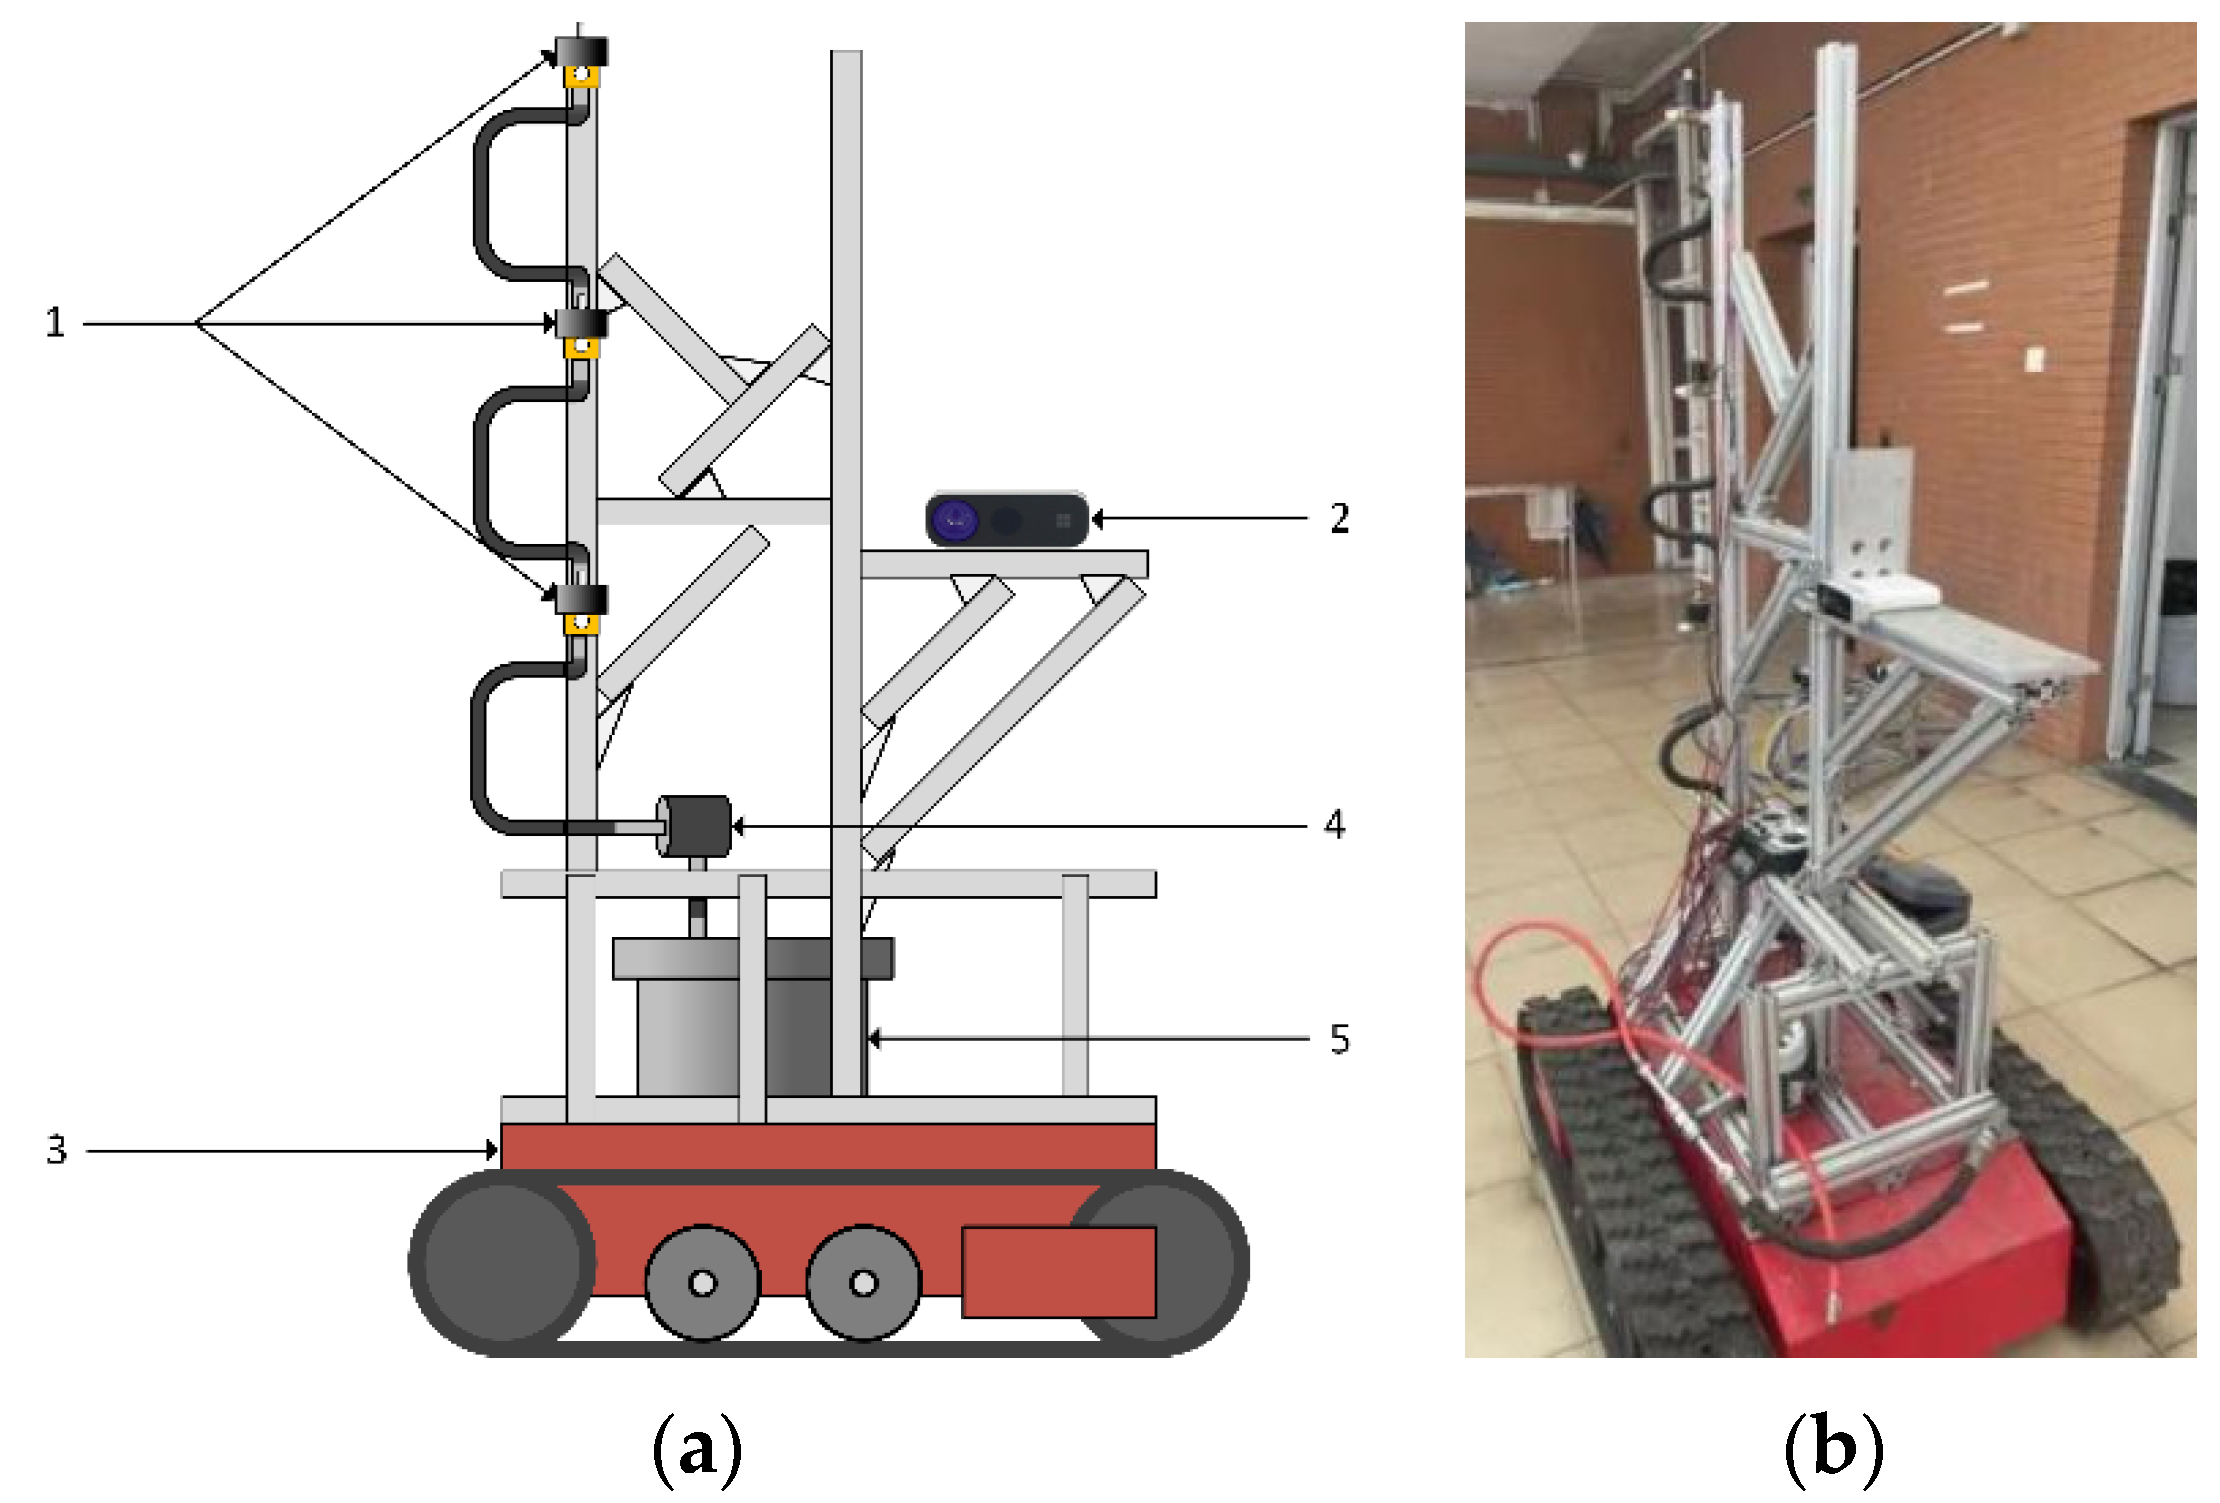
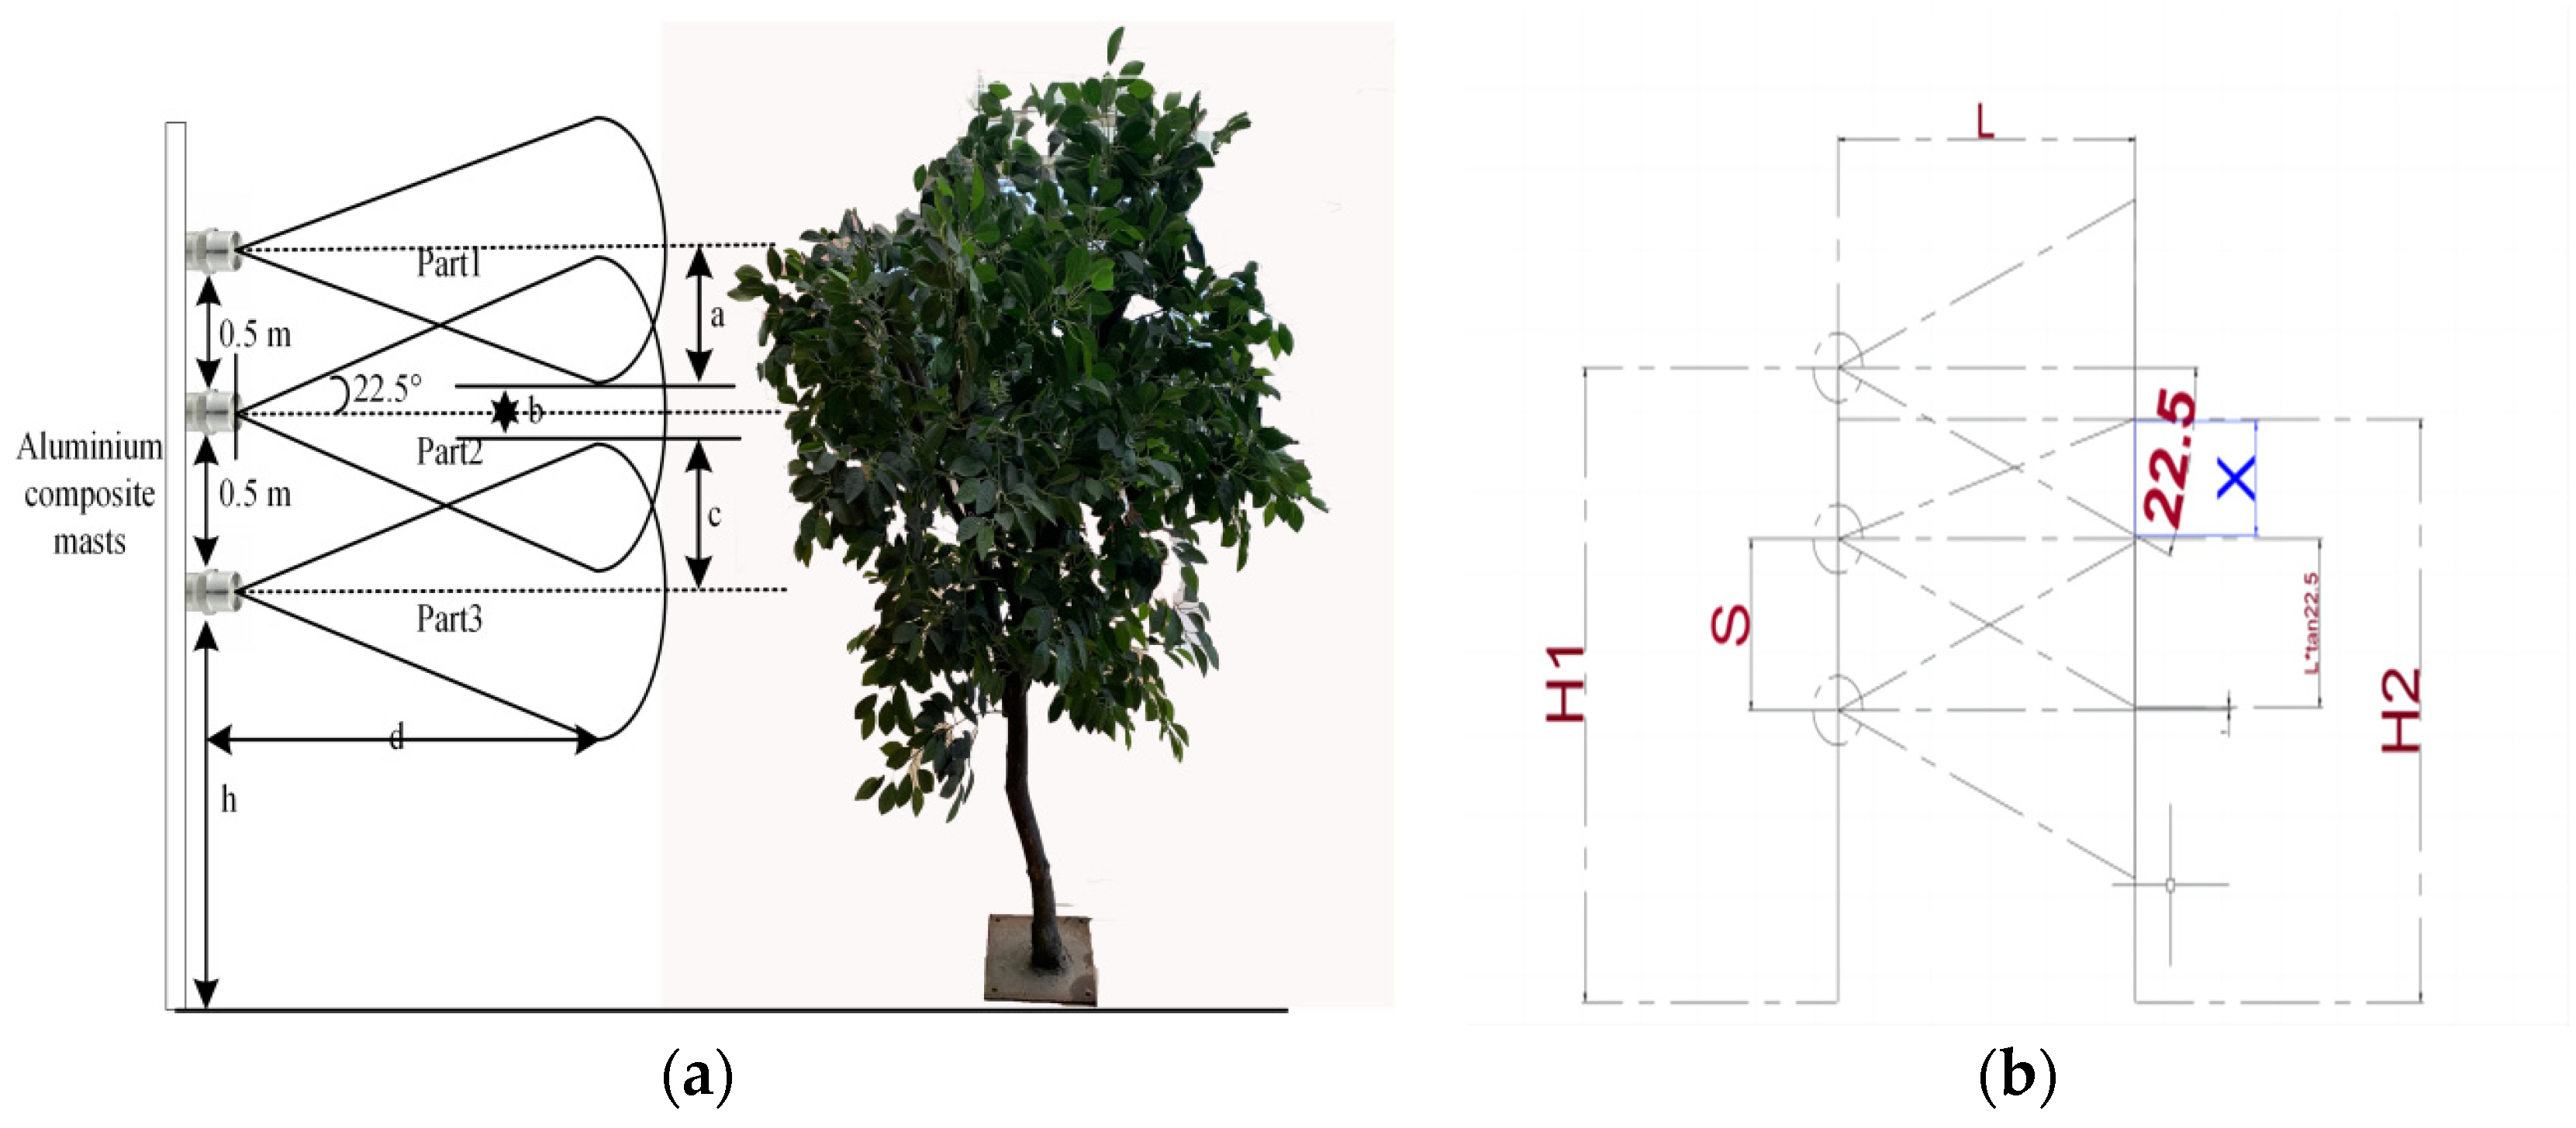
2.1. Test Equipment
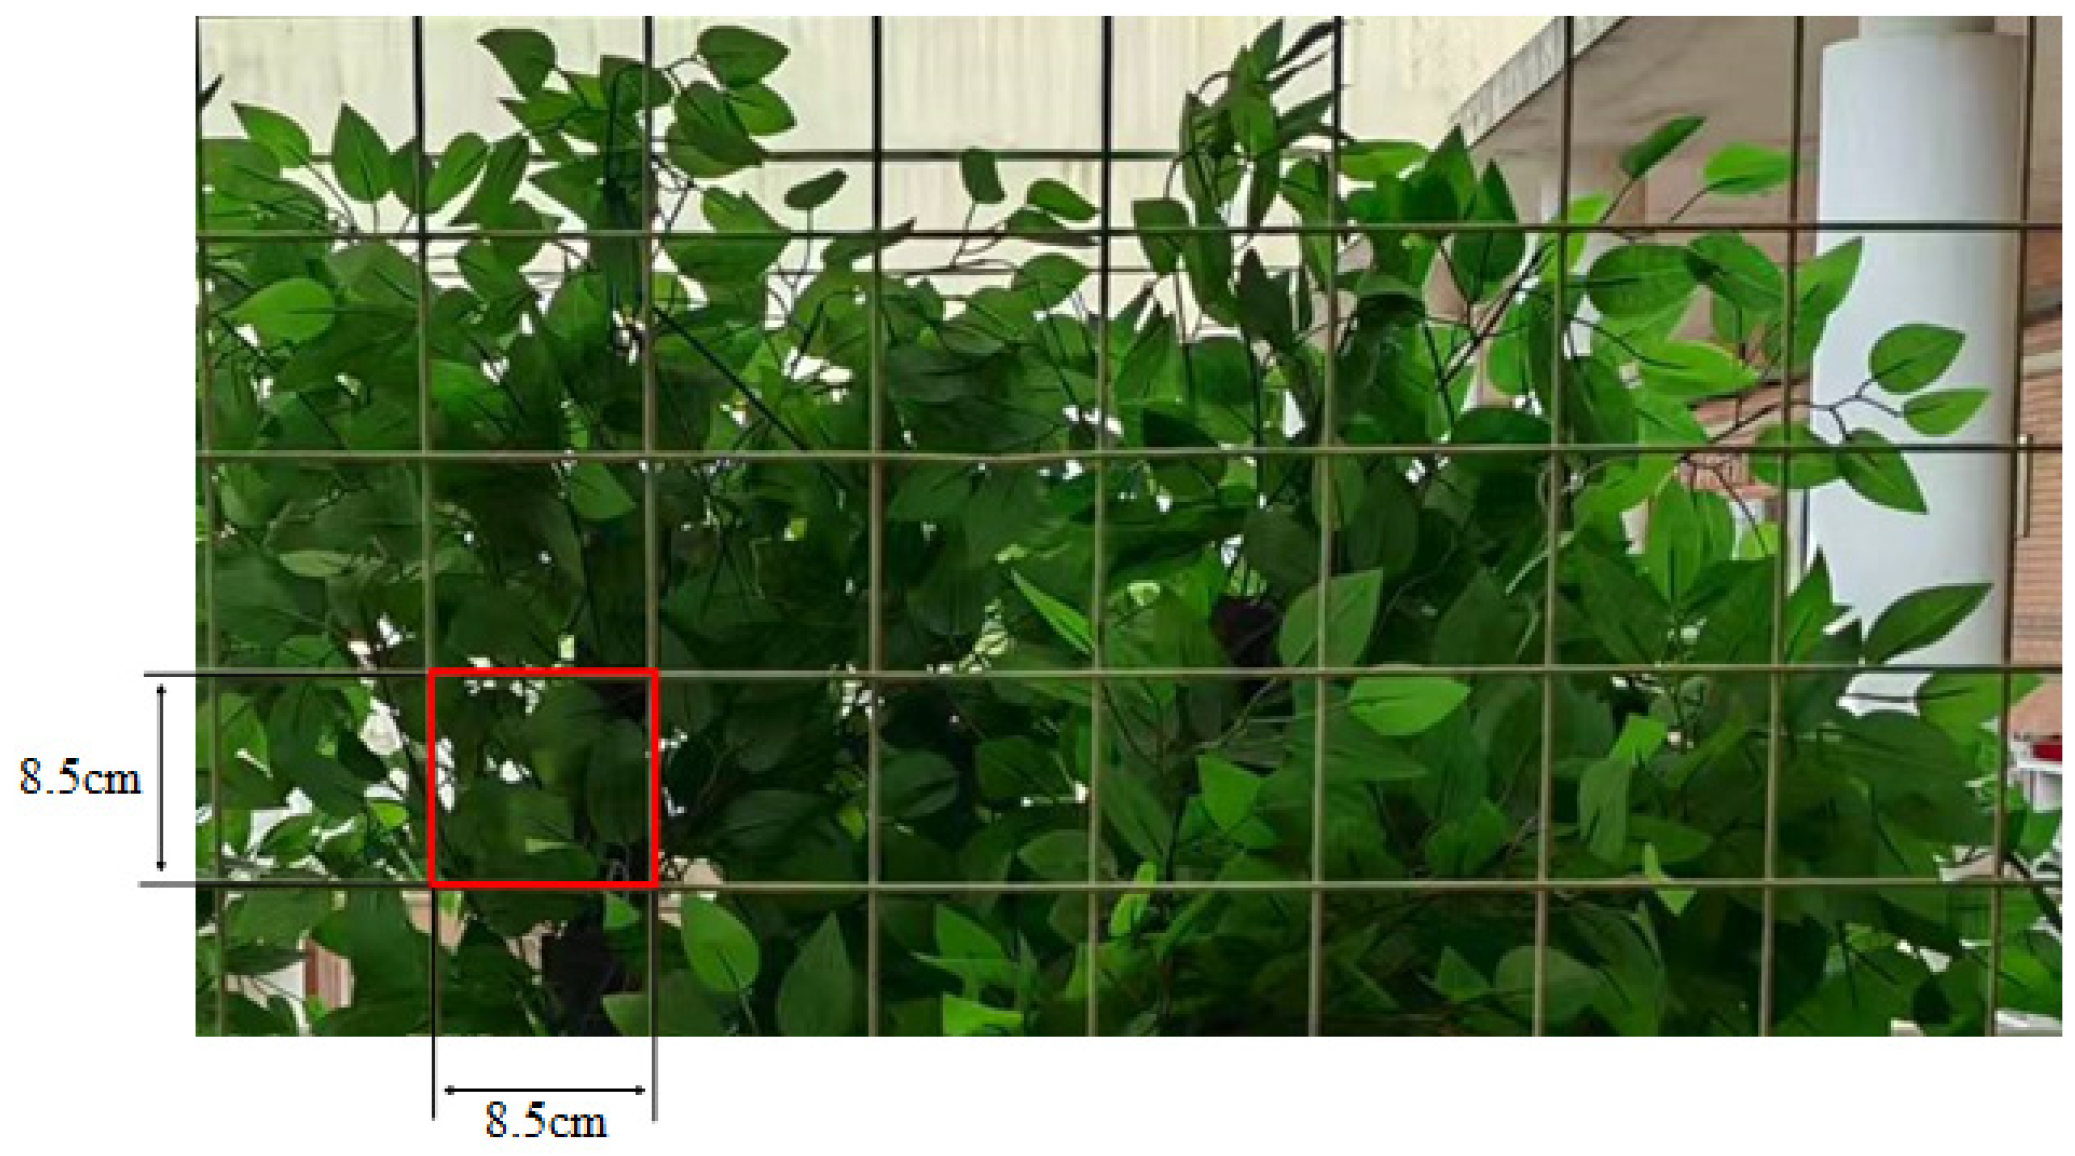
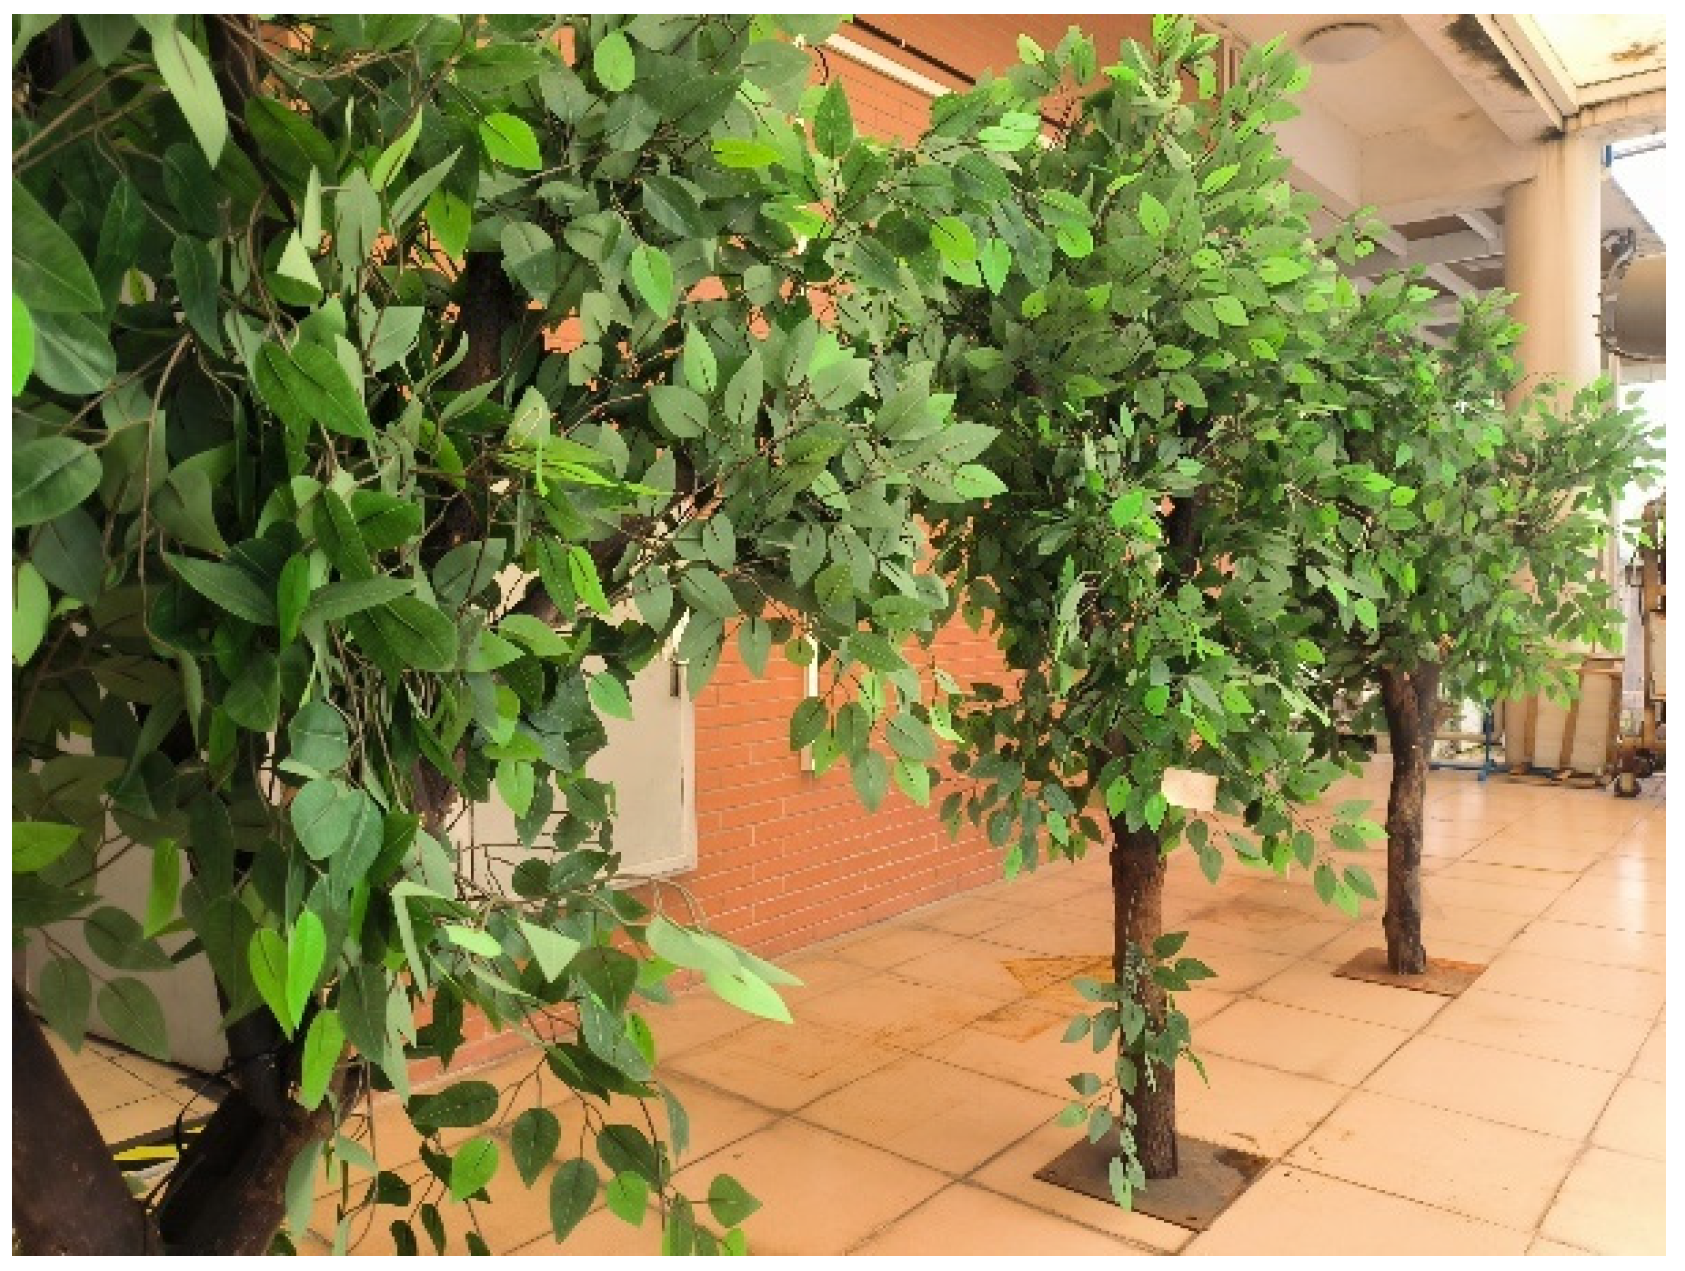
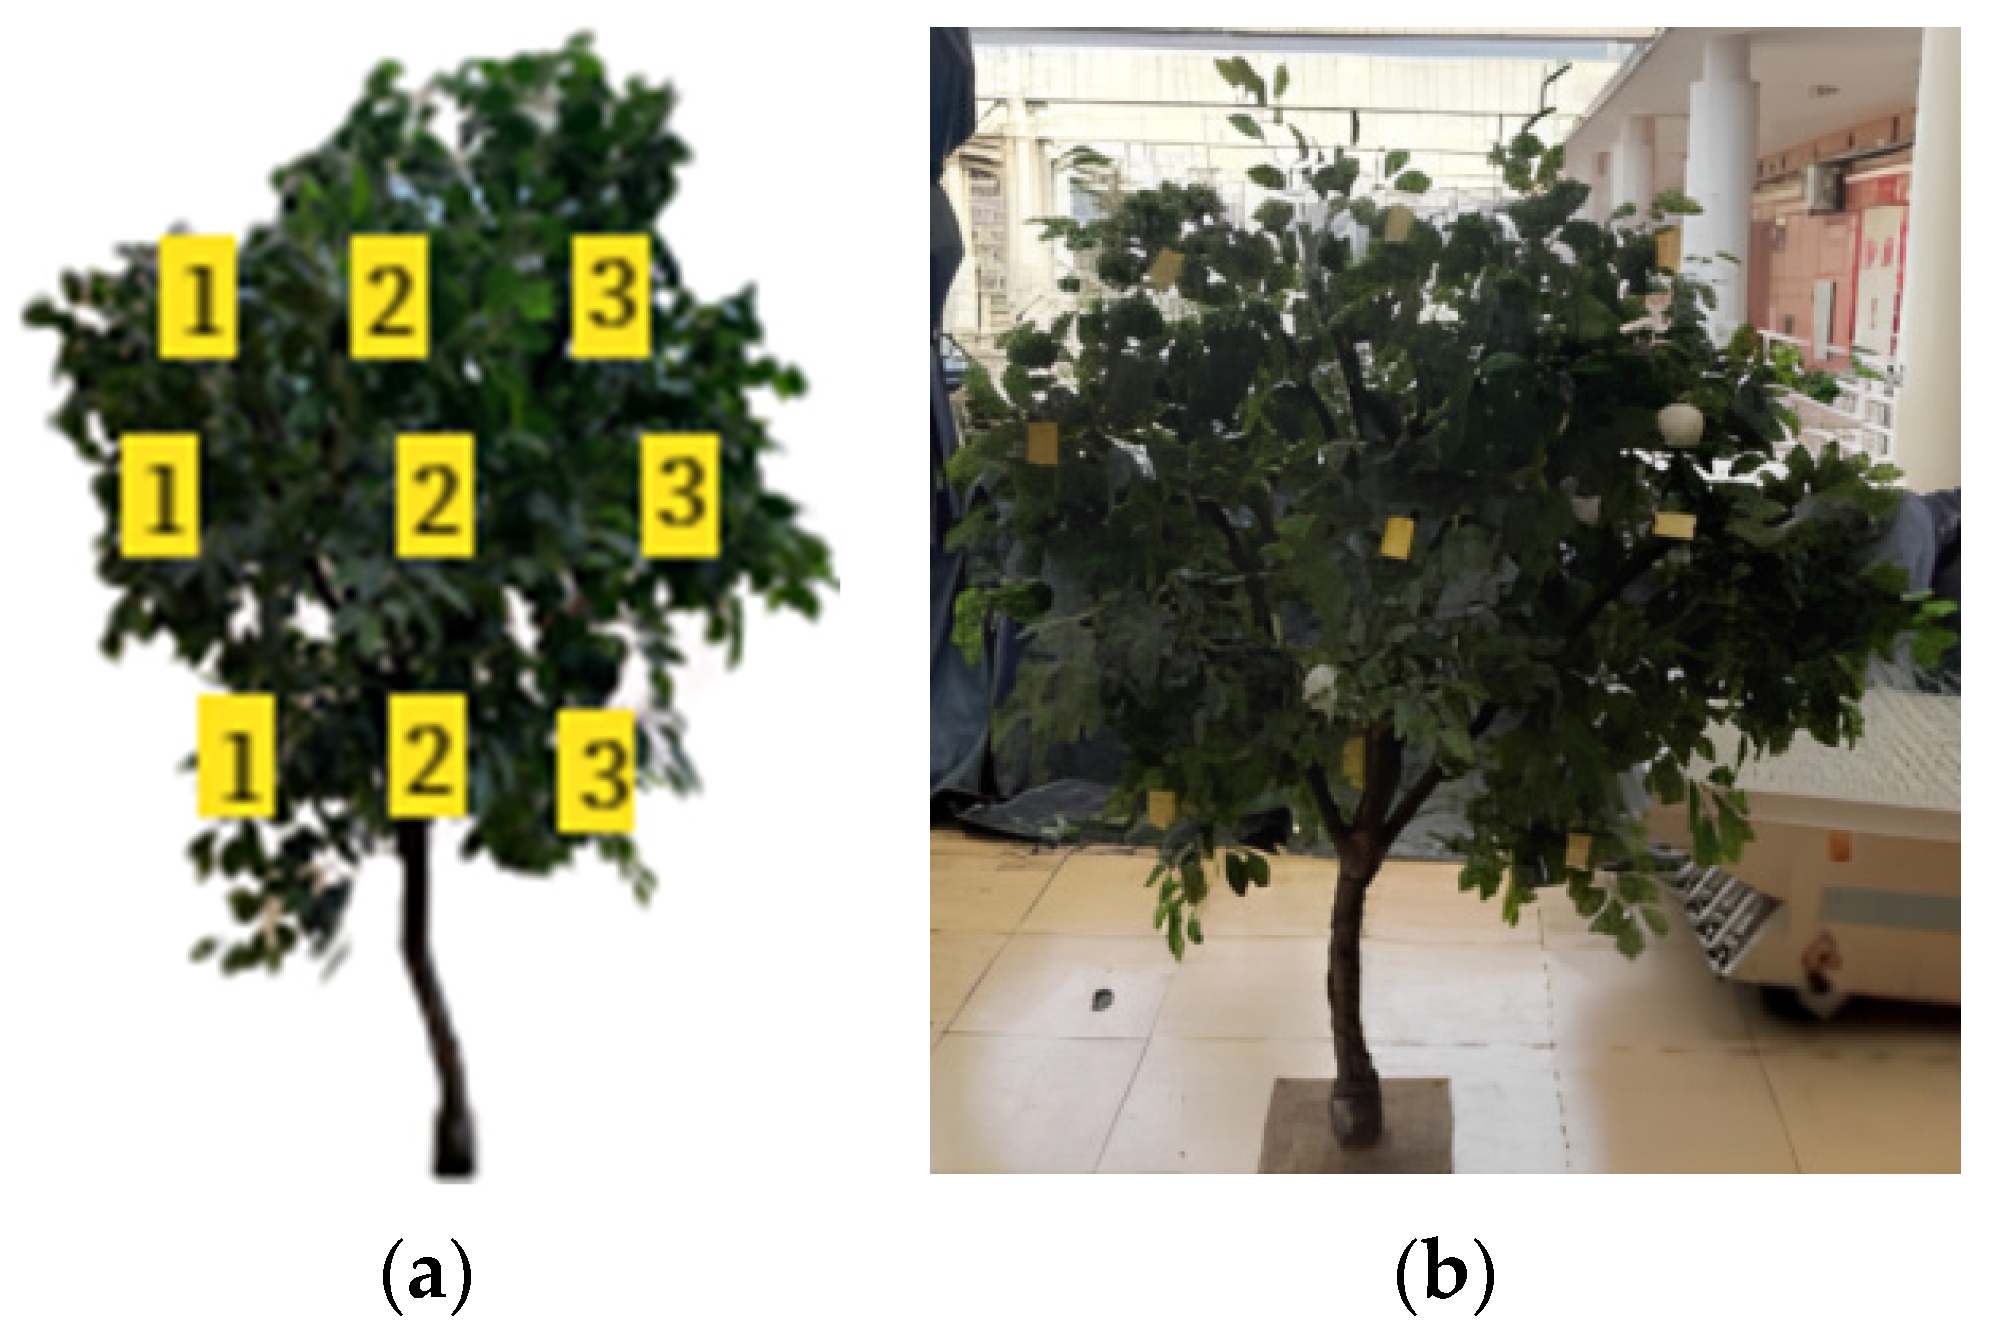
2.2. Test Object
2.3. Experimental Design and Method
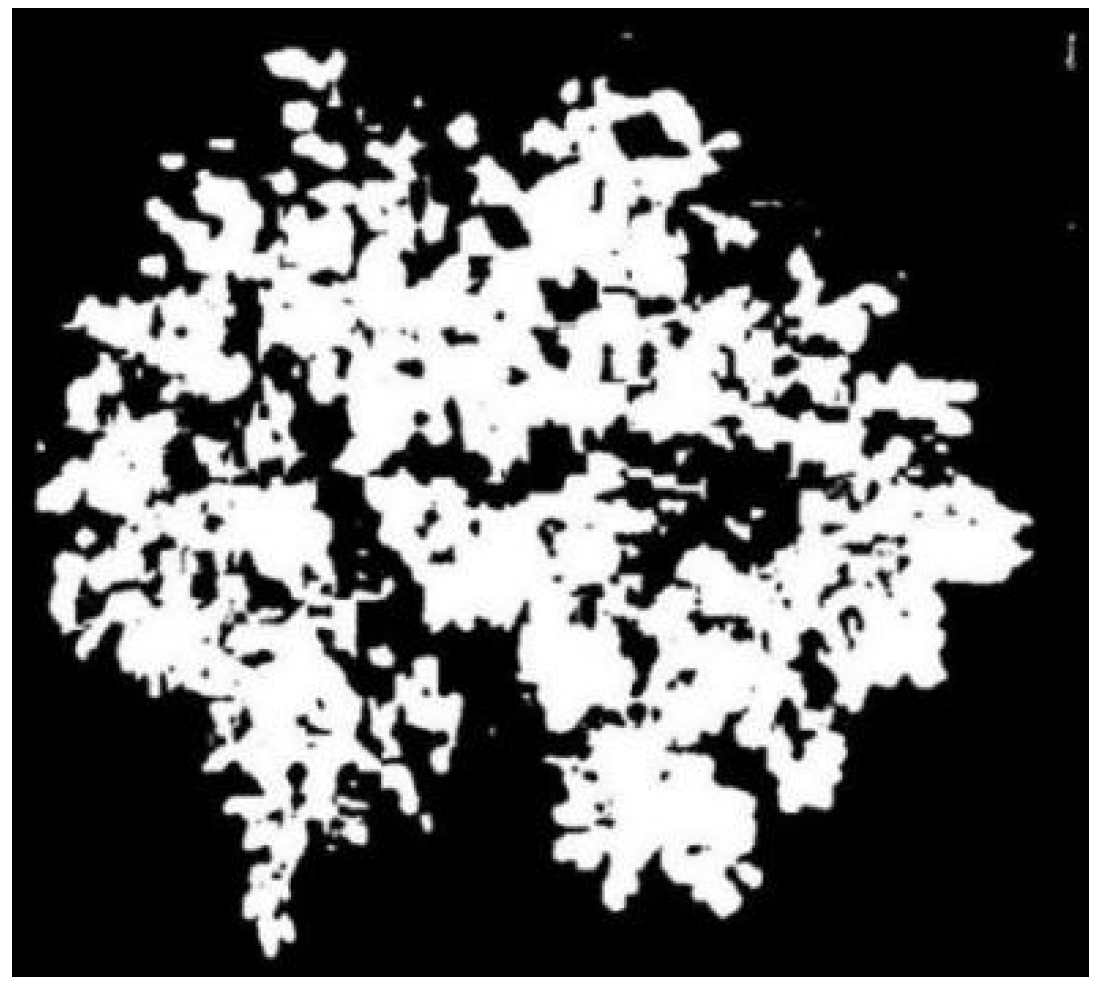
2.3.1. Data Collection and Preprocessing of the Fruit Tree Canopy
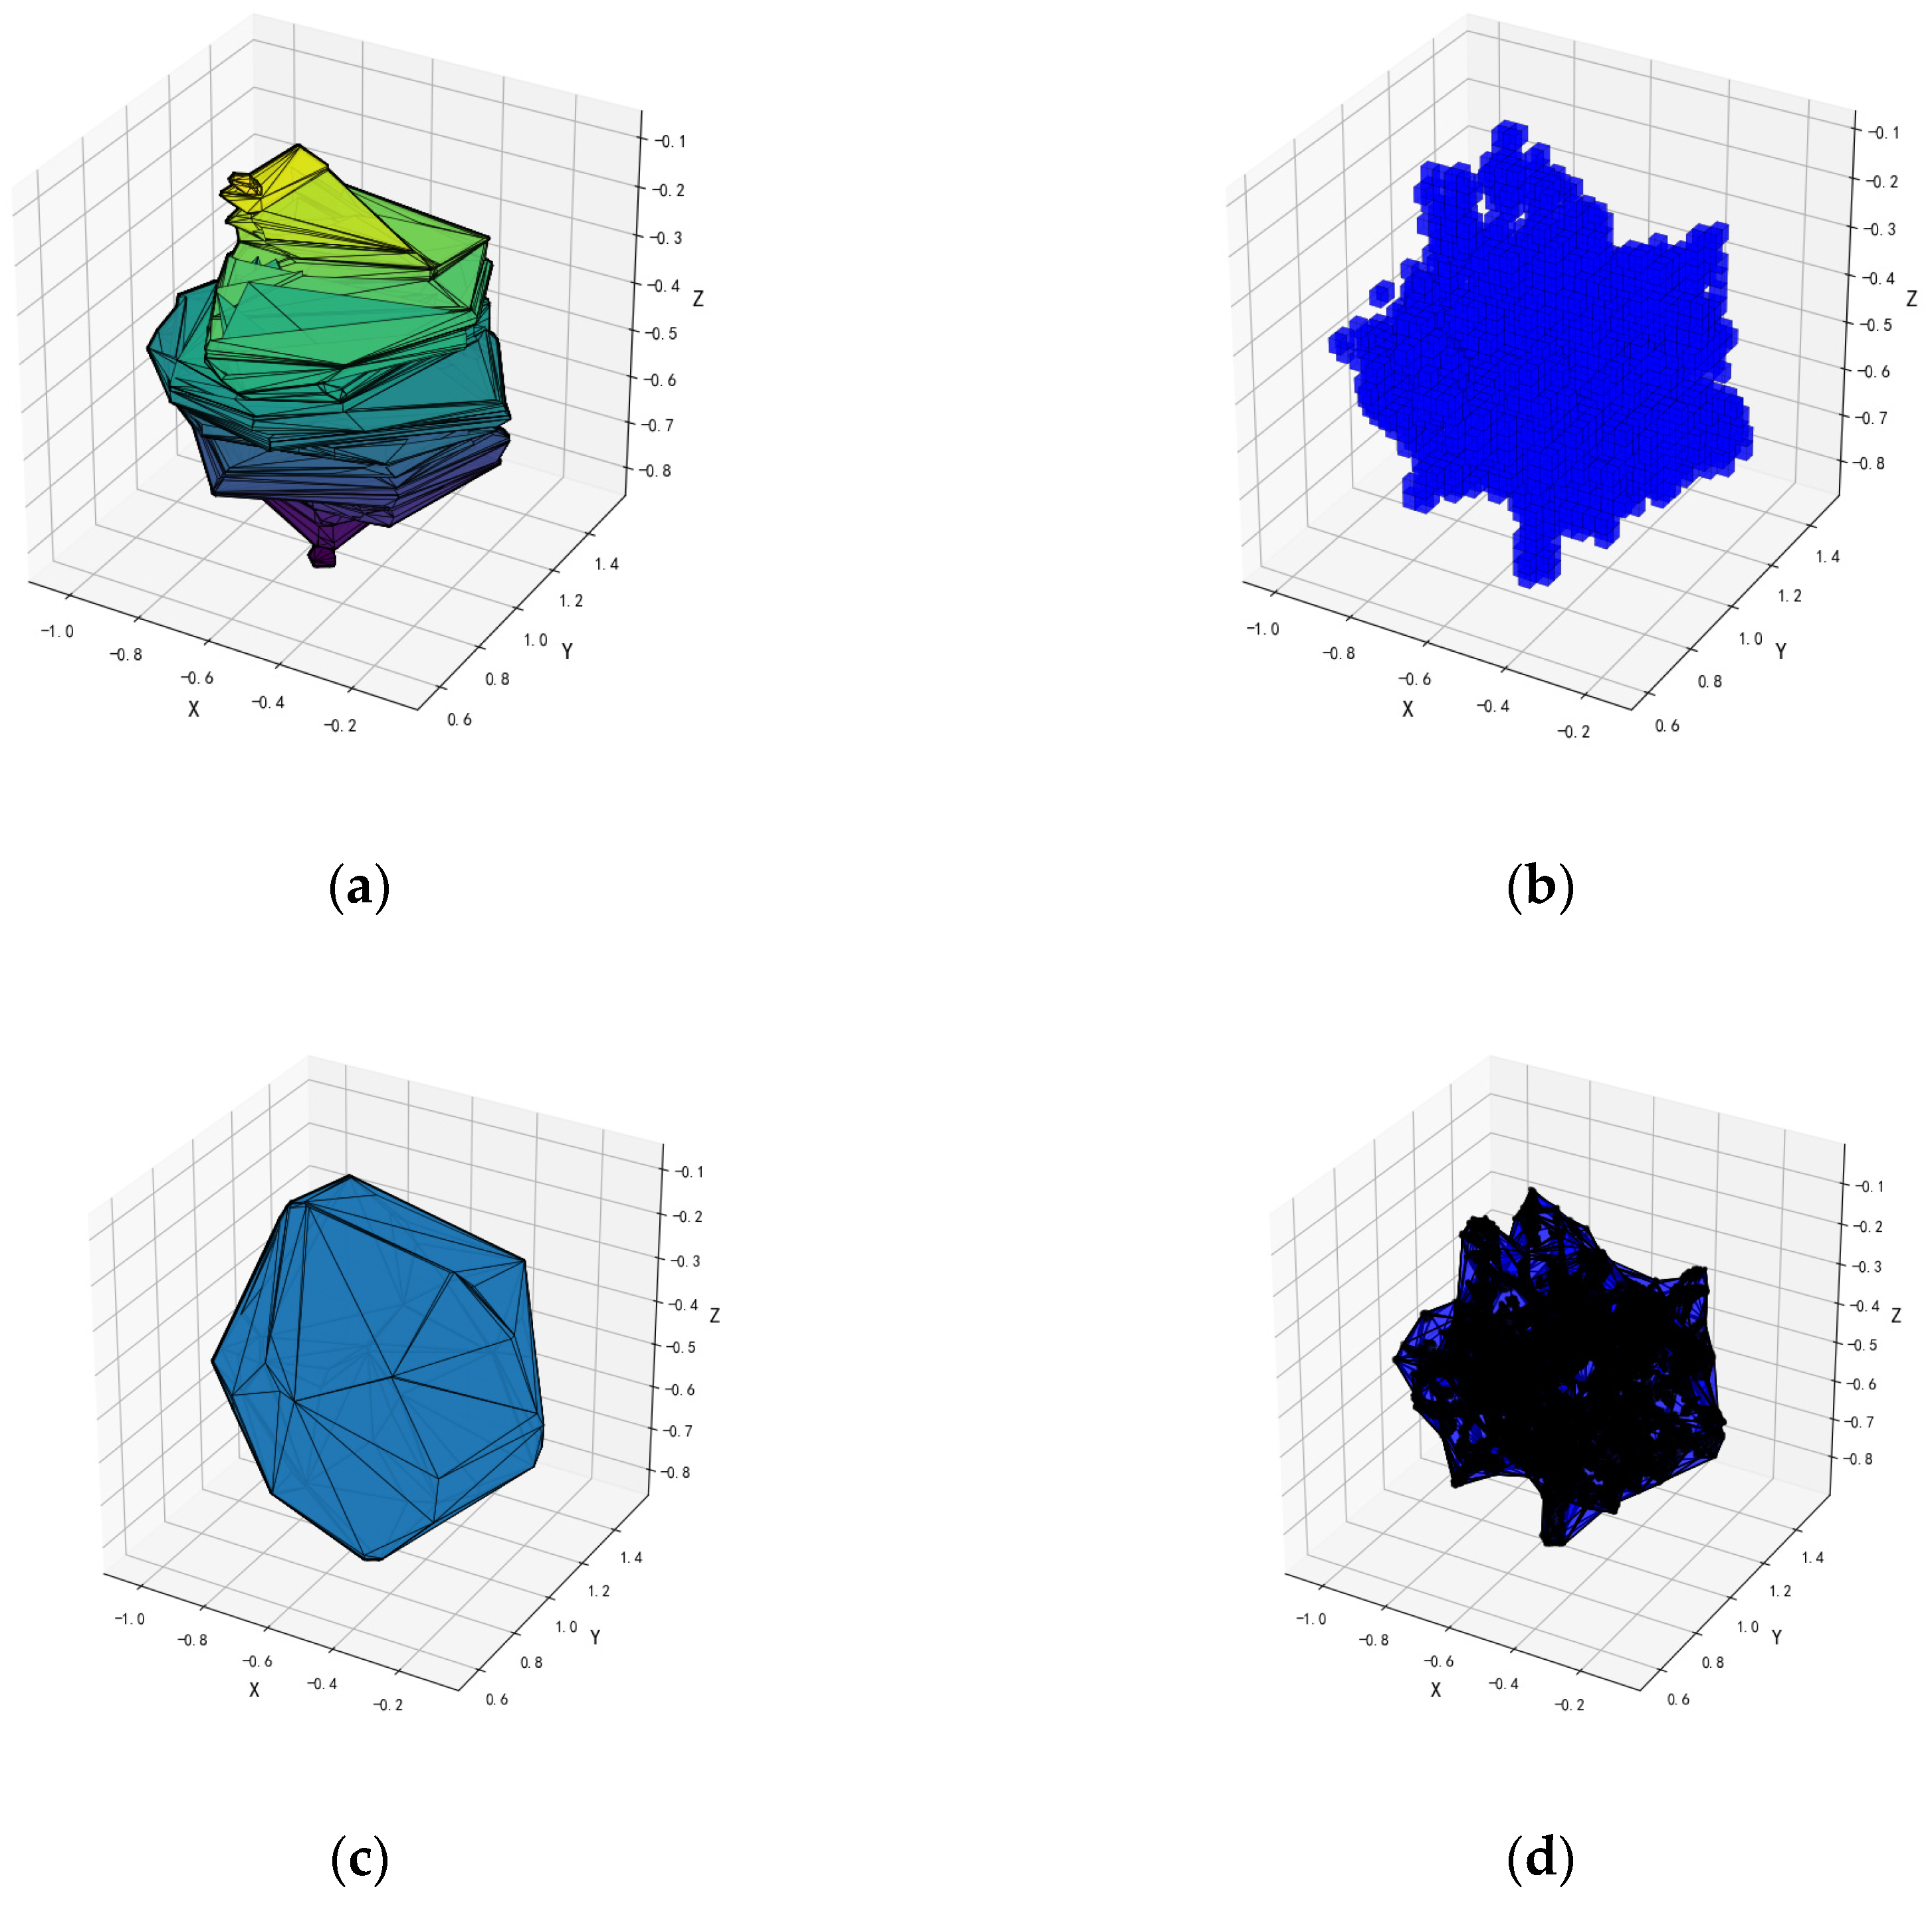
2.3.2. Design of Canopy Volume Calculation Method Based on the Fusion of the Super Green Algorithm and Axis-Aligned Bounding Box
2.3.3. Evaluation of the Accuracy of the Canopy Parameter Acquisition Model in Canopy Samples
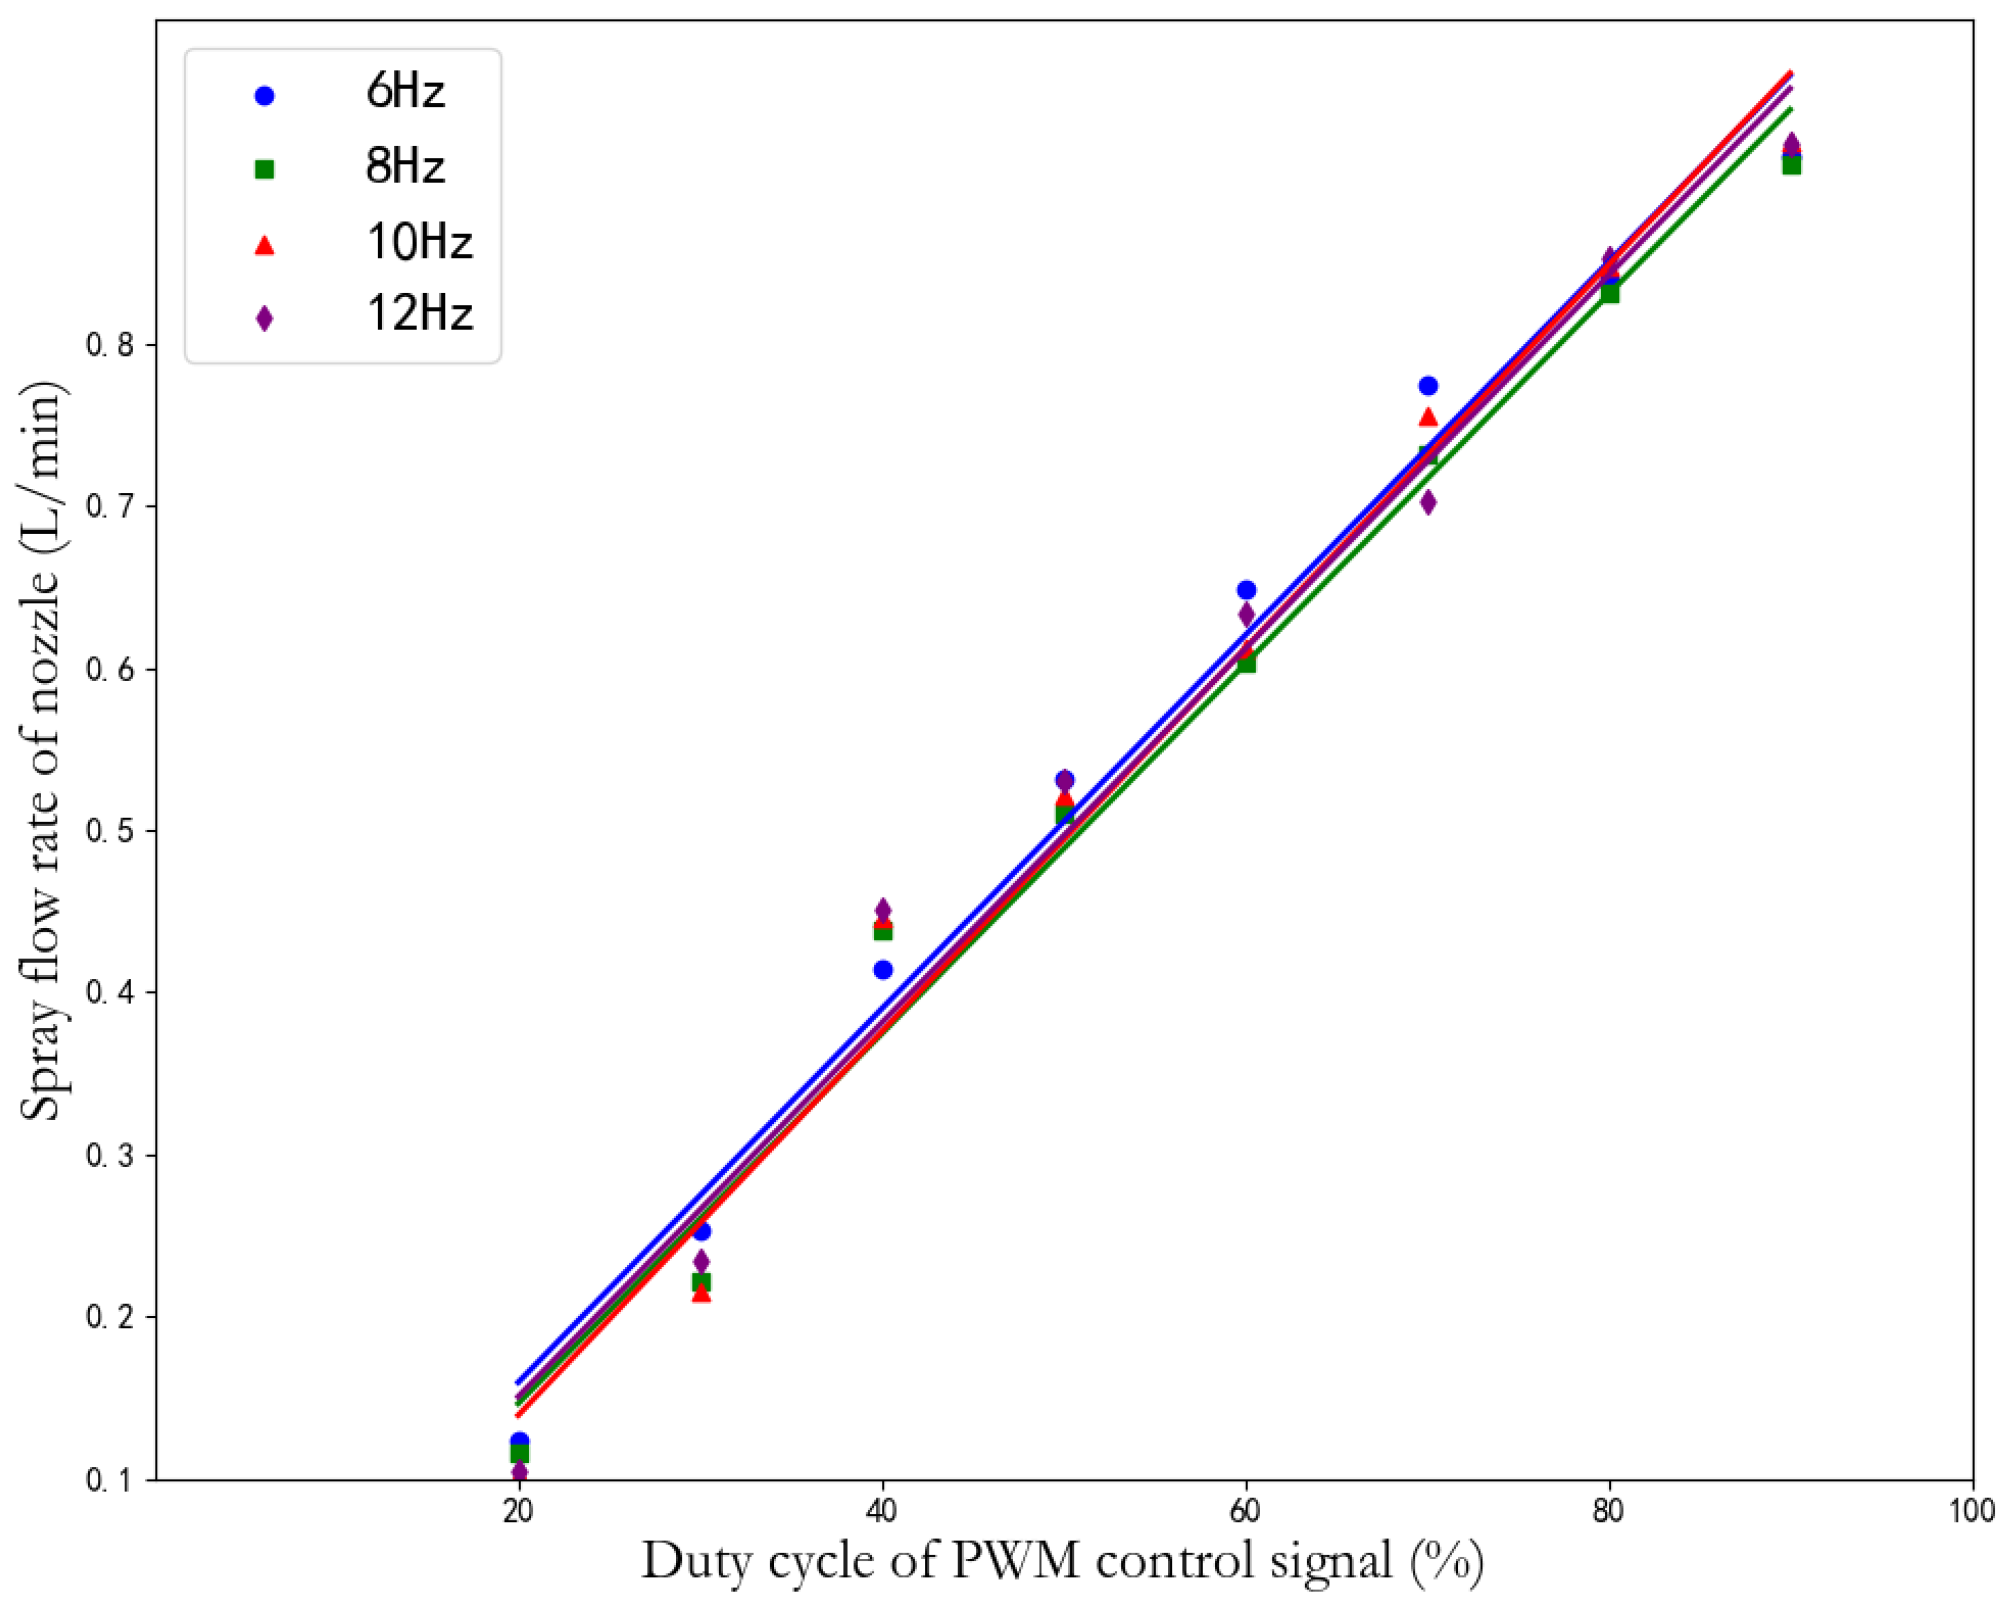
2.3.4. Establishment of Spray Flow Model
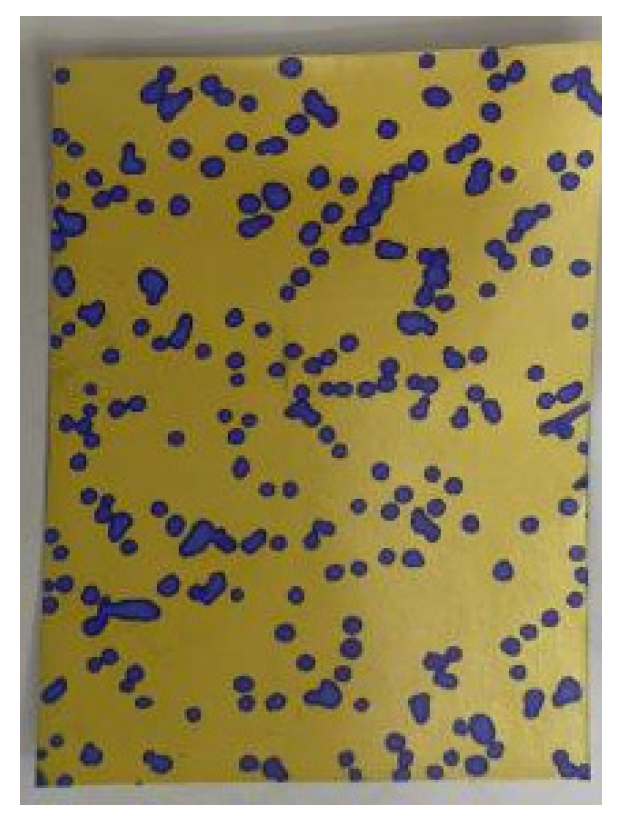
2.3.5. Field Spray Test Design
3. Results
3.1. Analysis of Accuracy in Canopy Parameter Acquisition Models
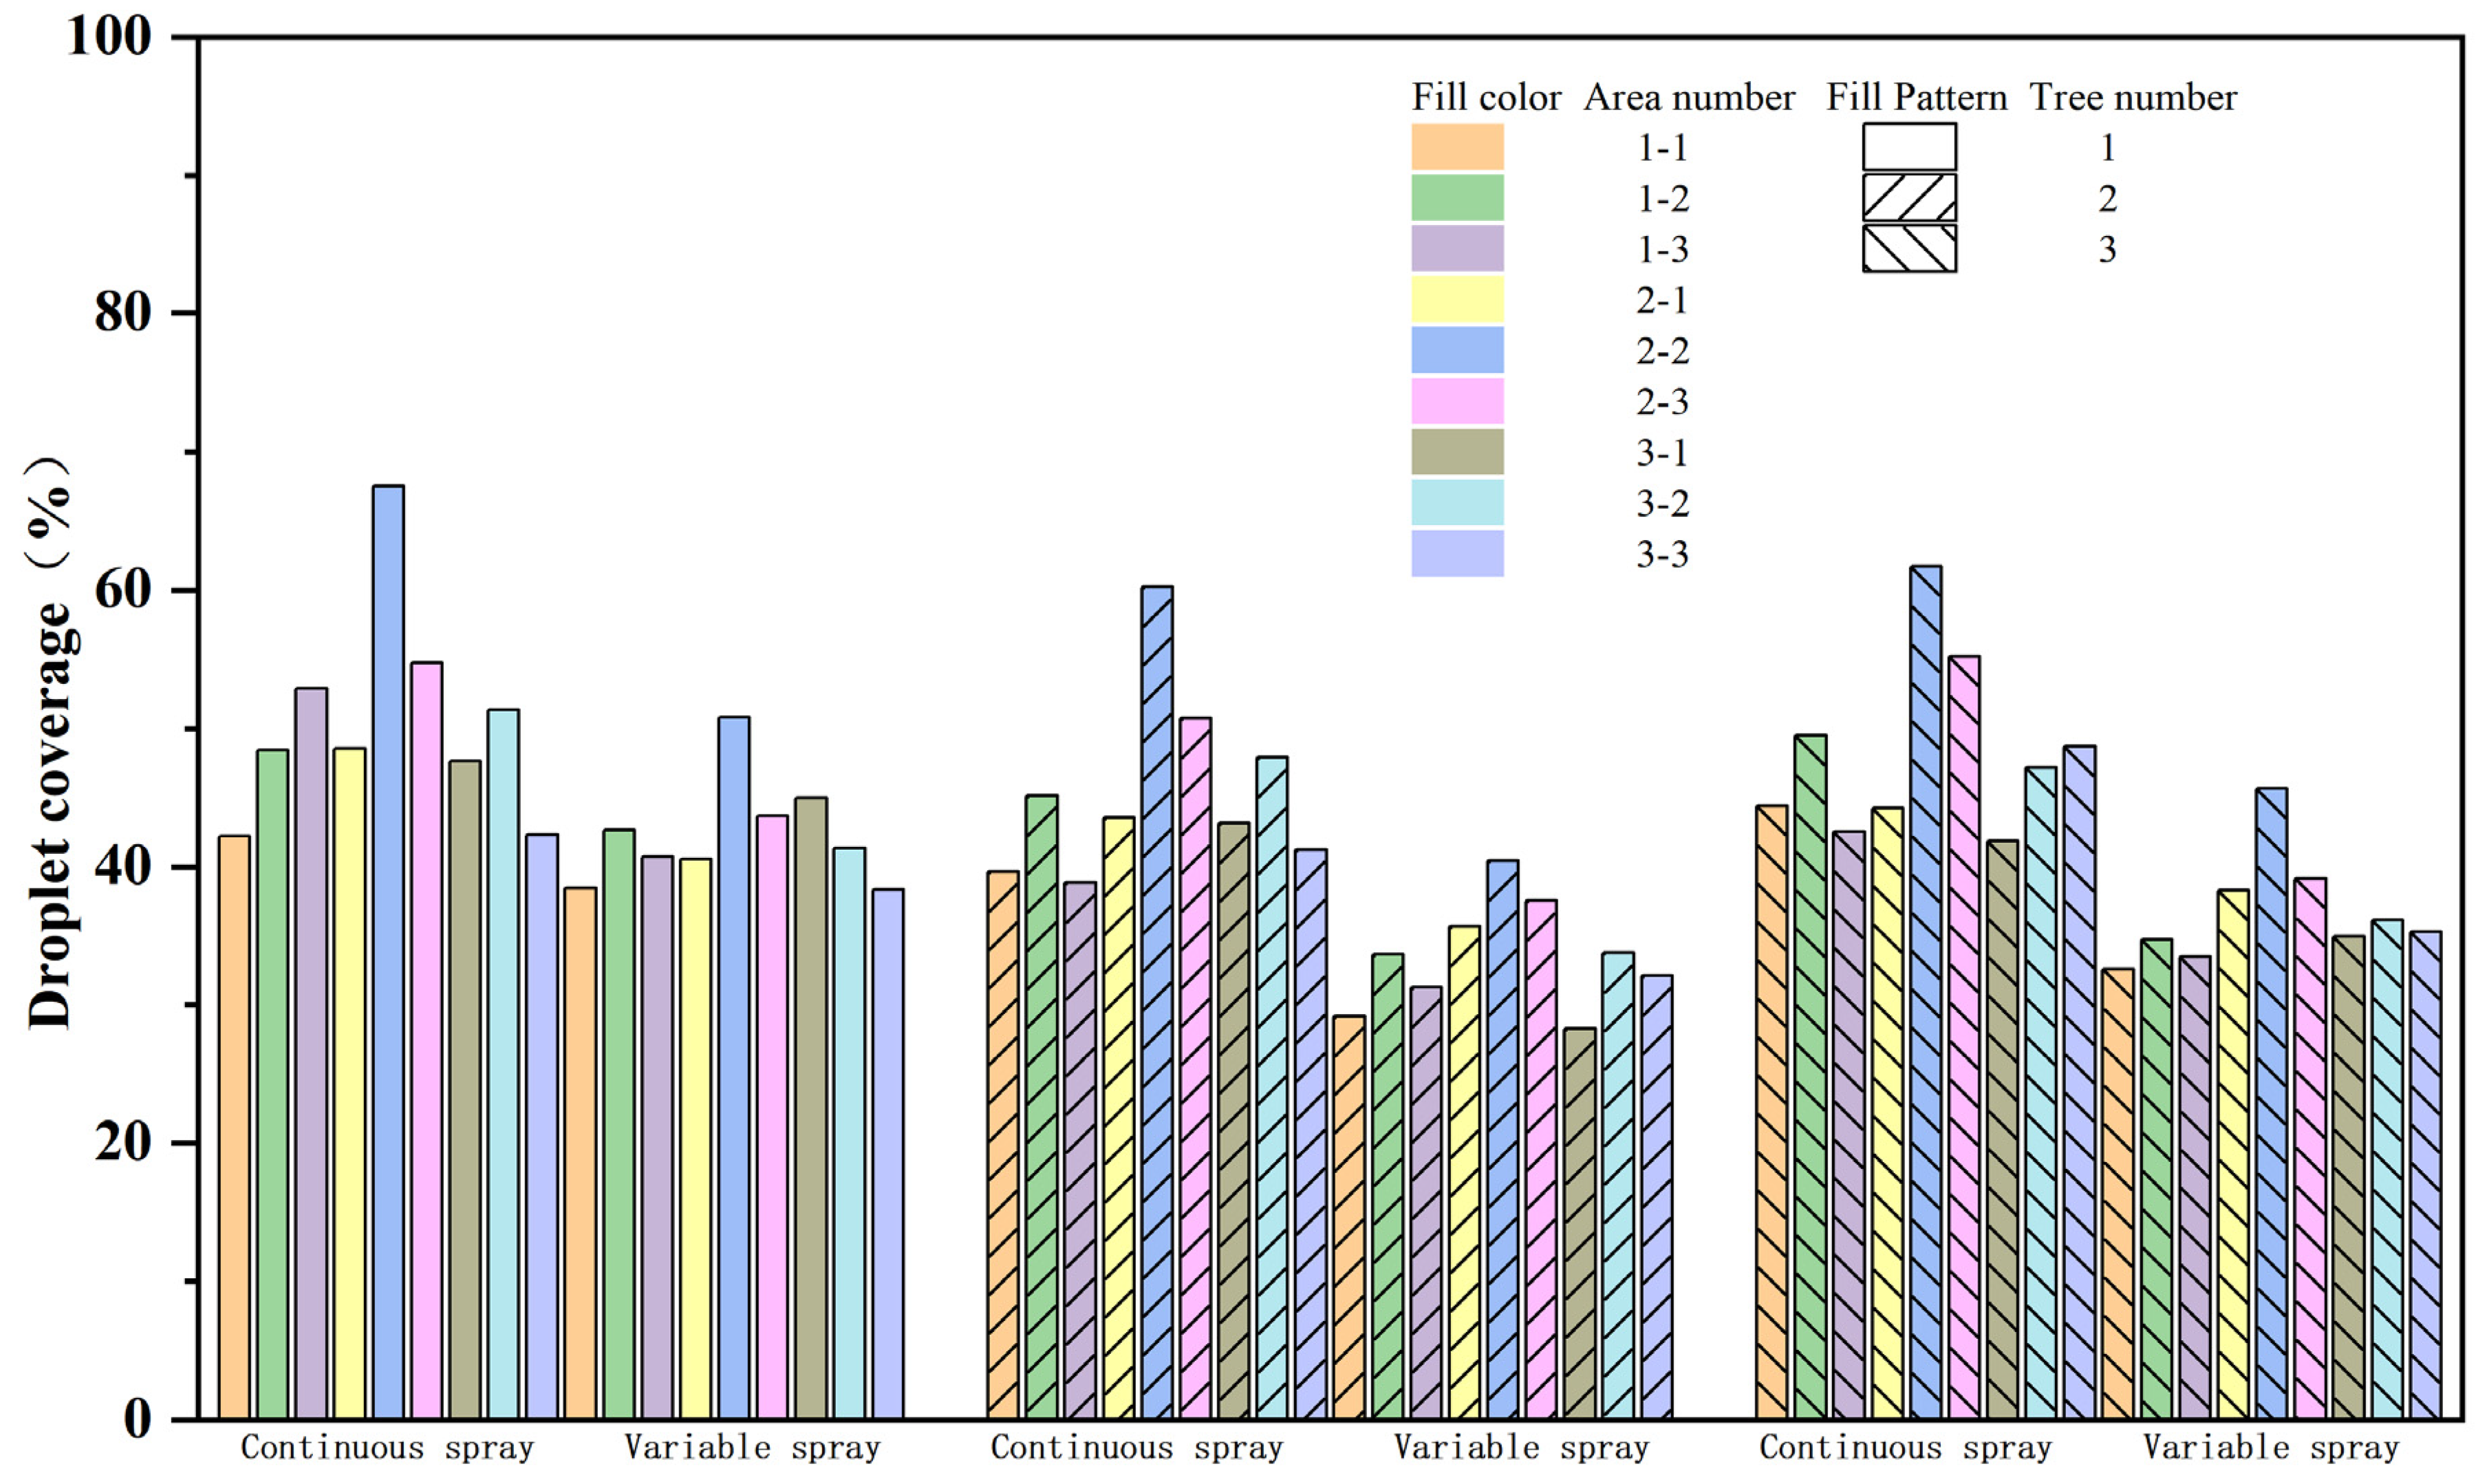
3.2. Analysis of the Practicality of Variable Spray Systems
4. Discussion
5. Conclusions
Author Contributions
Funding
Data Availability Statement
Acknowledgments
Conflicts of Interest
References
- Gu, C.; Wang, X.; Wang, X.; Yang, F.; Zhai, C. Research Progress on Variable-Rate Spraying Technology in Orchards. Appl. Eng. Agric. 2020, 36, 927–942. [Google Scholar] [CrossRef]
- Qin, W.; Chen, P. Analysis of the Research Progress on the Deposition and Drift of Spray Droplets by Plant Protection UAVs. Sci. Rep. 2023, 13, 14935. [Google Scholar] [CrossRef]
- Liu, L.; Liu, Y.; He, X.; Liu, W. Precision Variable-Rate Spraying Robot by Using Single 3D LIDAR in Orchards. Agronomy 2022, 12, 2509. [Google Scholar] [CrossRef]
- Abbas, I.; Liu, J.; Faheem, M.; Noor, R.S.; Ali, S.; Solangi, K.; Raza, S. Different Real-Time Sensor Technologies for the Application of Variable-Rate Spraying in Agriculture. Sens. Actuators A Phys. 2020, 316, 112265. [Google Scholar] [CrossRef]
- Yan, C.; Xu, L.; Yuan, Q.; Ma, S.; Niu, C.; Zhao, S. Design and experiments of vineyard variable spraying control system based on binocular vision. Trans. Chin. Soc. Agric. Eng. 2021, 37, 13–22. [Google Scholar] [CrossRef]
- Hu, L.; Luo, X.; Zeng, X.; Zhang, Z.; Chen, X.; Lin, L. Plant recognition and localization for intra-row mechanical weeding device based on machine vision. Trans. Chin. Soc. Agric. Eng. 2013, 29, 12–18. [Google Scholar]
- Hu, Q.; Yang, B.; Xie, L.; Rosa, S.; Guo, Y.; Wang, Z.; Trigoni, N.; Markham, A. RandLA-Net: Efficient Semantic Segmentation of Large-Scale Point Clouds. In Proceedings of the 2020 IEEE/CVF Conference on Computer Vision and Pattern Recognition (CVPR), Seattle, WA, USA, 13–19 June 2020; IEEE: Seattle, WA, USA, 2020; pp. 11105–11114. [Google Scholar]
- Mirzaei, K.; Arashpour, M.; Asadi, E.; Masoumi, H.; Bai, Y.; Behnood, A. 3D Point Cloud Data Processing with Machine Learning for Construction and Infrastructure Applications: A Comprehensive Review. Adv. Eng. Inform. 2022, 51, 101501. [Google Scholar] [CrossRef]
- Hu, Q.; Yang, B.; Khalid, S.; Xiao, W.; Trigoni, N.; Markham, A. Towards Semantic Segmentation of Urban-Scale 3D Point Clouds: A Dataset, Benchmarks and Challenges. In Proceedings of the 2021 IEEE/CVF Conference on Computer Vision and Pattern Recognition (CVPR), Nashville, TN, USA, 20–25 June 2021; pp. 4975–4985. [Google Scholar]
- Li, L.; He, X.; Song, J.; Zhong, C. Spray characteristics on pulse-width modulation variable application based on high frequency electromagnetic valve. Trans. Chin. Soc. Agric. Eng. 2016, 32, 97–103. [Google Scholar] [CrossRef]
- Sun, H.; Ye, Q.; Chen, Q.; Fu, L.; Xu, Z.; Hu, C. Tree Canopy Volume Extraction Fusing ALS and TLS Based on Improved PointNeXt. Remote Sens. 2024, 16, 2641. [Google Scholar] [CrossRef]
- Yang, Z.; Li, Y.; Duan, J.; Xu, X.; Yu, J.; Shen, D.; Yuan, H. Extraction of the crown information of single tree in orchard based on millimeter wave radar. Trans. Chin. Soc. Agric. Eng. 2021, 37, 173–182. [Google Scholar] [CrossRef]
- Qiang, J.; Liu, W.; Li, X.; Guan, P.; Du, Y.; Liu, B.; Xiao, G. Detection of Citrus Pests in Double Backbone Network Based on Single Shot Multibox Detector. Comput. Electron. Agric. 2023, 212, 108158. [Google Scholar] [CrossRef]
- Cao, Q.; Wang, K.; Li, H. Detection algorithm for crop target multi-lines of the field image based on machine vision. Trans. Chin. Soc. Agric. Eng. 2010, 26, 187–191. [Google Scholar]
- Chen, J.; Jiang, G.; Du, S.; Ke, X. Crop rows detection based on parallel characteristic of crop rows using visual navigation. Trans. Chin. Soc. Agric. Eng. 2009, 25, 107–113. [Google Scholar]
- Li, Q.; Yang, G.; Yan, S.; Fan, R.; Huang, Y.; Wang, C. Achieve Accurate Recognition of 3D Point Cloud Images by Studying the Scattering Characteristics of Typical Targets. Infrared Phys. Technol. 2021, 117, 103852. [Google Scholar] [CrossRef]
- Zhao, Y.; Tang, W.; Feng, J.; Wan, T.; Xi, L. Reweighted Discriminative Optimization for Least-Squares Problems with Point Cloud Registration. Neurocomputing 2021, 464, 48–71. [Google Scholar] [CrossRef]
- Zhang, C.; Zhang, K.; Ge, L.; Zou, K.; Wang, S.; Zhang, J.; Li, W. A Method for Organs Classification and Fruit Counting on Pomegranate Trees Based on Multi-Features Fusion and Support Vector Machine by 3D Point Cloud. Sci. Hortic. 2021, 278, 109791. [Google Scholar] [CrossRef]
- Cai, P.; Indhumathi, C.; Cai, Y.; Zheng, J.; Gong, Y.; Lim, T.S.; Wong, P. Collision Detection Using Axis Aligned Bounding Boxes. In Simulations, Serious Games and Their Applications; Cai, Y., Goei, S.L., Eds.; Springer: Singapore, 2014; pp. 1–14. ISBN 978-981-4560-32-0. [Google Scholar]
- Ding, W.; Zhao, S.; Gu, J.; Qiu, W.; Guo, B. Measurement Methods of Fruit Tree Canopy Volume Based on Machine Vision. Trans. Chin. Soc. Agric. Mach. 2016, 47, 1–10+20. [Google Scholar] [CrossRef]
- Lin, W.; Meng, Y.; Qiu, Z.; Zhang, S.; Wu, J. Measurement and Calculation of Crown Projection Area and Crown Volume of Individual Trees Based on 3D Laser-Scanned Point-Cloud Data. Int. J. Remote Sens. 2017, 38, 1083–1100. [Google Scholar] [CrossRef]
- Lecigne, B.; Delagrange, S.; Messier, C. Exploring Trees in Three Dimensions: VoxR, a Novel Voxel-Based R Package Dedicated to Analysing the Complex Arrangement of Tree Crowns. Ann. Bot. 2018, 121, 589–601. [Google Scholar] [CrossRef]
- Korhonen, L.; Vauhkonen, J.; Virolainen, A.; Hovi, A.; Korpela, I. Estimation of Tree Crown Volume from Airborne Lidar Data Using Computational Geometry. Int. J. Remote Sens. 2013, 34, 7236–7248. [Google Scholar] [CrossRef]
- Garcerá, C.; Moltó, E.; Chueca, P. Spray Pesticide Applications in Mediterranean Citrus Orchards: Canopy Deposition and off-Target Losses. Sci. Total Environ. 2017, 599–600, 1344–1362. [Google Scholar] [CrossRef] [PubMed]
- Hočevar, M.; Širok, B.; Jejčič, V.; Godeša, T.; Lešnika, M.; Stajnko, D. Design and Testing of an Automated System for Targeted Spraying in Orchards. J. Plant Dis. Prot. 2010, 117, 71–79. [Google Scholar] [CrossRef]
- Nan, Y.; Zhang, H.; Zheng, J.; Yang, K.; Ge, Y. Low-Volume Precision Spray for Plant Pest Control Using Profile Variable Rate Spraying and Ultrasonic Detection. Front. Plant Sci. 2022, 13, 1042769. [Google Scholar] [CrossRef] [PubMed]


| Tree Number | Crown Height (m) | Crown Diameter (m) | ||||||
|---|---|---|---|---|---|---|---|---|
| M1 | M2 | M3 | M4 | M5 | M6 | |||
| 1 | 1.52 | 1.46 | 0.441 | 0.506 | 0.462 | 0.481 | 0.231 | 0.497 |
| 2 | 1.38 | 1.68 | 0.326 | 0.323 | 0.358 | 0.409 | 0.165 | 0.373 |
| 3 | 1.59 | 1.69 | 0.610 | 0.770 | 0.690 | 0.577 | 0.343 | 0.637 |
| 4 | 1.13 | 0.98 | 0.108 | 0.077 | 0.091 | 0.181 | 0.013 | 0.182 |
| 5 | 1.33 | 1.64 | 0.314 | 0.256 | 0.333 | 0.391 | 0.134 | 0.332 |
| 6 | 0.66 | 0.95 | 0.038 | 0.060 | 0.050 | 0.119 | 0.039 | 0.040 |
| 7 | 0.64 | 0.68 | 0.061 | 0.069 | 0.088 | 0.177 | 0.047 | 0.073 |
| 8 | 0.92 | 0.94 | 0.093 | 0.093 | 0.159 | 0.245 | 0.066 | 0.161 |
| 9 | 1.32 | 1.29 | 0.242 | 0.256 | 0.261 | 0.382 | 0.104 | 0.311 |
| 10 | 0.98 | 1.02 | 0.120 | 0.126 | 0.165 | 0.303 | 0.065 | 0.153 |
| 11 | 0.96 | 1.15 | 0.115 | 0.120 | 0.165 | 0.292 | 0.043 | 0.138 |
| 12 | 1.02 | 1.36 | 0.151 | 0.159 | 0.225 | 0.393 | 0.075 | 0.207 |
| 13 | 1.03 | 1.32 | 0.216 | 0.228 | 0.258 | 0.404 | 0.070 | 0.231 |
| 14 | 1.24 | 1.42 | 0.312 | 0.330 | 0.262 | 0.428 | 0.110 | 0.351 |
| 15 | 1.47 | 1.43 | 0.368 | 0.390 | 0.365 | 0.469 | 0.234 | 0.396 |
| 16 | 0.97 | 0.67 | 0.071 | 0.074 | 0.072 | 0.161 | 0.061 | 0.115 |
| 17 | 1.12 | 1.03 | 0.113 | 0.118 | 0.114 | 0.241 | 0.099 | 0.121 |
| 18 | 0.87 | 1.01 | 0.081 | 0.085 | 0.076 | 0.163 | 0.050 | 0.105 |
| 19 | 0.62 | 1.04 | 0.076 | 0.079 | 0.090 | 0.168 | 0.064 | 0.083 |
| 20 | 0.80 | 1.05 | 0.073 | 0.076 | 0.076 | 0.165 | 0.054 | 0.104 |
| 21 | 1.04 | 1.10 | 0.403 | 0.428 | 0.276 | 0.285 | 0.288 | 0.433 |
| 22 | 1.01 | 0.91 | 0.245 | 0.258 | 0.167 | 0.226 | 0.142 | 0.293 |
| 23 | 0.84 | 1.09 | 0.123 | 0.129 | 0.118 | 0.169 | 0.052 | 0.152 |
| 24 | 1.15 | 0.92 | 0.104 | 0.109 | 0.138 | 0.286 | 0.069 | 0.135 |
| 25 | 0.70 | 0.96 | 0.053 | 0.055 | 0.093 | 0.216 | 0.065 | 0.055 |
| 26 | 1.03 | 1.16 | 0.141 | 0.148 | 0.140 | 0.233 | 0.116 | 0.120 |
| 27 | 0.94 | 1.04 | 0.131 | 0.138 | 0.131 | 0.259 | 0.049 | 0.159 |
| 28 | 0.75 | 0.87 | 0.052 | 0.054 | 0.050 | 0.143 | 0.032 | 0.063 |
| 29 | 1.05 | 1.18 | 0.191 | 0.201 | 0.162 | 0.289 | 0.080 | 0.212 |
| 30 | 1.10 | 1.25 | 0.274 | 0.290 | 0.301 | 0.456 | 0.185 | 0.312 |
| MAX | 1.59 | 1.69 | 0.610 | 0.770 | 0.690 | 0.577 | 0.343 | 0.637 |
| MIN | 0.62 | 0.67 | 0.038 | 0.054 | 0.050 | 0.119 | 0.013 | 0.040 |
| MEAN | 1.04 | 1.14 | 0.188 | 0.200 | 0.198 | 0.290 | 0.105 | 0.218 |
| SD | 0.26 | 0.26 | 0.139 | 0.162 | 0.141 | 0.121 | 0.080 | 0.146 |
| Tree Number | Layer Number | Nozzle Flow Rate (L/min) | Canopy Volume (m3) | PWM (%) |
|---|---|---|---|---|
| 1 | 1 | 0.683 | 0.158 | 65.43 |
| 2 | 0.873 | 0.202 | 81.95 | |
| 3 | 0.588 | 0.146 | 57.17 | |
| 2 | 1 | 0.315 | 0.073 | 33.48 |
| 2 | 0.510 | 0.118 | 50.45 | |
| 3 | 0.281 | 0.065 | 30.56 | |
| 3 | 1 | 0.454 | 0.105 | 45.60 |
| 2 | 0.571 | 0.132 | 55.70 | |
| 3 | 0.372 | 0.086 | 38.44 |
Disclaimer/Publisher’s Note: The statements, opinions and data contained in all publications are solely those of the individual author(s) and contributor(s) and not of MDPI and/or the editor(s). MDPI and/or the editor(s) disclaim responsibility for any injury to people or property resulting from any ideas, methods, instructions or products referred to in the content. |
© 2024 by the authors. Licensee MDPI, Basel, Switzerland. This article is an open access article distributed under the terms and conditions of the Creative Commons Attribution (CC BY) license (https://creativecommons.org/licenses/by/4.0/).
Share and Cite
Sun, D.; Quan, Z.; Wu, P.; Liu, W.; Xue, X.; Song, S.; Xie, J.; Jiang, S. Design and Testing of a Fruit Tree Variable Spray System Based on ExG-AABB. Agronomy 2024, 14, 2199. https://doi.org/10.3390/agronomy14102199
Sun D, Quan Z, Wu P, Liu W, Xue X, Song S, Xie J, Jiang S. Design and Testing of a Fruit Tree Variable Spray System Based on ExG-AABB. Agronomy. 2024; 14(10):2199. https://doi.org/10.3390/agronomy14102199
Chicago/Turabian StyleSun, Daozong, Zhiwei Quan, Peiran Wu, Weikang Liu, Xiuyun Xue, Shuran Song, Jiaxing Xie, and Sheng Jiang. 2024. "Design and Testing of a Fruit Tree Variable Spray System Based on ExG-AABB" Agronomy 14, no. 10: 2199. https://doi.org/10.3390/agronomy14102199