
Genetic Diversity Analysis of Monogerm Cytoplasmic Male Sterile and Maintainer Lines of Sugar Beet


Abstract
1. Introduction
2. Materials and Methods
2.1. Test Materials
2.1.1. Sugar Beet Materials
2.1.2. Primers
2.2. Test Method
2.2.1. Extraction of Sugar Beet Genomic DNA
2.2.2. Polymerase Chain Reaction Amplification Program and System
2.2.3. PCR Product Detection and Data Analysis
3. Results
3.1. Genetic Diversity Analysis of SSR and InDel Primers
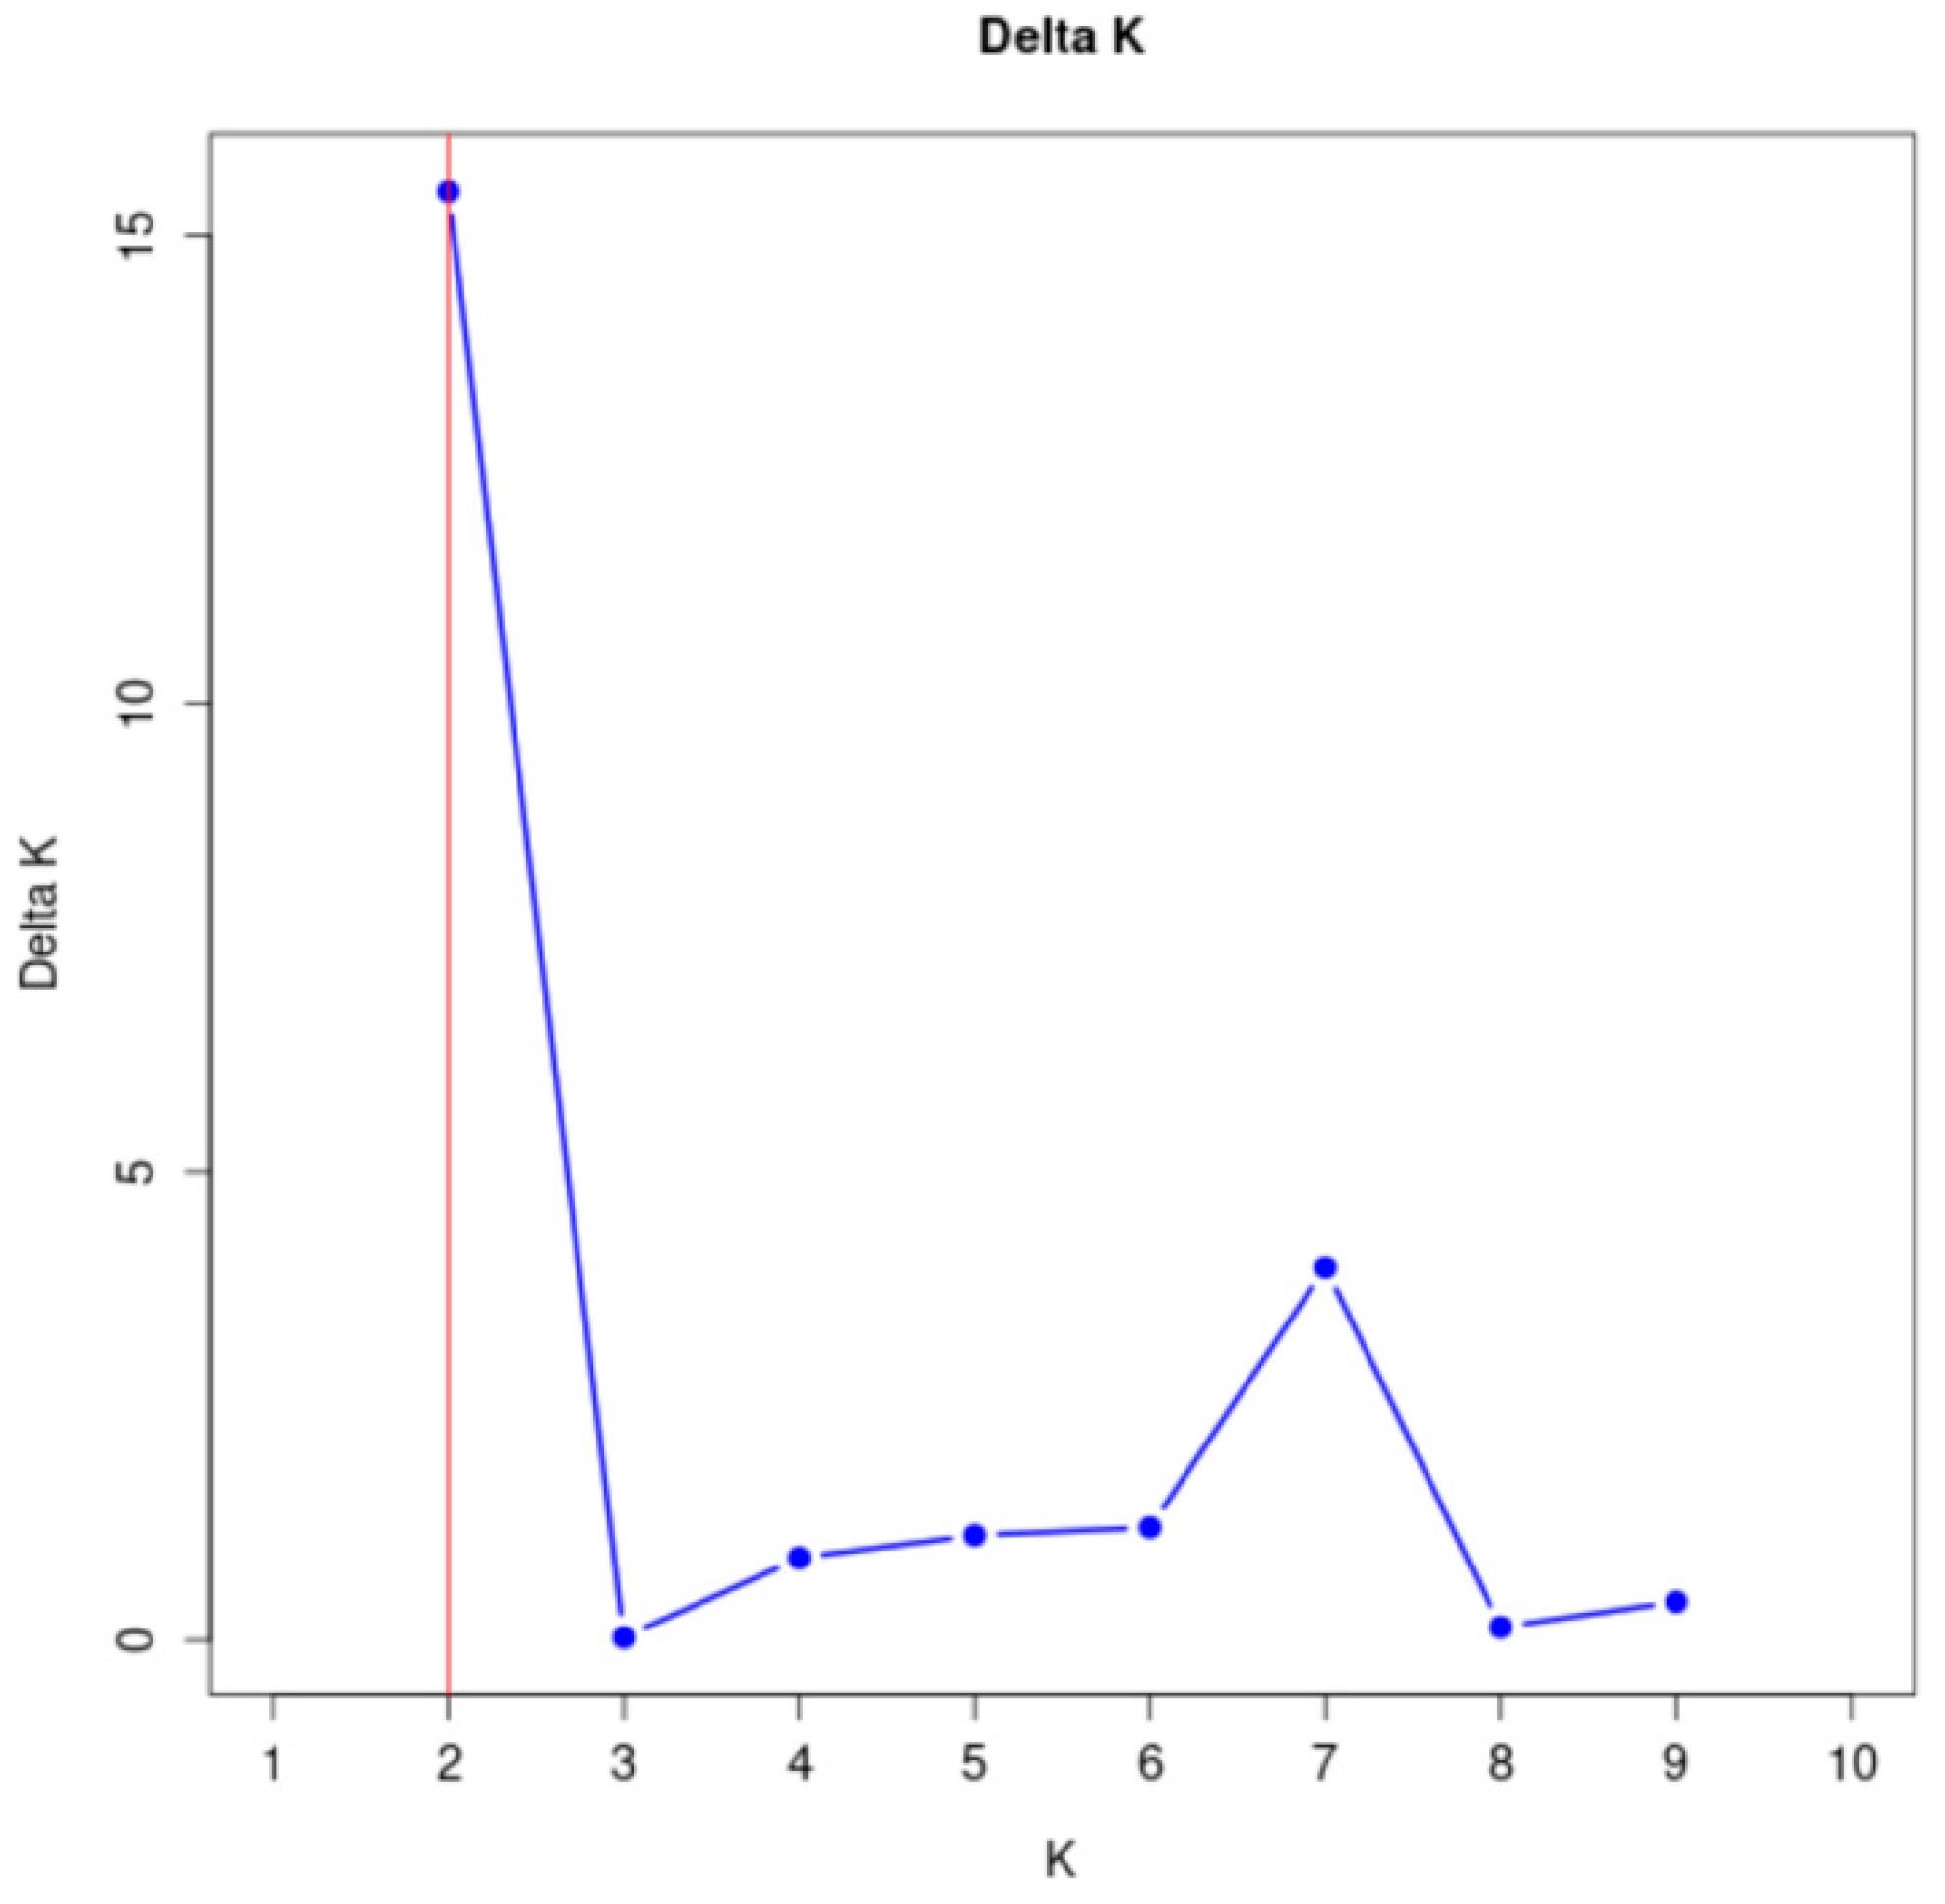
3.2. Group Structure Analysis
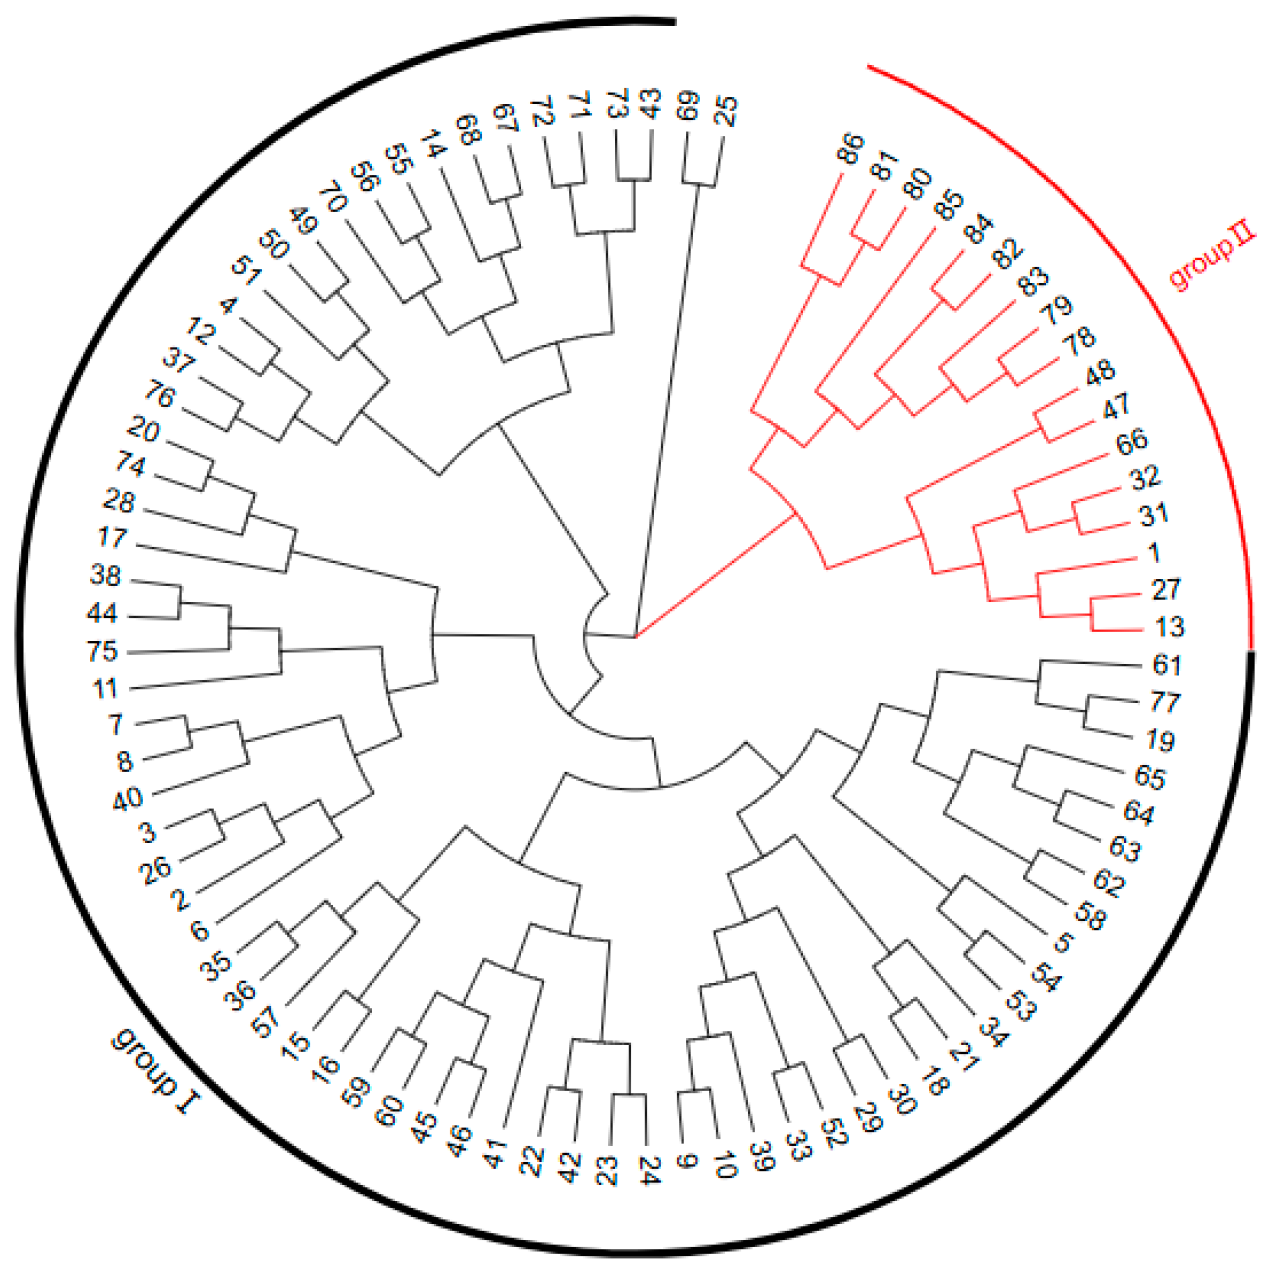
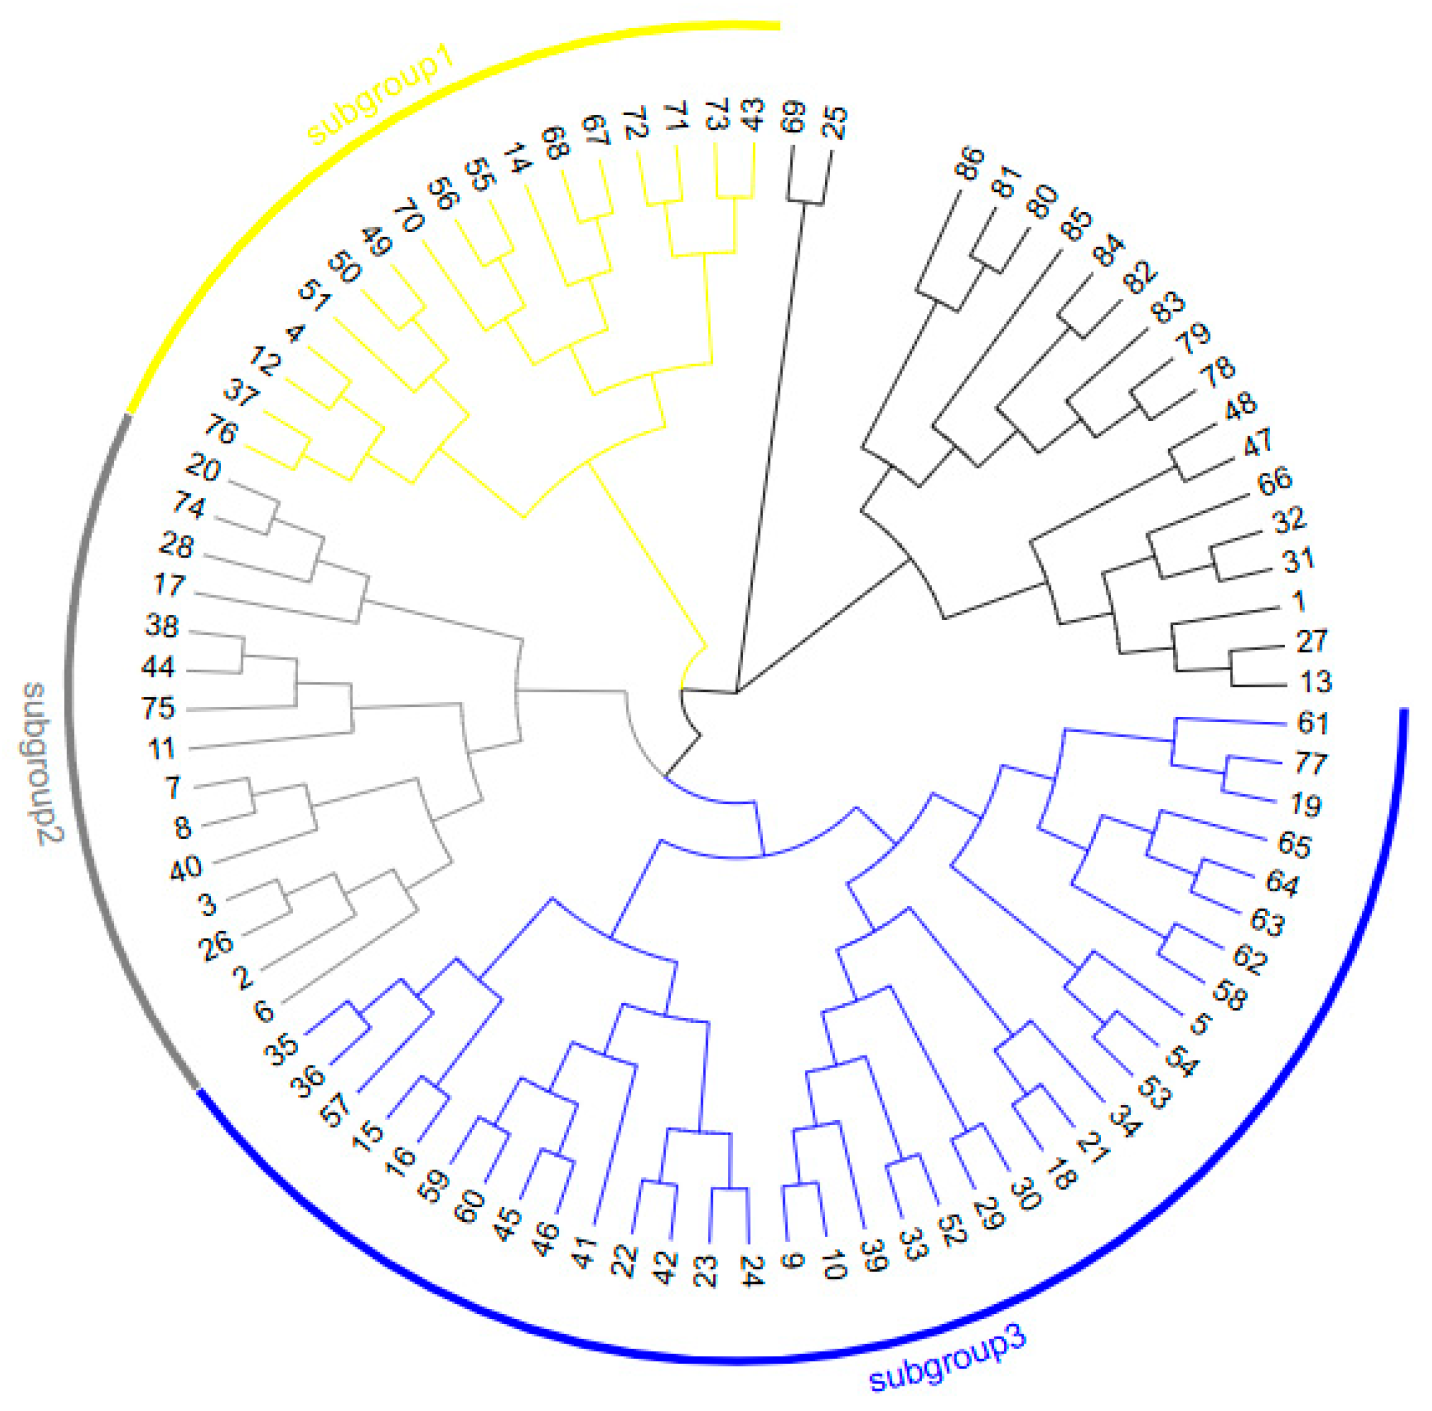
3.3. Cluster Analysis of Sugar Beet CMS and Maintainer Lines
3.4. Principal Coordinate Analysis
3.5. AMOVA of 86 Sugar Beet Monogerm Sterile and Maintainer Lines
4. Discussion
5. Conclusions
Supplementary Materials
Author Contributions
Funding
Data Availability Statement
Conflicts of Interest
References
- Clouse, J.W.; Adhikary, D.; Page, J.T.; Ramaraj, T.; Detholos, M.K.; Udall, J.A.; Fairbanks, D.J.; Jellen, E.N.; Maughan, P.J. The Amaranth Genome: Genome, Transcriptome, and Physical Map Assembly. Plant Genome 2016, 9, 1–14. [Google Scholar] [CrossRef] [PubMed]
- Wolfgang, A.; Temme, N.; Tilcher, R.; Berg, G. Understanding the sugar beet holobiont for sustainable agriculture. Front. Microbiol. 2023, 14, 1151052. [Google Scholar] [CrossRef] [PubMed]
- Li, J.; Schulz, B.; Stich, B. Population structure and genetic diversity in elite sugar beet germplasm investigated with SSR markers. Euphytica 2010, 175, 35–42. [Google Scholar] [CrossRef]
- Chen, H.-M.; Fu, X.; Abbasi, A.M.; Luo, Z.-G. Preparation of environment-friendly pectin from sugar beet pulp and assessment of its emulsifying capacity. Int. J. Food Sci. Technol. 2015, 50, 1324–1330. [Google Scholar] [CrossRef]
- Abang Zaidel, D.N.; Meyer Anne, S. Oxidative enzymatic gelation of sugar beet pectin for emulsion stabilization. Res. J. Biotechnol. 2013, 8, 81–86. [Google Scholar]
- Hotchkiss, A.T.; Qi, P.; Liu, L.S.; Chau, H.K.; Cooke, P.H.; Nuñez, A.; White, A.K.; Fishman, M.L. Sugar beet pulp fiber is a source of bioactive food and feed ingredients. Int. Sugar J. 2019, 121, 826–831. [Google Scholar]
- Li, J.; Lühmann, A.K.; Weißleder, K.; Stich, B. Genome-wide distribution of genetic diversity and linkage disequilibrium in elite sugar beet germplasm. BMC Genom. 2011, 12, 484. [Google Scholar] [CrossRef]
- Mitchell McGrath, J. Assisted Breeding in Sugar Beets. Sugar Tech 2011, 12, 187–193. [Google Scholar] [CrossRef]
- Zhao, J.-J.; Li, S.-N.; Wu, Z.-D.; Zhang, Y. Application of Multigerm Restorer Lines for Improving Monogerm Maintainer Lines in Sugar Beet. Sugar Tech 2024, 1–7. [Google Scholar] [CrossRef]
- Hoffmann, C.M.; Loel, J. Importance of breeding for the increase of sugar beet yield. Sugar Ind. 2015, 140, 48–56. [Google Scholar] [CrossRef]
- Izzatullayeva, V.; Akparov, Z.; Babayeva, S.; Ojaghi, J.; Abbasov, M. Efficiency of using RAPD and ISSR markers in evaluation of genetic diversity in sugar beet. Turk. J. Biol. 2014, 38, 429–438. [Google Scholar] [CrossRef]
- Kornienko, A.V.; Podvigina, O.A.; Zhuzhzhalova, T.P.; Fedulova, T.P.; Bogomolov, M.A.; Oshevnev, V.P.; Butorina, A.K. High-priority research directions in genetics, and the breeding of the sugar beet (Beta vulgaris L.) in the 21st century. Russ. J. Genet. 2014, 50, 1137–1148. [Google Scholar] [CrossRef]
- Dudley, J. Molecular markers in plant improvement: Manipulation of genes affecting quantitative traits. Crop Sci. 1993, 33, 660–668. [Google Scholar] [CrossRef]
- Lee, M. DNA Markers and Plant Breeding Programs. Adv. Agron. 1995, 55, 265–344. [Google Scholar]
- Tang, K.; Fu, D.-J.; Julien, D.; Braun, A.; Cantor, C.R.; Köster, H. Chip-based genotyping by mass spectrometry. Proc. Natl. Acad. Sci. USA 1999, 96, 10016–10020. [Google Scholar] [CrossRef]
- Stevanato, P.; Broccanello, C.; Biscarini, F.; Del Corvo, M.; Sablok, G.; Panella, L.; Stella, A.; Concheri, G. High-Throughput RAD-SNP Genotyping for Characterization of Sugar Beet Genotypes. Plant Mol. Biol. Report. 2014, 32, 691–696. [Google Scholar] [CrossRef]
- Sarif, H.M.; Rafii, M.Y.; Ramli, A.; Oladosu, Y.; Musa, H.M.; Rahim, H.A.; Zuki, Z.M.; Chukwu, S.C. Genetic diversity and variability among pigmented rice germplasm using molecular marker and morphological traits. Biotechnol. Biotechnol. Equip. 2020, 34, 747–762. [Google Scholar] [CrossRef]
- Zhu, S.; Wang, F.; Shen, W.; Jiang, D.; Hong, Q.; Zhao, X. Genetic diversity of Poncirus and phylogenetic relationships with its relatives revealed by SSR and SNP/InDel markers. Acta Physiol. Plant. 2015, 37, 141. [Google Scholar] [CrossRef]
- Ćurčić, Ž.; Taški-Ajduković, K.; Nagl, N. Relationship between hybrid performance and genetic variation in self-fertile and self-sterile sugar beet pollinators as estimated by SSR markers. Euphytica 2017, 213, 108. [Google Scholar] [CrossRef]
- Veloso, M.M.; Simões-Costa, M.C.; Guimarães, J.B.; Ribeiro, C.M.; Evaristo, I.; Espirito-Santo, D.; Pinto-Ricardo, C.; Paulo, O.S.; Duarte, M.C. Genetic diversity and Population structure of wild beets (Beta spp.) from the western Iberian Peninsula and the Azores and Madeira Islands. Diversity 2021, 13, 593. [Google Scholar] [CrossRef]
- Kalia, R.K.; Rai, M.K.; Kalia, S.; Singh, R.; Dhawan, A.K. Microsatellite markers: An overview of the recent progress in plants. Euphytica 2011, 177, 309–334. [Google Scholar] [CrossRef]
- Suprun, I.; Smykov, A.; Stepanov, I.; Tokmakov, S.; Fedorova, O.S.; Ivashchenko, I.A. SSR-fingerprinting and genetic relationship study of modern peach cultivars from the germplasm collection of Nikita Botanical Gardens. In Proceedings of the VIII International Scientific and Practical Conference on Biotechnology as an Instrument for Plant Biodiversity Conservation, Yalta, Crimea, Russia, 1–5 October 2018; Volume 1324, pp. 315–320. [Google Scholar]
- Sathapondecha, P.; Suksri, P.; Nuanpirom, J.; Nakkanong, K.; Nualsri, C.; Whankaew, S. Development of Gene-Based InDel Markers on Putative Drought Stress-Responsive Genes and Genetic Diversity of Durian (Durio zibethinus). Biochem. Genet. 2024, 1–12. [Google Scholar] [CrossRef] [PubMed]
- Cui, J.; Peng, J.; Cheng, J.; Hu, K. Development and validation of genome-wide InDel markers with high levels of polymorphism in bitter gourd (Momordica charantia). BMC Genom. 2021, 22, 190. [Google Scholar] [CrossRef] [PubMed]
- Taguchi, K.; Kuroda, Y.; Okazaki, K.; Yamasaki, M. Genetic and phenotypic assessment of sugar beet (Beta vulgaris L. subsp. vulgaris) elite inbred lines selected in Japan during the past 50 years. Breed. Sci. 2019, 69, 255–265. [Google Scholar] [CrossRef]
- Nguyen, N.N.; Kwon, Y.-S.; Park, J.-R.; Sim, S.C. Development of a Core Set of SSR Markers for Cultivar Identification and Seed Purity Tests in Oriental Melon (Cucumis melo L. var. makuwa). Hortic. Sci. Technol. 2019, 37, 119–129. [Google Scholar] [CrossRef]
- Jander, G.; Norris, S.R.; Rounsley, S.D.; Bush, D.F.; Levin, I.M.; Last, R.L. Arabidopsis map-based cloning in the post-genome era. Plant Physiol. 2002, 129, 440–450. [Google Scholar] [CrossRef]
- Lee, H.Y.; Ro, N.Y.; Jeong, H.J.; Kwon, J.-K.; Jo, J.; Ha, Y.; Jung, A.; Han, J.-W.; Venkatesh, J.; Kang, B.-C. Genetic diversity and Population structure analysis to construct a core collection from a large Capsicum germplasm. BMC Genet. 2016, 17, 142. [Google Scholar] [CrossRef]
- Doyle, J. DNA protocols for plants. Molecular techniques in taxonomy. NATO ASI Ser. 1991, 57, 283–293. [Google Scholar]
- Peng, F.; Pi, Z.; Li, S.N.; Wu, Z. Genetic Diversity and Population Structure Analysis of Excellent Sugar Beet (Beta vulgaris L.) Germplasm Resources. Horticulturae 2024, 10, 120. [Google Scholar] [CrossRef]
- Nei, M.; Tajima, F.; Tateno, Y. Accuracy of estimated phylogenetic trees from molecular data: II. Gene frequency data. J. Mol. Evol. 1983, 19, 153–170. [Google Scholar] [CrossRef]
- Kimura, M.; Crow, J.F. The number of alleles that can be maintained in a finite Population. Genetics 1964, 49, 725–738. [Google Scholar] [CrossRef] [PubMed]
- Nei, M. Analysis of gene diversity in subdivided Populations. Proc. Natl. Acad. Sci. USA 1973, 70, 3321–3323. [Google Scholar] [CrossRef] [PubMed]
- Lewontin, R.C. The apportionment of human diversity. In The Concept of Race in Natural and Social Science; Routledge: London, UK, 2014; pp. 7–24. [Google Scholar]
- Liu, K.; Muse, S.V. PowerMarker: An integrated analysis environment for genetic marker analysis. Bioinformatics 2005, 21, 2128–2129. [Google Scholar] [CrossRef] [PubMed]
- Smith, J.; Chin, E.; Shu, H.; Smith, O.S.; Wall, S.J.; Senior, M.L.; Mitchell, S.; Kresovich, S.; Ziegle, J. An evaluation of the utility of SSR loci as molecular markers in maize (Zea mays L.): Comparisons with data from RFLPs and pedigree. Theor. Appl. Genet. 1997, 95, 163–173. [Google Scholar] [CrossRef]
- Pritchard, J.K.; Stephens, M.; Donnelly, P. Inference of Population structure using multilocus germplasm data. Genetics 2000, 155, 945–959. [Google Scholar] [CrossRef]
- Peakall, R.; Smouse, P.E. GENALEX 6: Genetic analysis in Excel. Population genetic software for teaching and research. Mol. Ecol. Notes 2006, 6, 288–295. [Google Scholar] [CrossRef]
- Nei, M. Genetic distance between Populations. Am. Nat. 1972, 106, 283–292. [Google Scholar] [CrossRef]
- Kumar, S.; Stecher, G.; Tamura, K. MEGA7: Molecular evolutionary genetics analysis version 7.0 for bigger datasets. Mol. Biol. Evol. 2016, 33, 1870–1874. [Google Scholar] [CrossRef]
- Fugate, K.K.; Fajardo, D.; Schlautman, B.; Ferrareze, J.P.; Bolton, M.D.; Campbell, L.G.; Wiesman, E.; Zalapa, J. Generation and Characterization of a Sugarbeet Transcriptome and Transcript-Based SSR Markers. Plant Genome 2014, 7, plantgenome2013.11.0038. [Google Scholar] [CrossRef]
- Amangeldiyeva, A.; Daniyarova, A.; Tabynbayeva, L.K.; Bastaubayeva, S.; Kovalchuk, N.; Yerzhebayeva, R. Assessment of the genetic diversity in sugar beet (Beta vulgaris L.) using SSR markers. Sabrao J. Breed. Genet. 2023, 55, 1616–1628. [Google Scholar] [CrossRef]
- Desplanque, B.; Boudry, P.; Broomberg, K.; Saumitou-Laprade, P.; Cuguen, J.; Van Dijk, H. Genetic diversity and gene flow between wild, cultivated and weedy forms of Beta vulgaris L. (Chenopodiaceae), assessed by RFLP and microsatellite markers. Theor. Appl. Genet. 1999, 98, 1194–1201. [Google Scholar] [CrossRef]
- McGrath, J.; Derrico, C.; Yu, Y. Genetic diversity in selected, historical US sugarbeet germplasm and Beta vulgaris ssp. maritima. Theor. Appl. Genet. 1999, 98, 968–976. [Google Scholar] [CrossRef]
- Abbasi, Z.; Arzani, A.; Majidi, M. Evaluation of genetic diversity of sugar beet (Beta vulgaris L.) crossing parents using agro-morphological traits and molecular markers. J. Agric. Sci. Technol. 2014, 16, 1397–1411. [Google Scholar]
- Taški-Ajduković, K.; Nagl, N.; Ćurčić, Ž.; Zorić, M. Estimation of genetic diversity and relationship in sugar beet pollinators based on SSR markers. Electron. J. Biotechnol. 2017, 27, 1–7. [Google Scholar] [CrossRef]
- De Riek, J.; Everaert, I.; Esselink, D.; Calsyn, E.; Smulders, M.J.M.; Vosman, B. Assignment tests for variety identification compared to genetic similarity-based methods using experimental datasets from different marker systems in sugar beet. Crop Sci. 2007, 47, 1964–1974. [Google Scholar] [CrossRef]
- Li, X.; Cui, L.; Zhang, L.; Huang, Y.; Zhang, S.; Chen, W.; Deng, X.; Jiao, Z.; Yang, W.; Qiu, Z.; et al. Genetic Diversity Analysis and Core Germplasm Collection Construction of Radish Cultivars Based on Structure Variation Markers. Int. J. Mol. Sci. 2023, 24, 2554. [Google Scholar] [CrossRef]


| No. | Resource Name | No. | Resource Name | No. | Resource Name |
|---|---|---|---|---|---|
| 1 | WC1 | 30 | WO20 | 59 | 2D5 |
| 2 | WO1 | 31 | WC21 | 60 | 2D6 |
| 3 | WC3 | 32 | WO21 | 61 | 2A1 |
| 4 | WO3 | 33 | 2D7 | 62 | 2A2 |
| 5 | WC7 | 34 | 2D8 | 63 | 2A3 |
| 6 | WO7 | 35 | WC25 | 64 | 2A4 |
| 7 | WC8 | 36 | WO25 | 65 | 2B13 |
| 8 | WO8 | 37 | WC31 | 66 | 2B14 |
| 9 | WC9 | 38 | WO31 | 67 | T20 |
| 10 | WO9 | 39 | WC32 | 68 | T21 |
| 11 | WC10 | 40 | WO32 | 69 | T14 |
| 12 | WO10 | 41 | WC35 | 70 | T15 |
| 13 | WC11 | 42 | WO35 | 71 | T3 |
| 14 | WO11 | 43 | WC36 | 72 | T2 |
| 15 | WC12 | 44 | WO36 | 73 | WO5 |
| 16 | WO12 | 45 | WC37 | 74 | WO28 |
| 17 | WC13 | 46 | WO37 | 75 | WO34 |
| 18 | WO13 | 47 | WC39 | 76 | WO33 |
| 19 | WC14 | 48 | WO39 | 77 | WO38 |
| 20 | WO14 | 49 | WC40 | 78 | Dy5 CMS |
| 21 | WC15 | 50 | WO40 | 79 | Dy5 O |
| 22 | WO15 | 51 | WC41 | 80 | Dy20CMS |
| 23 | WC16 | 52 | WO41 | 81 | Dy20 O |
| 24 | WO16 | 53 | 2B5 | 82 | JL1-CMS |
| 25 | WC17 | 54 | 2B6 | 83 | JL2-CMS |
| 26 | WO17 | 55 | 2B9 | 84 | JL3-CMS |
| 27 | WC19 | 56 | 2B10 | 85 | S1 |
| 28 | WO19 | 57 | 2B15 | 86 | S2 |
| 29 | WC20 | 58 | 2B16 |
| No. | Locus | Chromosomal Position | Positive Sequence | Backward Sequence | Annealing Temperature |
|---|---|---|---|---|---|
| 1 | L7 | Chr1 | TCCATTTCCAACAACAGCAA | CCAAAGCCAGGAAAGTTGAA | 57 °C |
| 2 | A01 | Chr1 | TTCCATGGGAAGTGTCGC | TGCAAGAGAATGAGAACGGA | TD |
| 3 | A02 | Chr1 | CCTTCTTACATCTCCAACCCT | TGGTGGTTGTTGTGGTGG | TD |
| 4 | 14118 | Chr2 | AAGTCTAACACCAGAATCCAGA | AACCAGAGAGAATATGAGGATG | TD |
| 5 | B06 | Chr2 | TGGAGAAAATTGAGAGTGTGG | TCCTTCATCGTCTTCCTTTCA | TD |
| 6 | 11965 | Chr3 | TTGAGTATTTTCGTCGGC | CATCTACATCAGTTTTCCCTTC | 57 °C |
| 7 | 26391 | Chr3 | CAGAATACACTTGGTGAGATGA | TACTATGTTGTTGCTGCTGTG | 57 °C |
| 8 | L16 | Chr3 | GTTGAATCAGGTAATGCGGG | TTTCTCCCCGTGAAGATGAC | 57 °C |
| 9 | A05 | Chr4 | AATGAGCTTGAGGCGTCG | AAAGAAAGGGGAAAGGGGA | TD |
| 10 | A06 | Chr4 | TTGTTGTTGGTGCAACGG | ACACCAAAATTGCGGGAA | TD |
| 11 | A07 | Chr4 | GGGCCCTAACCCTAACCA | CAGGGGAAGCAAATTCCA | TD |
| 12 | L37 | Chr5 | TCCATGAATTCTCCGACGA | GGAGGAGAAATGGAGAAAAGG | 57 °C |
| 13 | 2305 | Chr5 | TACTAAAACCCTACGAACTCCA | TACACCTGTGATTGTCAGAAGA | 57 °C |
| 14 | 57236 | Chr5 | TTGGAGAGAGAAAAGAGAGAAG | ATCCCTTGACAGTAGAACTCC | 57 °C |
| 15 | W21 | Chr6 | GTGAGTATTCGGGAGATGGC | GAAGCAAAAGCAATGGAAAA | TD |
| 16 | TC94 | Chr6 | GAAGAAGCCGAGGAGAGAGA | CCCGTAAGAAGCGAACTCTG | 57 °C |
| 17 | L48 | Chr6 | TGTTGCCTTGACTGTTGCTC | GAGGGGAAGTGGGAAAGAAG | TD |
| 18 | A18 | Chr7 | AACCCTAACCCCACCACC | TGGTTGGGGAAATGAACG | TD |
| 19 | A19 | Chr7 | ACTTTGCCTTTGCAATCCA | GACGGCGGTAGGAGGAGT | TD |
| 20 | B34 | Chr7 | CAAAGCCACAACAAAAGTGA | CCAAACTTGCAATTGTGCTT | TD |
| 21 | TC46 | Chr8 | GATCCGAGGAAACAAGGGAT | GCCACGACCAAAATCTCAGT | TD |
| 22 | L70 | Chr8 | GCTGATGATCTTGTGGAGCA | TTGGTTTAGGCTGGAATTGG | TD |
| 23 | 86067 | Chr8 | CTTTAGTGTAGCGTTAGAGCG | TAACAGCAGGACTGGAGAAG | TD |
| 24 | A27 | Chr9 | TACGATGAGTGCCTGCGA | TTTTGGTGGGGAGGGG | TD |
| 25 | A28 | Chr9 | CGGTCAAGGAAGCTACGG | CACGAACCATTTCCCCTG | TD |
| 26 | A29 | Chr9 | CGATGGGTAGGAGGAGGAA | GGAAGAGGAAGAGGAAGAGGA | TD |
| No. | Locus | Chromosomal Position | Positive Sequence | Backward Sequence | Annealing Temperature |
|---|---|---|---|---|---|
| 1 | ND18 | Chr1 | TTGCCTTTGCATCTTCTTTTC | GGGGCCTTTAATAACTTTTCC | TD |
| 2 | ND109 | Chr1 | AGCCTAGCAGGGATGGGT | CCTTACCAAAAGGTTCTGCAA | TD |
| 3 | ND113 | Chr1 | CTTCAGCTTGCAGTCACCAG | TGGATGGTTCAGGGAGGA | TD |
| 4 | ND19 | Chr1 | GCATTCGTCCAAGTAAAGGG | TGGTGGTAGAGCCTTCAGGA | TD |
| 5 | ND31 | Chr2 | CGAGGATCAAGATCCCACA | TTTTTGACGGGCTAGCTACTT | TD |
| 6 | ND29 | Chr2 | TTTTTCGTGCGATATGCC | TGGATCACCCAAAATCAATAG | TD |
| 7 | ND33 | Chr2 | GCTGCAATAGGCGATTCGT | GCAAGGTGACAACCACCA | TD |
| 8 | ND34 | Chr2 | TGGTGGTTGTCACCTTGC | GGAACAAGCTATTGGGAATTT | TD |
| 9 | ND47 | Chr3 | CGATTAGATTTCTCTGCTGGC | GGGGCTTCAGCCAGAACT | TD |
| 10 | ND220 | Chr3 | CAGTCCAACAACACCACACC | CGCATAAGAATCTGCTGGGT | TD |
| 11 | ND129 | Chr3 | AACCCGACTCTATCCAGCA | TCCCCACCTTCATACATGG | TD |
| 12 | ND52 | Chr4 | CCTTCATGAGTTCCGGCT | CGCAACGTGCACTTACTTTC | TD |
| 13 | ND139 | Chr4 | TGGTCGACGATCAGGGAT | CAAACCTCTCCACCCACG | TD |
| 14 | ND141 | Chr4 | TCAATTCCAGCCTCACAAAA | AATTCGTACTGGGGTTTTGAA | TD |
| 15 | ND142 | Chr4 | TGCCAACTAAGTCCTTAGCCA | TGCACAGTTGCACACACG | TD |
| 16 | ND63 | Chr5 | CTTCAGCTTGCAGTCACCAG | TGGATGGTTCAGGGAGGA | TD |
| 17 | ND247 | Chr5 | TGGCTGCTAAAGGGATGG | CACGGAAAAGATCTTGCACA | TD |
| 18 | ND65 | Chr5 | GGCCCATGCTCATTGTCT | TTGAAGAGGGTCTCTCACCTG | TD |
| 19 | ND66 | Chr5 | TTGTTGAGCTCACGATATGC | GGGATGGTGGTTTTGTGG | TD |
| 20 | ND73 | Chr6 | CTTGCCAAACAACCCATCTT | TTCTTGAATCCTAAACCCTCC | TD |
| 21 | ND75 | Chr6 | TTGTGCTCTCTGCATAACGAG | TGTCAAGGTGAGGAAGAAGAA | TD |
| 22 | ND249 | Chr6 | GAAAATTGCTGAAACTGCAAC | ATTCCACCCAACCCCTTC | TD |
| 23 | ND251 | Chr6 | TCAAAATTGAAATTGTTGCCT | CTAACCACCTTGCCAGCG | TD |
| 24 | ND173 | Chr7 | GGGTCTATCACATGATGCCA | GGATAGCCCTTAAGCTTTTGA | TD |
| 25 | ND262 | Chr7 | CTTCAGGTTTTGCTGTGCC | TCCCATTACGCAAAAGTCG | TD |
| 26 | ND264 | Chr7 | GTCCCCCATGTGTTGCAT | AGCGGAAAAATTCGGACC | TD |
| 27 | ND267 | Chr7 | GCTTGCTCACGAGCTTCC | ACTGTTCGAATCCGACGC | TD |
| 28 | ND272 | Chr8 | CGCAATTTTTCAAACCCAA | CATTGAGCCGCAAGGACT | TD |
| 29 | ND274 | Chr8 | CTTGAGGTTGTGGGTTTGAA | TTGAGACAAATGGACTCCTCA | TD |
| 30 | ND276 | Chr8 | CCCTCTTGGGTAGTTGAGCA | CCACTGAGATCAGCATCAACA | TD |
| 31 | ND286 | Chr8 | ATCATGGAGGCTCACCCA | GCTACCCTCGGATTGCAT | TD |
| 32 | ND99 | Chr9 | AATGAACGGCTTTAGCACAAA | ACCTGGTTTCCGCTGTTG | TD |
| 33 | ND285 | Chr9 | GGTGGCTTCTTTGGCACA | GCAATTTCGAGCAAAAATCCT | TD |
| 34 | ND283 | Chr9 | TGCCAAGAATGGTCGTCA | TCTGAGCTTAGGCTCCATCTT | TD |
| 35 | ND284 | Chr9 | GCAGCCAGCAGAAGGAGA | CCCATGTTCGGTGGTTGT | TD |
| Locus | Na | Ne | I | Ho | He | Genetic Diversity | PIC |
|---|---|---|---|---|---|---|---|
| L7 | 2.000 | 1.732 | 0.613 | 0.425 | 0.422 | 0.449 | 0.367 |
| A01 | 2.000 | 1.832 | 0.646 | 0.457 | 0.454 | 0.454 | 0.351 |
| A02 | 3.000 | 1.047 | 0.123 | 0.045 | 0.045 | 0.046 | 0.045 |
| 14118 | 3.000 | 2.682 | 1.040 | 0.631 | 0.627 | 0.644 | 0.578 |
| B06 | 3.000 | 1.568 | 0.573 | 0.364 | 0.362 | 0.386 | 0.318 |
| 11965 | 6.000 | 5.342 | 1.728 | 0.817 | 0.812 | 0.824 | 0.801 |
| 26391 | 2.000 | 1.730 | 0.613 | 0.424 | 0.422 | 0.535 | 0.469 |
| L16 | 2.000 | 1.483 | 0.507 | 0.328 | 0.326 | 0.437 | 0.391 |
| A05 | 2.000 | 2.000 | 0.693 | 0.507 | 0.500 | 0.547 | 0.488 |
| A06 | 3.000 | 1.891 | 0.827 | 0.474 | 0.471 | 0.484 | 0.439 |
| A07 | 3.000 | 1.331 | 0.485 | 0.250 | 0.248 | 0.315 | 0.297 |
| L37 | 3.000 | 2.476 | 0.979 | 0.600 | 0.596 | 0.665 | 0.606 |
| 2305 | 2.000 | 1.751 | 0.620 | 0.431 | 0.429 | 0.442 | 0.354 |
| 57236 | 3.000 | 2.091 | 0.802 | 0.530 | 0.522 | 0.540 | 0.485 |
| W21 | 4.000 | 1.972 | 0.860 | 0.496 | 0.493 | 0.516 | 0.454 |
| TC94 | 2.000 | 1.998 | 0.692 | 0.502 | 0.499 | 0.553 | 0.452 |
| L48 | 3.000 | 1.484 | 0.617 | 0.328 | 0.326 | 0.357 | 0.334 |
| A18 | 5.000 | 3.438 | 1.344 | 0.713 | 0.709 | 0.716 | 0.665 |
| A19 | 5.000 | 2.733 | 1.286 | 0.637 | 0.634 | 0.643 | 0.609 |
| B34 | 2.000 | 1.844 | 0.650 | 0.460 | 0.457 | 0.458 | 0.353 |
| TC46 | 2.000 | 1.487 | 0.509 | 0.330 | 0.327 | 0.472 | 0.425 |
| L70 | 3.000 | 2.735 | 1.054 | 0.643 | 0.639 | 0.648 | 0.575 |
| 86067 | 4.000 | 3.233 | 1.267 | 0.694 | 0.690 | 0.691 | 0.637 |
| A27 | 2.000 | 2.000 | 0.693 | 0.666 | 0.500 | 0.046 | 0.045 |
| A28 | 2.000 | 1.128 | 0.228 | 0.114 | 0.113 | 0.424 | 0.365 |
| A29 | 3.000 | 1.280 | 0.447 | 0.220 | 0.218 | 0.539 | 0.461 |
| MEAN | 2.923 | 2.090 | 0.765 | 0.465 | 0.455 | 0.493 | 0.437 |
| Locus | Na | Ne | I | Ho | He | Genetic Diversity | PIC |
|---|---|---|---|---|---|---|---|
| ND18 | 2.000 | 1.409 | 0.466 | 0.705 | 0.295 | 0.523 | 0.441 |
| ND109 | 2.000 | 1.996 | 0.692 | 0.497 | 0.502 | 0.647 | 0.571 |
| ND113 | 2.000 | 1.328 | 0.413 | 0.751 | 0.248 | 0.297 | 0.269 |
| ND19 | 2.000 | 1.995 | 0.692 | 0.498 | 0.501 | 0.498 | 0.374 |
| ND31 | 4.000 | 3.494 | 1.319 | 0.279 | 0.721 | 0.728 | 0.688 |
| ND29 | 3.000 | 1.696 | 0.733 | 0.586 | 0.413 | 0.485 | 0.449 |
| ND33 | 3.000 | 1.405 | 0.507 | 0.707 | 0.292 | 0.530 | 0.446 |
| ND34 | 4.000 | 1.731 | 0.753 | 0.574 | 0.425 | 0.495 | 0.449 |
| ND47 | 2.000 | 1.986 | 0.689 | 0.500 | 0.499 | 0.519 | 0.406 |
| ND220 | 2.000 | 1.412 | 0.467 | 0.703 | 0.296 | 0.498 | 0.423 |
| ND129 | 2.000 | 1.318 | 0.405 | 0.756 | 0.243 | 0.553 | 0.471 |
| ND52 | 4.000 | 2.388 | 0.983 | 0.415 | 0.584 | 0.590 | 0.511 |
| ND139 | 2.000 | 1.860 | 0.655 | 0.534 | 0.465 | 0.486 | 0.388 |
| ND141 | 3.000 | 2.356 | 0.933 | 0.420 | 0.579 | 0.575 | 0.485 |
| ND142 | 3.000 | 2.179 | 0.923 | 0.455 | 0.544 | 0.541 | 0.483 |
| ND63 | 2.000 | 1.914 | 0.670 | 0.518 | 0.481 | 0.613 | 0.538 |
| ND247 | 2.000 | 1.715 | 0.607 | 0.580 | 0.419 | 0.417 | 0.330 |
| ND65 | 2.000 | 1.434 | 0.480 | 0.695 | 0.304 | 0.302 | 0.257 |
| ND66 | 3.000 | 2.013 | 0.862 | 0.493 | 0.506 | 0.503 | 0.446 |
| ND73 | 3.000 | 1.405 | 0.559 | 0.709 | 0.290 | 0.304 | 0.286 |
| ND75 | 2.000 | 1.424 | 0.474 | 0.700 | 0.300 | 0.314 | 0.271 |
| ND249 | 2.000 | 1.316 | 0.404 | 0.758 | 0.241 | 0.240 | 0.211 |
| ND251 | 3.000 | 1.432 | 0.561 | 0.696 | 0.303 | 0.317 | 0.291 |
| ND173 | 2.000 | 1.710 | 0.605 | 0.582 | 0.417 | 0.428 | 0.346 |
| ND262 | 2.000 | 1.868 | 0.629 | 0.559 | 0.440 | 0.450 | 0.359 |
| ND264 | 2.000 | 1.399 | 0.460 | 0.712 | 0.287 | 0.317 | 0.280 |
| ND267 | 2.000 | 1.996 | 0.692 | 0.495 | 0.504 | 0.652 | 0.578 |
| ND272 | 4.000 | 3.621 | 1.333 | 0.271 | 0.728 | 0.723 | 0.673 |
| ND274 | 2.000 | 1.996 | 0.692 | 0.497 | 0.502 | 0.602 | 0.518 |
| ND276 | 3.000 | 2.070 | 0.782 | 0.479 | 0.520 | 0.528 | 0.421 |
| ND286 | 2.000 | 1.230 | 0.335 | 0.811 | 0.188 | 0.187 | 0.169 |
| ND99 | 2.000 | 2.000 | 0.693 | 0.444 | 0.555 | 0.111 | 0.108 |
| ND285 | 4.000 | 3.048 | 1.185 | 0.324 | 0.675 | 0.671 | 0.606 |
| ND283 | 2.000 | 1.884 | 0.662 | 0.527 | 0.472 | 0.481 | 0.376 |
| ND284 | 3.000 | 1.789 | 0.784 | 0.556 | 0.443 | 0.441 | 0.399 |
| MEAN | 2.542 | 1.878 | 0.689 | 0.565 | 0.434 | 0.473 | 0.409 |
| Scheme | df | SS | MS | Est. Var. | % |
|---|---|---|---|---|---|
| Among Groups | 2 | 45.970 | 22.985 | 0.381 | 2% |
| Among Individuals | 84 | 954.191 | 11.359 | 0.000 | 0% |
| Within Individual | 87 | 1653.000 | 19.000 | 19.000 | 98% |
| Total | 173 | 2653.161 | 19.381 | 100% |
| Source | df | SS | MS | Est. Var. | % |
|---|---|---|---|---|---|
| Among Subgroups | 2 | 88.824 | 44.412 | 0.809 | 4% |
| Among Individuals | 65 | 680.176 | 10.464 | 0.000 | 0% |
| Within Individual | 68 | 1298.000 | 19.088 | 19.088 | 96% |
| Total | 135 | 2067.000 | 19.897 | 100% |
Disclaimer/Publisher’s Note: The statements, opinions and data contained in all publications are solely those of the individual author(s) and contributor(s) and not of MDPI and/or the editor(s). MDPI and/or the editor(s) disclaim responsibility for any injury to people or property resulting from any ideas, methods, instructions or products referred to in the content. |
© 2024 by the authors. Licensee MDPI, Basel, Switzerland. This article is an open access article distributed under the terms and conditions of the Creative Commons Attribution (CC BY) license (https://creativecommons.org/licenses/by/4.0/).
Share and Cite
Chen, P.; Chen, S.; Pi, Z.; Li, S.; Wu, Z. Genetic Diversity Analysis of Monogerm Cytoplasmic Male Sterile and Maintainer Lines of Sugar Beet. Agronomy 2024, 14, 2217. https://doi.org/10.3390/agronomy14102217
Chen P, Chen S, Pi Z, Li S, Wu Z. Genetic Diversity Analysis of Monogerm Cytoplasmic Male Sterile and Maintainer Lines of Sugar Beet. Agronomy. 2024; 14(10):2217. https://doi.org/10.3390/agronomy14102217
Chicago/Turabian StyleChen, Pian, Shuyuan Chen, Zhi Pi, Shengnan Li, and Zedong Wu. 2024. "Genetic Diversity Analysis of Monogerm Cytoplasmic Male Sterile and Maintainer Lines of Sugar Beet" Agronomy 14, no. 10: 2217. https://doi.org/10.3390/agronomy14102217
APA StyleChen, P., Chen, S., Pi, Z., Li, S., & Wu, Z. (2024). Genetic Diversity Analysis of Monogerm Cytoplasmic Male Sterile and Maintainer Lines of Sugar Beet. Agronomy, 14(10), 2217. https://doi.org/10.3390/agronomy14102217