Article

How Tillage System Affects the Soil Carbon Dioxide Emission and Wheat Plants Physiological State

by
Zuzanna Sawinska
1,
Dominika Radzikowska-Kujawska
1,*,
Andrzej Blecharczyk
1,
Stanisław Świtek
1,
Tomasz Piechota
1,
Adam Cieślak
2,
Laura M. Cardenas
3,
Aranzazu Louro-Lopez
3,
Andrew S. Gregory
4,
Kevin Coleman
4 and
R. Murray Lark
5
1
Department of Agronomy, Poznan University of Life Sciences, 11 Dojazd St., 60-632 Poznań, Poland
2
Department of Animal Nutrition, Poznan University of Life Sciences, 33 Wołyńska St., 60-637 Poznań, Poland
3
Rothamsted Research, North Wyke, Okehampton EX20 2SB, UK
4
Rothamsted Research, Harpenden AL5 2JQ, UK
5
Division of Agriculture and Environment, University of Nottingham, Sutton Bonington Campus, Sutton Bonington, Loughborough LE12 5RD, UK
*
Author to whom correspondence should be addressed.
Agronomy 2024, 14(10), 2220; https://doi.org/10.3390/agronomy14102220
Submission received: 26 July 2024 / Revised: 22 September 2024 / Accepted: 24 September 2024 / Published: 26 September 2024
(This article belongs to the Section Farming Sustainability)

Abstract

:
The cultivation or ‘tillage’ system is one of the most important elements of agrotechnology. It affects the condition of the soil, significantly modifying its physical, chemical, and biological properties, and the condition of plants, starting from ensuring appropriate conditions for sowing and plant growth, through influencing the efficiency of photosynthesis and ultimately, the yield. It also affects air transmission and the natural environment by influencing greenhouse gas (GHG) emissions potentially. Ultimately, the cultivation system also has an impact on the farmer, providing the opportunity to reduce production costs. The described experiment was established in 1998 at the Brody Agricultural Experimental Station belonging to the University of Life Sciences in Poznań (Poland) on a soil classified as an Albic Luvisol, while the described measurements were carried out in the 2022/2023 season, i.e., 24 years after the establishment of the experiment. Two cultivation methods were compared: Conventional Tillage (CT) and No Tillage (NT). Additionally, the influence of two factors was examined: nitrogen (N) fertilization (0 N—no fertilization, and 130 N–130 kg N∙ha−1) and the growth phase of the winter wheat plants (BBCH: 32, 65 and 75). The growth phase of the plants was assessed according to the method of the Bundesanstalt, Bundessortenamt and CHemische Industrie (BBCH). We present the results of soil properties, soil respiration, wheat plants chlorophyll fluorescence, and grain yield. In our experiment, due to low rainfall, NT cultivation turned out to be beneficial, as it was a key factor influencing the soil properties, including soil organic carbon (SOC) content and soil moisture, and, consequently, creating favorable conditions for plant nutrition and efficiency of photosynthesis. We found a positive effect of NT cultivation on chlorophyll fluorescence, but this did not translate into a greater yield in NT cultivation. However, the decrease in yield due to NT compared to CT was only 5% in fertilized plots, while the average decrease in grain yield resulting from the lack of fertilization was 46%. We demonstrated the influence of soil moisture as well as the growth phase and fertilization on carbon dioxide (CO2) emissions from the soil. We can clearly confirm that the tillage system affected all the parameters discussed in the work.

1. Introduction

In Europe, wheat cultivation has been dominated by the conventional tillage (CT) system for years, but in recent years the reduced tillage (RT) and no tillage (NT) systems have been gaining momentum in the cultivation of many crop species. This is mainly due to economic and environmental reasons, especially in the case of new varietal genotypes that are a response to climate change and environmental stresses [1].
Tillage is one of the most important elements of growing crops. Firstly, it serves to provide appropriate conditions for sowing and plant growth, and it also significantly modifies the properties of the soil [2]. Intensive tillage may lead to soil degradation, which is associated with the deterioration of all physical, chemical and biological properties [3]. The basic effect of degradation is the loss of soil organic matter (SOM), which at the same time negatively affects other physical, chemical and biological properties of the soil [4,5].
Direct degradation of agricultural land is also accompanied by human-induced soil erosion, which is the cause of further degradation and even devastation of land [6].
Anthropogenic increases in carbon dioxide (CO2) emissions have contributed significantly to drastic climate changes [7]. Agriculture is one of the main sources of anthropogenic greenhouse gas (GHG) emissions, starting from the deforestation of land for agriculture [8].
Anthropogenic climate warming leads to increasing extreme weather phenomena, with extreme heat occurring for increasingly longer periods being particularly frequent [9,10]. In many regions of the world, the increase in temperature is accompanied by an increase in water shortages for crops, as a result of increased evaporation, even if there is no reduction in the precipitation [11,12]. In Poland, in the last 10 years, only one year was classified as average. The remaining years were warmer, including five years that were classified as abnormally or extremely warm [10]. Agricultural drought is becoming an increasing problem in Poland, as in many other regions of Europe and the world.
The magnitude of depletion is great in cropland soils prone to erosion and inappropriate farming practices. Thus, degraded soil has a large soil organic carbon (SOC) sink capacity. It is well documented that soils are the largest terrestrial storehouse of C [13,14].
Soil microorganisms play a key role in the C cycle in the soil [15]. The basic source of SOC is plant biomass, generated as a result of photosynthesis and then subjected to microbiological humification and mineralization, leading to losses of SOC and CO2 emissions [16,17]. Soil temperature and soil water content are considered the main factors that drive soil respiration via their direct effects on soil microbes and plant roots [18].
Agricultural practices, including N fertilization and tillage, have a significant impact on the process of humification and mineralization, and hence changes in SOC content [16]. NT modifies soil temperature and moisture, which indirectly affects microbial activity and soil respiration [19]. Also, N fertilization indirectly affects microbiological activity and soil respiration by influencing plant development. Crops modify soil temperature and moisture and change the amount of plant biomass supplied to the soil [20].
Soil temperature and moisture as well as N availability not only affect the microbial activity of the soil but also the health and development of crop plants. Plant reactions to stress, including water and nutrient deficiencies, are manifested by changes in physiological processes, including fluorescence, which can be used to assess the current state of vegetation.
The direct impact of tillage on soil properties is superimposed on their long-term changes. In the first years after switching to RT or NT, negative phenomena may predominate, such as an increase in soil compaction, limited plant development and reduced yields; the adaptation of other elements of agrotechnics to new conditions in the field also plays an important role [21,22,23]. Long-term use of NT can restructure the soil and improve its parameters, especially the SOM content, which is crucial for other soil properties [24]. For this reason, long-term static experiments are a valuable source of knowledge about the impact of NT on the soil environment [25,26].
The aim of the study was to assess the impact of long-term (24 years) no tillage on CO2 emissions and soil respiration in the context of the global need to reduce greenhouse gas emissions (GHG) by adapting agricultural practices in the era of climate change.
In addition, the aim of the study was to assess the impact of long-term no tillage on the physiological state as well as the efficiency of photosynthesis and the grain yield.
Although there are many reports in the literature on several-year reduced tillage, long-term experience is still lacking.
It was assumed that long-term use of no tillage significantly modifies the physical properties of the soil, such as moisture and temperature, which consequently affects soil respiration. It was also assumed that favorable changes in soil properties provide better conditions for plant growth and development, which in turn reduces the effects of the negative impact of abiotic and biotic stresses resulting from climate variability and ensures better physiological condition of plants and higher photosynthesis efficiency.

2. Materials and Methods

2.1. Growth Conditions

The experiment has been conducted since 1998, at the static long-term field experiment at the Agricultural Experimental Station Brody (52.43, 16.30) belonging to Poznań University of Life Sciences [27,28]. The measurements reported here were carried out in the 2022/2023 growing season. Two tillage methods: CT and NT cultivation were compared. CT applied annually: skimming + harrowing, plowing to a depth of 25 cm, cultivator unit (cultivator with a string roller). The crop rotation was: winter triticale (× Triticosecale Wittmack) spring barley (Hordeum vulgare L.), winter wheat (Triticum aestivum L.), common pea (Pisum sativum L.), with the measurements performed on the winter wheat crop (variety ‘Opal’).
The experiment was established in a soil classified as an Albic Luvisol [29] of texture loamy sands overlying loamy material (12% clay, 19% silt, and 69% sand). The experiment was set up in two blocks: CT and NT, consisting of four replicates within which plots were divided into two parts, one of which received N in a single dose of 130 kg N∙ha−1 at the beginning of vegetation (March), while the other part did not receive N. The area of each plot was 55 m2.
The fungicidal, herbicidal, and insecticidal protection of plantations was conducted according to common recommendations on the Polish Institute of Plant Protection in Poznań [30].
Meteorological data: min air temperature (°C), max air temperature (°C), rainfall (mm), air relative humidity (%) were determined using a meteorological station belonging to Agricultural Experimental Station Brody (52.43, 16.30). The whole of Poland has a temperate climate, transitional between maritime and continental. Wheat growing conditions in spring 2023 were initially favorable. Precipitation in April exceeded the long-term average by 17.7 mm. Also, in the first 10 days of May, there was significant rainfall (18.3 mm) four days before the first measurements, which had a positive effect on the water supply in the soil. Then there was a period of rainfall deficiency, lasting until the end of the growing season. Precipitation for May, June and July was 15.1, 28.2 and 24.9 mm lower than the average, respectively. Water shortages in the soil were aggravated by high air temperatures, which were above average by 1.8 °C in June and 1.3 °C in July (Figure 1).
Measurements were carried out in three different growth stages of wheat: BBCH 32 (shooting), BBCH 65 (flowering) and BBCH 75 (medium milk stage). All measurements were performed on the same day, in the same order, in the same number of replicates, analogously in three subsequent development phases. The experimental design is shown in Table 1.

2.2. Soil Conditions

2.2.1. Soil Properties

Soil sampling and analysis were carried out immediately after harvesting the forecrop (common pea) but before cultivation treatments. Soil samples were collected from the 0–20 cm depth at three locations in each plot using Edelman auger (4 cm in diameter) (Royal Eijkelkamp, Giesbeek, The Netherlands). Soil analysis in the experiment included: the content of P2O5, K2O, and Mg, and was determined by the spectrophotometric method according to PN-R-04023:1996 (P2O5); FEAS PB-1 = 20.02.2013 (K2O) [31]; FAAS PN-R-04020:1994 + Az1:2004 (Mg) [32]; potentiometric method PN-EN ISO 10390:2022-09 (pH) [28]. SOC was determined by the Tiurin method, involving wet oxidation of organic matter [33].

2.2.2. Soil Moisture and Temperature

During each measurement of soil respiration, soil moisture (%) and temperature (°C) were measured at three locations next to the measurement chamber at the 10 cm depth using a Delta-T WET sensor (Delta-T Devices Ltd., Burwell, UK).

2.2.3. Soil Respiration

Soil respiration measurements were assessed based on NCER-Netto CO2 Exchange Rate- CO2 flux (µmol m−2 s−1), Water flux- Netto H2O Exchange Rate (m mol m−2 s−1) and Ce- Soil Respiration (µmol s−1) using the LCpro-SD (ADC BioScientific Ltd., Hoddesdon, UK) device.
The device has a metal cylinder that is placed in the soil, and after 30 min a one-liter acrylic chamber is placed on it to enclose air and measure gas exchange between the soil and the atmosphere. The chamber has a built-in fan for mixing the air and a bleed-off valve preventing the formation of an excessive pressure gradient inside the chamber. The concentration of CO2 supplied to the measuring soil chamber (reference CO2) was set to ambient and kept at average 400 +/− 10 vpm. The air flow to the measuring chamber (u) was maintained at 200 μmol/s. The concentration of H2O (reference H2O) was set to ambient (the actual concentration in the environment). One half-hour measurement was performed in each plot, 4 replicates for Conventional Tillage and 4 for No Tillage during every development phase.
The following parameters were analyzed [34].
Soil Respiration (Net Molar Flow of CO2 in/out of the Soil)
Symbol: Ce (µmol s−1),
C e = u   ( C )
where
  • u = molar air flow in mol s−1
  • ∆C—difference in CO2 concentration through soil pot, dilution corrected, µmol mol−1.
Netto CO2 Exchange Rate (Ce per unit area)
Symbol: NCER (µmol m−2 s−1)
N C E R = u s   ( C )
where
  • us = molar flow of air per square meter of soil, mol m−2 s−1.
  • ∆C—difference in CO2 concentration through soil pot, dilution corrected, µmol mol−1.
Net H2O Exchange Rate (Soil Flux)
Symbol: Wflux (m mol m−2 s−1)
W f l u x = e   u s p
where
  • us—molar flow of air per square meter of soil, mol m−2 s−1
  • ∆e—differential water vapor concentration, mbar, dilution corrected
  • p—atmospheric pressure, mBar

2.3. Plant Conditions

2.3.1. Chlorophyll Fluorescence

Chlorophyll fluorescence of wheat plants was measured using a Fluorometer OS5p (Optisciences Inc., Hudson, NH, USA) based on the parameters: minimum fluorescence (F0), variable fluorescence (Fv), maximum fluorescence (Fm), and maximum photochemical efficiency of PSII (Fv/m). The Fv/m protocol was selected and measurements were made on plants after 20 min dark adaptation. Fluorescence measurements were performed each time in the same order of measurements, on the youngest, fully developed leaf (shooting phase) and on the flag leaf (flowering and medium milk phase). In total, 10 measurements were carried out in each plot in each development phase. The device settings were selected in accordance with the manufacturer’s instructions so that the Ft index was in the range of 150–250 units during the measurement [35]. The Modulation Source was set to red with an intensity of 5, with Det Gain on 4. The Saturation Flash was set to an intensity of 29 in the range of 1 to 32, with 32 being 8550 μmols.

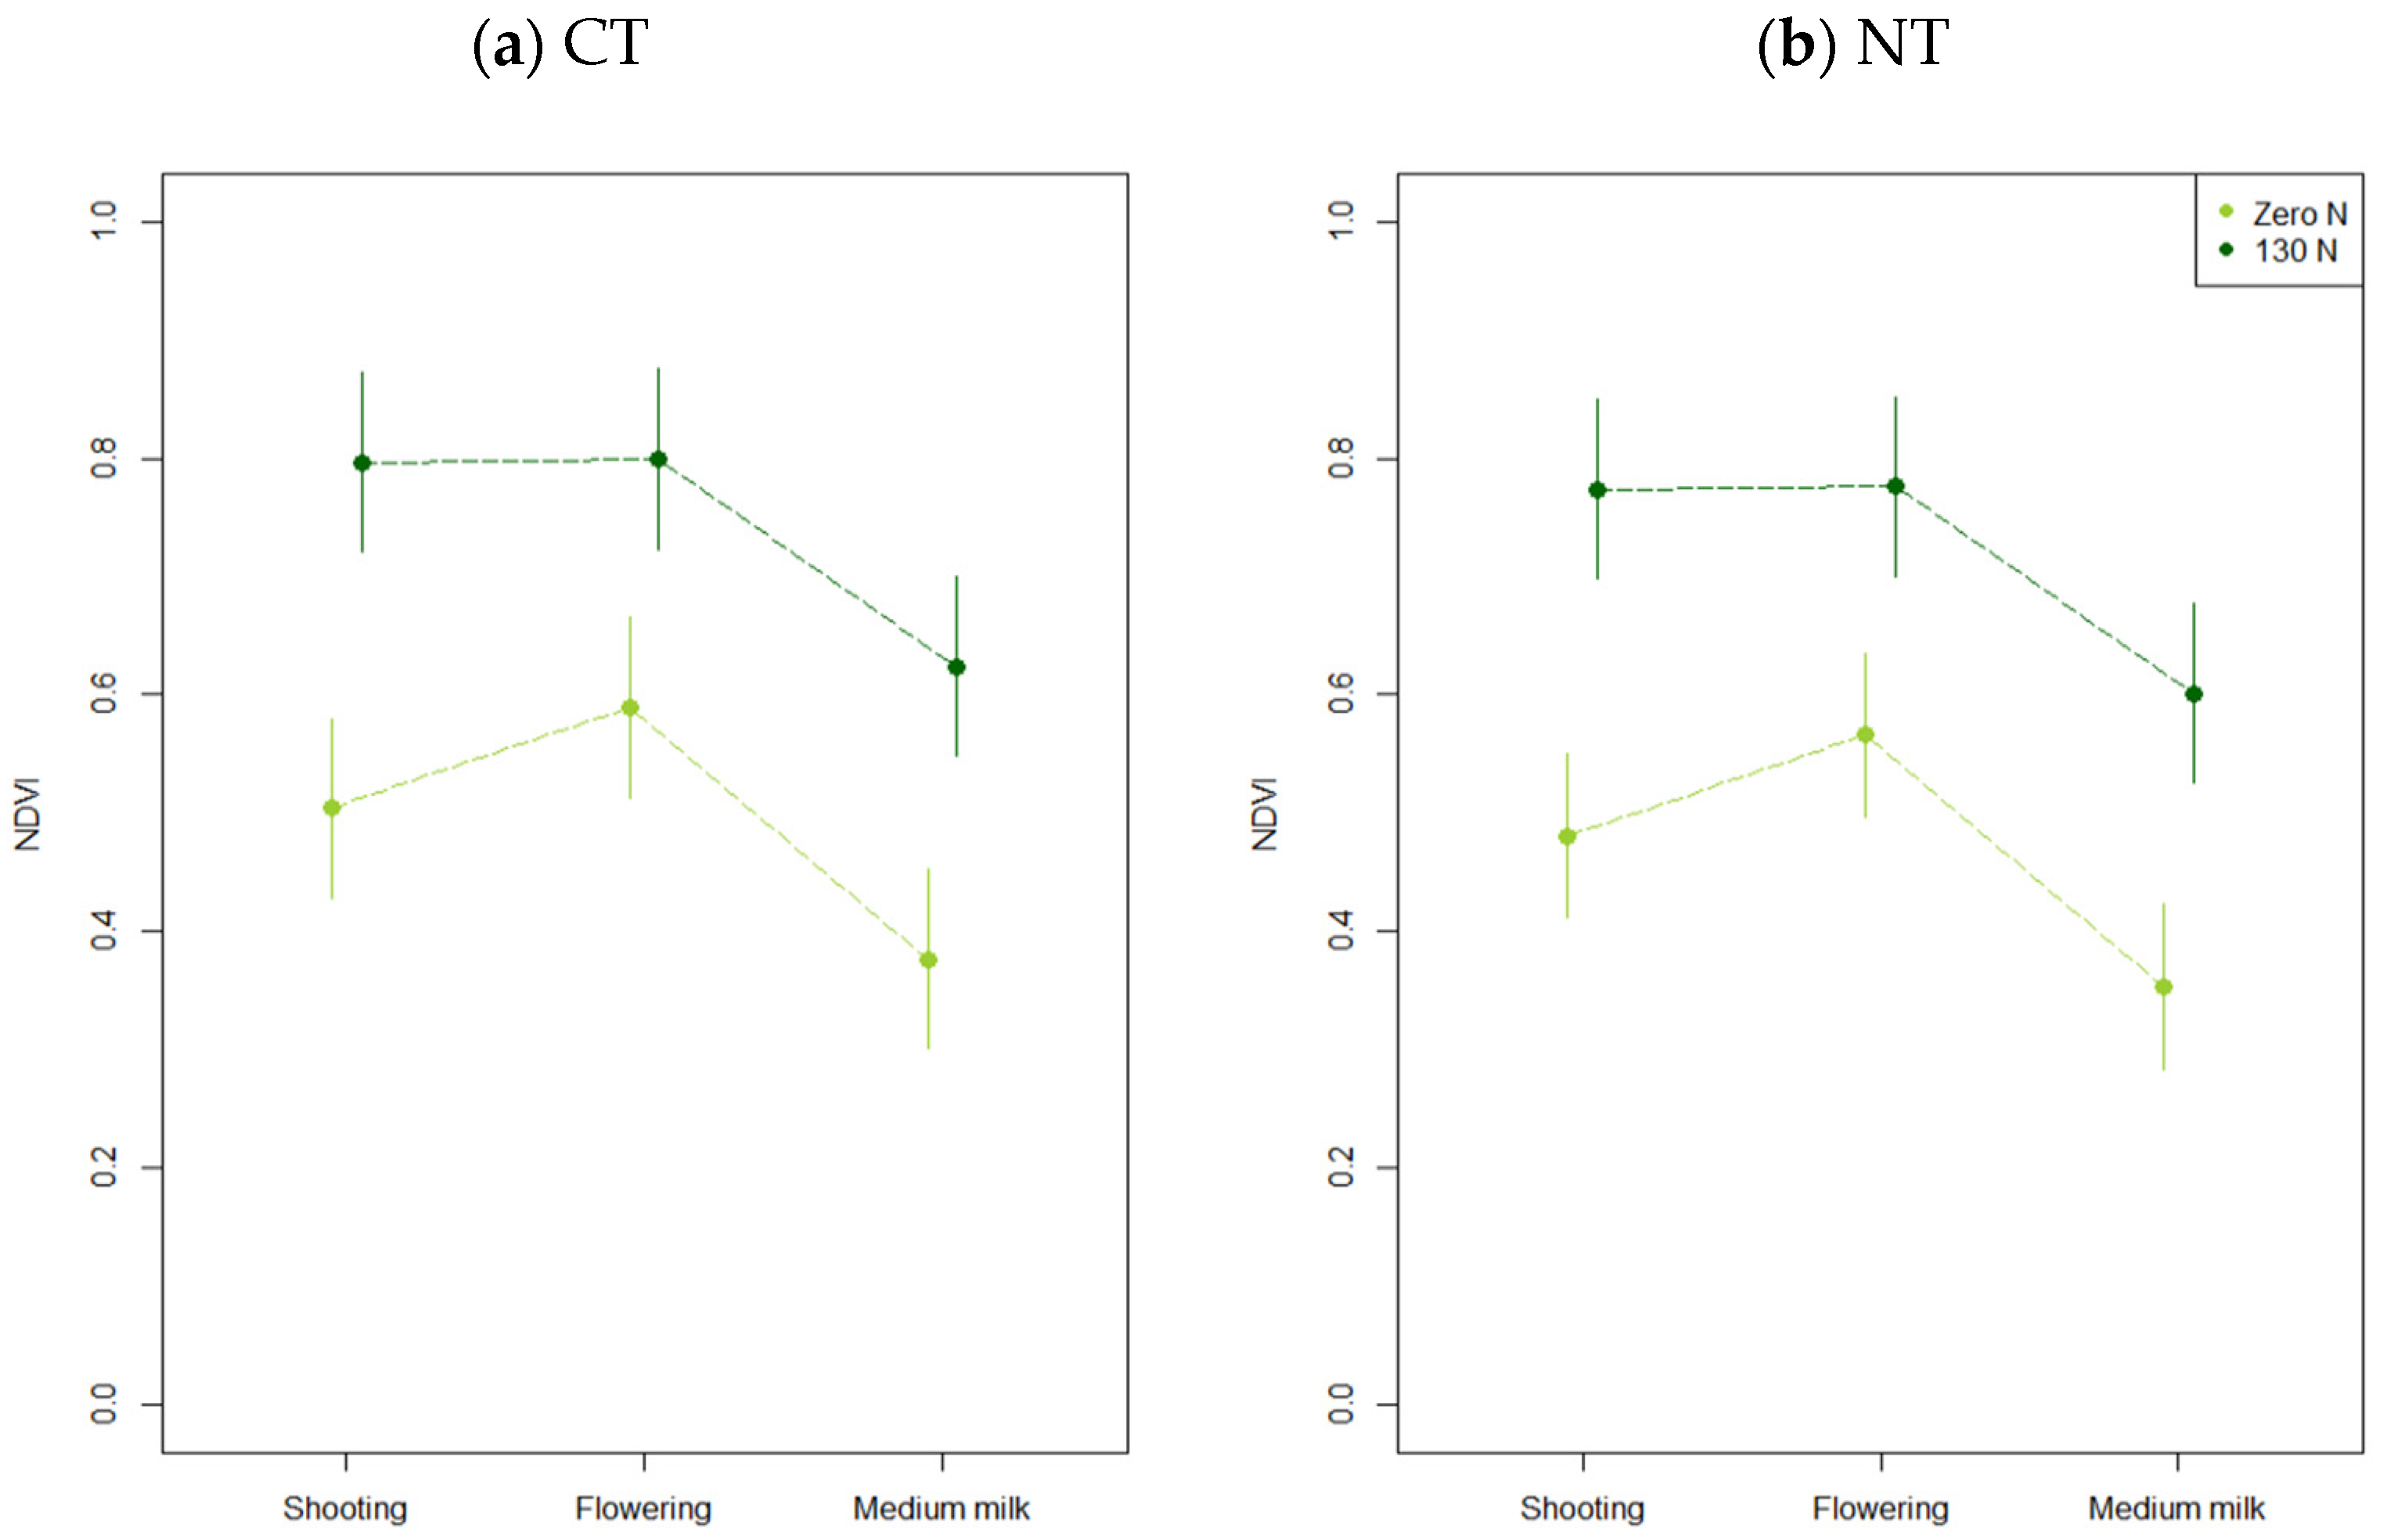
2.3.2. Normalized Difference Vegetation Index-NDVI

NDVI was measured using the GreenSeeker Handheld Crop Sensor, Trimble. The measurement was carried out similarly to the other measurements, on the same day, in the same order, in each plot.

2.4. Statistical Analysis

Basic summary statistics were computed for the residuals, along with a histogram and plot of the quartiles against the corresponding values for a standard normal distribution. This was done to check the assumption that the residuals can be treated as a normal random variable. In addition, a plot of the residuals against the fitted values was examined to check for homogeneity in the variance. The analysis of variance (AnOVa) table for the model was then examined. The AnOVa for yield was straightforward, based on the plot yields and with N fertilization the factor of interest. The corresponding linear model was fitted using the lm function for the R platform [36]. Because the tillage factor was not replicated between the main plots to which it was applied, it was treated as a blocking factor. As a result, the p-values should not be interpreted as they were not based on comparing the mean square to that of an appropriate residual.
For other variables, repeated measurements were made on the plots at three growth stages. A linear mixed model (LMM) was used to analyze these data, with a within-plot residual and between-plot random effect. The fit of a simple model with uniform correlation among the within-plot random effects was compared with a fit in which the correlation decays exponentially with the difference in time between the observations. The fit was compared using Akaike’s information criterion (AIC), and the model for which this was smallest was chosen. In all cases the simpler model was favored. The LMM was fitted using residual maximum likelihood (REML) with the lme function for the nlme library for R [37]. The fixed effects were N fertilizer treatment and growth stage as main effects, and their interaction. Treatment means for the full model were estimated with the emmeans function for the R platform [38], and 95% confidence intervals obtained for plotting.
The selected model was then refitted with maximum likelihood to generate a “null model”, and a second model was fitted with the same structure but soil water content at the time of measurement as an additional covariate. The second model was also fitted by maximum likelihood. The strength of evidence for an effect of soil water was tested by comparing the models on the natural logarithm of the ratio of their likelihoods, which would be distributed as chi-square with one degree of freedom under the null hypothesis that there is no additional information about the dependent variable in the water content measurements. On this basis, the soil water effect was either retained or dropped and the selected model augmented by adding soil temperature at the time of measurement. As before, the evidence for an effect of soil temperature was assessed by the log-likelihood ratio test.

3. Results

3.1. Soil

3.1.1. Chemical Properties of the Soil

Long-term application of NT resulted in differences in soil chemical properties in the 0–20 cm surface layer. The NT system resulted in greater content of available forms of K and Mg. The amount of SOC was also greater in the NT system (Table 2).

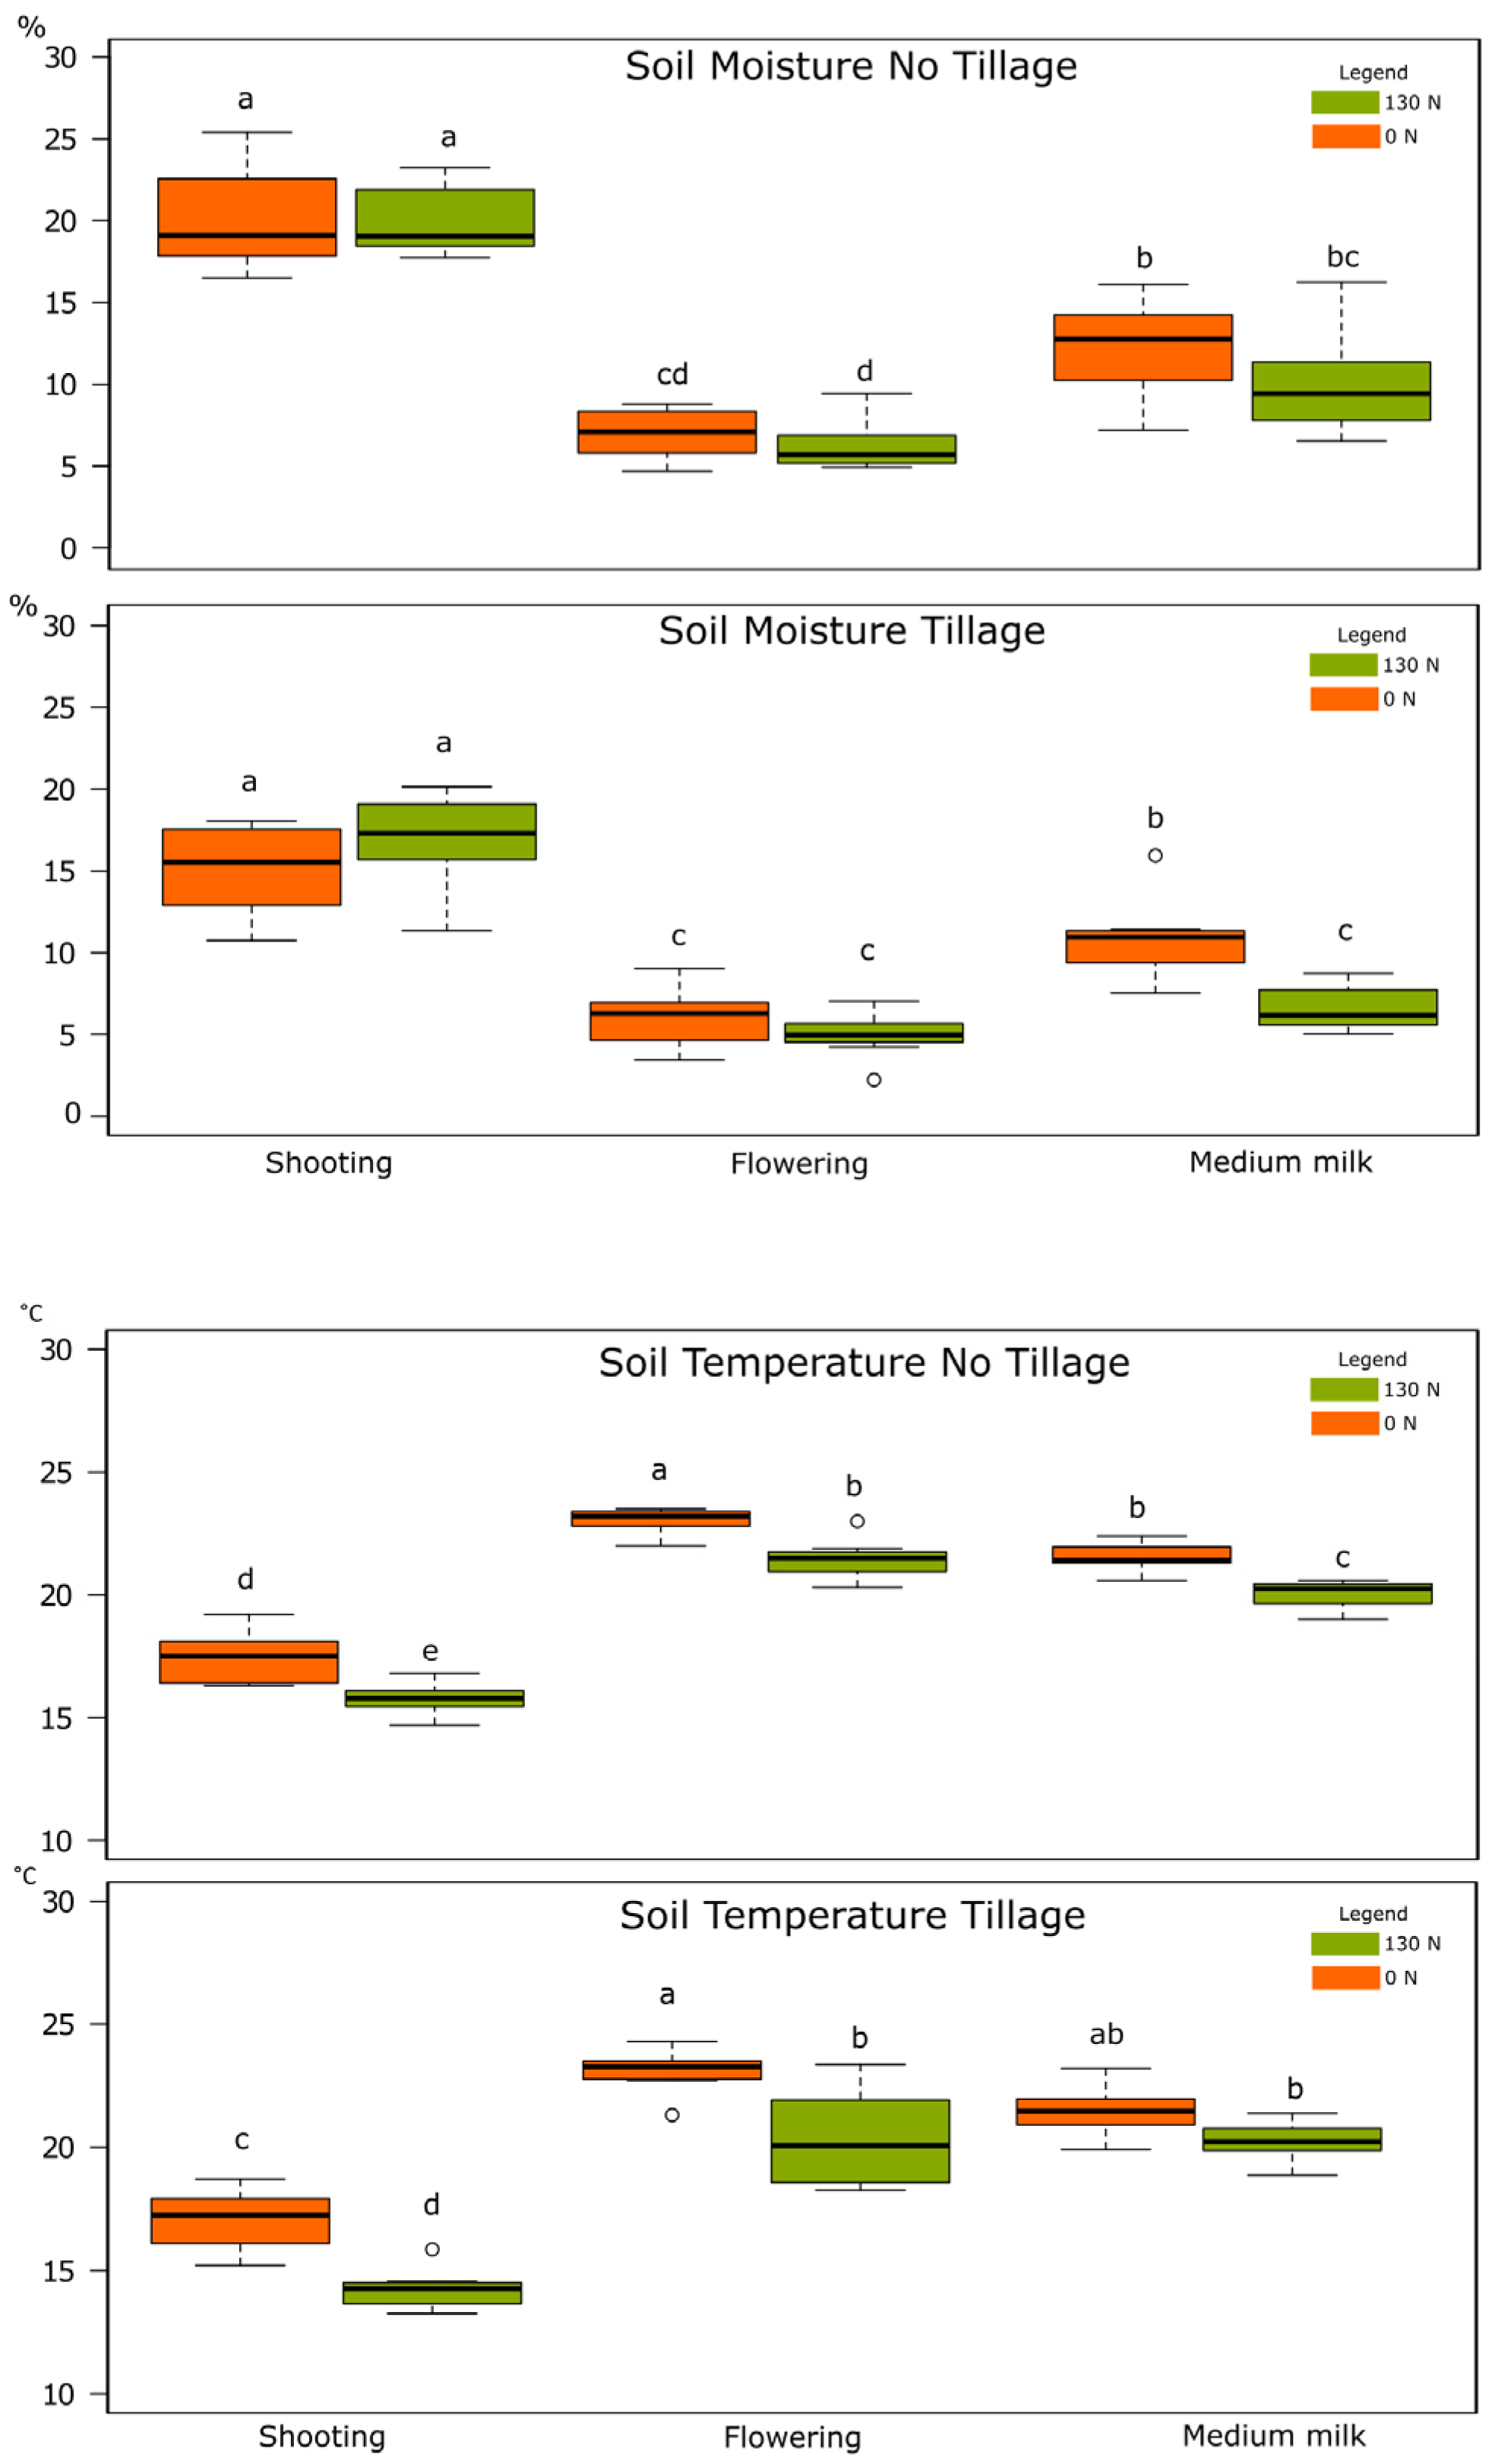
3.1.2. Soil Moisture and Temperature

In all three dates (growth stages) of measurements, greater average soil moisture was found in the NT than in the CT system. Additionally, during measurements in the flowering and medium milk stages (BBCH 65 and 75), there was a tendency to higher soil moisture in plots without nitrogen application. The tillage system did not affect the soil average temperature; however, it was noted that a greater average temperature characterized the soil not fertilized with N in all three dates of measurements (Figure 2). There was evidence for an effect of soil moisture on ∆C and CO2 flux parameters, but not temperature. This showed that the effect of soil water is positive for those two soil respiration parameters. There is also evidence for an effect of soil moisture on chlorophyll fluorescence, but only on F0 parameter. The effect of soil temperature was positive for two chlorophyll fluorescence parameters: Fm and Fv (Table 3).

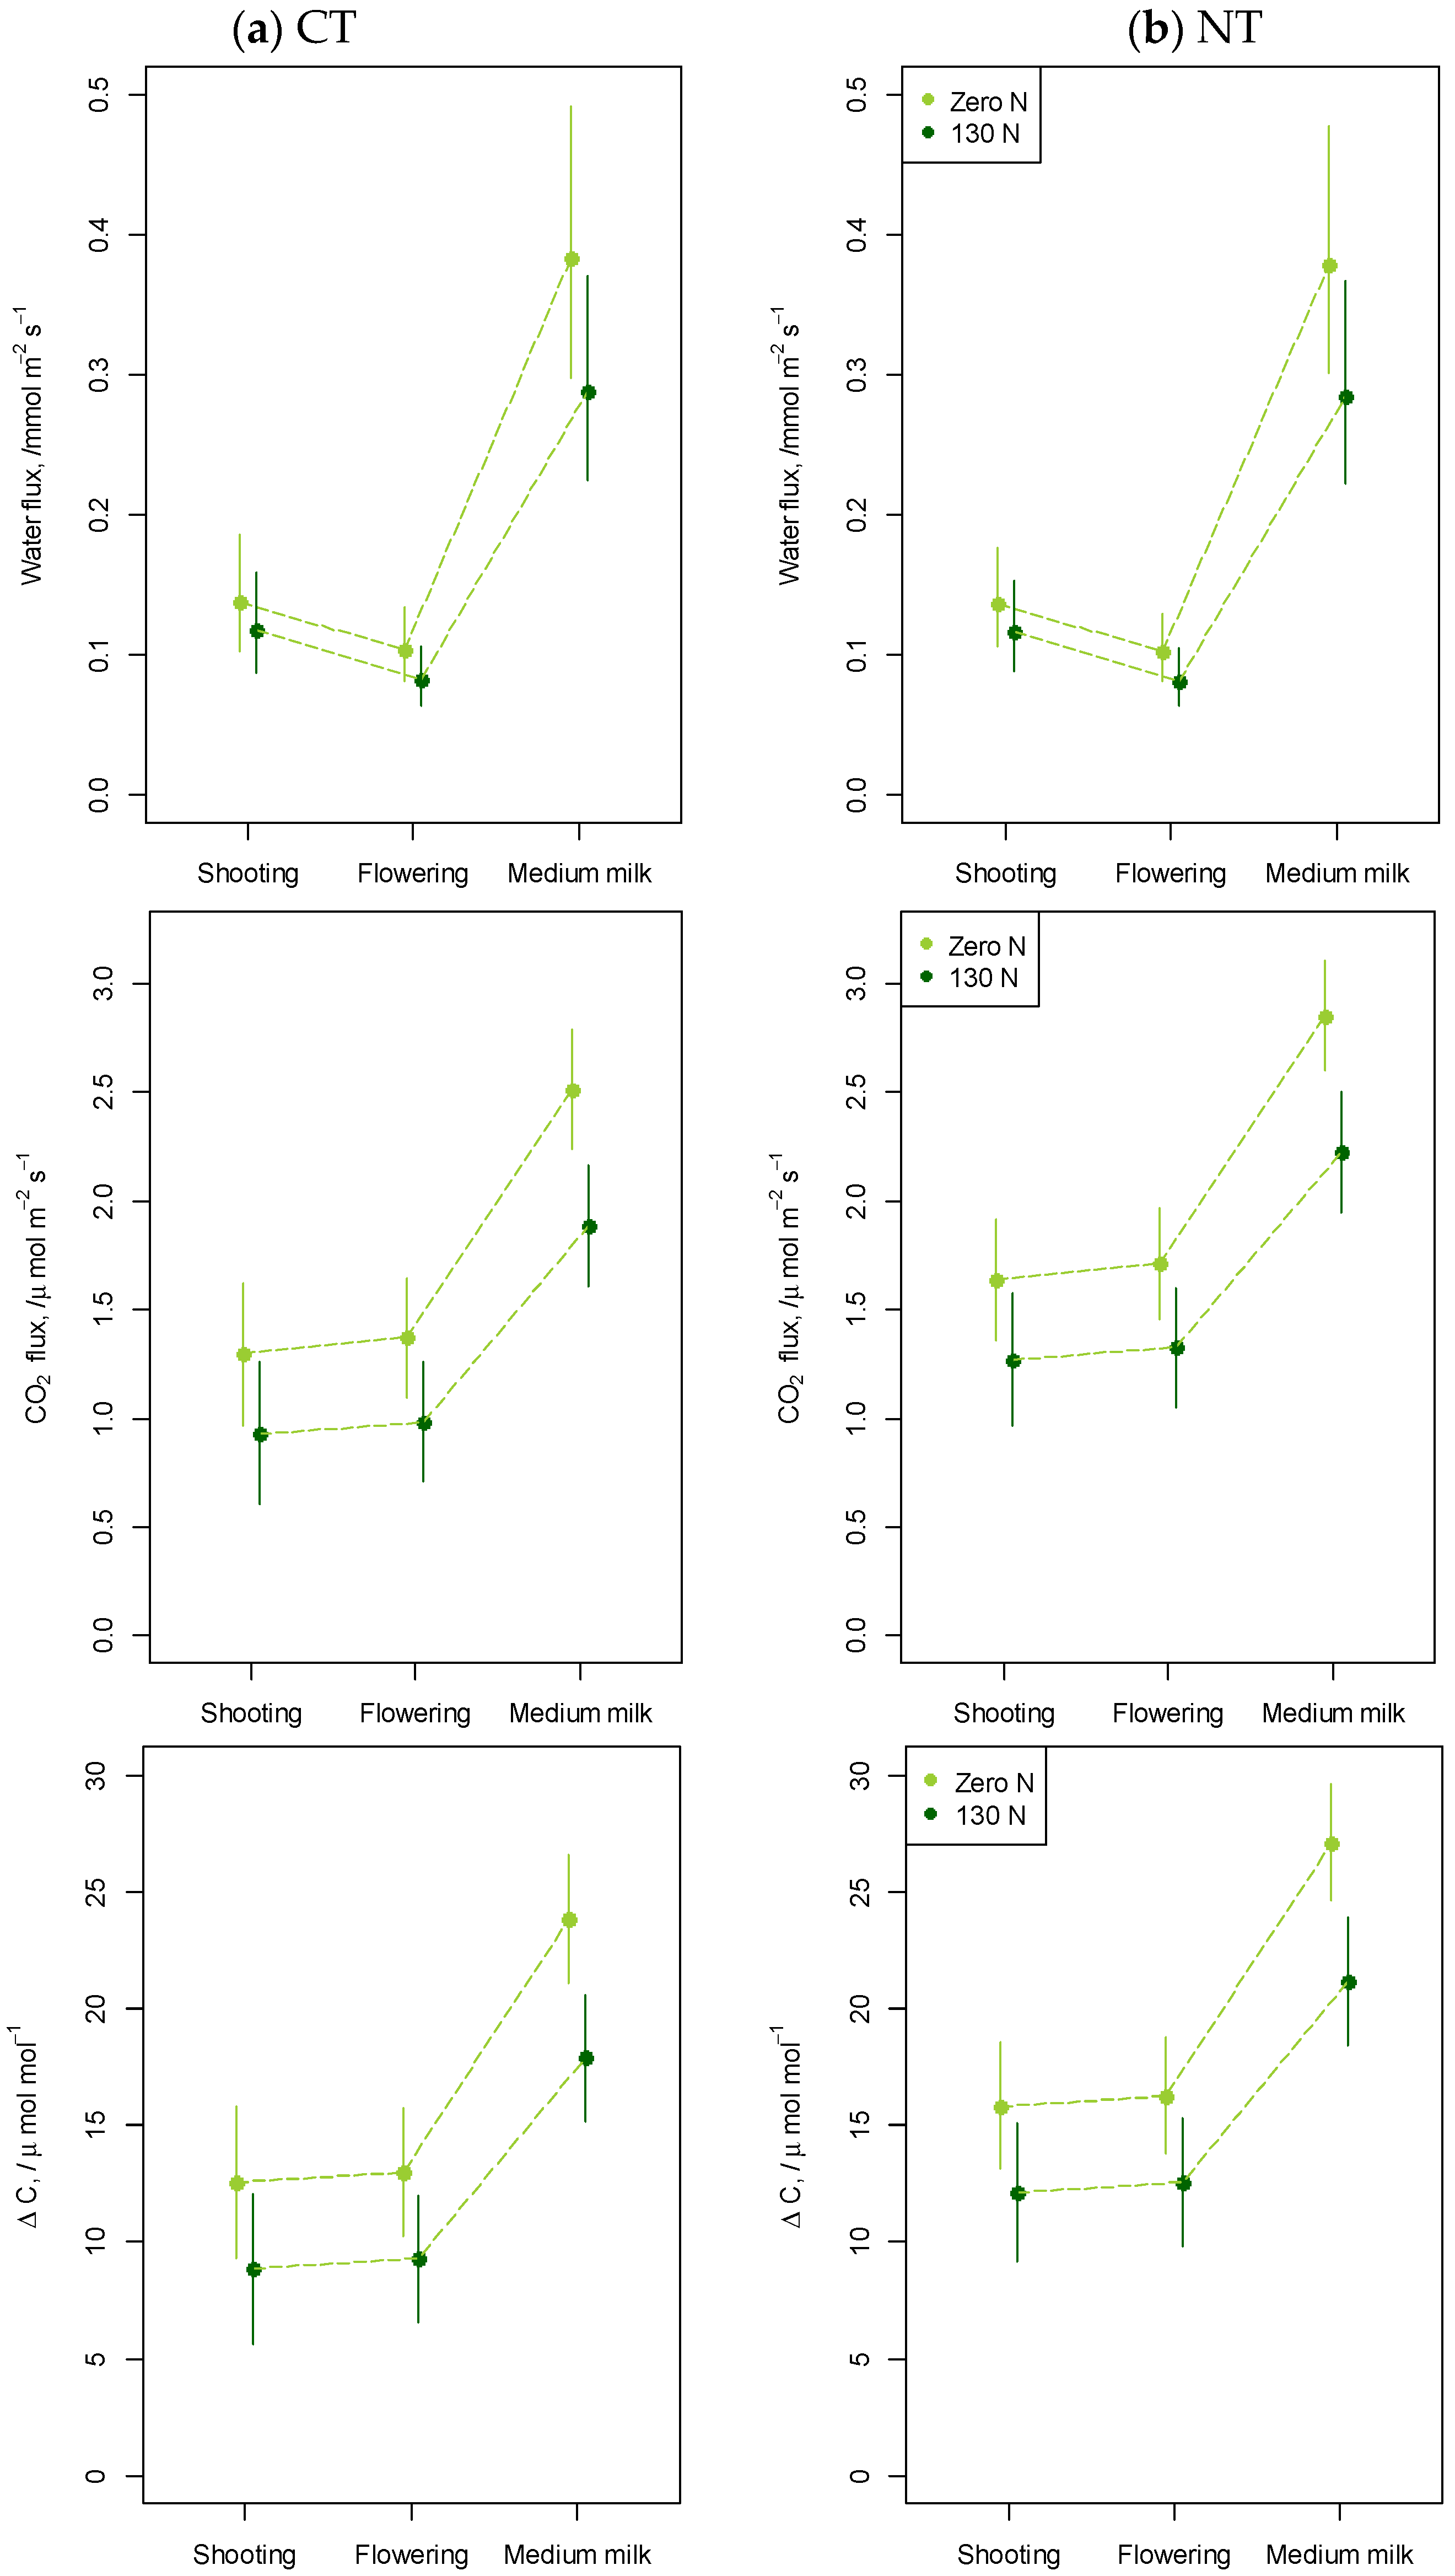
3.1.3. Soil Respiration

N fertilization had a significant impact (p = 0.03) on the water flux level. Regardless of the plant growth phase and tillage system, the W flux was always greater in unfertilized objects. The greatest reading was obtained in the medium milk phase of the wheat plants in unfertilized treatments and this result was obtained in both the CT and NT systems. No differences were noted between the CT and NT blocks, which may suggest that tillage had no impact on the water flux parameter.
There is evidence that N fertilization had an impact on CO2 flux (p = 0.002). The CO2 flux parameter values were also influenced (p = 0.001) by the growth phase. However, there was no interaction between fertilization and the growth phase (p = 0.395). Measurements in subsequent growth phases resulted in an increase in the CO2 flux parameter. The greatest reading was recorded in the NT 0 N, in the milk stage, and the lowest one was noted on a CT plot 130 N in the shooting stage. Regardless of the growth phase and tillage system, readings on unfertilized crops were always greater than on fertilized ones.
Results of ΔC were similar to CO2 and water flux. Objects not fertilized showed greater ΔC level compared to those fertilized (p = 0.003). The growth phase of the plants had a significant impact (p = 0.001) on ΔC, but no correlation was found between fertilization and the growth stage.
The ∆C parameter in both the CT and NT blocks showed an increase with the time of subsequent growth phases. The lack of fertilization contributed to a significant increase in ∆C. The greatest value of the ∆C parameter was obtained for the NT 0 N in the medium milk phase, and the lowest for CT 130 N in the shooting phase (Figure 3).
There is evidence for an effect of soil moisture on CO2 flux and ∆C. However, the influence of soil moisture on Water flux and the influence of soil temperature on all three soil respiration parameters has not been proven (Table 3).

3.2. Plants

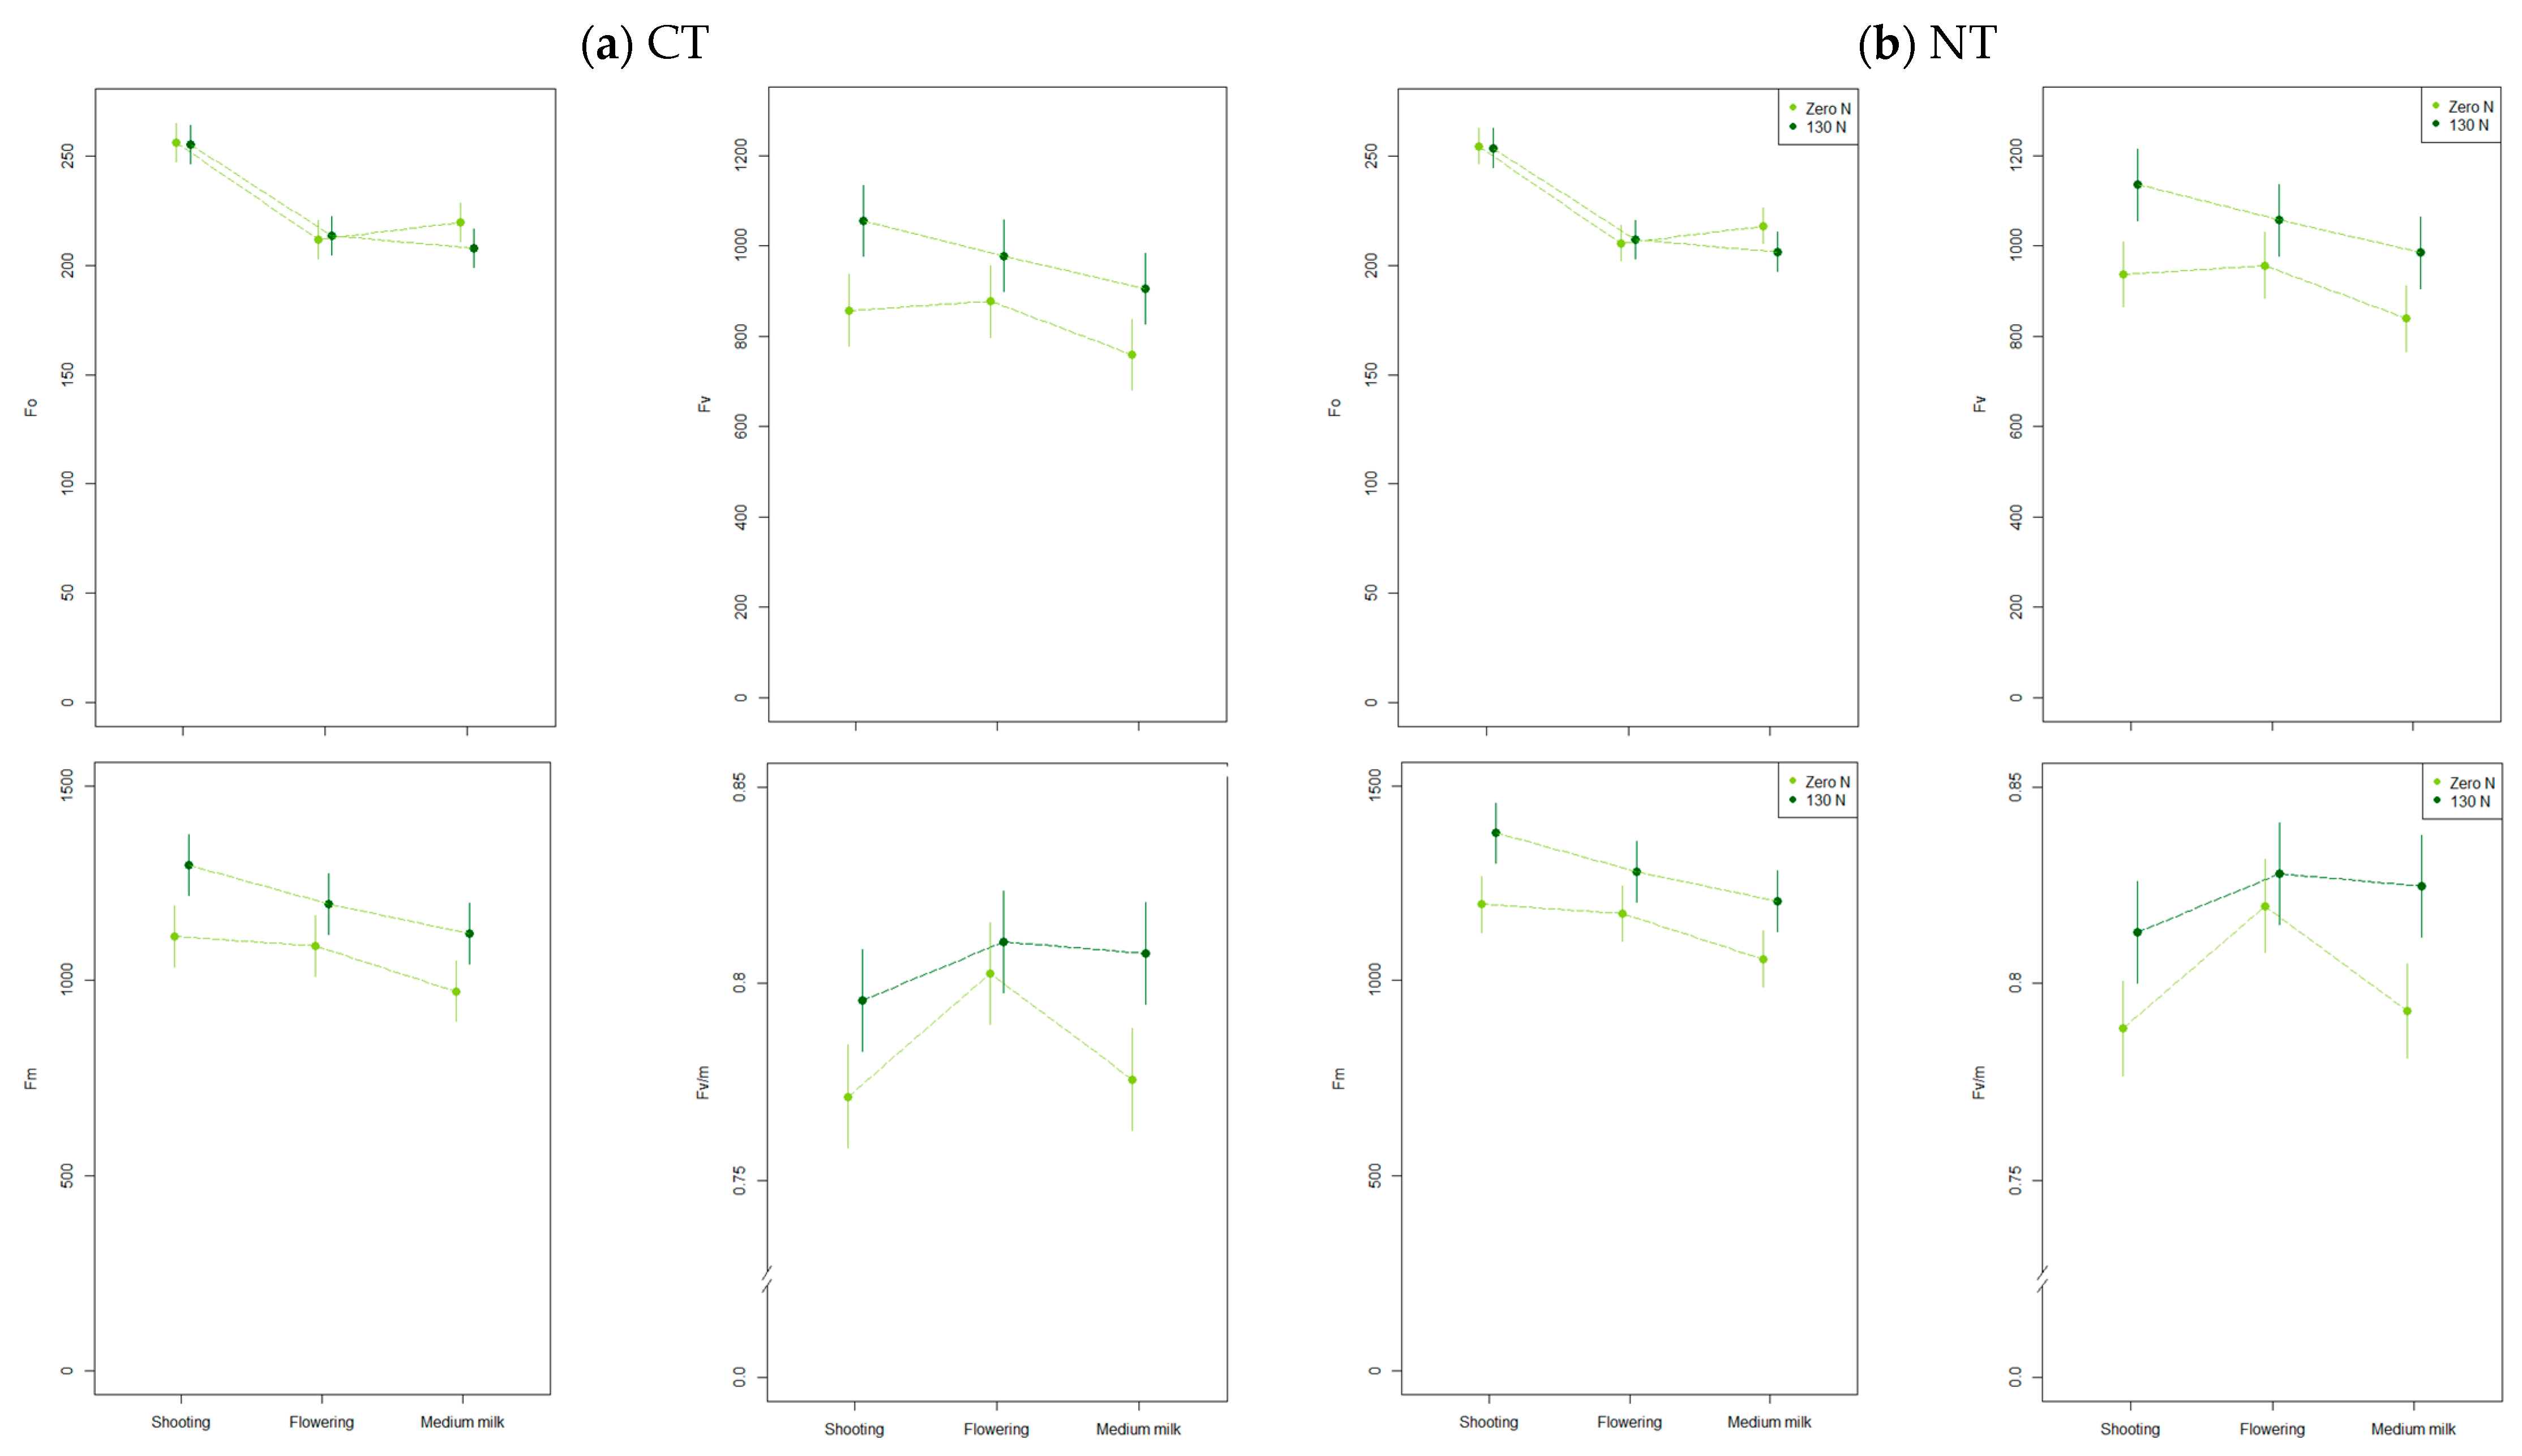
3.2.1. Chlorophyll Fluorescence

Chlorophyll fluorescence measurements were made to determine and compare the efficiency of the photosynthetic apparatus as a determinant of photosynthetic activity. The influence of both factors—N fertilization and growth stage—on chlorophyll fluorescence measurements was demonstrated. N fertilization influenced the selected chlorophyll fluorescence parameters. A significant increase in the values was observed for Fv (p = 0.002), Fm (p = 0.001) and Fv/m (p = 0.006) under N application. Fertilization did not significantly affect the value of the F0 (p = 0.220). The levels of all four fluorescence parameters were significantly different in each individual plant growth stage. The F0 parameter was the greatest in the shooting phase, regardless of whether on the CT or NT block. It was also found that the F0 parameter depends on soil moisture (p = 0.02). Also, Fm and Fv parameters had the greatest levels in the shooting phase. For these two parameters there was some positive coefficient of soil temperature effect on them, respectively (p = 0.06 and p = 0.07). In the case of the Fv/m parameter, an interaction of two factors was demonstrated: fertilization and growth stage (p = 0.02). This type of interaction was not present for the remaining three parameters (F0, Fm, and Fv) (Figure 4).

3.2.2. Normalized Difference Vegetation Index-NDVI
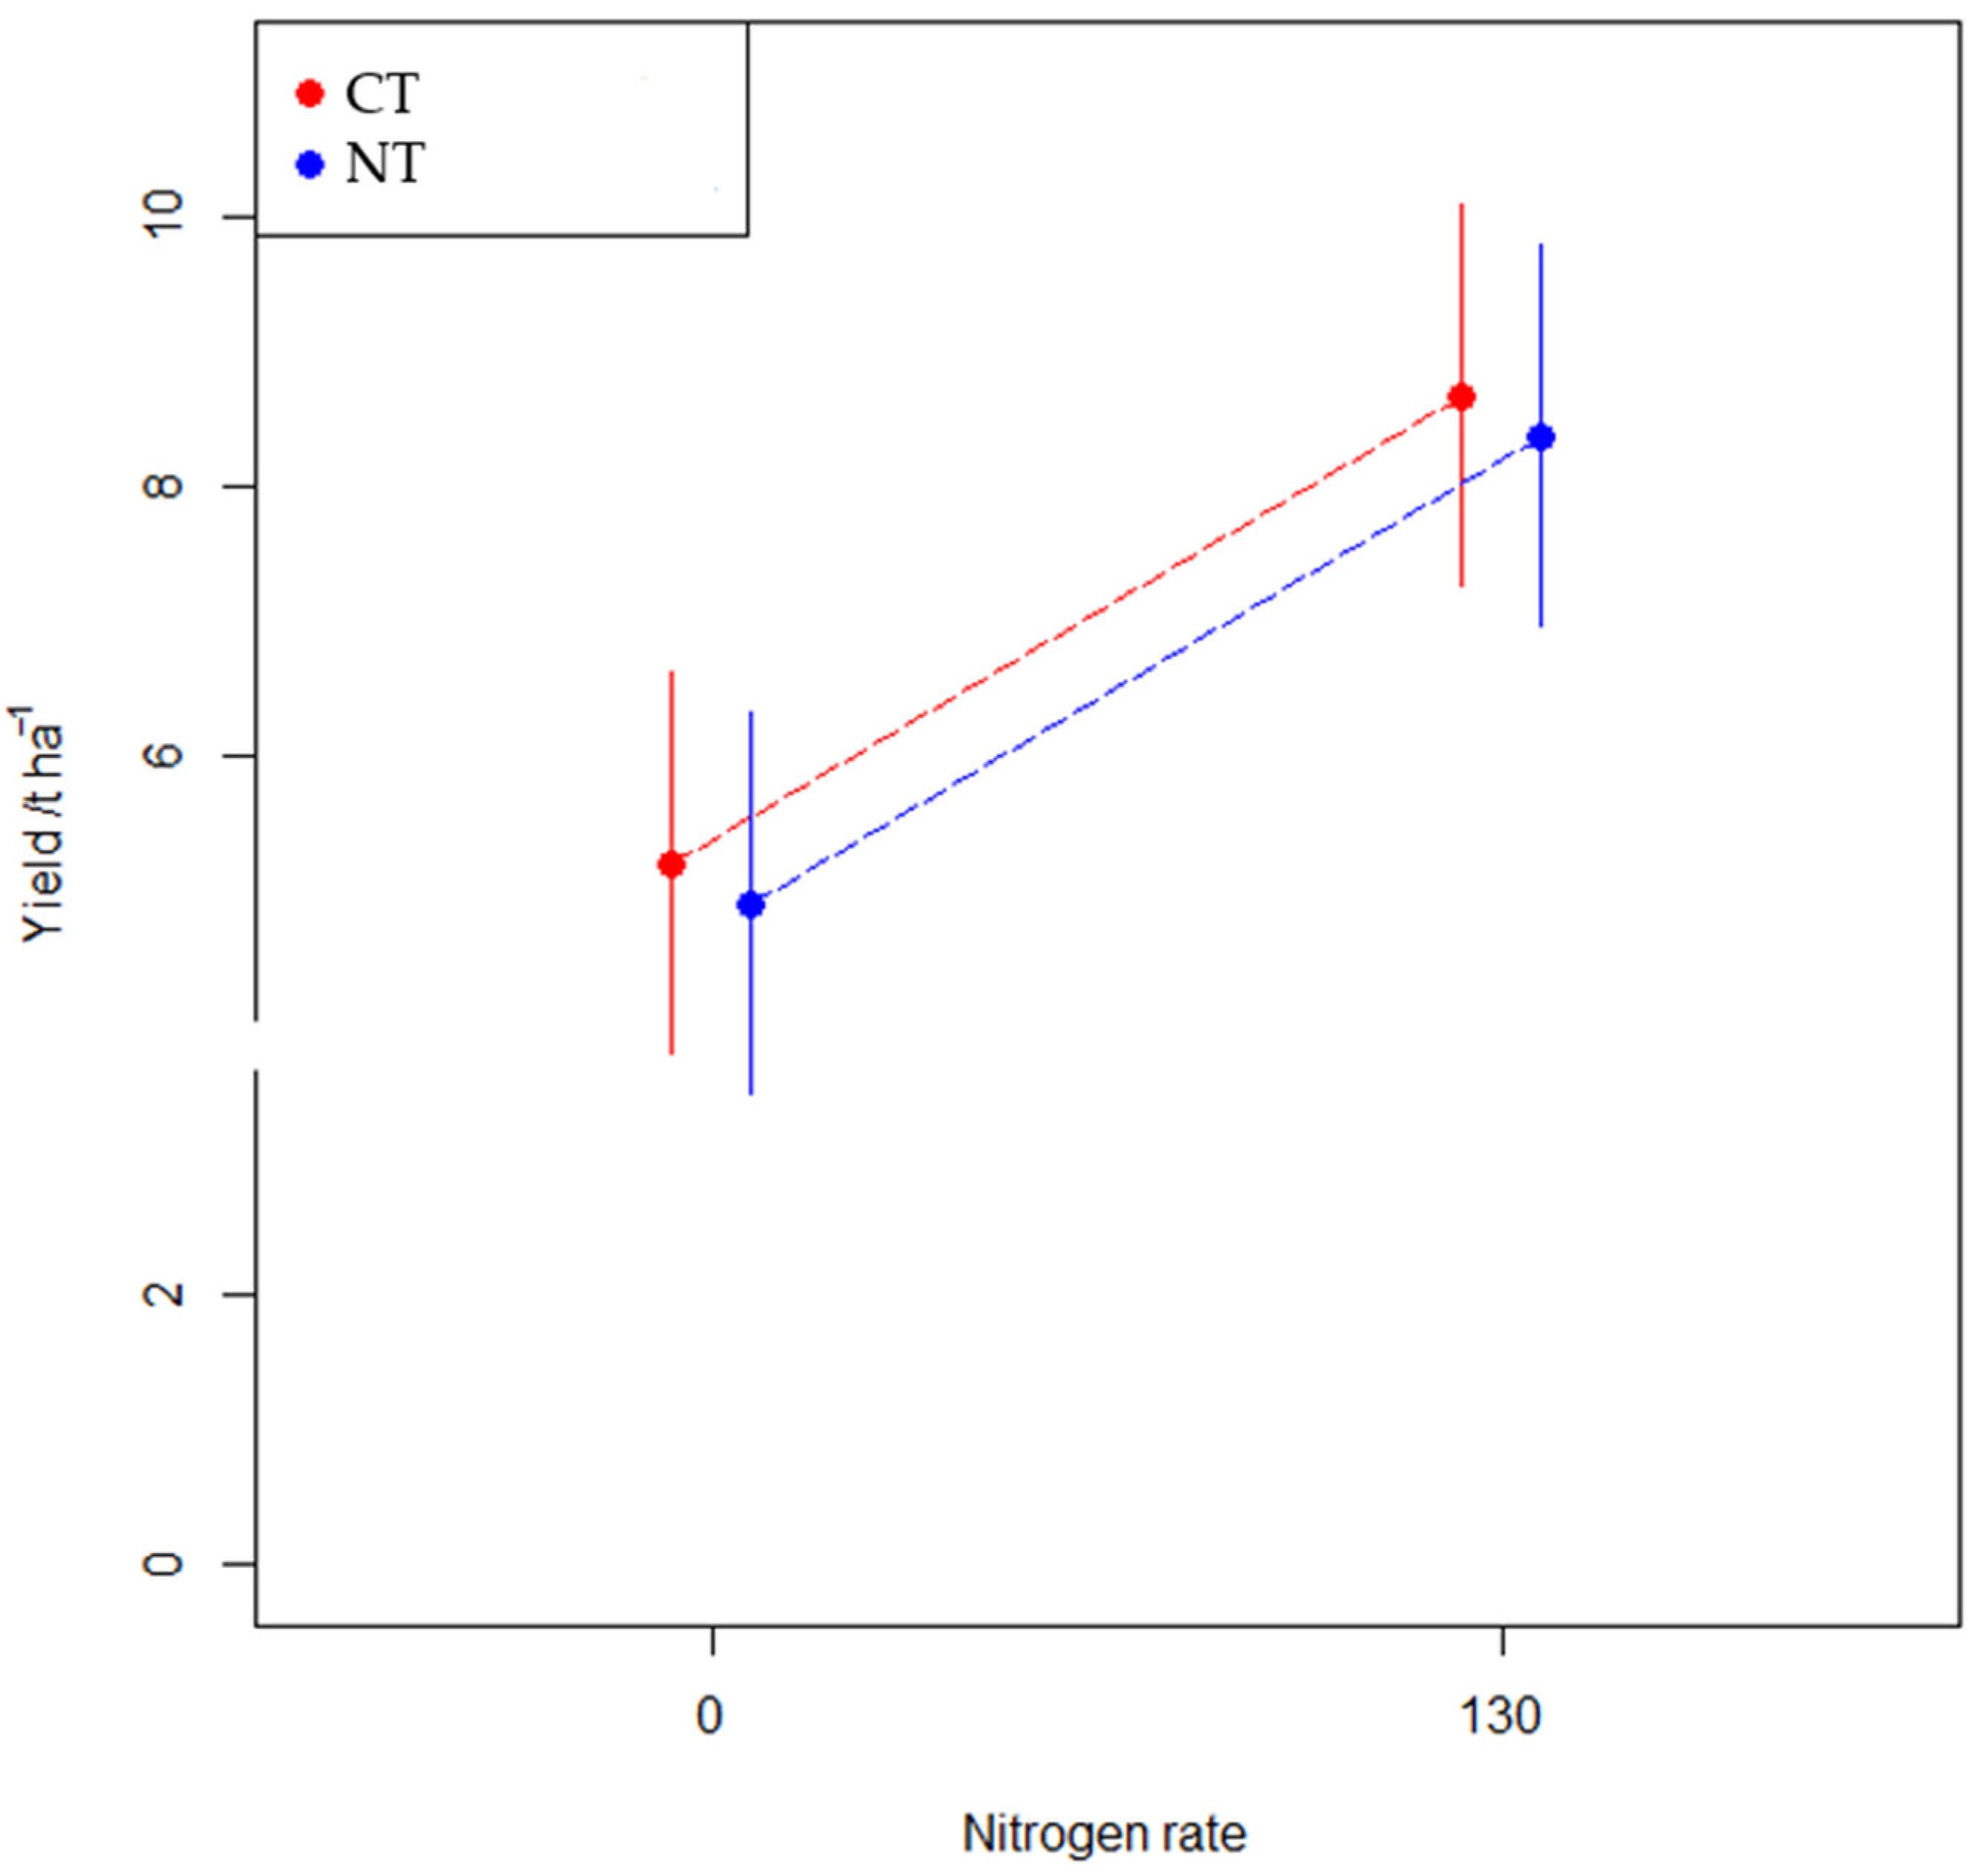
The Normalized Difference Vegetation Index was measured, similarly to the other parameters, at three dates corresponding to the plant’s growth phases: shooting, flowering, and medium milk. This parameter differed significantly in individual phases (p < 0.000), increased in the flowering phase when the plants reached the greatest green biomass, and then decreased in the medium milk phase as a result of the natural senescence of the plants. N fertilization also had a significant influence on the NDVI parameter (p = 0.001), but the increase caused by N was regardless of the development phase. The interaction of factors: fertilization and growth stage showed a strong tendency, although without statistical significance (p = 0.06) (Figure 5).

3.2.3. Grain Yield

N fertilization had a significant impact on the yield of winter wheat (p= 0.003). The greatest yield was achieved in the experimental plots with CT and 130 kg N∙ha−1 fertilization—8.73 t∙ha−1. The yield in the NT treatment (under N fertilization) was slightly less and amounted to 8.32 t∙ha−1. The yields in the unfertilized plots were, respectively, 5.15 (CT) and 4.05 t∙ha−1 (NT) (Figure 6).

4. Discussion

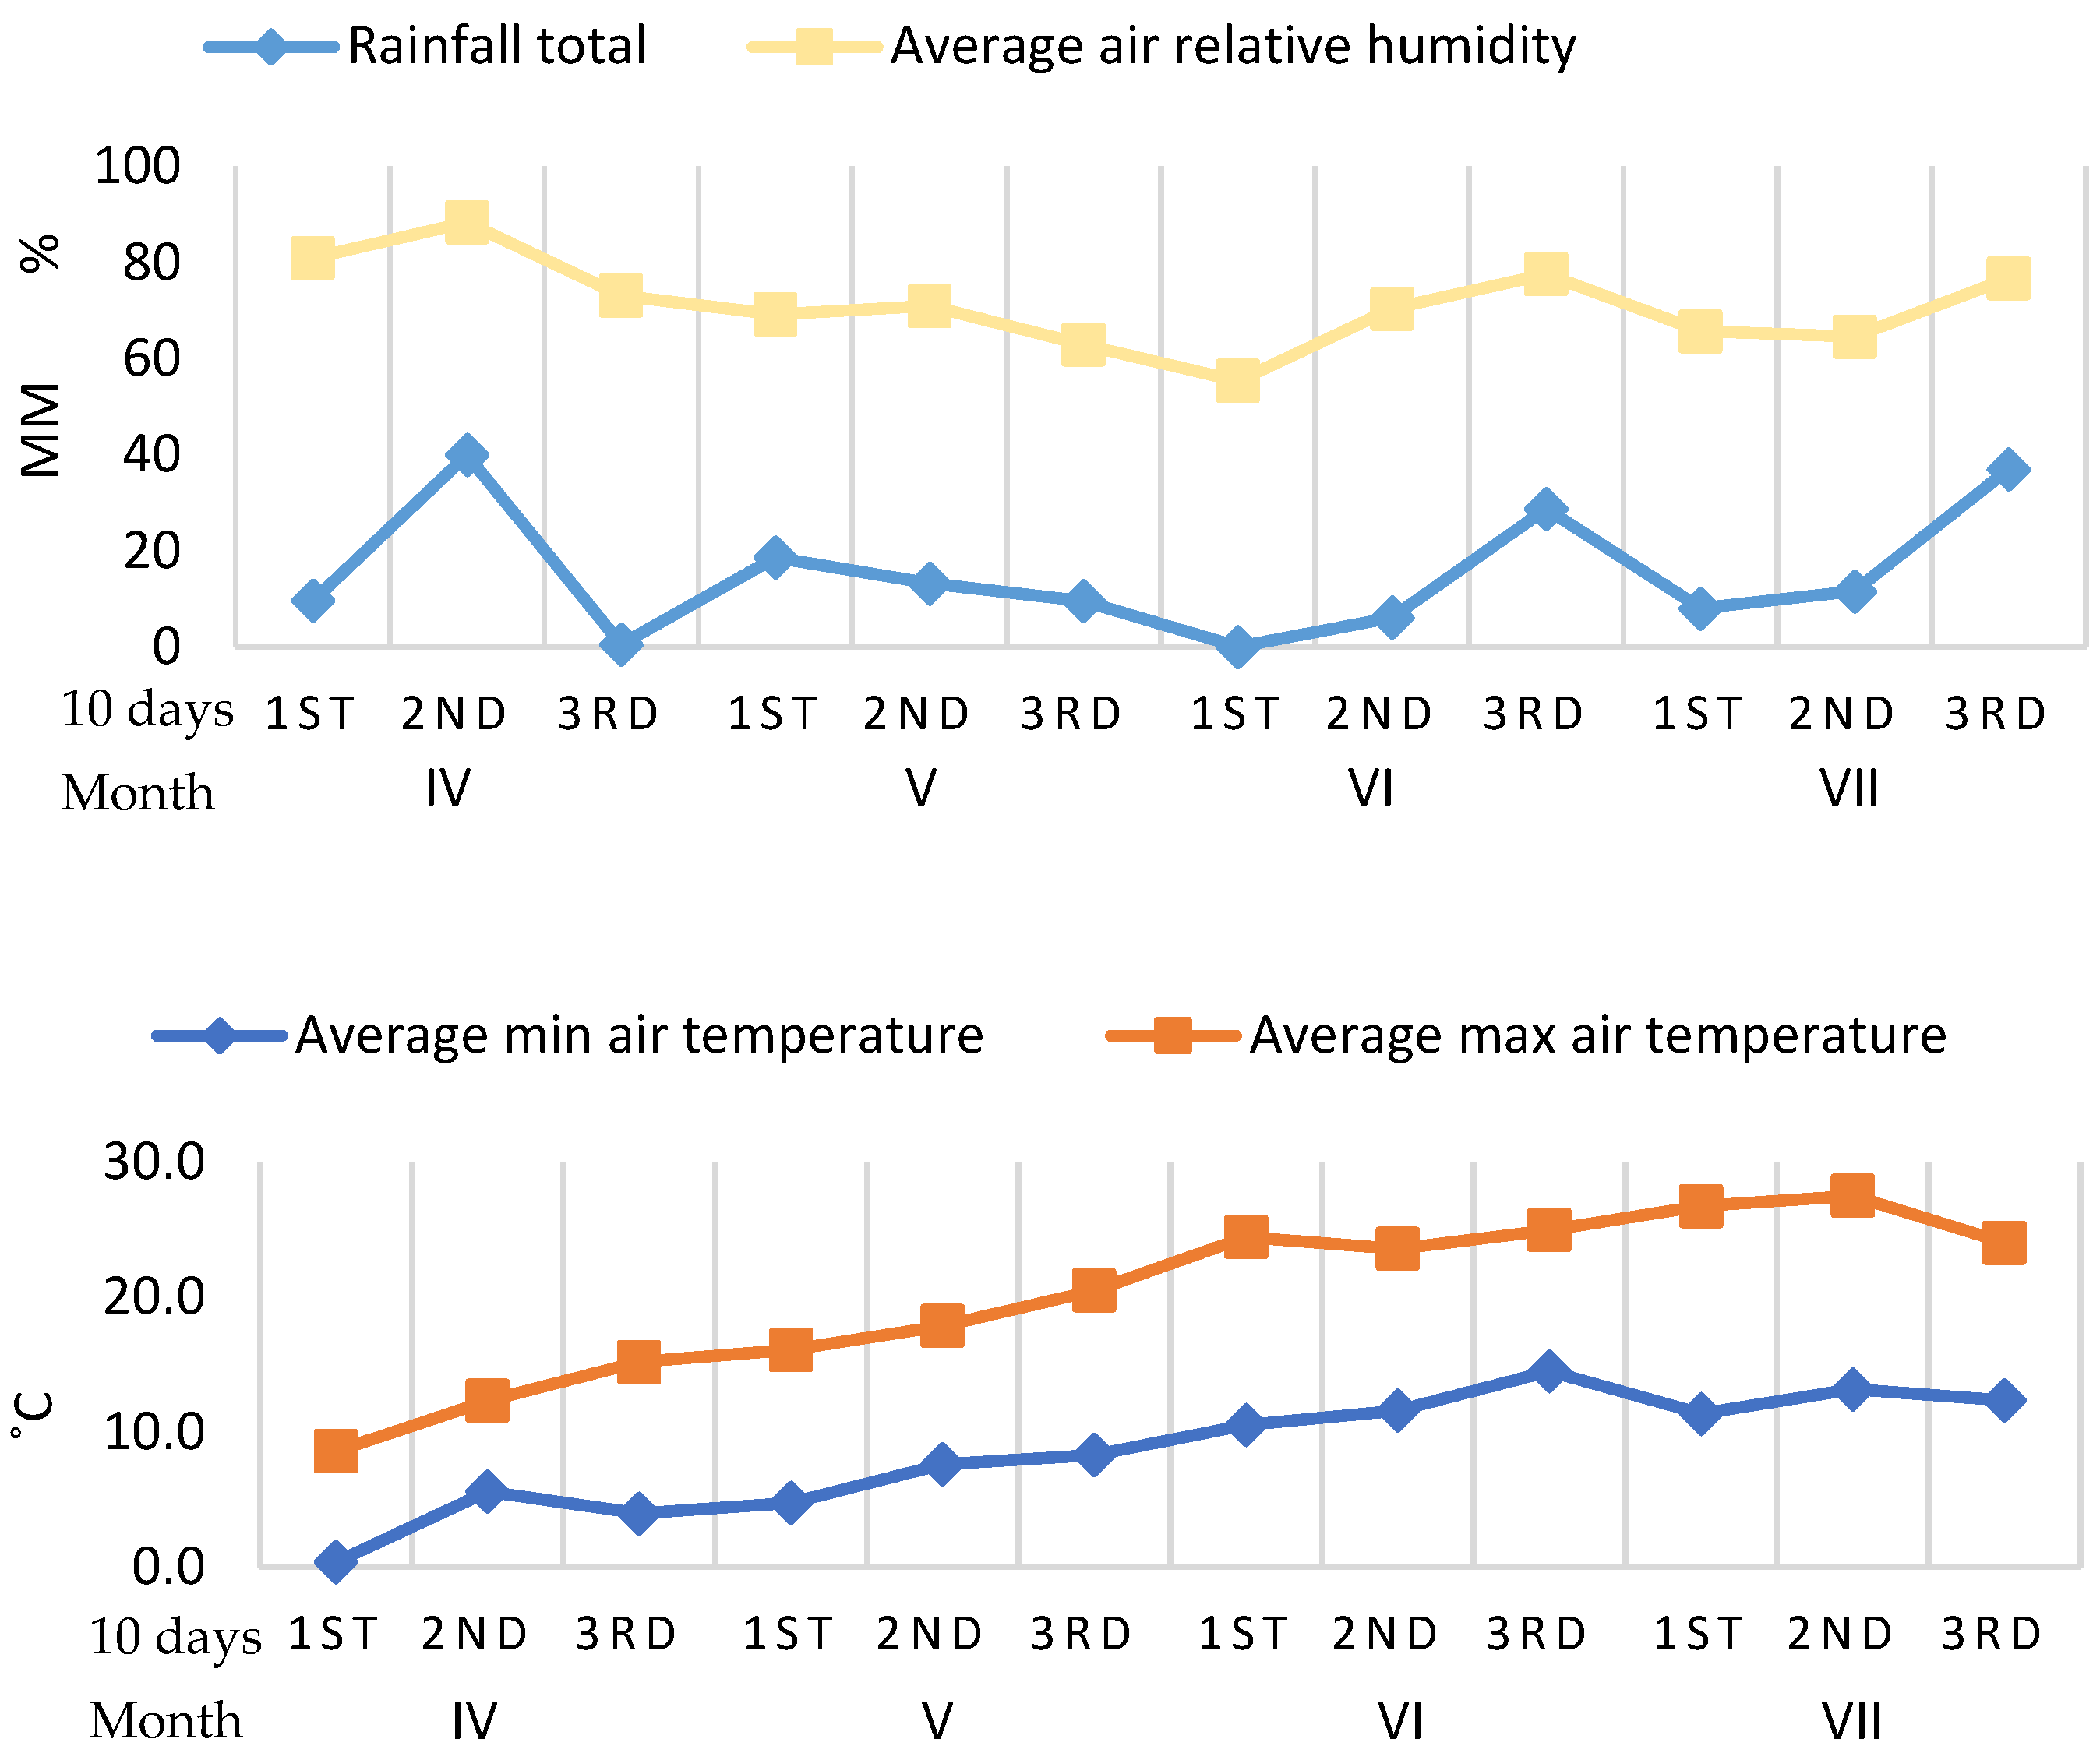
4.1. Growth Conditions

Tillage reduction may have both negative and positive effects on soil properties, as well as on the physiological processes and productivity of plants [39]. Short-term effects of tillage result from the physical soil disturbance and the incorporation of crop residues, while long-term effects include changes in physical, chemical, and biological soil properties. In both cases, tillage is a key factor influencing the physical properties of the soil, as well as its moisture and temperature, and, consequently, the nutritional conditions for plants [40,41]. Optimal plant nutrition is one of the necessary factors for effective photosynthesis, which in turn determines the proper growth and development of plants. In our experiment, we recorded greater soil moisture in NT in all three growth phases. Also, in an experiment conducted by Franzluebbers et al. [42], on a silty clay soil, the water content was greater under NT than under CT. Similarly, in the study by Hou et al. [41], the average water retention in the soil was significantly greater in the case of NT treatments compared to CT over a period of 3 years. According to Buczek et al. [1], reduction in tillage improves the capacity of water storage and use in soil, which provides a good soil environment for plant development and photosynthesis. The presence of crop residues on the soil surface has a dampening effect, making the soil slower to dry and to warm, especially after cold winters. The soil on which the experiment was carried out has a small SOM content. NT farming often results in an increase in SOC. SOC accumulation depends on many factors, including soil texture, moisture, and temperature [43]. The rate of C mineralization is often less in clayey soils than in coarse-grained soils because sorption of organic molecules onto surface minerals appears to be the primary mechanism for the preservation of organic matter in soils [44].
In reduced tillage, a large return of crop residues can improve the structure and fertility of the soil and, consequently, increase crop productivity [45]. In our experience, greater soil moisture was recorded in the NT system, which is crucial in the current situation of recurrent droughts, especially in periods of sensitivity of wheat to water shortage. As is known, greater soil moisture in a temperate climate with recurrent droughts will result in greater soil microbiological activity. This, in turn, lessens the potential for soil degradation, so it supports the restoration of the soil’s biological properties in the long term and therefore helps plants, especially under climate change. Additionally, improving the microbial biodiversity of the soil generally has a positive effect on the content and availability of nutrients. We recorded greater available K and Mg content in the NT system compared to CT by 42 and 39%, respectively.
Tillage can increase root development and penetration, thereby increasing the accumulation of nutrients and uptake of water, while RT limits the development of the root system [46,47]. Soil compaction as a result of RT has a negative impact on the root growth and thereby nutrient uptake, as well as physiological indicators of plants, such as chlorophyll content and chlorophyll fluorescence [48,49], which clearly means that it can suppress the efficiency of photosynthesis. However, in the case of our experiment with its location and rainfall limitation, NT turned out to be beneficial due to the greater content of SOM and water in the soil, which improved the availability of water and nutrients. Since restrictions on tillage can improve the ability to store and use water in the soil, they lead to better plant development and photosynthesis. According to Buczek et al. [1], tillage reduction leads to a greater photosystem efficiency (PSII) and photosynthetic electron transport capacity and improved leaf photosynthetic capacity. However, a large share of crop residues on the soil surface in the case of NT may cause a decrease in plant productivity due to the occurrence of allelopathic dependencies as well as a greater occurrence of pests and a reduction in the effectiveness of fertilizers and herbicides [39]. In our experiment, we did not note such effects of harvest residues, despite observing a greater share of SOC under NT compared to CT.

4.2. Plants Chlorophyll Fluorescence

We used chlorophyll fluorescence measurement to determine the photosynthetic efficiency of wheat plants. Chlorophyll fluorescence indices are mostly used to ascertain the efficiency of photosynthetic apparatus [50,51]. The measured chlorophyll fluorescence parameters indicate the effectiveness of photosystem II at individual stages of photosynthesis. The values of the F0 parameter of a dark-adapted leaf allow for the assessment of excitation energy losses during energy transfer from the energy antennas to the PSII center [52]. The Fm parameter determines the potential yield of PSII and can be used as a proxy to the photochemical activity of the photosynthetic apparatus [53], while the Fv/m parameter of a dark-adapted leaf determines the potential PSII yield and can be used as another indicator of the photochemical activity of the photosynthetic apparatus of the tested plants [54,55]. In our experiment, we observed a positive effect of NT on chlorophyll fluorescence parameters. This was especially visible in the Fv/m parameter, although in the remaining parameters (apart from minimum fluorescence) it was also visible that the values were more favorable for NT compared to CT (Figure 4). Hou et al. [41] showed that under conditions of low water level caused by drought, wheat plants grown in RT systems synthesized chlorophyll better, which contributed to the improvement of photosynthesis compared to CT. We also assumed that this positive effect was due to greater humidity in NT cultivation, but such a relationship was not proven. However, positive coefficients of the parameters Fm, Fv and Fv/m with soil temperature were proven. According to Yibo et al. [56], who investigated the effects of different warming levels and tillage managements on winter wheat growth, chlorophyll fluorescence parameters indicated that warming inhibited photosynthetic capacity substantially under CT, as opposed to NT.
Most literature reports analyze chlorophyll fluorescence only on the basis of the maximum photochemical efficiency of PSII (Fv/m). In their opinion, it is an effective tool to indicate changes in functions of photosynthetic apparatus, especially those caused by environmental stress such as soil compaction or/and nutrient supply [47,52]. However, the impact of the cultivation method on the efficiency of photosystem II varies and is usually related to the weather as a result of years of research [57]. In the study by Buczek et al. [1] in a year with optimal rainfall, chlorophyll fluorescence (Fv/m) in the CT system achieved a greater value compared to NT and RT, but in conditions of insufficient moisture content greater values of Fv/m were achieved in the RT system compared to CT. Liu et al. [58], who tested two wheat genotypes, found no significant differences in Fv/m between CT and NT. Similar results were obtained by Janusauskaite et al. [39], who showed that the differences between tillage treatments were insignificant, but simplification of soil tillage tended to reduce Fv/m in most cases. However, the values differed depending on the development phase. In winter wheat, the values decreased with the aging of the plants and the plants grown in the NT system aged faster. In our experiment, we also noted that the values of all fluorescence parameters differed significantly in the individual phases of plant growth. The F0, Fm and Fv parameters were greatest in the shooting stage, while the Fv/m parameter reached the greatest value in the flowering stage. However, in the case of the Fv/m parameter, there was an interaction between the growth phase and fertilization (p = 0.02). In our opinion, the decrease in the values of chlorophyll fluorescence parameters along with the growth phases occurred as a result of the senescence process of wheat plants. Senescence is a natural consequence of various physiological processes such as degradation of chlorophyll, fragmentation of chloroplasts, and reduction of photochemical efficiency [59]. According to Janusauskaite et al. [39], the acceleration of plant senescence was the reason for the lesser value of the Fv/m parameter in simplified cultivation due to reduced efficiency of photosynthesis and soil compaction. However, in another publication [40] he indicates that the senescence process of plants is influenced by soil moisture and the nutritional status of plants. Many other authors have also stated that the aging process is accelerated by lack of soil moisture and insufficient nutrient absorption [41,60,61,62]. And again, probably due to greater soil moisture and, consequently, better availability of water for plants, we obtained greater values of fluorescence parameters in NT cultivation than in CT cultivation. A better uptake of water and nutrients determines a longer period of photosynthesis, which determines a greater accumulation of assimilates to fill the grain, which leads to an increase in grain yield [40,63]. Also, Hou et al. [41] found that, compared to CT, the break with NT and ST (Subsoil Tillage) improved the ability to save water, and alleviated drought stress. In their studies, apart from improving the chlorophyll fluorescence value, an increase in the relative chlorophyll content, the rate of photosynthesis and transpiration, as well as an improvement in the WUE of leaves, especially at the filling stage, were also noted.
In the case of the Fv/m parameter, an increase in its value was noted from the shooting to the flowering phase and then a decrease to medium milk. A large impact of fertilization was noted here; the smallest differences between the parameter values depending on fertilization were observed in the flowering phase, where the values were generally the greatest, while the largest differences occurred in the medium milk phase. In studies, Janusauskaite [39] noted that although a greater decrease in Fv/m values during subsequent growth phases was proven in NT compared to CT, an advantage was noted for NT in the BBCH 71-73 phase. In this research, as in our own, fertilization had a positive effect on Fv/m. Additionally, the increase in the parameter value due to fertilization was greater in NT cultivation.
Similar to Janusauskaite [39], we suspect that fertilization slowed down leaf senescence, especially that at the grain-filling stage. Sufficient nutrient uptake delays the remobilization of N from leaves and stems, thus delaying the onset of senescence [61,62]. A significant increase under N application was observed in the values of Fv (p= 0.002), Fm (p = 0.001) and Fv/m (p = 0.006), but fertilization did not significantly affect the value of the F0 (p = 0.220). Very similar results to ours were obtained by Lin et al. [64], in which a significant increase in the values of the Fm, Fv and Fv/m parameters was noted as a result of increasing the N dose, but no differences were found in the value of the F0 parameter. Also, other researchers documented an increase in the value of the Fv/Fm parameter with an increase in the level of N application [5,62,65,66].

4.3. Plants Grain Yield

We can clearly confirm that the process of photosynthesis is influenced by key factors such as nutritional, tillage, and meteorological conditions [39]. However, in our experiment, greater photosynthetic efficiency did not affect the wheat grain yield. There are many studies that demonstrate the positive impact of RT on grain yield and yield components, as well as grain quality parameters [41,62,67,68]. There are also many reports indicating that the restrictions in tillage has a negative impact on plant productivity [1,26,27,69,70]. Similarly, to our results from fertilized plots, Hofmeijer et al. [71] showed slight differences in wheat grain yield in both tillage systems. In the study by Šip et al. [68], wheat grain yield depended to a greater extent on soil moisture and variety genotype, and the difference between the systems was 3.0% in favor of CT.
In many experiments, the impact of the tillage method on the hydrothermal conditions of the soil and, consequently, the yield, was clearly emphasized. In the Buczek et al. [1] experiment, in the season with favorable rainfall, the greatest grain yield was obtained under CT, while in the season in which the rainfall values were low, the greatest grain yield was obtained under NT. Also, in the studies of Cociu and Alionte [72] and Woźniak and Rachoń [73], the lowest grain yield of winter wheat grown in the CT system was obtained in the season characterized by rainfall deficiency. Reductions of tillage may have a positive impact on grain yield in seasons with low water availability thanks to better physicochemical properties of the soil resulting from: accumulation of SOM, the formation of soil aggregates, a larger number of macropores and a larger volume of medium-sized pores retaining water, as well as limited water evaporation from the soil surface [27,74]. On moderately moist soils, CT creates such conditions, while on dry and semi-arid soils, NT provides better conditions.
However, in our research, apart from the influence of weather, and the method of cultivation, fertilization had a much greater impact on the yield. The decrease in yield as a result of NT was only 5% in the 130 N plots, and 21% in the 0 N plots. However, the average decrease in grain yield regardless of the tillage method, resulting only from the lack of fertilization, was 46%. Studies of Malhi et al. [75] show a greater requirement for N application under NT than CT due to changes in yield potential and the soil N supply caused by changes in N cycling and losses under a NT system. Tillage reduction may result in a greater potential for N mineralization, which does not necessarily lead to an increase in the actual supply of N in the soil due to greater soil moisture in NT conditions than in CT. The increase in soil N supply under NT conditions may be offset by increased N losses through denitrification and NO3 leaching, again due to wetter soil conditions and potentially greater hydraulic conductivity in NT than CT [75].
NT is an extreme reduction of tillage to zero. A global meta-analysis of over 6000 observations and 670 studies shows that in most cases it leads to reduced plant yields [25]. Wheat is a species in which the yield reduction in NT is relatively small. The size of the differences depends primarily on aridity, irrigation, N rate, and residue management. N fertilization and residue retention reduce the difference. In our study, the yield difference is also smaller in N-fertilized treatments. The introduction of residues would probably lead to a further reduction in yield differences.

4.4. Soil Respiration

The factors discussed in the paper that had the greatest impact on the physical, chemical and biological properties of the soil, as well as on the photosynthetic activity of wheat plants, also influenced soil respiration. Differences in CO2 emissions in the different tillage systems have been reported to be largely a result of the soil climatic conditions, air temperature, and rainfall events, as well as the amounts and location of crop residues and SOM in CT and NT [76]. The level of CO2 emissions may be determined by the processes of mineralization of SOM, and thus indirectly by the activity of soil microorganisms. NT increased pore connectivity, but decreased porosity interaggregate, which is a potential mechanism for SOC protection. Resistance is particularly common in soils that have not been cultivated for at least 15 years [77]. The structure and porosity of the soil translate into the availability of oxygen and, consequently, the ability to store SOC [78].
Similarly, in the analysis of parameters related to photosynthesis, we observed the influence of soil moisture on the CO2 flux and ∆C, respectively p = 0.003 and p = 0.002. However, the influence of soil moisture on H2O flux and the influence of soil temperature on all three parameters of soil respiration have not been proven. Nevertheless, we believe that the greater soil water content as well as greater SOC under NT than under CT are the direct causes of greater CO2 emissions under NT. This is consistent with the assumptions of modeling the influence of soil moisture on emissions [79].
Temperature is also considered a factor influencing soil respiration. However, research by Flanagan and Johnson [80] showed that the influence of this factor may be inhibited due to a decrease in soil moisture and then soil moisture is the dominant environmental factor controlling soil respiration. The integrated impact of other factors can intensively buffer the direct impact of temperature on soil [81]. In addition to temperature and water content in the soil, rain also plays a role in determining C released from the soil [82]. In temperate ecosystems where rainfall is distributed evenly throughout the year, there may be a sensitive response to the amount and distribution of rainfall during drought, concretely a post-rainfall increased in the soil CO2 flux [83]. Intense rain in the third week of June (29 mm), after 20 days with virtually no or very little rainfall, could have been the direct cause of an increase in the values of all respiration parameters during the last measurement in early July. Research by Al-Kaisi and Yin [81] indicates that rewetting dry soil resulted in a large increase in CO2 efflux at high temperatures. Even light rainfall (ranging from 0.0 to 13.5 mm) substantially increased the CO2 flux. Similarly, little rainfall in the period between the shooting and flowering phases could have caused a decrease in the respiration value measured at the flowering phase. Additionally, according to Al-Kaisi and Yin [81], soil NCER, under both dry and wet environmental conditions, responded to changes in weather and soil conditions more sensitively in NT than in RT and CT. This may explain why CO2 emissions in the medium milk phase in the NT 130 N system were 51% greater than in the flowering phase, and in the CT 130 N system 35% greater. In turn, the first measurement in the shooting phase, preceded by the fluctuation of rain events, alternating with periods without rain, when soil moisture was the greatest of all measurement dates, showed greater CO2 emissions in the NT 130 N system compared to CT 130 N by as much as 74%. The influence of the growth phase on all soil respiration parameters was identical and at the same level (p= 0.001). While the ΔC and CO2 flux values increased in subsequent development phases, the H2O flux value shows a decline in the flowering phase. This relationship is visible in both the CT and NT systems. During the measurements carried out in the flowering phase the soil moisture was much lower than in the other two measurements (development phases), but still greater in NT compared to CT.
We showed a significant effect of N fertilization on the results of ΔC, CO2 and H2O flux, respectively p = 0.003; p = 0.002 and p = 0.03. What surprised us was that all respiration parameters at 0 N had greater values, regardless of the plant growth phase and cultivation method. Most reports indicate greater CO2 emissions in fertilized plots [84,85,86]. However, in the study by Wilson and Al-Kaisi [87], plots that received no N showed 31% greater CO2 emissions compared to plots fertilized with 270 kg N ha−1.
In general, the greatest values of all parameters were obtained in the NT 0 N system in medium milk phase, and the smallest for parameters: ΔC, CO2 flux in CT 130 N in the shooting phase, and for parameter H2O flux in the flowering phase.
Many data indicate that CO2 emissions for NT were much lower than for CT [19,81,88,89,90,91]. There are also studies showing that CO2 emissions did not differ significantly between CT and NT [92,93], as well as studies in which CO2 emissions were greater in NT cultivation [76,94,95,96]. According to the experiments of Regina and Alakukku [97] conducted in various locations in Finland on spring cereals crops, the CO2 flux was statistically significantly greater from NT plots compared to CT in 36% of the sampling occasions and lower in 11%.
Such differences in results only prove how many factors influence GHG emissions from soil and how complex the process is. However, although short-term studies are available, there is a lack of data to assess the impact of long-term farming practice on CO2 emissions [62]. Therefore, there is still a need to investigate as many locations and factors influencing GHG emissions in different cropping systems as possible.

5. Conclusions

We can clearly confirm that the tillage system affects all the parameters discussed in the work: soil properties (Albic Luvisol), including SOC content, photosynthetic efficiency assessed on the basis of chlorophyll fluorescence, soil respiration, and grain yield. In our opinion, soil moisture had a key influence on the parameters in our experiment. The NT system, regardless of the development phase and fertilization level, was characterized by greater soil moisture, which is invaluable in the current situation of recurrent droughts.
We observed a positive effect of NT on chlorophyll fluorescence parameters. This is especially apparent in the case of the Fv/m parameter. We assumed that better water and nutrient uptake at greater soil moisture slowed down the senescence of leaves, ensuring a longer period of photosynthesis. Additionally, the increase in the parameter value as a result of fertilization was greater in NT cultivation. We also demonstrated the influence of the development phase and fertilization on chlorophyll fluorescence parameters. However, in our experiment, greater photosynthetic efficiency did not lead to greater wheat grain yield. However, the yield decrease as a result of NT was only 5% in fertilized plots, while the average decrease in grain yield regardless of the tillage method, resulting solely from the lack of fertilization, was 46%.
It was also found that differences in CO2 emissions in different tillage systems result largely from climatic conditions, mainly rainfall and, consequently, soil moisture, as well as SOC content. We demonstrated the influence of soil moisture on CO2 emissions from soil, as well as the influence of the growth phase and fertilization. The greatest values of respiration parameters were obtained in the NT system in the absence of fertilization, in the medium milk phase.
In the case of the long duration, as well as the climatic conditions of our experiment, we believe that no tillage has an overall positive effect on the soil and the plants’ condition.
In our opinion, the use of no-tillage, by changing the physical properties of the soil, (moisture and temperature) affected soil respiration and significantly improved the conditions for plant growth and development, which in turn provided plants with better physiological condition and higher photosynthetic efficiency, which is extremely important in view of the increasingly frequent abiotic and biotic stresses resulting from climate variability.

Author Contributions

Conceptualization, D.R.-K. and Z.S.; methodology, Z.S.; investigation, D.R.-K., Z.S., S.Ś., A.B., T.P., A.L.-L., L.M.C., K.C., A.S.G. and R.M.L.; data curation, R.M.L. and K.C.; writing—original draft preparation, D.R.-K. and T.P.; writing—review and editing, Z.S., A.B., S.Ś., A.C., A.S.G., A.L.-L. and L.M.C.; visualization, R.M.L. and D.R-K.; supervision, Z.S. All authors have read and agreed to the published version of the manuscript.

Funding

This research was funded by NCBiR—The National Centre for Research and Development, EJP Soil European Joint Programme “The effect of conservation agriculture interventions on greenhouse gas emissions” grant number EJP SOIL/I/108/CropGas/2022. The contributions of Rothamsted Research to this study were funded by the UK Research and Innovation—Biotechnology and Biological Sciences Research Council (UKRI-BBSRC) under award BB/X002993/1 (2022–2024). The publication was financed by the Polish Minister of Science and Higher Education as part of the Strategy of the Poznan University of Life Sciences for 2024–2026 in the field of improving scientific research and development work in priority research areas.

Data Availability Statement

Data available on request due to restrictions, privacy. The data presented in this study are available on request from the corresponding author. The data required to reproduce these findings cannot be shared at this time, as the data also forms part of an ongoing study which concerns a wider range of research with greenhouse gases.

Conflicts of Interest

The authors declare no conflicts of interest. The funders had no role in the design of the study; in the collection, analyses, or interpretation of data; in the writing of the manuscript, or in the decision to publish the results.

References

  1. Buczek, J.; Migut, D.; Jańczak-Pieniążek, M. Effect of soil tillage practice on photosynthesis, grain yield and quality of hybrid winter wheat. Agriculture 2021, 11, 479. [Google Scholar] [CrossRef]
  2. Morris, N.L.; Miller, P.C.H.; Orson, J.H.; Froud-Williams, R.J. The adoption of non-inversion tillage systems in the United Kingdom and the agronomic impact on soil, crops and the environment—A review. Soil Tillage Res. 2010, 108, 1–15. [Google Scholar] [CrossRef]
  3. Lal, R. Restoring soil quality to mitigate soil degradation. Sustainability 2015, 7, 5875–5895. [Google Scholar] [CrossRef]
  4. Obalum, S.E.; Chibuike, G.U.; Peth, S.; Ouyang, Y. Soil organic matter as sole indicator of soil degradation. Environ. Monit. Assess. 2017, 189, 176. [Google Scholar] [CrossRef]
  5. Sanderman, J.; Hengl, T.; Fiske, G.J. Soil carbon debt of 12,000 years of human land use. Proc. Natl. Acad. Sci. USA 2017, 114, 9575–9580. [Google Scholar] [CrossRef]
  6. Dotterweich, M. The history of human-induced soil erosion: Geomorphic legacies, early descriptions and research, and the development of soil conservation—A global synopsis. Geomorphology 2013, 201, 1–34. [Google Scholar] [CrossRef]
  7. WMO State of the Global Climate 2023, 1st ed.; World Meteorological Organization: Geneva, Switzerland, 2024; ISBN 9789263113474.
  8. Wei, X.; Shao, M.; Gale, W.; Li, L. Global pattern of soil carbon losses due to the conversion of forests to agricultural land. Sci. Rep. 2014, 4, 4062. [Google Scholar] [CrossRef]
  9. Tomczyk, A.M.; Bednorz, E. The extreme year—Analysis of thermal conditions in Poland in 2018. Theor. Appl. Clim. 2020, 139, 251–260. [Google Scholar] [CrossRef]
  10. Ustrnul, Z.; Marosz, M.; Biernacik, D.; Walus, K.; Chilińska, A.; Wasielewska, K.; Kusek, K. Climate Monitoring Bulletin of Poland Year 2023, 1st ed.; Institute of Meteorology and Water Management—National Research Institute: Warsaw, Poland, 2024. (In Polish) [Google Scholar]
  11. Okoniewska, M.; Szuminska, D. Changes in potential evaporation in the years 1952–2018 in North-Western Poland in terms of the impact of climatic changes on hydrological and hydrochemical conditions. Water 2020, 12, 877. [Google Scholar] [CrossRef]
  12. Pinskwar, I.; Chorynski, A.; Kundzewicz, Z.W. Severe drought in the spring of 2020 in Poland—More of the same? Agronomy 2020, 10, 1646. [Google Scholar] [CrossRef]
  13. Rodrigues, C.I.D.; Brito, L.M.; Nunes, L.J.R. Soil carbon sequestration in the context of climate change mitigation: A Review. Soil Syst. 2023, 7, 64. [Google Scholar] [CrossRef]
  14. Lal, R. Soil carbon management and climate change. Carbon Manag. 2013, 4, 439–462. [Google Scholar] [CrossRef]
  15. Wu, H.; Cui, H.; Fu, C.; Li, R.; Qi, F.; Liu, Z.; Yang, G.; Xiao, K.; Qiao, M. Unveiling the crucial role of soil microorganisms in carbon cycling: A Review. Sci. Total Environ. 2024, 909, 168627. [Google Scholar] [CrossRef]
  16. Zhang, K.; Maltais-Landry, G.; Liao, H.L. How Soil biota regulate C cycling and soil C pools in diversified crop rotations. Soil Biol. Biochem. 2021, 156, 108219. [Google Scholar] [CrossRef]
  17. Johnston, C.A.; Groffman, P.; Breshears, D.D.; Cardon, Z.G.; Currie, W.; Emanuel, W.; Gaudinski, J.; Jackson, R.B.; Lajtha, K.; Nadelhoffer, K.; et al. Carbon cycling in soil. Front. Ecol. Environ. 2004, 2, 522–528. [Google Scholar] [CrossRef]
  18. Karhu, K.; Auffret, M.D.; Dungait, J.A.J.; Hopkins, D.W.; Prosser, J.I.; Singh, B.K.; Subke, J.A.; Wookey, P.A.; Agren, G.I.; Sebastià, M.T.; et al. Temperature sensitivity of soil respiration rates enhanced by microbial community response. Nature 2014, 513, 81–84. [Google Scholar] [CrossRef]
  19. Moraru, P.I.; Teodor, R. Effect of tillage systems on soil moisture, soil temperature, soil respiration and production of wheat, maize and soybean crops. J. Food Agric. Environ. 2012, 10, 445–448. [Google Scholar]
  20. Liang, G.; Houssou, A.A.; Wu, H.; Cai, D.; Wu, X.; Gao, L.; Li, J.; Wang, B.; Li, S. Seasonal patterns of soil respiration and related soil biochemical properties under nitrogen addition in winter wheat field. PLoS ONE 2015, 10, e0144115. [Google Scholar] [CrossRef]
  21. Derrouch, D.; Chauvel, B.; Felten, E.; Dessaint, F. Weed management in the transition to conservation agriculture: Farmers’ response. Agronomy 2020, 10, 843. [Google Scholar] [CrossRef]
  22. Rodriguez, J.M.; Molnar, J.J.; Fazio, R.A.; Sydnor, E.; Lowe, M.J. Barriers to adoption of sustainable agriculture practices: Change agent perspectives. Renew. Agric. Food Syst. 2009, 24, 60–71. [Google Scholar] [CrossRef]
  23. Derpsch, R.; Franzluebbers, A.J.; Duiker, S.W.; Reicosky, D.C.; Koeller, K.; Friedrich, T.; Sturny, W.G.; Sá, J.C.M.; Weiss, K. Why do we need to standardize no-tillage research? Soil Tillage Res. 2014, 137, 16–22. [Google Scholar] [CrossRef]
  24. Murphy, B.W. Soil Organic Matter and Soil Function—Review of the Literature and Underlying Data; Department of the Environment: Canberra, Australia, 2014; p. 155. [Google Scholar]
  25. Pittelkow, C.M.; Linquist, B.A.; Lundy, M.E.; Liang, X.; van Groenigen, K.J.; Lee, J.; van Gestel, N.; Six, J.; Venterea, R.T.; van Kessel, C. When does no-till yield more? A global Meta-Analysis. Field Crops Res. 2015, 183, 156–168. [Google Scholar] [CrossRef]
  26. Małecka, I.; Blecharczyk, A.; Sawinska, Z.; Swędrzyńska, D.; Piechota, T. Winter wheat yield and soil properties response to long-term non-inversion tillage. J. Agric. Sci. Technol. 2015, 17, 1571–1584. [Google Scholar]
  27. Malecka, I.; Blecharczyk, A.; Sawinska, Z.; Dobrzeniecki, T. The effect of various long-term tillage systems on soil properties and spring barley yield. Turk. J. Agric. For. 2012, 36, 217–226. [Google Scholar] [CrossRef]
  28. Swędrzyńska, D.; Małecka, I.; Blecharczyk, A.; Swędrzyński, A.; Starzyk, J. Effects of various long-term tillage systems on some chemical and biological properties of soil. Pol. J. Environ. Stud. 2013, 22, 1835–1844. [Google Scholar]
  29. IUSS Working Group WRB. World Reference Base for Soil Resources. International Soil Classification System for Naming Soils and Creating Legends for Soil Maps, 4th ed.; International Union of Soil Sciences (IUSS): Vienna, Austria, 2022. [Google Scholar]
  30. Korbas, M.; Mrówczyński, M. (Eds.) Metodyka Integrowanej Produkcji Pszenicy Ozimej i Jarej; Plant Health and Inspection Service: Warszawa, Poland, 2014; p. 90. Available online: http://www.piorin.gov.pl (accessed on 6 July 2024).
  31. Egnér, H.; Riehm, H.; Domingo, W.R. Untersuchungen uber die chemische Bodenanalyse als Grundlage fur die Beurteilung des Nährstoffzustandes der Böden. II. Chemische Extraktionsmethoden zur Phosphor- und Kaliumbestimmung. K. Lantbrukshögskolans Ann. 1960, 26, 199–215. [Google Scholar]
  32. Schachtschabel, P. Methode Schachtschabel. In Methodenbuch, Band I. Die Untersuchung von Böden, 3. Auflage; Thun, R., Herrmann, R., Knickmann, E., Eds.; Neumann Verlag: Berlin, Germany, 1955. [Google Scholar]
  33. Tiurin, L.V. Studies in the Genesis and Geography of Soils; Dokuchaiev Soil Institute: Moscow, Russia, 1935; p. 139. [Google Scholar]
  34. LCpro-SD Portable. Photosynthesis System. Instruction Manual; Software Issue 1.01 Onwards; Issue 4; Copyright ADC BioScientific Ltd.: Broxbourne, UK, 2012. [Google Scholar]
  35. Chapter 2.·The OS5p+ Hardware. In Preliminary 2021 Edition OS5p+ Operators Guide; Optisciences Inc.: Hudson, NH, USA, 2021.
  36. R Core Team. R: A Language and Environment for Statistical Computing; R Foundation for Statistical Computing: Vienna, Austria, 2023; Available online: https://www.R-project.org/ (accessed on 6 July 2024).
  37. Pinheiro, J.; Bates, D.R.; Core Team. Linear and Nonlinear Mixed Effects Models, R Package Version 3.1-163. 2024. Available online: https://CRAN.R-project.org/package=nlme (accessed on 6 July 2024).
  38. Lenth, R.V. Estimated Marginal Means, Aka Least-Squares Means; R Package Version 1.8.5. 2023. Available online: https://CRAN.R-project.org/package=emmeans (accessed on 6 July 2024).
  39. Janusauskaite, D.; Kadziene, G. Influence of different intensities of tillage on physiological characteristics and productivity of crop-rotation plants. Plants 2022, 11, 3107. [Google Scholar] [CrossRef]
  40. Li, Y.; Hou, R.; Tao, F. Wheat morphophysiological traits and radiation use efficiency under interactive effects of warming and tillage management. Plant Cell Environ. 2021, 44, 2386–2401. [Google Scholar] [CrossRef]
  41. Hou, X.; Li, R.; Jia, Z.; Han, Q. Rotational tillage improves photosynthesis of winter wheat during reproductive growth stages in a semiarid region. Agron. J. 2013, 105, 215–221. [Google Scholar] [CrossRef]
  42. Franzluebbers, A.J.; Hons, F.M.; Zuberer, D.A. Tillage and crop effects on seasonal dynamics of soil CO2 evolution, water content, temperature, and bulk density. Appl. Soil Ecol. 1995, 2, 95–109. [Google Scholar] [CrossRef]
  43. Alvarez, R. A review of nitrogen fertilizer and conservation tillage effects on soil organic carbon storage. Soil Use Manag. 2005, 21, 38–52. [Google Scholar] [CrossRef]
  44. Kaiser, K.; Guggenberger, G. Mineral surfaces and soil organic matter. Eur. J. Soil Sci. 2003, 54, 219–236. [Google Scholar] [CrossRef]
  45. Brennan, J.; Hackett, R.; McCabe, T.; Grant, J.; Fortune, R.A.; Forristal, P.D. The effect of tillage system and residue management on grain yield and nitrogen use efficiency in winter wheat in a cool Atlantic climate. Eur. J. Agron. 2014, 54, 61–69. [Google Scholar] [CrossRef]
  46. Schneider, F.; Don, A.; Hennings, I.; Schmittmann, O.; Seidel, S.J. The effect of deep tillage on crop yield—What do we really know? Soil Tillage Res. 2017, 174, 193–204. [Google Scholar] [CrossRef]
  47. Grzesiak, S.; Grzesiak, M.T.; Hura, T.; Marcińska, I.; Rzepka, A. Changes in root system structure, leaf water potential and gas exchange of maize and triticale seedlings affected by soil compaction. Environ. Exp. Bot. 2013, 88, 2–10. [Google Scholar] [CrossRef]
  48. Grzesiak, M.T.; Janowiak, F.; Szczyrek, P.; Kaczanowska, K.; Ostrowska, A.; Rut, G.; Hura, T.; Rzepka, A.; Grzesiak, S. Impact of soil compaction stress combined with drought or waterlogging on physiological and biochemical markers in two maize hybrids. Acta Physiol. Plant. 2016, 38, 109. [Google Scholar] [CrossRef]
  49. Lipiec, J.; Horn, R.; Pietrusiewicz, J.; Siczek, A. Effects of soil compaction on root elongation and anatomy of different cereal plant species. Soil Tillage Res. 2012, 121, 74–81. [Google Scholar] [CrossRef]
  50. Kalaji, H.M.; Oukarroum, A.; Alexandrov, V.; Kouzmanova, M.; Brestic, M.; Zivcak, M.; Samborska, I.A.; Cetner, M.D.; Allakhverdiev, S.I.; Goltsev, V. Identifcation of nutrient deficiency in maize and tomato plants by in vivo chlorophyll a fluorescence measurements. Plant Physiol. Biochem. 2014, 81, 16–25. [Google Scholar] [CrossRef]
  51. Faseela, P.; Sinisha, A.K.; Brestič, M.; Puthur, J.T. Chlorophyll a fluorescence parameters as indicators of a particular abiotic stress in rice. Photosynthetica 2020, 58, 293–300. [Google Scholar] [CrossRef]
  52. Feng, W.; He, L.; Zhang, H.; Guo, B.; Zhu, Y.; Wang, C.; Guo, T. Assessment of plant nitrogen status using chlorophyll fluorescence parameters of the upper leaves in winter wheat. Eur. J. Agron. 2015, 64, 78–87. [Google Scholar] [CrossRef]
  53. Baker, N.R. Applications of chlorophyll fluorescence can improve crop production strategies: An examination of future possi-bilities. J. Exp. Bot. 2004, 55, 1607–1621. [Google Scholar] [CrossRef] [PubMed]
  54. Baker, N.R. Chlorophyll fluorescence: A probe of photosynthesis in vivo. Annu. Rev. Plant Biol. 2008, 59, 89–113. [Google Scholar] [CrossRef]
  55. Roháček, K. Chlorophyll fluorescence parameters: The definitions, photosynthetic meaning, and mutual relationships. Photosynthetica 2002, 40, 13–29. [Google Scholar] [CrossRef]
  56. Li, Y.; Hou, R.; Tao, F. Interactive effects of different warming levels and tillage managements on winter wheat growth, physiological processes, grain yield and quality in the North China Plain. Agric. Ecosyst. Environ. 2020, 295, 106923. [Google Scholar] [CrossRef]
  57. Stępień-Warda, A. Effect of soil cultivation system on the efficiency of the photosynthetic apparatus in maize leaves (Zea mays L.). Pol. J. Agron. 2020, 43, 57–62. [Google Scholar] [CrossRef]
  58. Liu, J.; Fan, Y.; Ma, Y.; Li, Q. Response of photosynthetic active radiation interception, dry matter accumulation, and grain yield to tillage in two winter wheat genotypes. Arch. Agron. Soil Sci. 2019, 66, 1103–1114. [Google Scholar] [CrossRef]
  59. Janusauskaite, D. Leaf senescence of winter wheat and spring wheat as influenced by tillage and fertilization management. Acta Physiol. Plant. 2022, 44, 74. [Google Scholar] [CrossRef]
  60. Wijewardana, C.; Reddy, K.R.; Alsajri, F.A.; Irby, T.; Krutz, J.; Golden, B. Quantifying soil moisture deficit effects on soybean yield and yield component distribution patterns. Irrig. Sci. 2018, 36, 241–255. [Google Scholar] [CrossRef]
  61. Nehe, A.S.; Misra, S.; Murchie, E.H.; Chinnathambi, K.; Sing Tyagi, B.; Foulkes, M.J. Nitrogen partitioning and remobilization in relation to leaf senescence, grain yield and protein concentration in Indian wheat cultivars. Field Crop. Res. 2020, 251, 107778. [Google Scholar] [CrossRef]
  62. Noulas, C.; Herrera, J.M.; Tziouvalekas, M.; Qin, R. Agronomic assessment of nitrogen use efficiency in spring wheat and interrelations with leaf greenness under field conditions. Comm. Soil Sci. Plant Anal. 2018, 49, 763–781. [Google Scholar] [CrossRef]
  63. Xie, Q.; Mayes, S.; Sparkes, D.L. Early anthesis and delayed but fast leaf senescence contribute to individual grain dry matter and water accumulation in wheat. Field Crop. Res. 2016, 187, 24–34. [Google Scholar] [CrossRef]
  64. Lin, Y.C.; Hu, Y.G.; Ren, C.Z.; Guo, L.C.; Wang, C.L.; Jiang, Y.; Wang, X.J.; Phendukani, H.; Zeng, Z.H. Effects of nitrogen application on chlorophyll fluorescence parameters and leaf gas exchange in naked oat. J. Integr. Agric. 2013, 12, 2164–2171. [Google Scholar] [CrossRef]
  65. Živčak, M.; Olšovska, K.; Slamka, P.; Galambošová, J.; Rataj, V.; Shao, H.B.; Brestič, M. Application of chlorophyll fluorescence performance indices to assess the wheat photosynthetic functions influenced by nitrogen deficiency. Plant Soil Environ. 2014, 60, 210–215. [Google Scholar] [CrossRef]
  66. Seddaiu, G.; Iocola, I.; Farina, R.; Orsini, R.; Iezzi, G.; Roggero, P.P. Long term effects of tillage practices and N fertilization in rainfed Mediterranean cropping systems: Durum wheat, sunflower and maize grain yield. Eur. J. Agron. 2016, 77, 166–178. [Google Scholar] [CrossRef]
  67. Kan, Z.R.; Qi, J.Y.; Liu, Q.Y.; He, C.; Virk, A.L.; Lal, R.; Zhang, H.L. Effects of conservation tillage on wheat growth duration and grain yield in the North China Plain. Arch. Agron. Soil Sci. 2020, 68, 1019–1033. [Google Scholar] [CrossRef]
  68. Viljevac Vuletic, M.; Marcek, T.; Španic, V. Photosynthetic and antioxidative strategies of flag leaf maturation and its impact to grain yield of two field-grown wheat varieties. Theor. Exp. Plant Physiol. 2019, 31, 387–399. [Google Scholar] [CrossRef]
  69. Macák, M.; Candráková, E.; Ðalovi’c, I.; Prasad, P.V.V.; Farooq, M.; Korczyk-Szabó, J.; Kováčik, P.; Šimanský, V. The influence of different fertilization strategies on the grain yield of field peas (Pisum sativum L.) under conventional and conservation tillage. Agronomy 2020, 10, 1728. [Google Scholar] [CrossRef]
  70. Woźniak, A.; Gos, M. Yield and chemical quality of spring wheat and soil properties as affected by tillage system. Plant Soil Environ. 2014, 60, 141–145. [Google Scholar] [CrossRef]
  71. Hofmeijer, M.A.J.; Krauss, M.; Berner, A.; Peigne, J.; Mäder, P.; Armengot, L. Effects of reduced tillage on weed pressure, nitrogen availability and winter wheat yields under organic management. Agronomy 2019, 9, 180. [Google Scholar] [CrossRef]
  72. Cociu, A.I.; Alionte, E. Effect of different tillage systems on grain yield and its quality of winter wheat, maize and soybean under different weather conditions. Rom. Agric. Res. 2017, 34, 59–67. [Google Scholar]
  73. Woźniak, A.; Rachoń, L. Effect of tillage systems on the yield and quality of winter wheat grain and soil properties. Agriculture 2020, 10, 405. [Google Scholar] [CrossRef]
  74. Fernández, F.G.; Sorensenb, B.A.; Villamil, M.B. A comparison of soil properties after five years of no-till and strip-till. Agron. J. 2015, 107, 1339–1346. [Google Scholar] [CrossRef]
  75. Malhi, S.S.; Grant, C.A.; Johnston, A.M.; Gill, K.S. Nitrogen fertilization management for no-till cereal production in Canadian Great Plains: A review. Soil Tillage Res. 2001, 60, 101–122. [Google Scholar] [CrossRef]
  76. Oorts, K.; Merckx, R.; Gréhan, E.; Labreuche, J.; Nicolardot, B. Determinants of annual fluxes of CO2 and N2O in long-term no-tillage and conventional tillage systems in northern France. Soil Tillage Res. 2007, 95, 133–148. [Google Scholar] [CrossRef]
  77. Cooper, H.V.; Sjögersten, S.; Lark, R.M.; Girkin, N.T.; Vane, C.H.; Calonego, J.C.; Rosolem, C.; Mooney, S.J. Long-term zero-tillage enhances the protection of soil carbon in tropical agriculture. Eur. J. Soil Sci. 2021, 72, 2477–2492. [Google Scholar] [CrossRef]
  78. Zhang, X.; Gregory, A.S.; Whalley, W.R.; Coleman, K.; Neal, A.L.; Bacq-Labreuil, A.; Mooney, S.J.; Crawford, J.W.; Soga, K.; Illangasekare, T.H. Relationship between soil carbon sequestration and the ability of soil aggregates to transport dissolved oxygen. Geoderma 2021, 403, 115370. [Google Scholar] [CrossRef]
  79. Pringle, M.J.; Lark, R.M. Spatial analysis of model error, illustrated by soil carbon dioxide emissions. Vadose Zone J. 2006, 5, 168–183. [Google Scholar] [CrossRef]
  80. Flanagan, L.B.; Johnson, B.G. Interacting effects of temperature, soil moisture and plant biomass production on ecosystem respiration in a northern temperate grassland. Agric. For. Meteorol. 2005, 130, 237–253. [Google Scholar] [CrossRef]
  81. Al-Kaisi, M.M.; Yin, X. Tillage and crop residue effects on soil carbon and carbon dioxide emission in corn–soybean rotations. J. Environ. Qual. 2005, 34, 437–445. [Google Scholar] [CrossRef]
  82. Curiel Yuste, J.; Janssens, I.A.; Carrara, A.; Meiresonne, L.; Ceulemans, R. Interactive effects of temperature and precipitation on soil respiration in a temperate maritime pine forest. Tree Physiol. 2003, 23, 1263–1270. [Google Scholar] [CrossRef]
  83. Lee, M.; Nakane, K.; Nakatsubo, T.; Mo, W.; Koizumi, H. Effects of rainfall events on soil CO2 flux in a cool temperate deciduous broad-leaved forest. Ecol. Res. 2002, 17, 401–409. [Google Scholar] [CrossRef]
  84. Anokye, J.; Abunyewa, A.A.; Jørgensen, U.; Kaba, J.S.; Twum-Ampofo, K.; Dawoe, E.; Barnes, V.R.; Plauborg, F.; Pedersen, S.M.; Berg, T.R.; et al. Mitigation of greenhouse gas emissions through shade systems and climate-smart soil fertility interventions in cocoa landscapes in the semi-deciduous ecological zone of Ghana. Soil Adv. 2024, 1, 100001. [Google Scholar] [CrossRef]
  85. Sainju, U.M.; Jabro, J.D.; Stekens, W.B. Soil carbon dioxide emission and carbon content as affected by irrigation, tillage, cropping system, and nitrogen fertilization. J. Environ. Qual. 2008, 37, 98–106. [Google Scholar] [CrossRef] [PubMed]
  86. Feiziene, D.; Feiza, V.; Kadziene, G.; Vaideliene, A.; Povilaitis, V.; Deveikyte, I. CO2 fluxes and drivers as affected by soil type, tillage and fertilization. Acta Agric. Scand. Sect. B Soil Plant Sci. 2012, 62, 311–328. [Google Scholar] [CrossRef]
  87. Wilson, H.M.; Al-Kaisi, M.M. Crop rotation and nitrogen fertilization effect on soil CO2 emissions in central Iowa. Appl Soil Ecol. 2008, 39, 264–270. [Google Scholar] [CrossRef]
  88. Curtin, D.; Wang, H.; Selles, F.; McConkey, B.G.; Campbell, C.A. Tillage effects on carbon fluxes in continuous wheat and fallow–wheat rotations. Soil Sci. Soc. Am. J. 2000, 64, 2080–2086. [Google Scholar] [CrossRef]
  89. Jia, S.; Zhang, X.; Chen, X.; McLaughlin, N.B.; Zhang, S.; Wei, S.; Sun, B.; Liang, A. Long-term conservation tillage influences the soil microbial community and its contribution to soil CO2 emissions in a Mollisol in Northeast China. J. Soils Sediments 2015, 16, 1–12. [Google Scholar] [CrossRef]
  90. Rutkowska, B.; Szulc, W.; Sosulski, T.; Skowrońska, M.; Szczepaniak, J. Impact of reduced tillage on CO2 emission from soil under maize cultivation. Soil Tillage Res. 2018, 180, 21–28. [Google Scholar] [CrossRef]
  91. Omonode, R.A.; Vyn, T.J.; Smith, D.R.; Hegymegi, P.; Gál, A. Soil carbon dioxide and methane fluxes from long-term tillage systems in continuous corn and corn–soybean rotations. Soil Tillage Res. 2007, 95, 182–195. [Google Scholar] [CrossRef]
  92. Fortin, M.C.; Rochette, P.; Pattey, E. Soil carbon dioxide fluxes from conventional and no-tillage small-grain cropping systems. Soil Sci. Soc. Am. J. 1996, 60, 1541–1547. [Google Scholar] [CrossRef]
  93. Elder, J.W.; Lal, R. Tillage effects on gaseous emissions from an intensively farmed organic soil in North Central Ohio. Soil Tillage Res. 2008, 98, 45–55. [Google Scholar] [CrossRef]
  94. Shakoor, A.; Shahbaz, M.; Farooq, T.H.; Sahar, N.E.; Shahzad, S.M.; Altaf, M.M.; Ashraf, M. A global meta-analysis of greenhouse gases emission and crop yield under no-tillage as compared to conventional tillage. Sci. Total Environ. 2021, 750, 142299. [Google Scholar] [CrossRef] [PubMed]
  95. Gelybó, G.; Barcza, Z.; Dencső, M.; Potyó, I.; Kása, I.; Horel, Á.; Pokovai, K.; Birkás, M.; Kern, A.; Hollós, R.; et al. Effect of tillage and crop type on soil respiration in a long-term field experiment on chernozem soil under temperate climate. Soil Tillage Res. 2022, 216, 105239. [Google Scholar] [CrossRef]
  96. Dong, W.; Liu, E.; Wang, J.; Yan, C.; Li, J.; Zhang, Y. Impact of tillage management on the short- and long-term soil carbon dioxide emissions in the dryland of Loess Plateau in China. Geoderma 2017, 307, 38–45. [Google Scholar] [CrossRef]
  97. Regina, K.; Alakukku, L. Greenhouse gas fluxes in varying soils types under conventional and no-tillage practices. Soil Tillage Res. 2010, 109, 144–152. [Google Scholar] [CrossRef]
Figure 1. Weather conditions in the months of conducting experimental measurements in 2023 at the meteorological station belonging to Agricultural Experimental Station Brody (52.43, 16.30).
Agronomy 14 02220 g001
Figure 2. Average Soil Moisture (%) and Soil Temperature (°C) in a soil classified as an Albic Luvisol under winter wheat in subsequent Growth Stages (GS): Shooting (BBCH 32), Flowering (BBCH 65); Medium Milk (BBCH 75) in 2023. 0 N—No fertilization; 130 N–130 kg N∙ha−1. Letters a–e indicate homogeneous groups within a given graph.
Agronomy 14 02220 g002
Figure 3. Soil Respiration measurements under winter wheat in 2023: Water flux—Netto H2O exchange rate (mmol m−2 s−1); CO2 flux—NCER-Netto CO2 Exchange Rate (µmol m−2 s−1), ∆C (µmol mol−1) in a soil classified as an Albic Luvisol. (a) CT—Conventional Tillage, (b) NT—No Tillage. Nitrogen rate: 0 N, 130 N (130 kg N∙ha−1). Growth Stages (GS): Shooting (BBCH 32), Flowering (BBCH 65); Medium Milk (BBCH 75). The error bars for each mean value are the 95% confidence interval. p-value: W flux (Tillage 0.5198; Fertilization 0.0296; GS < 0.0001; Fertilization × GS 0.8154); CO2 flux (Tillage 0.0266; Fertilization 0.0026; GS < 0.001; Fertilization × GS 0.3945); ∆C (Tillage 0.0270; Fertilization 0.0028; GS < 0.000; Fertilization × GS 0.4601).
Agronomy 14 02220 g003
Figure 4. Chlorophyll fluorescence measurements of winter wheat plants in 2023: minimum fluorescence (F0), variable fluorescence (Fv), maximum fluorescence (Fm), and maximum photochemical efficiency of PSII (Fv/m), unnominated units. (a) CT—Conventional Tillage, (b) NT—No Tillage. Nitrogen rate: 0 N, 130 N (130 kg N∙ha−1). Growth Stages (GS): Shooting (BBCH 32), Flowering (BBCH 65); Medium Milk (BBCH 75). The error bars for each mean value are the 95% confidence interval. p-value: F0 (Tillage 0.5467; Fertilization 0.2202; GS < 0.0001; Fertilization × GS 0.1278); Fv (Tillage 0.0304; Fertilization 0.0024; GS 0.0025; Fertilization × GS 0.1777); Fm (Tillage 0.0152; Fertilization 0.0014; GS < 0.0004; Fertilization × GS 0.4188); Fv/m (Tillage 0.0146; Fertilization 0.0060; GS < 0.0001; Fertilization × GS 0.0193).
Agronomy 14 02220 g004
Figure 5. Normalized Difference Vegetation Index- NDVI for winter wheat in 2023. (a) CT—Conventional Tillage, (b) NT—No Tillage. Nitrogen rate: 0 N, 130 N (130 kg N∙ha−1). Growth Stages (GS): Shooting (BBCH 32), Flowering (BBCH 65), Medium Milk (BBCH 75). The error bars for each mean value are the 95% confidence interval. p-value: Tillage 0.4824; Fertilization 0.0005; GS < <0.0001; Fertilization × GS 0.0603).
Agronomy 14 02220 g005
Figure 6. Grain Yield of winter wheat in 2023. CT—Conventional Tillage, NT—No Tillage. Nitrogen ate: 0 N, 130 N (130 kg N∙ha−1). The error bars for each mean value are the 95% confidence interval. p-value: Tillage 0.6546; Fertilization 0.0028).
Agronomy 14 02220 g006
Table 1. Experimental scheme.
PlotsFactor IFactor II
Tillage SystemFertilization
(kg·ha−1)
Time of Measurements
BBCHGrowth PhaseDate
CT—Conventional Tillage130 N32shooting10.05.2023
CT—Conventional Tillage0 N65flowering01.06.2023
NT—No Tillage0 N75medium milk 06.07.2023
NT—No Tillage130 N
Table 2. Chemical properties of the soil (Albic Luvisol) in the 0–20 cm layer: pH, SOC, content of available forms of p, K and Mg.
Tillage SystemFertilizationP2O5 (mg/100 g)K2O (mg/100 g)Mg (mg/100 g)pH in 1M KClSOC%
CT0 N>3510.76.06.60.90
CT130 N>3511.25.66.60.86
NT0 N>3515.18.36.80.99
NT130 N>3515.97.86.61.03
CT—Conventional Tillage; NT—No Tillage.
Table 3. Impact of Soil Moisture and Temperature on Soil Respiration and Chlorophyll Fluorescence parameters for winter wheat plants: p-value Analysis.
Parameterp Values
Average Soil Moisture (%)Soil Temperature (°C)
W flux (mmol m−2 s−1)0.77000.3170
CO2 flux (µmol m−2 s−1)<0.00010.3560
∆C (µmol mol−1)<0.00010.4520
F00.00470.2788
Fm0.91770.0231
Fv0.65990.0320
Fv/m0.06790.0595
Soil Respiration measurements: W flux—Water flux—Netto H2O exchange rate; CO2 flux—NCER-Netto CO2 Exchange Rate; ∆C. Chlorophyll fluorescence measurements: minimum fluorescence (F0), variable fluorescence (Fv), maximum fluorescence (Fm) and maximum photochemical efficiency of PSII (Fv/m)—unnominated units.
Disclaimer/Publisher’s Note: The statements, opinions and data contained in all publications are solely those of the individual author(s) and contributor(s) and not of MDPI and/or the editor(s). MDPI and/or the editor(s) disclaim responsibility for any injury to people or property resulting from any ideas, methods, instructions or products referred to in the content.

