Abstract
Tomato is an economically and nutritionally important crop and is vulnerable to drought. Under drought, soil microbes provide beneficial effects to plants and alleviate stress. We suggest a reconstruction of the soil microbiome using biofumigation, an organic farming method, to protect tomatoes. In this study, we treated soil in four ways with varied concentrations: biofumigation (BF0.5, BF1.0, and BF1.5), green manure treatment (GM0.5, GM1.0, and GM1.5), autoclaving (AT), and non-treatment (NT). Tomatoes were grown in each treated soil, subjected to water shortages, and were rewatered. We investigated plant phenotypes and soil properties, focused on microbial communities using the Illumina MiSeq® System. Relative Water Content and malondialdehyde were measured as plant stress. The results showed that the 1% biofumigation treatment had 105% and 108.8% RWC during drought and after rewatering, compared to the non-treated soil. The highest concentration, the 1.5% treatment, lowered RWC due to an excess of NO3−, K+, Ca2+, and decreased alpha diversity. Through PLS-PM, bacterial alpha diversity was found to be the largest factor in the increase in RWC (coefficient = 0.3397), and both biofumigant and green manure significantly increased the Shannon index and observed species. In addition, biofumigation increased beneficial functional genes (purine metabolism, pyrimidine metabolism, carbon fixation pathways, and zeatin bio-synthesis) of soil microorganisms (p value < 0.05, <0.01, >0.05, and <0.05, respectively). The 1% biofumigation treatment enriched the core five genera of the fungal network (Enterocarpus, Aspergillus, Leucothecium, Peniophora, and Wallemia) of the fungal network which might suppress the most dominant pathogen, Plectosphaerella. In conclusion, biofumigation-derived soil microbiome alterations have the potential to lower plant stress under drought.
1. Introduction
Tomato (Solanum lycopersicum L.) is a cash crop consumed worldwide and plays important economic and nutritional roles. Global production amounts to 161.7 million metric tons per year, with a market value of USD 5.9 billion dollars [1]. Tomatoes are greatly restricted by drought and are one of the most water-demanding crops [2]. Grozeva et al. reported that a 50% water shortage reduced productivity by 54.2% or 59.3%, depending on the growth phase [3]. Drought severely disrupts the physiology, anatomy, and biochemistry of plants [4], including photosynthesis, nutrient uptake, and the management of oxidative stress [5]. In agriculture, drought is one of the most influential risks, owing to its intensity and long duration [6]. Therefore, drought must be managed to ensure successful tomato cultivation. Most drought management failures derive from limited water supply in specific climates, so any way to address the situation before it occurs is encouraging.
The soil microbiome contributes significantly to plant health under drought conditions. A well-known component is arbuscular mycorrhizal fungi (AMF), which extend plant root systems to absorb water and inorganic salts [7]. The glomalin produced by AMF helps stabilize soil organic carbon [8,9] and promotes soil aggregate formation [10], aiding plants in recovering from stress. Specifically, under drought conditions, AMFs ameliorate stress by increasing biomass production, enhancing nitrogen (N) and phosphorus (P) uptake, improving stomatal conductance, preventing oxidative stress, and upregulating cytochrome P450 genes in tomato plants [11]. Inoculation with AMF has been shown to improve soybean plant growth, chlorophyll content, nutrient uptake, yield, and the activity of soil enzymes (dehydrogenases and phosphatases) under drought stress [12]. In addition, plant growth-promoting rhizobacteria (PGPR) exhibit activities such as the production of indole-3-acetic acid (IAA), gibberellic acid [13], and proline [14], as well as phosphate solubilization [15], all of which help mitigate drought stress. Another important role of PGPR is the production of 1-aminocyclopropane-1-carboxylate (ACC) deaminase. This enzyme degrades ACC, a direct precursor of ethylene in plants, thereby reducing the amount of ethylene synthesized [16]. By regulating ethylene levels in water-stressed environments—including flooding and drought—PGPR can prevent negative effects on shoot and leaf development, reduce growth inhibition, and increase stress tolerance [17,18]. Maintaining a healthy soil microbial community under drought conditions can alleviate plant stress.
Biofumigation is an effective means of modifying the soil microbiome. Biofumigation is an eco-friendly soil amendment method widely used in many countries. It can be carried out by growing Brassicaceae plants in fallow fields and then burying them in the soil to react the soil with the volatile organic compounds they contain. The active substances are mainly glucosinolates (GSLs), which are known to suppress soil-borne pathogens and improve the quality of the following crop [19]. Chemical fumigation also acts to control pathogens, but it is not commonly used in Korea, due to its cost. In addition, its non-selective ability to eliminate microorganisms can have a negative impact on sustainable agriculture in the long run [20,21]. However, biofumigation is encouraging in that it is cost-effective and environmentally friendly. Biofumigation is not only about pathogen suppression, but also about more complex changes in the soil microbiome. Long-term biofumigation application was found to enrich AMF, increasing soil aggregate stability and soil carbon [22]. OTU of the mycobiome followed by biofumigation was abundant to the level of undisturbed soil [23]. Beneficial bacteria that can promote plant growth were increased [24]. The network of bacteria and fungi became highly connected in 1% biofumigation treatment [25]. We adopted biofumigation to organize a healthy soil ecology that will not be destroyed by drought.
Biofumigation, if it modifies the soil microbiome appropriately, could prevent the destruction of soil microbes by drought. Furthermore, it may indirectly offer the possibility of improving plant health. Since biofumigant treatment results in complex changes that span nutritional, biological, and abiotic factors, it is important to understand how these factors influence each other and ultimately alter plant phenotypes under drought conditions. We explored how (1) biofumigation, conventional fumigation, and a green manure treatment (similar to biofumigation but containing no active substances) each alter the soil. Plant stress, soil properties, and changes in microbial communities will be investigated as factors. And then we investigated (2) which factors contribute most to stress reduction. This study provides new applications for biofumigation-induced changes in the soil microbiome. When eco-friendly farming methods can compensate for drought damage, it will help the practice of sustainable agriculture.
2. Materials and Methods
2.1. Preparation of Treated Soil and Plant Materials
The initial soil was obtained from a greenhouse where tomatoes were monocultured for several years (35°52′53.8 N; 128°48′44.3 E). We treated the soils with two types of biomass (biofumigant; BF and green manure; GM) at three different concentrations (0.5, 1.0, and 1.5% [w/w, dry weight]). Frozen green mustard (Brassica juncea L. cultivar “Jeil Cheong”) was used as a biofumigant and spinach (Spinacia oleracea L. cultivar “Namhae”) was used as green manure. Spinach was selected because of its lack of active substances and phylogenetic similarity to green mustard so that we could compare the two. The frozen biomass was ground, homogenized, and mixed with the initial soil at each concentration. The mixtures were watered at 50% water holding capacity [26] and immediately sealed to prevent the leakage of volatile active substances. Afterward, they were left for two weeks, interacted with each other, and had a 1-month drying period to remove the phytotoxicity of volatile compounds. Non-treated (NT) soil was subjected to the same process without the addition of biomass. Autoclaved soil (AT) was generated to mimic classic fumigation and was sterilized twice using an autoclave at 121 °C for 15 min.
We divided the treatments (BF0.5, BF1.0, and BF1.5; GM0.5, GM1.0, and GM1.5; AT, autoclaved soil treatment; NT, non-treated soil treatment) into six replications, 1 kg each. Each pot was transplanted with tomato (Solanum lycopersicum L. cultivar “Shinlovely 256”) seedlings, with one sample dying from transplantation shock in GM0.5. Plastic pots had specific sizes to ensure that all the plants were grown under the same conditions: height of 13 cm, upper diameter of 12 cm, and lower diameter of 10 cm. The growth chamber was maintained at 25 °C and 23% humidity with a 15 h light–9 h dark cycle. Tomatoes were grown from November 2022 to February 2023. When they reached the 50% flowering stage, when plants are vulnerable to stress, they were kept from watering for two weeks. We then watered them again to investigate their resilience. The phenotype was measured at two time points: immediately before and after rewatering. Soil samples for DNA extraction were obtained by sacrificing the plants.
2.2. Plant Stress Markers
Relative Water Content (RWC) and malondialdehyde (MDA) content were measured at both time points during drought and after rewatering. RWC was calculated using the method described by Raja et al. [27]:
where w1, w2, and w3 refer to the fresh, turgid, and dry weights of the leaves, respectively. Leaf MDA was prepared using the MDA Colorimetric Assay Kit (Plant Samples, Elabscience Biotechnology Inc., Houston, TX, USA) and quantified using the iMark™ Microplate Absorbance Reader (Bio-Rad, Richmond, CA, USA).
RWC (%) = (w1 − w3)/(w2 − w3) × 100
2.3. Soil Physicochemical Properties Analysis
The field capacity was calculated by subtracting the air-dried weight from the fully watered weight and then dividing it by the volume of the soil. For nutrition analysis, soil samples were processed using a modified method described by Thomas et al. [28]. The samples were diluted with deionized water (resistivity of 18 MΩ), shaken, and sonicated for 1 h. After the samples were settled, we transferred the supernatant and filtered it using a Nylon Syringe Filter with a pore size of 0.45 μm (Hyundai Micro, Anseong-si, Gyeonggi-do, Republic of Korea). The filtered samples were subsequently analyzed using a Dionex ICS-5000 system (Thermo Fisher Scientific, Waltham, MA, USA). Cations were separated using a Dionex IonPac CS12A column (4 × 250 mm; Thermo Fisher Scientific, Waltham, MA, USA) with 20 mM methanesulfonic acid as the eluent at a flow rate of 1.0 mL/min. Anions were separated using an IonPac AS19 column with 20 mM potassium hydroxide. The eluent cations and anions were suppressed using Dionex SC-CERS 500 (4 mm; Thermo Fisher Scientific, Waltham, MA, USA) and Dionex CRD 200, respectively. All samples were quantified by standard curves, using nitrate (NO3−), potassium (K+), and calcium (Ca2+) ion standard solutions (Kanto Chemicals Co., Tokyo, Japan). The measured nutrient content was recalculated considering the dilution and initial water content of the samples.
2.4. Extraction of Soil DNA, Library Preparation, and Sequencing
The soil samples for microbiome analysis were collected from the bulk and rhizosphere of each pot and immediately stored at −80 °C. We used a modified protocol for sampling rhizosphere soil described by Zhang et al. [29]. The sampled roots were placed in an empty conical tube and briefly vortexed, and the bulk soil that fell off was discarded. The samples were then vortexed into new tubes containing 40 mL of PBS buffer (pH 7.4), and centrifuged at 4000× g for 10 min, and the settled pellet was used in the next step. DNA was extracted using the DNeasy PowerSoil Pro Kit (QIAGEN, Hilden, Germany) and quantified using a Qubit Flex Fluorometer system (Thermo Fisher Scientific, Waltham, MA, USA). DNA amplification was performed using PCR systems that targeted both the V4 hypervariable region of the 16S rRNA gene and the internal transcribed spacer 1 (ITS1) region. Universal primer pairs (515F/805R and ITS86F/ITS4R) were used for it. The amplified DNA set was cleaned using Beckman Coulter AMPure XP (Thermo Fisher Scientific, Waltham, MA, USA) and amplified again to tag the different barcodes of each sample. The completed libraries were sequenced using the Illumina MiSeq® System (Illumina, San Diego, CA, USA) at Kyungpook National University’s NGS Core Facility (Daegu, South Korea). Raw sequences were deposited in the NCBI Sequence Read Archive (SRA) database under BioProject ID number PRJNA1054121 and available online at https://www.ncbi.nlm.nih.gov/bioproject/PRJNA1054121 (accessed on 18 December 2023).
2.5. Data Analysis
Sequencing data were analyzed using Quantitative Insights into Microbial Ecology 2 (QIIME2; version 2023.2.0). All the raw sequences filtered out low-quality sequences and amplicon sequence variant (ASV) tables were constructed using DADA2 (version 1.18). Each ASV was assigned to SILVA (v138) and UNITE (ver. 9) for the bacterial and fungal classifications, respectively. Rare taxa with a median frequency of 0.1% or less were removed for quality control. The samples were normalized to the lowest depth for further analysis. The rarefaction curves were confirmed to saturate in all samples.
Statistical analyses were performed using R statistical software (version 4.2.2). All differences in plant phenotypes and soil properties were tested using analysis of variance (ANOVA), followed by the Bonferroni post hoc test of the agricolae package. The Shannon index of the ASV level was calculated to represent alpha diversity using the vegan package. Functional gene predictions of the soil microbiome were generated using PICRUSt2 (version 2.5.1). They were then assigned to the Kyoto Encyclopedia of Genes and Genomes (KEGG) pathway database. The bacterial community phenotypes were predicted using BugBase which can be available at https://bugbase.cs.umn.edu/index.html (accessed on 12 June 2023). Correlation plots were generated using the corrplot package and validated using Pearson’s correlation coefficient. The primer on partial least squares path modeling (PLS-PM) was generated using the plspm package and validated for reliability using several parameters: Composite Reliability, coefficient of determination, and Average Variance Extracted [30]. Mycobiota networks were constructed using the microeco package and the threshold for relative abundance was 0.001%. Networks were weighted using both Pearson and Spearman correlations and subsequently visualized using Gephi 0.9.7.
3. Results
3.1. Plant Stress under Drought
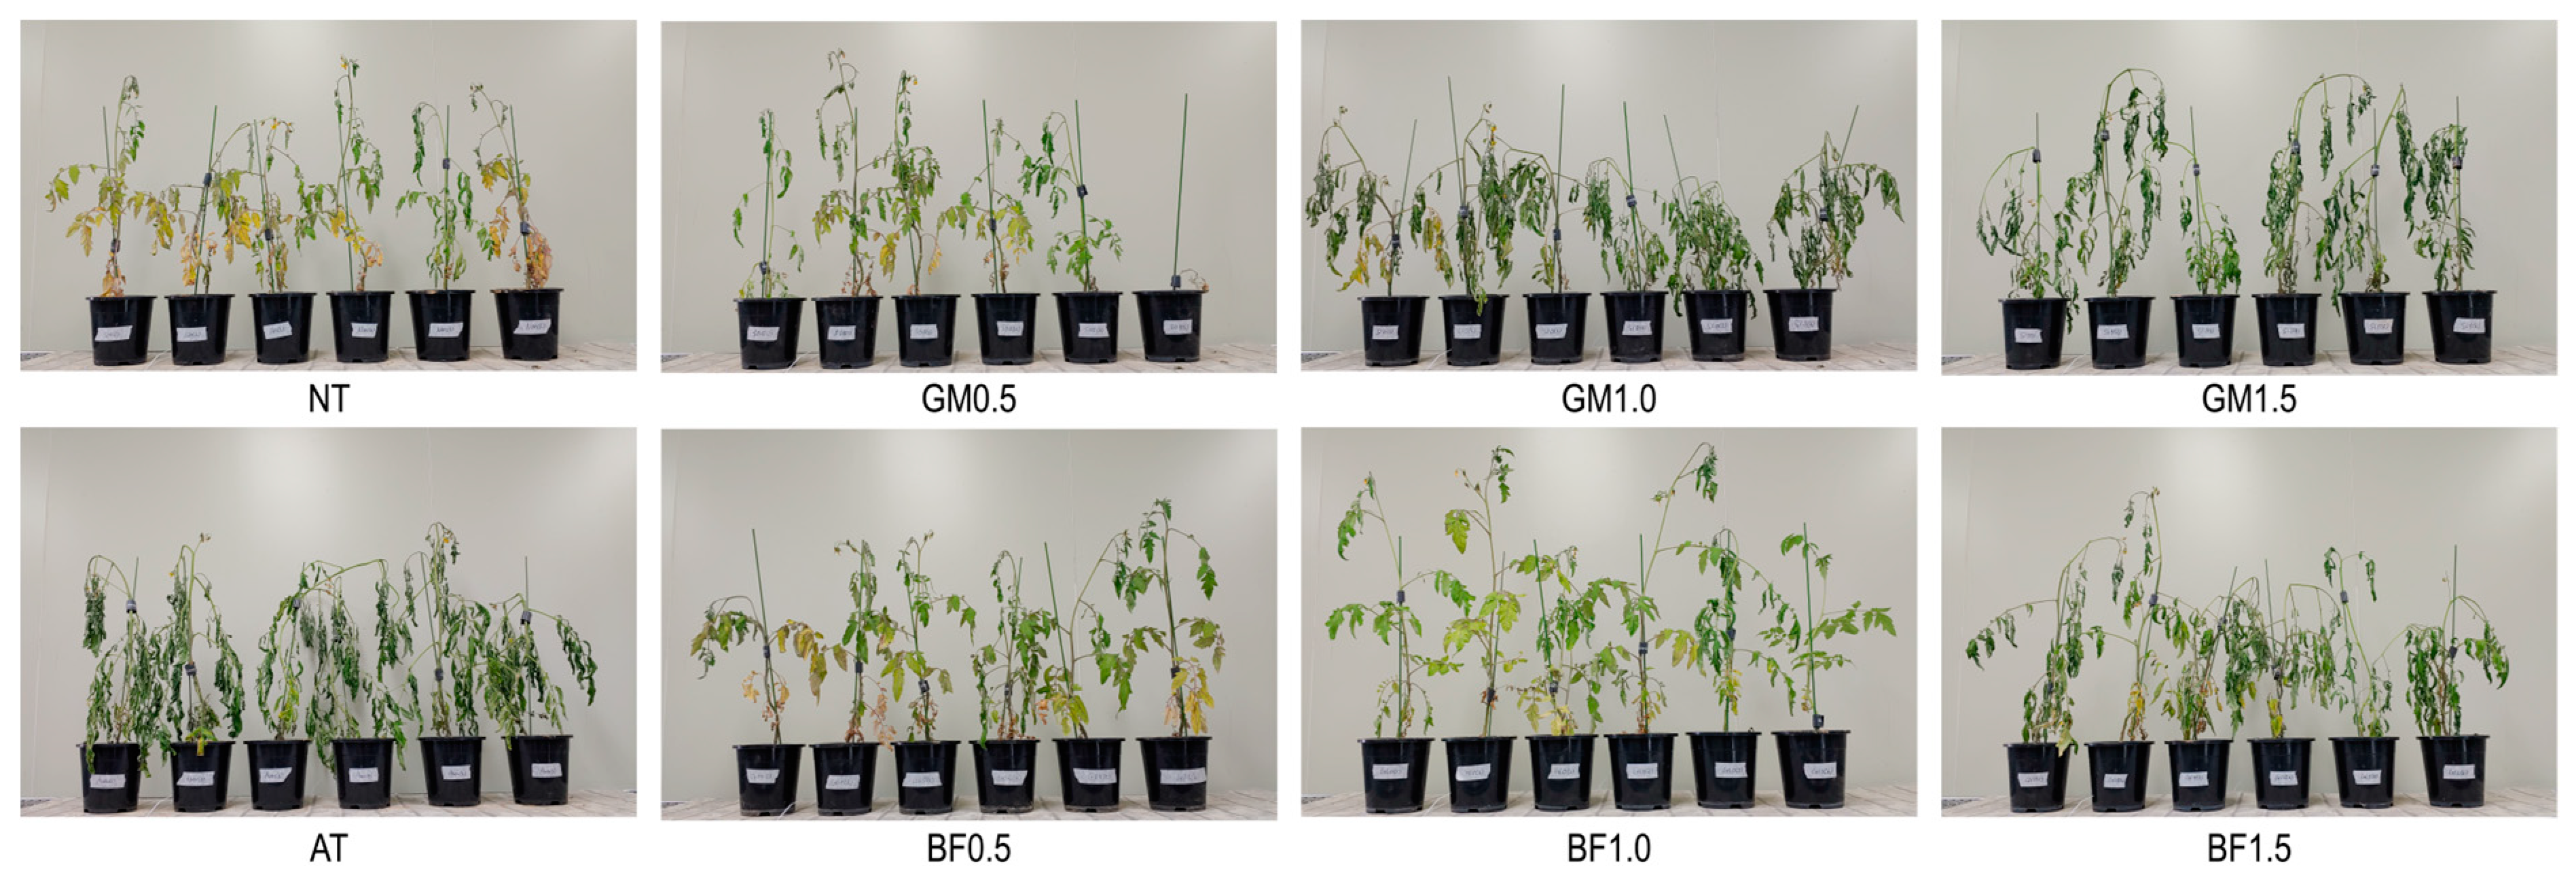
No drought symptoms such as rolling leaves, yellowing, or wilting were found in BF1.0 plants at either stage. The other treatments displayed two stress phenotypes: yellowing (NT, GM0.5, and BF0.5) and shrunken and curled leaves (AT, GM1.0, GM1.5, and BF1.5; Figure 1).
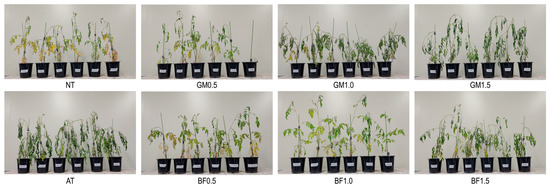
Figure 1.
Plant phenotypes for each treatment stressed by water shortage for 2 weeks. BF, biofumigated soil; GM, green manure soil treatment; AT, autoclaved soil treatment; NT, non-treated soil treatment.
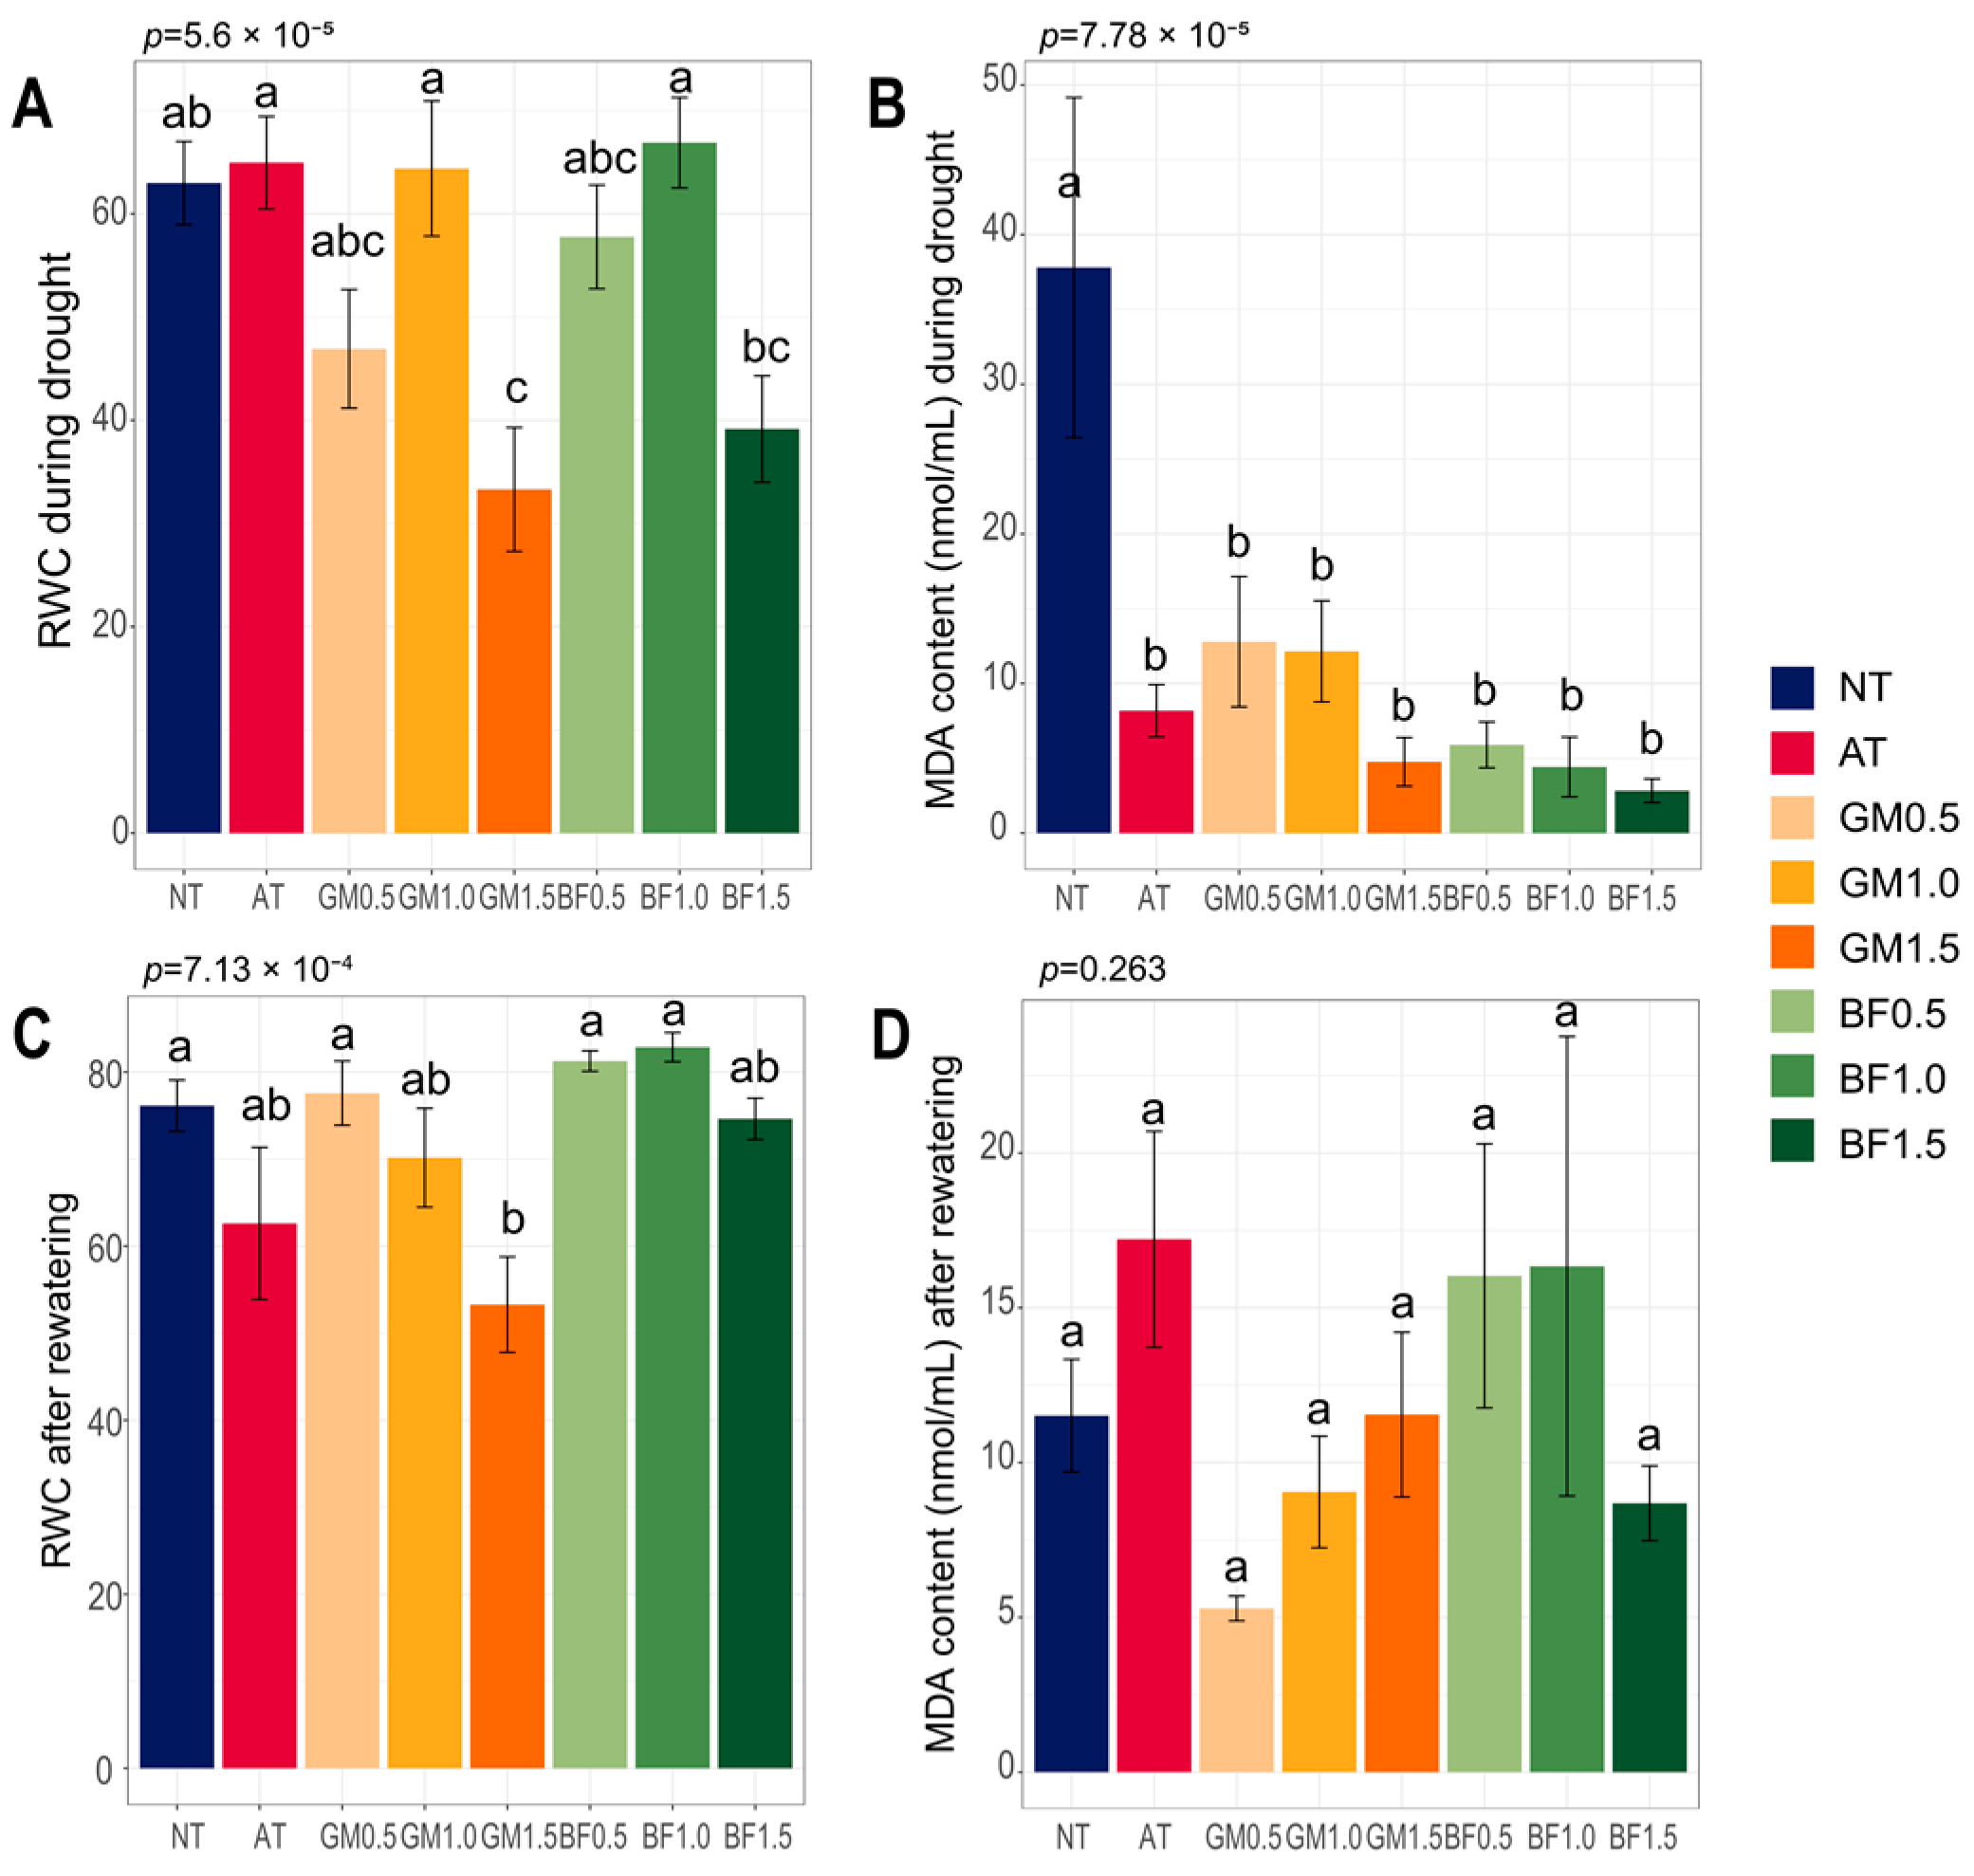
RWC is an indicator of leaf health under a water deficit. While our results showed some inconsistency within treatments, we found improvement compared to non-treatment: AT (102%), GM1.0 (101.3%), and BF1.0 (105%) during drought, GM0.5 (101.9%), BF0.5 (106.7%), BF1.0 (108.8%) after rewatering. BF1.0 had the best values in both phases. The 1.5% doses had worse effects than lower doses, with the lowest value of GM1.5 (Figure 2A,C). MDA, an oxidative stress marker, was notably high in NT plants during drought. No significant differences were found after rewatering (Figure 2B,D). Our results suggest that soil biofumigated at a specific concentration relieved plant stress.
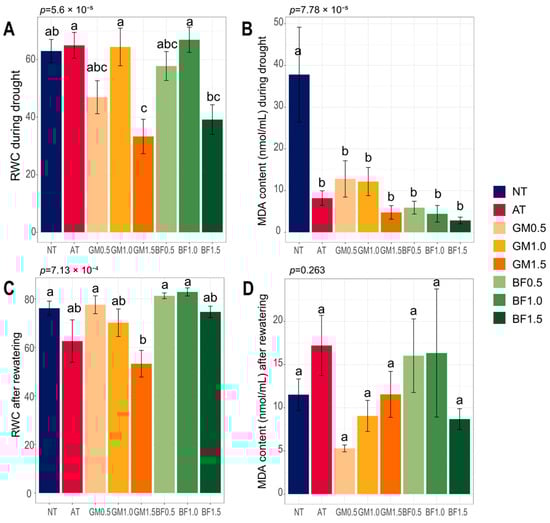
Figure 2.
Plant stress markers for each treatment. RWC (A,C) and MDA content (B,D), during drought and after rewatering. BF, biofumigated soil; GM, green manure soil treatment; AT, autoclaved soil treatment; NT, non-treated soil treatment. Each color indicates its group as described in the legend on the right side of the barplot. Significance was tested using ANOVA and the p values are above the bars. Letters above the boxes indicate the difference calculated by Bonferroni’s method in which the p value is <0.05. Error bars indicate the standard errors.
3.2. Soil Physicochemical Properties and Plant Growth
We assessed soil physicochemical properties. Nutrient quantification targeted NO3−, K+, and Ca2+ in water-soluble formations that are available to plants. GM1.5 showed notably high nutrition in all three groups (Table 1).

Table 1.
Soil physicochemical properties of each treatment.
Field capacity is a soil’s ability to retain moisture, a general element of the drought. However, in our results, it did not determine the drought severity. For instance, the highest field capacity of AT resulted in the best growth (dry weight and height), but not the lowest stress. In contrast, BF1.0, which had the highest RWC, showed the lowest field capacity (Table 1 and Table 2).
Table 2.
Plant growth performances of each treatment.
3.3. Microbial Composition, Diversity, and Pathogen Control
Each treatment induced dynamic changes in the microbial community. Alpha diversity, dominant genera, and predicted functional genes were used to describe the changes.
We calculated two indices of alpha diversity: the Shannon index and observed species. In bacterial communities, both indices increased in all biomass treatments (BFs and GMs) compared to the non-treatment. At the same time, they displayed a concentration-dependent decrease, with GM1.5 being the lowest. Autoclaving lowered both diversities (Figure 3A,B). GM1.5 had also the lowest values among the biomass treatments in mycobiota. AT had a minimum for both indices of mycobiota (Figure 3C,D).
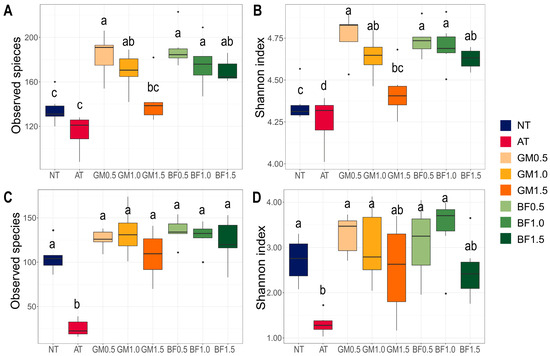
Figure 3.
Alpha diversities of microbial communities following each treatment. Observed species (A,C) and Shannon index (B,D) in bacterial (A,B) and fungal communities (C,D) were calculated. BF, biofumigated soil; GM, green manure soil treatment; AT, autoclaved soil treatment; NT, non-treated soil treatment. Each color indicates its group as described at the legend on the right side of the barplot. Significance was tested using analysis of variance (ANOVA). Letters above the boxes indicate the difference calculated by Bonferroni’s method in which the p value is <0.05.
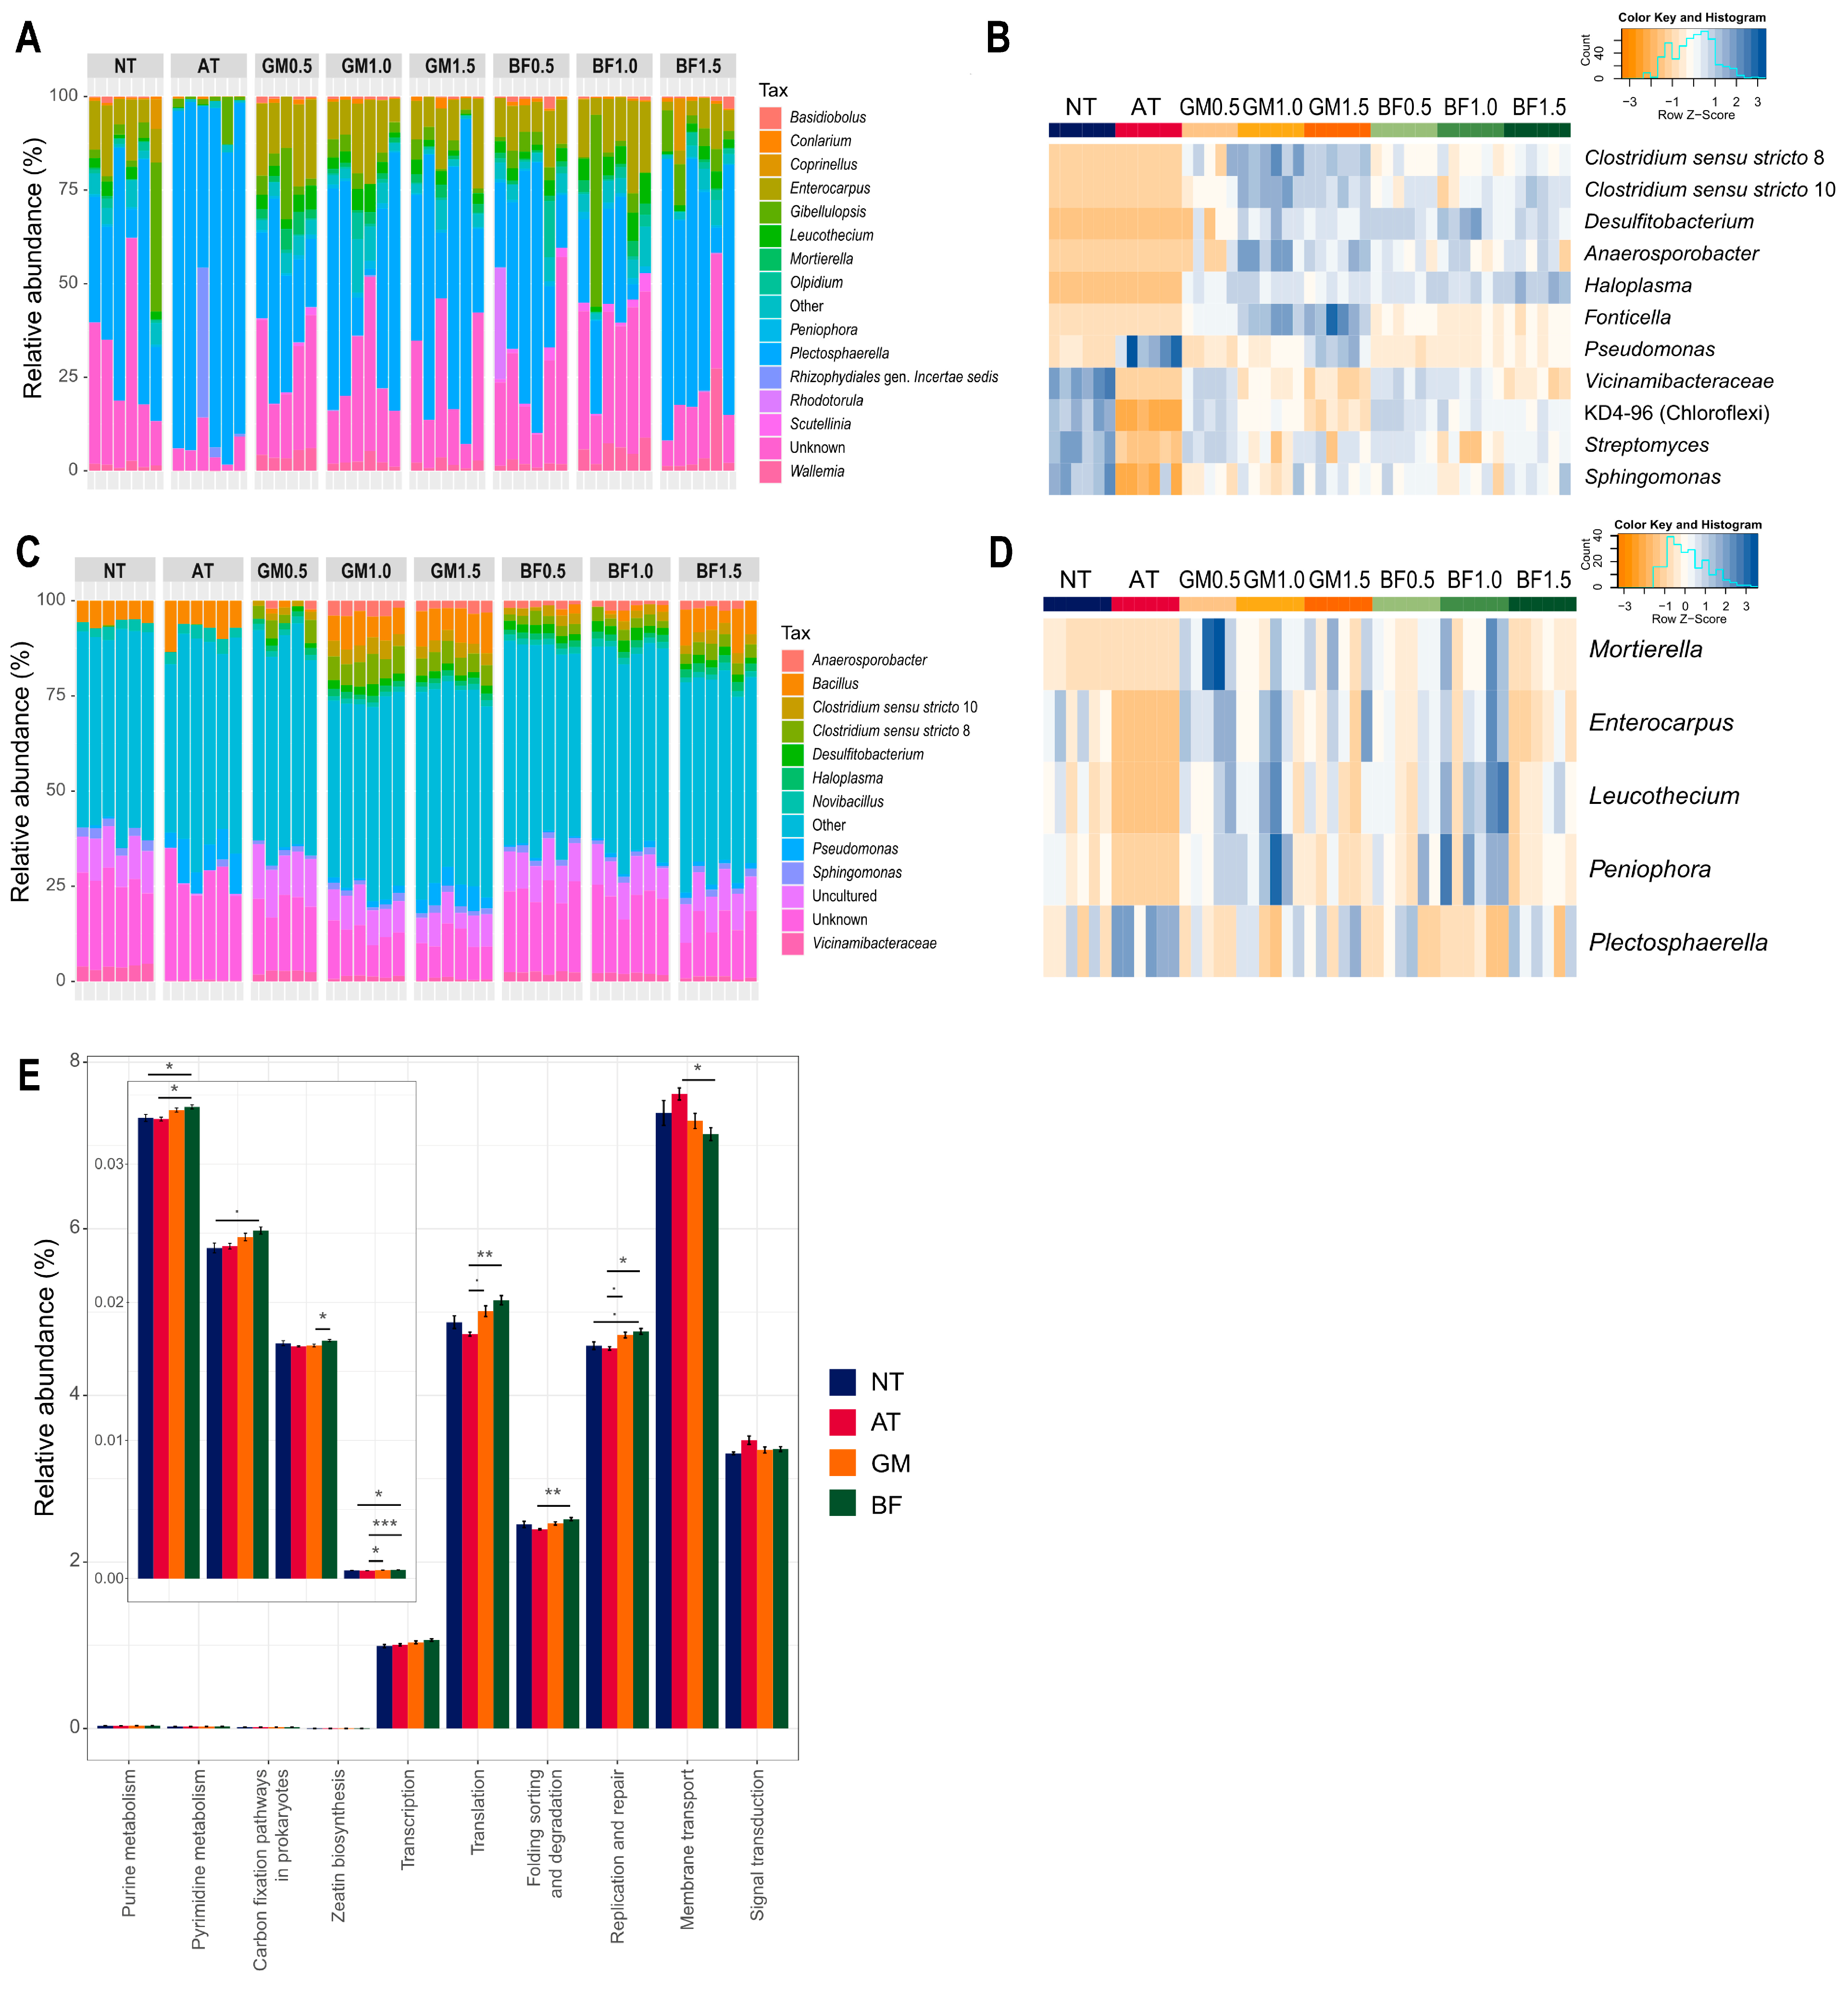
Microbial composition analysis revealed that all biomass treatments had several enriched genera, including Anaerosporobacter, Desulfitobacterium, Clostridium sensu stricto 10, and Clostridium sensu stricto 8. Neither non-treated nor AT soil contained any of these. In addition, biomass treatment increased Haloplasma, Fonticella, and Pseudomonas in a concentration-dependent manner. In contrast, Vicinamibacteraceae and KD4-96 (Chloroflexi) decreased with increasing concentration. AT almost completely eliminated several genera, including KD4-96, Sphingomonas, and Streptomyces (Figure 4A,B). AT also removed the fungal genera Mortierella, Enterocarpus, Leucothecium, and Peniophora and had a notably high relative abundance of Plectosphaerella (Figure 4C,D). Biomass treatments and autoclaving were effective methods for enriching or eliminating microorganisms, respectively.

Figure 4.
Differences of microbial structures following each treatment. Microbial composition of bacterial (A) and fungal (C) community, relative abundance of differentially abundant genera (B,D), and predicted functional genes (E). BF, biofumigated soil; GM, green manure soil treatment; AT, autoclaved soil treatment; NT, non-treated soil treatment. Each color in the composition plot represents one of the top 15 taxa on the right side. The heatmaps include samples as columns and selected genera as rows. The blue color indicates higher abundance and an orange color indicates lower abundance. Star marks in the barplot refer to significance calculated by Bonferroni’s method; . p < 0.1, * p < 0.05, ** p < 0.01, *** p < 0.001.
We identified functional genes in the rhizosphere. Our results showed that four pathways increased in BF from non-treatment: purine metabolism, pyrimidine metabolism, carbon fixation pathways, and zeatin biosynthesis. Pathways related to “genetic information processing” and “environmental information processing” were also enriched in the BF. GM had a similar tendency but lower gaps than NT (Figure 4E).
Since the initial soil was obtained from the tomato-monocropped field, the core taxa of fungi included potentially pathogenic genera, such as Plectosphaerella and Gibellulopsis (Supplementary Figure S1A). Notably, Plectosphaerella was the most dominant fungal genus in all samples, with a median abundance ranging from 18.40% to 81.43%. In the fungal community network, Plectosphaerella was negatively related to five major genera: Enterocarpus, Aspergillus, Leucothecium, Peniophora, and Wallemia. These five genera were interconnected in the fungal network (Supplementary Figure S1B). Plectospaerella notably decreased in BF1.0 and GM0.5, which had a high abundance for the five genera in common. On the contrary, AT had high Plectospaerella and low abundance for the five genera. We also calculated the predicted pathogenic bacteria and found that all treatments had a lower abundance than NT. In particular, BF1.5 and GM1.5 had the lowest abundance (Table 3). We suggest that both biofumigation and green manure treatments at specific doses suppressed a dominant fungal pathogen and potentially pathogenic bacteria.
Table 3.
Relative abundance (%) of fungi related to pathogen or pathogen control, and the ratio of predicted potentially pathogenic bacteria in each treatment.
3.4. Relationships between Components of the Microbiome
Organic matter treatments induced a wide range of changes in plant health, soil properties, and microbial communities. Therefore, it is worth exploring how these factors interact to ultimately reduce plant stress. Correlation analysis revealed that RWC was not directly correlated with the field capacity or most plant growth indicators. Indeed, the factors that were strongly correlated with plant stress were microbial diversity and nutrition. Higher concentrations of NO3− and K+ were correlated with lower RWC and poor plant growth (Figure 5A).

Figure 5.
Relationships between components of the microbiome. The correlation plot (A) indicates positive with blue and negative with orange. Star marks refer to significance calculated by the Pearson’s correlation coefficient; * p < 0.05, ** p < 0.01, *** p < 0.001. The partial least squares path modeling (PLS-PM; (B)) contains paths that mean a positive effect with blue and a negative effect with red. DP and AR refer to the drought period and after rewatering, respectively. Nutrients and plant growth are represented by the K+ concentration and dry weight. Path coefficients are marked above each path along with the weighted paths. The goodness-of-fit test confirms this model with a high value of >0.5.
A model using partial least squares path modeling (PLS-PM) validated its credibility (Supplementary Table S1) and selected K+ concentration, dry weight, and RWC as representatives of nutrition, plant growth, and plant stress, respectively. This model revealed that bacterial alpha diversity played the most critical role in stress resilience after rewatering. Fungal diversity and plant growth had only minor effects on stress. Field capacity had a positive effect on plant growth, but a negative effect on bacterial diversity (Figure 5B). We noted that microbial diversity was one of the key factors in reducing plant stress.
4. Discussion
Drought management is essential for agricultural success, particularly for tomato cultivation. In this study, we propose complementing the root–soil microbiome associations via biofumigation as one way to manage drought. Notably, we found that not only traditional biofumigation, which utilizes active substances in Brassica, but also regular green manure alters the microbiome dramatically. Our study describes how two biomass treatments (biofumigation and green manure application) changed the microbial community and partially alleviated drought stress.
4.1. Plant Improvement by Treatment of Biofumigant and Green Manure
We confirmed that all treatments had lower oxidative stress than non-treated plants during drought (Figure 2B). RWC is a measure of plant water status in terms of cellular hydration [31]. It serves as a criterion for drought tolerance, allowing the evaluation of crop health [32]. Although some treatments worsened plant stress compared to non-treatments in our results, the 1% biofumigation treatment had the best RWC values in common (Figure 2A,C).
For proper application of organic matter, it should be treated at optimized concentrations. In this study, biofumigation mostly improved stress parameters at a concentration of 1% (Figure 1 and Figure 2A–C). Treatments at 1.5% concentrations, especially GM, resulted in serious stress, which may be related to its high salinity (Figure 2A,C, Table 1). Excessive biomass treatments resulted in the accumulation of nutrients, particularly NO3−, in a concentration-dependent manner (Table 1). High salinity and ion levels can cause osmotic stress and toxicity [33] and increase the susceptibility of plants to pathogens [34] under drought conditions. In addition, higher concentrations resulted in lower alpha diversities (Figure 3). This suggests the selective growth of dominant taxa, which is favored by high-nutrient treatment [35]. High bacterial soil diversity benefits plants, protecting them against abiotic stresses. A diverse microbial community is crucial for effective biocontrol of plant pathogens, enhancing competition, suppressing harmful microorganisms [36], and strengthening disease resistance [37]. Diverse soil microbial communities also enhance the tolerance of legumes, facilitating beneficial plant–microbe interactions [38]. Our results imply an appropriate concentration range.
4.2. Reconstruction of Microbial Communities with Beneficial Functions
Biomass treatments broadly changed the microbial communities. Several major genera that were not included in the non-treated or autoclaved groups were identified. We noted the emergence of Clostridium [39] and Pseudomonas [40] which largely contain endophytes (Figure 4B). Horizontal transfer from endophytes to other phyllospheres via decay is a common behavior [41]. We suspect that these potential endophytes were cultivated from treated plant materials, resulting in an increase in alpha diversity in all biomass treatments. This hypothesis supports the potential of biofumigant and green manure as reconstructors of microbial communities. High alpha diversity helps plants relieve stress and survive drought as mentioned above. This also matches our results, which showed that the improved (BF1.0) and severe (GM1.5) biomass treatments had the highest and lowest diversity, respectively (Figure 3). It is encouraging that all biomass treatments had high alpha diversity, implying stress relief.
In addition, Pseudomonas increased in a concentration-dependent manner in the biomass treatments (Figure 4B). It phylogenetically includes broad strains with activation of pathogen suppression [42], enhancement of root function, and production of beneficial compounds [43,44]. We highlight ACC deaminase activity. Deamination of ACC, an immediate precursor of ethylene, can mitigate the drought stress of plants as mentioned above.
The association between rhizosphere microbes and plants plays critical roles in plant health, including growth performance, nutrient uptake, drought, abiotic stress tolerance [45,46], and protection from pathogens [47]. The results showed that biofumigation induced four types of functional genes in the rhizosphere, which helped plants relieve stress (Figure 4E). Purine metabolism in plant-associated bacteria produces ureides that support nitrogen fixation under nitrogen-deficient conditions and help strengthen the symbiotic relationship between roots and microbes [48]. Increases in pyrimidine metabolites have been positively associated with improved root development and resilience to stress conditions [49]. Carbon fixation by soil microbial communities contributes to carbon sequestration, helping mitigate the effects of climate change on agriculture [50]. Zeatin biosynthesis, a critical pathway for cytokinin production, enhances root development and abiotic stress resilience by regulating root architecture and improving stress responses [51]. These interactions are strongly influenced by drought and salinity conditions [52]. Increased genetic and environmental information processing functions of biomass treatments may imply a less impaired association. Overall, biofumigation and green manure enriched diverse microbiota, increasing beneficial microbes, and improving their interactions with plants.
4.3. A Biocontrol of Pathogens and Microbial Structure
Biocontrol of pathogenic microorganisms has been one of the main concepts of biofumigation, which removes pathogens via volatile organic matter [53,54]. Even under drought conditions, plant pathogens can activate their pathogenicity [55], which imposes double stress on the plants [56]. Therefore, pathogen management is essential for reducing drought damage. We obtained initial soil from the tomato monoculture greenhouse and confirmed the accumulation of pathogens, particularly Plectosphaerella. Plectosphaerella includes pathogenic strains for various crops such as tomatoes, squash, pumpkins, and melons [57]. Interestingly, after treatment, the healthy samples shared five genera in common (Enterocarpus, Aspergillus, Leucothecium, Peniophora, and Wallemia), with a low abundance of Plectospharella (Table 3). The presence of other microorganisms [58,59] can control dominant bacteria through competition. Aspergillus [60,61,62], Peniophora [63], and Wallemia [64] have been shown to produce antimicrobial substances. In particular, Aspergillus is a well-known source of antifungal metabolites against a wide range of plant pathogens, including tomato [59]. Although some pathogenic strains are phylogenetically within the five genera, it is encouraging that a small increase in them could induce a much higher reduction in Plectosphaerella. Moreover, these five shared genera played an important role in organizing the network structure as core nodes (Supplementary Figure S1B). Monoculture usually simplifies the fungal network [65], and the five genera may contribute to its reconstruction. When treated at appropriate concentrations, biofumigant and green manure rebuilt the fungal community and reduced the most dominant pathogens. In contrast, autoclaving, despite being an effective microbial removal method, resulted in the highest relative abundance of Plectosphaerella (Table 3). These findings reinforce the idea that diverse soil microbial structures, rather than direct removal, are important for sustainable pathogen control.
4.4. Irreplaceability of Organic Matters over Fumigation
We explored which factors lowered plant stress. Typically, a high field capacity brings low drought levels and superior growth performance enhances the stress resistance. However, these two factors did not have a direct relationship with low stress levels in our study. Bacterial diversity appeared to be the most influential factor in improving drought stress (Figure 5A). Furthermore, a high field capacity was negatively correlated with bacterial diversity (Figure 5B). This implies that a high water-retention ability is beneficial for plant growth without water shortage; however, under drought conditions, it can lead to failure in stress management. This study is a case where the microbiome had a greater impact than factors typically thought to be important for drought stress.
Moreover, autoclaving was applied as a mimic of chemical fumigation, targeting the elimination of microorganisms. We confirmed that it effectively played that traditional role in the microbial structure (Figure 4A–D) but did not relieve the plant stress (Figure 1 and Figure 2). The lower alpha diversity and higher relative abundance of Plectosphaerlla could be the reasons for this (Figure 3, Table 3). In conclusion, we suggest that drought management that excludes microbes is not possible, and ought to build a “healthy” microbial community.
4.5. Study Limitations and Significance
This exploratory study was conducted with a limited number of replicates and a single experimental cycle, which are acknowledged as primary limitations. However, the consistent alterations observed in microbial communities indicate a clear tendency that is worthy of further investigation. Despite the constrained sample size, the preliminary insights provided by this study are valuable, indicating the potential of biofumigation to mitigate drought stress as an eco-friendly agricultural practice. These findings provide a foundation for future research to validate the suggested effects of biofumigation, ideally with larger sample sizes and multiple growth cycles.
5. Conclusions
This study investigated the novel role of biofumigation in drought management, including the reconstitution of soil microbial communities. Proper reconstitution of microbial communities can potentially lower plant stress under drought. Biofumigation increased bacterial diversity, enhanced beneficial functions, and reconstructed the fungal network, which might suppress the dominant pathogen. In particular, high alpha diversity was the most influential factor for stress relief. As a preliminary measure, biofumigation differs from traditional drought management in that it does not require additional inputs during drought periods. In addition, utilizing soil microbial changes to increase soil resilience and reduce plant stress could potentially reduce the reliance on chemical fertilizers. Future research should evaluate the reproducibility of this method with more drought stress markers and its practical applicability in agricultural fields. Longitudinal studies are also essential to evaluate the long-term effects of biofumigation on soil health. This approach is expected to make sustainable agriculture more viable in the changing climate.
Supplementary Materials
The following supporting information can be downloaded at: https://www.mdpi.com/article/10.3390/agronomy14102225/s1, Figure S1: The flourishing and suppression of plant pathogenic fungi; Table S1: Validation of constructed partial least squares path modeling (PLS-PM).
Author Contributions
Conceptualization, T.-H.P. and D.L.; methodology, K.L. and T.-H.P.; software, D.L.; validation, W.-C.K. and J.-H.S.; formal analysis, D.L.; investigation, G.N.; resources, J.-H.S.; data curation, M.J.; writing—original draft preparation, D.L.; writing—review and editing, M.J. and K.L.; visualization, D.L.; supervision, J.-H.S. and W.-C.K.; project administration, D.L.; funding acquisition, J.-H.S. All authors have read and agreed to the published version of the manuscript.
Funding
This work was supported by the regional researcher program through the National Research Foundation (NRF-2020R1I1A307452212), the Korea Basic Science Institute (National Research Facilities and Equipment Center) grant (2021R1A6C101A416) funded by the Ministry of Education, and biological materials Specialized Graduate Program through the Korea Environmental Industry and Technology Institute (KEITI), funded by the Ministry of Environment (MOE).
Data Availability Statement
The raw sequence data presented in the study are openly available in the NCBI Sequence Read Archive (SRA) under the accession number PRJNA1054121.
Acknowledgments
We gratefully acknowledge the NGS Core Facility at KNU for performing the next-generation sequencing essential for this study.
Conflicts of Interest
The funders had no role in the design of the study; in the collection, analyses, or interpretation of data; in the writing of the manuscript; or in the decision to publish the results.
References
- Sah, S.K.; Singh, A.K.; Singh, B.K.; Barman, K.; Pal, A.K.; Kumar, A. Heterosis Studies for Growth and Yield Traits in Tomato (Solanum lycopersicum L.). Int. J. Curr. Microbiol. Appl. Sci. 2020, 9, 2732–2738. [Google Scholar] [CrossRef]
- Peet, M. Irrigation and fertilization. In Tomatoes; CABI: Wallingford, UK, 2005; pp. 171–198. [Google Scholar] [CrossRef]
- Grozeva, S.Y.; Ganeva, D.G.; Pevicharova, G.T. Screening of tomato genotypes for tolerance of reduced irrigation. In Proceedings of the 15th International Conference on Chemical, Agricultural, Biological & Environmental Science, Lisbon, Portugal, 19–21 June 2019. [Google Scholar] [CrossRef]
- Kapoor, D.; Bhardwaj, S.; Landi, M.; Sharma, A.; Ramakrishnan, M.; Sharma, A. The impact of drought in plant metabolism: How to exploit tolerance mechanisms to increase crop production. Appl. Sci. 2020, 10, 5692. [Google Scholar] [CrossRef]
- Poudel, M.; Mendes, R.; Costa, L.A.; Bueno, C.G.; Meng, Y.; Folimonova, S.Y.; Garrett, K.A.; Martins, S.J. The role of plant-associated bacteria, fungi, and viruses in drought stress mitigation. Front. Microbiol. 2021, 12, 3058. [Google Scholar] [CrossRef]
- Farooq, M.; Wahid, A.; Kobayashi, N.S.M.A.; Fujita, D.B.S.M.A.; Basra, S.M.A. Plant drought stress: Effects, mechanisms and management. Agron. Sustain. Dev. 2009, 29, 185–212. [Google Scholar] [CrossRef]
- Saxena, B.; Shukla, K.; Giri, B. Arbuscular Mycorrhizal Fungi and Tolerance of Salt Stress in Plants. In Arbuscular Mycorrhizas and Stress Tolerance of Plants; Springer: Singapore, 2017; pp. 67–97. [Google Scholar] [CrossRef]
- Holátko, J.; Příchystalová, J.; Hammerschmiedt, T.; Datta, R.; Meena, R.S.; Šudoma, M.; Pečina, V.; Elbl, J.; Kintl, A.; Kučerík, J.; et al. Glomalin: A Key Indicator for Soil Carbon Stabilization. In Soil Carbon Stabilization to Mitigate Climate Change; Springer: Singapore, 2021; pp. 47–81. [Google Scholar] [CrossRef]
- Aliasgharzad, N.; Malekzadeh, E. Glomalin and Carbon Sequestration in Terrestrial Ecosystems. In Arbuscular Mycorrhizal Fungi and Higher Plants: Fundamentals and Applications; Springer: Singapore, 2024; pp. 239–258. [Google Scholar] [CrossRef]
- Liu, G.; Duan, X.; Yan, G.; Sun, X.; Jiang, S.; Xing, Y.; Wang, Q. Changes in Soil Aggregates and Glomalin-Related Soil Protein Stability During the Successional Process of Boreal Forests. J. Soil Sci. Plant Nutr. 2024, 24, 1335–1348. [Google Scholar] [CrossRef]
- Chandrasekaran, M.; Boopathi, T.; Manivannan, P. Comprehensive Assessment of Ameliorative Effects of AMF in Alleviating Abiotic Stress in Tomato Plants. J. Fungi 2021, 7, 303. [Google Scholar] [CrossRef]
- Nader, A.A.; Hauka, F.I.; Afify, A.H.; El-Sawah, A.M. Drought-Tolerant Bacteria and Arbuscular Mycorrhizal Fungi Mitigate the Detrimental Effects of Drought Stress Induced by Withholding Irrigation at Critical Growth Stages of Soybean (Glycine max L.). Microorganisms 2024, 12, 1123. [Google Scholar] [CrossRef] [PubMed]
- Anwar, T.; Qureshi, H.; Akhtar, M.S.; Siddiqi, E.H.; Fatimah, H.; Zaman, W.; Alhammad, B.A.; Seleiman, M.F. Enhancing Maize Growth and Resilience to Environmental Stress with Biochar, Gibberellic Acid and Rhizobacteria. Front. Plant Sci. 2024, 15, 1396594. [Google Scholar] [CrossRef]
- Liang, X.; Zhang, L.; Natarajan, S.K.; Becker, D.F. Proline Mechanisms of Stress Survival. Antioxid. Redox Signal. 2013, 19, 998–1011. [Google Scholar] [CrossRef]
- Bi, W.; Weng, B.; Yan, D.; Wang, H.; Wang, M.; Yan, S.; Jing, L.; Liu, T.; Chang, W. Responses of Phosphate-Solubilizing Microorganisms Mediated Phosphorus Cycling to Drought-Flood Abrupt Alternation in Summer Maize Field Soil. Front. Microbiol. 2022, 12, 768921. [Google Scholar] [CrossRef]
- Glick, B.R.; Penrose, D.M.; Li, J. A Model for the Lowering of Plant Ethylene Concentrations by Plant Growth-Promoting Bacteria. J. Theor. Biol. 1998, 190, 63–68. [Google Scholar] [CrossRef] [PubMed]
- Gamalero, E.; Glick, B.R. Bacterial Modulation of Plant Ethylene Levels. Plant Physiol. 2015, 169, 13–22. [Google Scholar] [CrossRef]
- Singh, R.P.; Shelke, G.M.; Kumar, A.; Jha, P.N. Biochemistry and Genetics of ACC Deaminase: A Weapon to “Stress Ethylene” Produced in Plants. Front. Microbiol. 2015, 6, 937. [Google Scholar] [CrossRef]
- Kirkegaard, J.A.; Sarwar, M. Biofumigation potential of brassicas. Plant Soil 1998, 201, 71–89. [Google Scholar] [CrossRef]
- Li, X.; Skillman, V.; Dung, J.; Frost, K. Legacy Effects of Fumigation on Soil Bacterial and Fungal Communities and Their Response to Metam Sodium Application. Environ. Microbiome 2022, 17, 59. [Google Scholar] [CrossRef]
- Dangi, S.R.; Tirado-Corbalá, R.; Gerik, J.; Hanson, B.D. Effect of Long-Term Continuous Fumigation on Soil Microbial Communities. Agronomy 2017, 7, 37. [Google Scholar] [CrossRef]
- Walker, B.A.; Powell, S.M.; Tegg, R.S.; Doyle, R.B.; Hunt, I.G.; Wilson, C.R. Ten years of green manuring and biofumigation alters soil characteristics and microbiota. Appl. Soil Ecol. 2023, 187, 104836. [Google Scholar] [CrossRef]
- Wieczorek, R.; Zydlik, Z.; Wolna-Maruwka, A.; Kubiak, A.; Bocianowski, J.; Niewiadomska, A. The Response of the Mycobiome to the Biofumigation of Replanted Soil in a Fruit Tree Nursery. Agronomy 2024, 14, 1961. [Google Scholar] [CrossRef]
- Wieczorek, R.; Zydlik, Z.; Wolna-Maruwka, A.; Niewiadomska, A.; Kayzer, D. The Effect of Biofumigation on the Microbiome Composition in Replanted Soil in a Fruit Tree Nursery. Agronomy 2023, 13, 2507. [Google Scholar] [CrossRef]
- Tagele, S.B.; Kim, R.H.; Jeong, M.; Jung, D.R.; Lee, D.; Shin, J.H. An optimized biofumigant improves pepper yield without exerting detrimental effects on soil microbial diversity. Chem. Biol. Technol. Agric. 2022, 9, 99. [Google Scholar] [CrossRef]
- Wang, Q.; Ma, Y.; Wang, G.; Gu, Z.; Sun, D.; An, X.; Chang, Z. Integration of Biofumigation with Antagonistic Microorganism Can Control Phytophthora Blight of Pepper Plants by Regulating Soil Bacterial Community Structure. Eur. J. Soil Biol. 2014, 61, 58–67. [Google Scholar] [CrossRef]
- Raja, V.; Qadir, S.U.; Alyemeni, M.N.; Ahmad, P. Impact of drought and heat stress individually and in combination on physio-biochemical parameters, antioxidant responses, and gene expression in Solanum lycopersicum. 3 Biotech 2020, 10, 208. [Google Scholar] [CrossRef] [PubMed]
- Thomas, D.H.; Rey, M.; Jackson, P.E. Determination of inorganic cations and ammonium in environmental waters by ion chromatography with a high-capacity cation-exchange column. J. Chromatogr. A 2002, 956, 181–186. [Google Scholar] [CrossRef] [PubMed]
- Zhang, L.; Zhang, M.; Huang, S.; Li, L.; Gao, Q.; Wang, Y.; Zhang, S.; Huang, S.; Yuan, L.; Wen, Y.; et al. A highly conserved core bacterial microbiota with nitrogen-fixation capacity inhabits the xylem sap in maize plants. Nat. Commun. 2022, 13, 3361. [Google Scholar] [CrossRef] [PubMed]
- Schuberth, F. Confirmatory composite analysis using partial least squares: Setting the record straight. Rev. Manag. Sci. 2021, 15, 1311–1345. [Google Scholar] [CrossRef]
- Barr, H.D.; Weatherley, P.E. A re-examination of the relative turgidity technique for estimating water deficit in leaves. Aust. J. Biol. Sci. 1962, 15, 413–428. [Google Scholar] [CrossRef]
- Lugojan, C.; Ciulca, S. Evaluation of relative water content in winter wheat. J. Hortic. For. Biotechnol. 2011, 15, 173–177. [Google Scholar]
- Ma, Y.; Dias, M.C.; Freitas, H. Drought and salinity stress responses and microbe-induced tolerance in plants. Front. Plant Sci. 2020, 11, 591911. [Google Scholar] [CrossRef]
- de Vries, F.; Lau, J.; Hawkes, C.; Semchenko, M. Plant–soil feedback under drought: Does history shape the future? Trends Ecol. Evol. 2023, 38, 708–718. [Google Scholar] [CrossRef]
- Bastida, F.; Eldridge, D.J.; García, C.; Kenny Png, G.; Bardgett, R.D.; Delgado-Baquerizo, M. Soil microbial diversity–biomass relationships are driven by soil carbon content across global biomes. ISME J. 2021, 15, 2081–2091. [Google Scholar] [CrossRef]
- Berg, G.; Köberl, M.; Rybakova, D.; Müller, H.; Grosch, R.; Smalla, K. Plant microbial diversity is suggested as the key to future biocontrol and health trends. FEMS Microbiol. Ecol. 2017, 93, fix050. [Google Scholar] [CrossRef]
- Berendsen, R.L.; Pieterse, C.M.; Bakker, P.A. The rhizosphere microbiome and plant health. Trends Plant Sci. 2012, 17, 478–486. [Google Scholar] [CrossRef] [PubMed]
- Prudent, M.; Dequiedt, S.; Sorin, C.; Girodet, S.; Nowak, V.; Duc, G.; Maron, P.A. The diversity of soil microbial communities matters when legumes face drought. Plant Cell Environ. 2020, 43, 1023–1035. [Google Scholar] [CrossRef]
- Li, C.J.; Zhang, Z.; Zhan, P.C.; Lv, A.P.; Li, P.P.; Liu, L.; Li, W.J.; Yang, L.L.; Zhi, X.Y. Comparative genomic analysis and proposal of Clostridium yunnanense sp. nov., Clostridium rhizosphaerae sp. nov., and Clostridium paridis sp. nov., three novel Clostridium sensu stricto endophytes with diverse capabilities of acetic acid and ethanol production. Anaerobe 2023, 79, 102686. [Google Scholar] [CrossRef] [PubMed]
- Ryan, R.P.; Germaine, K.; Franks, A.; Ryan, D.J.; Dowling, D.N. Bacterial endophytes: Recent developments and applications. FEMS Microbiol. Lett. 2008, 278, 1–9. [Google Scholar] [CrossRef]
- Ghiasian, M. Endophytic microbiomes: Biodiversity, current status, and potential agricultural applications. In Advances in Plant Microbiome and Sustainable Agriculture: Diversity and Biotechnological Applications, 1st ed.; Springer: Singapore, 2020; pp. 61–82. [Google Scholar] [CrossRef]
- Sahu, B.; Singh, J.; Shankar, G.; Pradhan, A. Pseudomonas fluorescens PGPR bacteria as well as biocontrol agent: A review. Int. J. Chem. Stud. 2018, 6, 1–7. [Google Scholar]
- Sivasakthi, S.; Usharani, G.; Saranraj, P. Biocontrol potentiality of plant growth promoting bacteria (PGPR)-Pseudomonas fluorescens and Bacillus subtilis: A review. Afr. J. Agric. Res. 2014, 9, 1265–1277. [Google Scholar] [CrossRef]
- Dorjey, S.; Dolkar, D.; Sharma, R. Plant growth promoting rhizobacteria Pseudomonas: A review. J. Curr. Microbiol. Appl. Sci. 2017, 6, 1335–1344. [Google Scholar] [CrossRef]
- Gowtham, H.G.; Singh, B.; Murali, M.; Shilpa, N.; Prasad, M.; Aiyaz, M.; Amruthesh, K.N.; Niranjana, S.R. Induction of drought tolerance in tomato upon the application of ACC deaminase producing plant growth promoting rhizobacterium Bacillus subtilis Rhizo SF 48. Microbiol. Res. 2020, 234, 126422. [Google Scholar] [CrossRef]
- Hakim, S.; Naqqash, T.; Nawaz, M.S.; Laraib, I.; Siddique, M.J.; Zia, R.; Mirza, M.S.; Imran, A. Rhizosphere engineering with plant growth-promoting microorganisms for agriculture and ecological sustainability. Front. Sustain. Food Syst. 2021, 5, 617157. [Google Scholar] [CrossRef]
- Jain, S.; Jain, J.; Singh, J. The rhizosphere microbiome: Microbial communities and plant health. In Plant Microbiome Paradigm, 1st ed.; Springer: Cham, Switzerland, 2020; pp. 175–190. [Google Scholar] [CrossRef]
- de Faria, M.R.; Costa, L.S.A.S.; Chiaramonte, J.B.; Bettiol, W.; Mendes, R. The rhizosphere microbiome: Functions, dynamics, and role in plant protection. Trop. Plant Pathol. 2021, 46, 13–25. [Google Scholar] [CrossRef]
- Izaguirre-Mayoral, M.L.; Lazarovits, G.; Baral, B. Ureide metabolism in plant-associated bacteria: Purine plant-bacteria interactive scenarios under nitrogen deficiency. Plant Soil 2018, 428, 1–34. [Google Scholar] [CrossRef]
- Ren, H.; Wang, H.; Wang, Q.; Qi, X.; Zhang, S.; Yu, Z.; Ijaz, M.; Zhang, M.; Ahmed, T.; El-Sharnouby, M.; et al. Effect of fungicides on bayberry decline disease by modulating rhizosphere soil properties, microflora, and metabolites. Agronomy 2022, 12, 677. [Google Scholar] [CrossRef]
- Bhattacharyya, S.S.; Ros, G.H.; Furtak, K.; Iqbal, H.M.; Parra-Saldívar, R. Soil carbon sequestration–An interplay between soil microbial community and soil organic matter dynamics. Sci. Total Environ. 2022, 815, 152928. [Google Scholar] [CrossRef]
- Wu, Y.; Liu, H.; Wang, Q.; Zhang, G. Roles of cytokinins in root growth and abiotic stress response of Arabidopsis thaliana. Plant Growth Regul. 2021, 94, 151–160. [Google Scholar] [CrossRef]
- Velmourougane, K.; Saxena, G.; Prasanna, R. Plant-microbe interactions in the rhizosphere: Mechanisms and their ecological benefits. In Plant-Microbe Interactions in Agro-Ecological Perspectives: Volume 2: Microbial Interactions and Agro-Ecological Impacts, 1st ed.; Springer: Singapore, 2017; pp. 193–219. [Google Scholar] [CrossRef]
- Morris, E.K.; Fletcher, R.; Veresoglou, S.D. Effective methods of biofumigation: A meta-analysis. Plant Soil 2020, 446, 379–392. [Google Scholar] [CrossRef]
- Gimsing, A.L.; Kirkegaard, J.A. Glucosinolates and biofumigation: Fate of glucosinolates and their hydrolysis products in soil. Phytochem. Rev. 2009, 8, 299–310. [Google Scholar] [CrossRef]
- Qi, J.; Song, C.P.; Wang, B.; Zhou, J.; Kangasjärvi, J.; Zhu, J.K.; Gong, Z. Reactive oxygen species signaling and stomatal movement in plant responses to drought stress and pathogen attack. J. Integr. Plant Biol. 2018, 60, 805–826. [Google Scholar] [CrossRef]
- Su, L.; Deng, H.; Niu, Y.C. Phylogenetic analysis of Plectosphaerella species based on multi-locus DNA sequences and description of P. sinensis sp. nov. Mycol. Prog. 2017, 16, 823–829. [Google Scholar] [CrossRef]
- Spadaro, D.; Droby, S. Development of biocontrol products for postharvest diseases of fruit: The importance of elucidating the mechanisms of action of yeast antagonists. Trends Food Sci. Technol. 2016, 47, 39–49. [Google Scholar] [CrossRef]
- Köhl, J.; Kolnaar, R.; Ravensberg, W.J. Mode of action of microbial biological control agents against plant diseases: Relevance beyond efficacy. Front. Plant Sci. 2019, 10, 845. [Google Scholar] [CrossRef]
- Ngo, M.T.; Van Nguyen, M.; Han, J.W.; Kim, B.; Kim, Y.K.; Park, M.S.; Choi, G.J. Biocontrol potential of Aspergillus species producing antimicrobial metabolites. Front. Microbiol. 2021, 12, 804333. [Google Scholar] [CrossRef] [PubMed]
- Li, H.; Fu, Y.; Song, F. Marine Aspergillus: A Treasure Trove of Antimicrobial Compounds. Mar. Drugs 2023, 21, 277. [Google Scholar] [CrossRef] [PubMed]
- El-Hawary, S.S.; Moawad, A.S.; Bahr, H.S.; Abdelmohsen, U.R.; Mohammed, R. Natural product diversity from the endophytic fungi of the genus Aspergillus. RSC Adv. 2020, 10, 22058–22079. [Google Scholar] [CrossRef]
- Gerber, N.N.; Shaw, S.A.; Lechevalier, H.A. Structures and antimicrobial activity of peniophorin A and B, two polyacetylenic antibiotics from Peniophora affinis Burt. Antimicrob. Agents Chemother. 1980, 17, 636–641. [Google Scholar] [CrossRef] [PubMed]
- Peng, X.P.; Wang, Y.; Liu, P.P.; Hong, K.; Chen, H.; Yin, X.; Zhu, W.M. Aromatic compounds from the halotolerant fungal strain of Wallemia sebi PXP-89 in a hypersaline medium. Arch. Pharmacal. Res. 2011, 34, 907–912. [Google Scholar] [CrossRef]
- Yu, T.; Hou, X.; Fang, X.; Razavi, B.; Zang, H.; Zeng, Z.; Yang, Y. Short-term continuous monocropping reduces peanut yield mainly via altering soil enzyme activity and fungal community. Environ. Res. 2024, 245, 117977. [Google Scholar] [CrossRef]


Disclaimer/Publisher’s Note: The statements, opinions and data contained in all publications are solely those of the individual author(s) and contributor(s) and not of MDPI and/or the editor(s). MDPI and/or the editor(s) disclaim responsibility for any injury to people or property resulting from any ideas, methods, instructions or products referred to in the content. |
© 2024 by the authors. Licensee MDPI, Basel, Switzerland. This article is an open access article distributed under the terms and conditions of the Creative Commons Attribution (CC BY) license (https://creativecommons.org/licenses/by/4.0/).