Article

A Hierarchical Feature-Aware Model for Accurate Tomato Blight Disease Spot Detection: Unet with Vision Mamba and ConvNeXt Perspective

by
Dongyuan Shi
1,2,
Changhong Li
1,†,
Hui Shi
2,
Longwei Liang
1,2,
Huiying Liu
1 and
Ming Diao
1,*
1
Department of Horticulture, Agricultural College of Shihezi University/Key Laboratory of Special Fruits and Vegetables Cultivation Physiology and Germplasm Resources Utilization of Xinjiang Production and Construction Corps, Shihezi 832003, China
2
Research Center of Information Technology, Beijing Academy of Agriculture and Forestry Sciences/National Engineering Research Center for Information Technology in Agriculture/National Engineering Laboratory for Agri-product Quality Traceability/Meteorological Service Center for Urban Agriculture, China Meteorological Administration-Ministry of Agriculture and Rural Affairs, Beijing 100097, China
*
Author to whom correspondence should be addressed.
These authors contributed equally to this work.
Agronomy 2024, 14(10), 2227; https://doi.org/10.3390/agronomy14102227
Submission received: 19 August 2024 / Revised: 21 September 2024 / Accepted: 25 September 2024 / Published: 27 September 2024

Abstract

:
Tomato blight significantly threatened tomato yield and quality, making precise disease detection essential for modern agricultural practices. Traditional segmentation models often struggle with over-segmentation and missed segmentation, particularly in complex backgrounds and with diverse lesion morphologies. To address these challenges, we proposed Unet with Vision Mamba and ConvNeXt (VMC-Unet), an asymmetric segmentation model for quantitative analysis of tomato blight. Built on the Unet framework, VMC-Unet integrated a parallel feature-aware backbone combining ConvNeXt, Vision Mamba, and Atrous Spatial Pyramid Pooling (ASPP) modules to enhance spatial feature focusing and multi-scale information processing. During decoding, Vision Mamba was hierarchically embedded to accurately recover complex lesion morphologies through refined feature processing and efficient up-sampling. A joint loss function was designed to optimize the model’s performance. Extensive experiments on both tomato epidemic and public datasets demonstrated VMC-Unet superior performance, achieving 97.82% pixel accuracy, 87.94% F1 score, and 86.75% mIoU. These results surpassed those of classical segmentation models, underscoring the effectiveness of VMC-Unet in mitigating over-segmentation and under-segmentation while maintaining high segmentation accuracy in complex backgrounds. The consistent performance of the model across various datasets further validated its robustness and generalization potential, highlighting its applicability in broader agricultural settings.

1. Introduction

As a vital economic crop, tomatoes play a crucial role in global food security and economic sustainability. However, the widespread occurrence of tomato blight, including early blight and late blight, poses a significant threat to global tomato production, leading to substantial reductions in both yield and quality. The early detection and control of such diseases are paramount in modern agricultural management, directly affecting crop health and final yield [1]. The complexity of tomato diseases, particularly their variability and unpredictability in greenhouse environments, renders traditional manual detection methods insufficient for the precision required in modern agriculture. As agriculture has evolved towards more intelligent and precise systems, the demand for automated disease detection technologies has surged, especially in decision support systems for disease management, where the accurate quantification of disease lesions was a critical component [2,3]. We focused on segmentation rather than detection in this study based on the specific requirements of precision agriculture and the characteristics of tomato blight. While broader detection may seem practical, the precise quantification of infected areas through segmentation offers a detailed understanding of disease progression, aiding in more targeted interventions. This approach enables more localized treatments, improving disease management and helping reduce further spread, even after symptoms appear.
While pest management remains a critical task in production greenhouses, fungal diseases can still pose significant threats, especially under conducive environmental conditions. Although preventive measures for pests and diseases are implemented annually, tomato blight, cucumber downy mildew, and other fungal diseases can still emerge, necessitating early detection and precise monitoring. Our research, while acknowledging the role of pest management, focuses on the accurate detection and quantification of fungal disease lesions, providing valuable insights for integrated pest and disease management strategies. Traditional methods for detecting lesions largely relied on the expertise of agricultural professionals, who visually inspected and manually recorded disease occurrence and progression. This approach was not only time-consuming but also prone to subjective errors, leading to misjudgments or omissions. Additionally, with the expansion of agricultural areas, the cost and complexity of manual detection have increased significantly. Consequently, the development of automated lesion detection methods based on image analysis and machine learning has become inevitable in modern agricultural disease prevention and control [4].
In recent years, with the advancement of deep learning technologies, crop disease detection methods based on computer vision have become a focal point for research [5,6,7]. These methods not only enhanced the accuracy of disease detection but also significantly reduced labor costs and effort. The Unet model, introduced by Ronneberger et al., laid the foundation for image segmentation tasks [8]. Subsequently, models such as the Mask R-CNN by He et al. [9] and the DeepLab series by Chen et al. [10] further propelled the application of image segmentation to agriculture. These models, which are recognized for their superior ability to extract both global and local features, have been widely applied in the field of crop disease detection. Researchers have further enhanced the model performance by incorporating attention mechanisms and multi-scale feature fusion techniques [11,12,13]. However, despite their success in handling single scenes and simple lesions, traditional segmentation models still faced challenges such as over-segmentation and under-segmentation when dealing with complex backgrounds and diverse lesion morphologies.
Recent studies have shown significant progress in tomato disease detection and segmentation technologies based on deep learning, demonstrating excellence in improving detection accuracy and efficiency. For instance, Liu et al. (2023) introduced the NanoSegmenter model based on a Transformer structure [14], which combined lightweight technology and achieved outstanding performance in tomato disease detection, with precision, recall, and mIoU values of 0.98, 0.97, and 0.95, respectively. Deng et al. (2023) proposed a multi-scale convolutional network based on the Unet architecture, achieving 91.32% accuracy in segmenting tomato leaf mold disease [15]. Similarly, Perveen et al. designed a multi-scale U-shaped network to capture dynamically changing tomato leaf lesions, achieving a pixel accuracy of 99.2% [16]. Kuar et al. (2024) introduced a Hybrid-DSCNN model based on U-Net and Seg-Net, successfully segmenting disease objects in tomato plants with an accuracy of 98.42% [17]. Zhao et al. (2022) employed asymmetric initial multi-channel convolution to replace traditional convolution, developing a multi-scale tomato leaf disease segmentation algorithm based on an improved U-Net network, which achieved 92.9% accuracy on the Plant Village dataset [18].
However, the morphology and size of lesions were influenced by the environment, crop varieties, and pathogens, exhibiting significant diversity. Traditional models often relied on fixed feature extraction methods, making it difficult to adapt to different lesion morphologies and resulting in poor performance when dealing with novel or mutated lesions [19,20]. Most existing studies focus on detecting specific diseases or scenes, and there was a lack of unified detection models capable of handling multiple diseases, complex backgrounds, and diverse lesion morphologies. Moreover, many models struggled with small object detection and unclear lesion boundaries, leading to over-segmentation (mistaking background for lesions) or under-segmentation (failing to detect actual lesions), limiting their generalizability and practical applicability.
In light of these challenges, this study aimed to design and implement a novel lesion segmentation model capable of accurately identifying blight lesions on tomato leaves in complex backgrounds with enhanced robustness and generalization ability. To this end, we proposed Unet with Vision Mamba and ConvNeXt (VMC-Unet), a novel tomato blight lesion segmentation model based on the Unet architecture, which integrated ConvNeXt and Vision Mamba dual backbone networks, and employed the Atrous Spatial Pyramid Pooling (ASPP) module to enhance feature extraction. This model was designed to address the challenges of over-segmentation and under-segmentation in complex backgrounds. Extensive experiments demonstrated the superior performance of the VMC-Unet model on tomato blight datasets, as well as its strong generalization ability across different disease datasets, providing new insights and solutions for intelligent agricultural disease detection in the future.

2. Materials and Methods

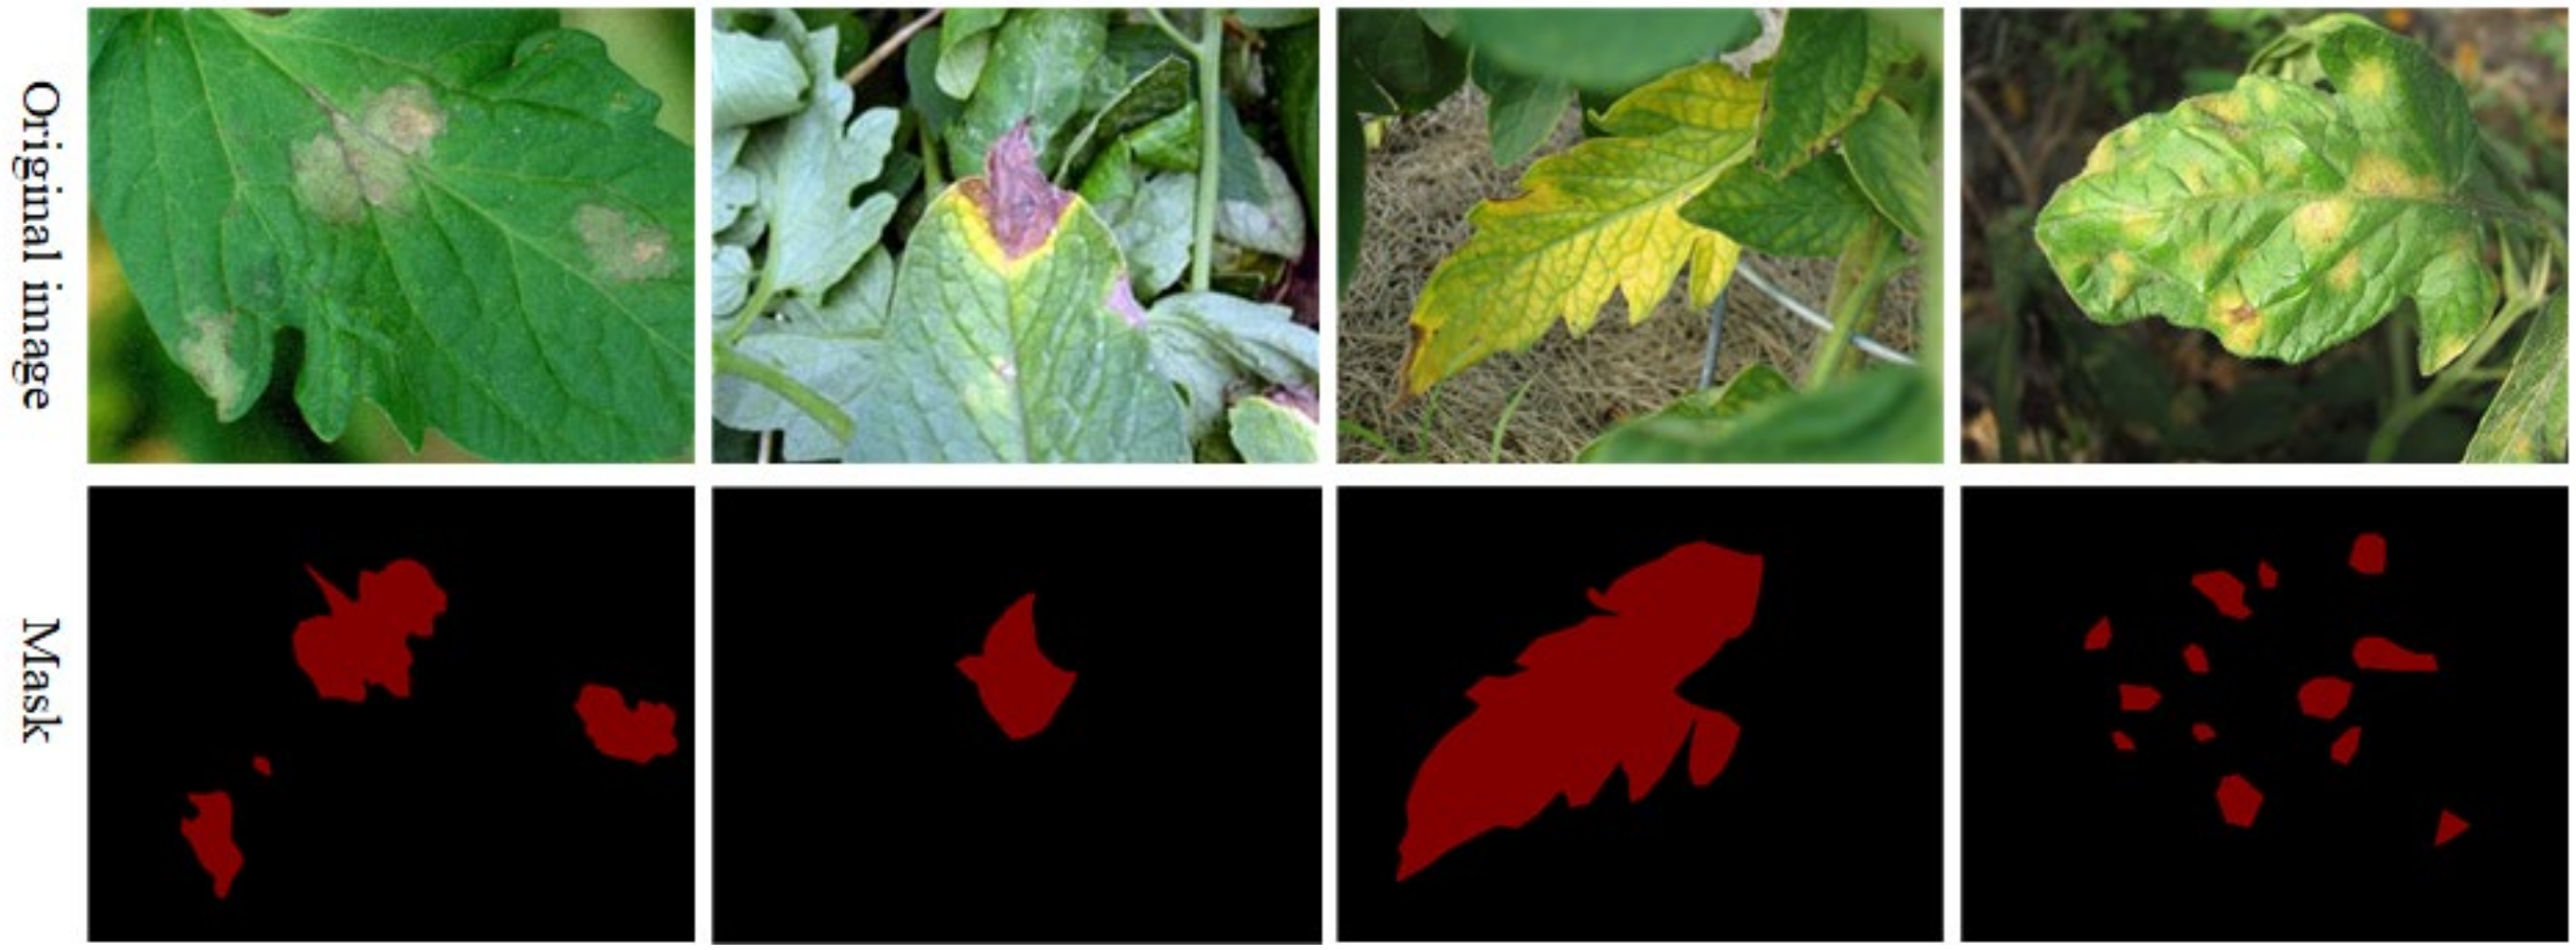
2.1. Image Acquisition and Annotation Preparation

This study focused on early and late blight in tomatoes. The early blight dataset was collected in June 2023 from a tomato greenhouse located in the Moluo Industrial Park, Hotan County, Hotan Prefecture, Xinjiang Uygur Autonomous Region, China (37.308° N, 79.916° E). The primary cultivar used was Shifan No. 33, which exhibits moderate resistance to early blight. The late blight dataset was captured in July 2023 at the Experimental Station of the College of Agriculture, Shihezi University, Shihezi, Xinjiang (44.319° N, 86.011° E), where the primary cultivar was Kuiguan B108, also moderately resistant to early blight. Images were captured once lesions had appeared on the tomato leaves, using a Sony A6000 camera equipped with an 18–50 mm lens at a maximum resolution of 6000 × 4000 pixels. During imaging, the leaf samples were kept at a distance of 30–50 cm from the lens. A total of 630 raw images were obtained. Due to the input size requirements of the network model and computational efficiency constraints, all images are uniformly scaled to 1024 × 1024 pixels before being input to the model. This preprocessing step ensures that the image size matches the input requirements of the deep learning model while reducing the computational cost and improving the efficiency of model training. Subsequently, these images were annotated using the Labelme 3.16.7 software. The annotations, including class labels and coordinates, were saved as “.json” files and processed to generate 8-bit color label maps where each pixel value represents a class. The dataset was then divided into training, validation, and test sets in a 7:2:1 ratio following the holdout method [21]. Examples of the dataset images are presented in Figure 1.
Precise differentiation between early and late blight does not significantly impact the model’s performance or practical applicability in agricultural scenarios. Our intention was to create a generalized segmentation approach that can accurately detect blight lesions in diverse conditions, and we opted for a single-class approach to streamline the detection process. Including data for both early and late blight helped to ensure that the model was trained on a wide range of blight lesion characteristics, leading to improved generalization and robustness in detecting lesions with varying features. This choice reflects the variability seen in real-world conditions, where tomato plants may be affected by either form of blight at different stages.
To validate the generalization of the model, we also employed the Plant Disease Segmentation Dataset from Kaggle (https://www.kaggle.com/datasets/fakhrealam9537/leaf-disease-segmentation-dataset (accessed on 5 June 2024)) for cross-validation. This dataset included 588 images of diseased leaves from various plants, such as maize and strawberries, along with corresponding lesion mask files. These images captured plants at different growth stages and showed varying leaf quantities and sizes. Each image included detailed annotation information, including leaf segmentation masks.

2.2. Data Augmentation

Data augmentation was an effective strategy to enhance the performance of deep learning models, especially when the available dataset is limited. By applying various transformations to the original images, we can generate a more diverse set of training samples, thus improving the model’s generalization capabilities. Given the random nature of disease occurrence and the necessity for data augmentation, we employed methods such as rotation, flipping, translation, noise injection, and brightness adjustment to expand the dataset. These transformations significantly increased both the quantity and diversity of training samples, thereby enhancing the model’s training effectiveness and generalization ability. Detailed information on the number and distribution of images used in the experiments is provided in Table 1.

2.3. Unet

Unet is a classic Convolutional Neural Network (CNN) architecture widely used for image segmentation tasks. Its unique U-shaped structure excels in processing crop disease images. Unet consists of an encoder and a decoder, which efficiently extract and restore global and local features. The encoder comprises multiple convolutional and pooling layers that progressively downsample the image, extracting high-level features. Each convolutional layer is followed by a ReLU activation function and a max-pooling layer to reduce the feature map size. The decoder consists of deconvolutional and convolutional layers that progressively up-sample the image, restoring spatial resolution. Each deconvolutional layer is followed by a convolutional layer and ReLU activation function. To retain more detailed information during up-sampling, Unet introduces skip connections between corresponding layers of the encoder and decoder, facilitating the fusion of detail and semantic information [8].

2.4. Proposed Model

Although Unet performed well in many segmentation tasks, it exhibited limitations in capturing fine details, especially in boundary regions when dealing with complex lesion morphologies. Tomato blight lesions were characterized by irregular shapes and blurred boundaries, making it challenging for the original Unet model to precisely segment these areas, often leading to errors. The encoder of Unet, based on traditional CNN structures, may lack the feature extraction capacity needed to handle the high heterogeneity and diversity of lesions. This limited feature representation could result in inconsistent performance across different scales and types of lesions, affecting overall segmentation accuracy. Furthermore, Unet’s design, which focuses primarily on progressive up-sampling to recover spatial resolution, may be insufficiently sensitive to small, dispersed lesions, leading to misclassification or omission.
In this study, we proposed a more effective segmentation model, VMC-Unet, tailored to the segmentation of tomato blight lesions (Figure 2). This model built upon the classic Unet architecture, integrating state-of-the-art deep learning techniques to enhance lesion segmentation accuracy. Specifically, we employed a dual-backbone design, incorporating ConvNeXt [22] and Vision Mamba [23] into the model encoder as parallel feature-aware backbones. This approach leveraged the strengths in multi-level feature extraction. In the decoder, we utilized the Vision Mamba multi-level feature fusion mechanism to enhance decoding capabilities. This design not only improved the handling of boundary details but also increased accuracy in detecting lesions of various sizes.

2.4.1. Parallel Feature-Aware Backbone

To enhance the accuracy and robustness of the Unet model in segmenting tomato leaf lesions, we designed a parallel feature-aware backbone network, as illustrated in Figure 3. This network integrates ConvNeXt and Vision Mamba as core components, employing parallel feature extraction to improve the model’s performance across different scales and semantic levels. The ConvNeXt module, a backbone network, was built on a deep convolutional neural network and featured a series of enhancements to bolster its feature extraction capabilities. The architecture included multi-layer convolutional blocks with convolutional kernels of varying scales (e.g., 3 × 3 and 7 × 7) and different down-sampling rates (e.g., rate = 2, rate = 4). These blocks, combining deep convolution and dilated convolution, effectively captured both local details and global contextual information within the image. To further enhance the network non-linear representation capacity, the ConvNeXt module incorporated normalization processes and the GELU activation function. These layers not only improved model stability but also facilitated information flow, ensuring comprehensive propagation and aggregation of features within the network. Additionally, the introduction of deep pooling layers in the ConvNeXt module integrated multi-scale information by extending the receptive field, thereby enhancing the model adaptability and processing capabilities in handling complex lesion morphologies. We chose the ConvNext-Small version as the model encoder, considering that it reduced the parameter size and computational effort while providing sufficient performance.
The parallel backbone network, Vision Mamba, enhanced the model’s ability to focus on target regions through the integration of standard convolution and the Spatially Selective Module (SSM). Vision Mamba initially extracted preliminary features via standard convolutional layers, followed by refinement through two SSM modules. The SSM, inspired by attention mechanisms, adaptively adjusted feature weights across different spatial locations, excelling in capturing lesion details while suppressing background noise. During the encoding process within this module, normalization and activation functions were employed to ensure smooth feature propagation. Simultaneously, a feature fusion mechanism effectively integrated features from different convolutional layers, enhancing segmentation accuracy and detail preservation.
These two backbone networks independently processed multi-level features from the input image, and subsequently, following feature extraction, the features were fused through an Atrous Spatial Pyramid Pooling (ASPP) module [24] (Wang et al., 2018) for multi-scale integration. The ASPP module, with its varying dilation rates, further enhanced scale-invariant lesion processing, allowing the model to maintain consistent segmentation performance across lesions of different sizes and shapes. Ultimately, features derived from ConvNeXt and Vision Mamba were jointly utilized in the decoder, where this parallel feature-aware structure leverages the strengths of both networks. This approach significantly improved lesion segmentation accuracy while maintaining computational efficiency.

2.4.2. Mamba Decoder Module

In the Unet architecture, we integrated Vision Mamba into the decoder (see Figure 2) to enhance the accuracy and detail preservation in tomato lesion segmentation tasks. The Mamba Decoder Module achieved precise recovery of complex lesion morphologies through a refined feature processing pipeline and an efficient up-sampling mechanism. This module comprised several core components, including hierarchical up-sampling layers, standard convolution, depthwise convolution, activation functions, and Layer Norm regularization. These elements worked synergistically, forming an effective decoding framework capable of progressively restoring the spatial resolution of input feature maps and enriching their semantic information to optimize lesion segmentation. Compared to traditional decoder designs, the Mamba Decoder Module offered superior feature representation and computational efficiency. Its multi-level up-sampling and convolutional processes finely reconstruct the morphological characteristics of lesions, while the combination of regularization and activation functions ensures the model’s stability and generalization. This made the Mamba Decoder Module particularly effective in complex agricultural scenarios, adeptly handling diverse lesion morphologies and background noise.
During decoding (Figure 2), the Mamba Decoder Module began by incrementally restoring the feature map resolution via up-sampling operations. This process used interpolation to upscale feature maps, providing high-quality inputs for subsequent convolutional processing. Such stepwise restoration preserved detail throughout the decoding process, facilitating precise segmentation outcomes. Following each up-sampling stage, the module enhanced features using a combination of standard and depthwise convolutions. The standard convolution extracted key information from the input feature map, while the depthwise convolution, with its computational efficiency and lower parameter count, further refined essential spatial information. Together, these convolutions enabled the decoder to extract intricate lesion features while maintaining computational efficiency. To boost the network’s non-linear representation capability, each convolutional layer was followed by an activation function (e.g., ReLU or its variants), ensuring the model captures complex feature relationships. Additionally, Layer Norm regularization was applied to standardize the output of each layer, preventing gradient vanishing or explosion issues and enhancing model stability. This regularization was particularly crucial for multi-layer decoder structures, significantly improving convergence speed and overall model performance during training. In the final stage of the Mamba Decoder Module, feature maps at various levels were effectively fused to form a complete semantic map. This fusion was achieved through layer-wise connection operations (e.g., skip connections), allowing feature information from different scales to work synergistically, thus improving detail retention and overall segmentation accuracy. Finally, after further processing by activation functions and linear layers, the model outputted the final lesion segmentation results.

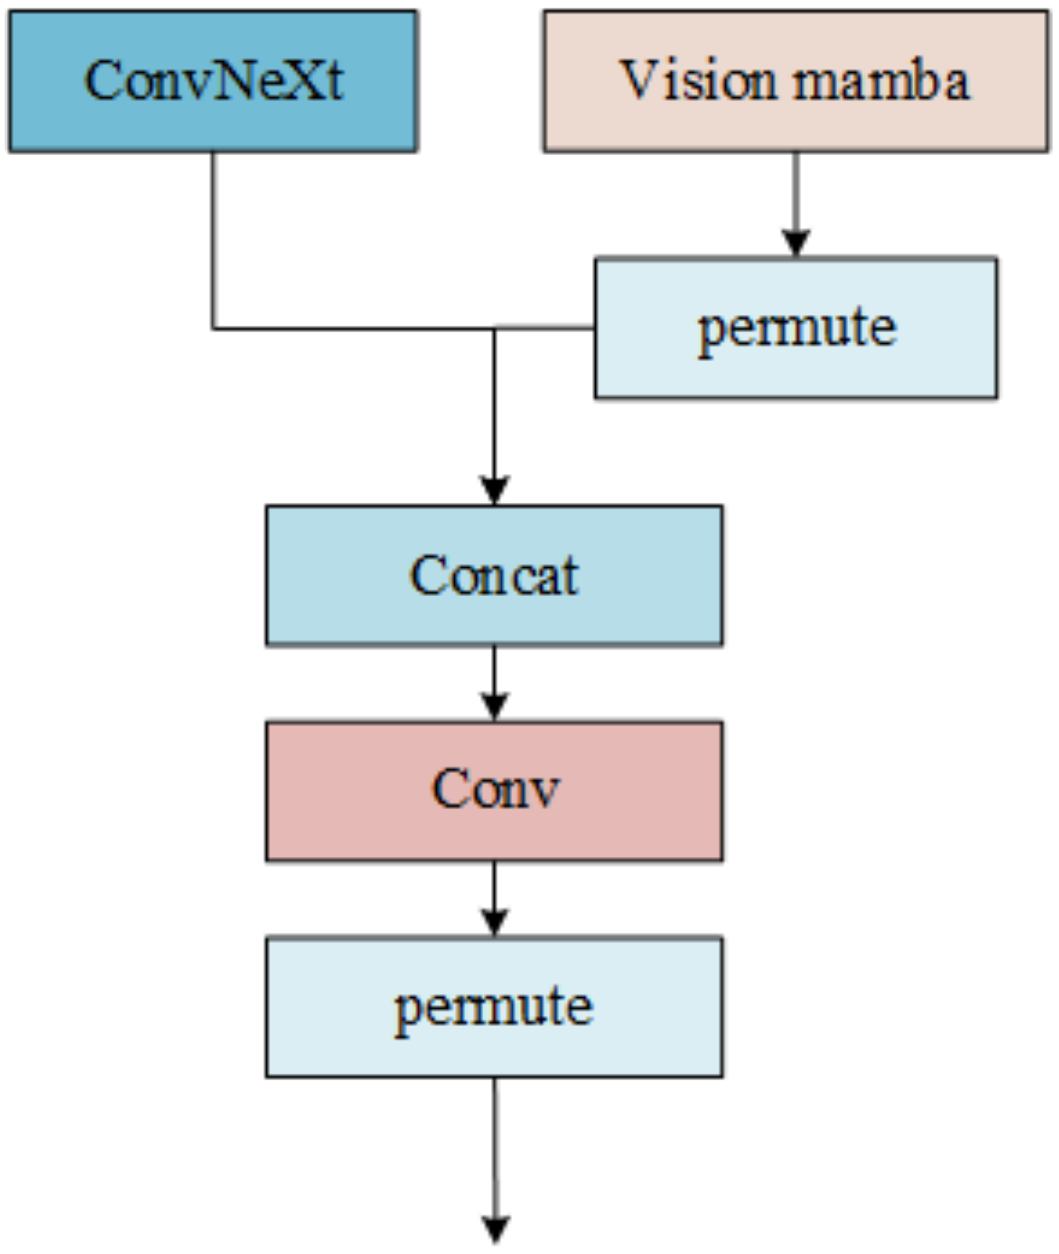
2.4.3. Feature Fusion Unit

In the parallel feature-aware backbone, we designed a Feature Fusion Unit to integrate the feature representations from the ConvNeXt and Vision Mamba network structures, as illustrated in Figure 4. Given the inherent differences in feature extraction processes between these networks, such as feature map dimensions and arrangements, the Permute operation was employed to standardize the feature map formats from different networks, ensuring compatibility during concatenation (Concat). The Concat operation then directly combined the features extracted by both networks into a comprehensive feature map, encompassing multi-level and multi-scale information from both architectures. Subsequently, the concatenated feature map underwent convolutional fusion. This step not only smoothed and compressed the features in the spatial dimension but also refined the inter-channel relationships, thereby enhancing the feature map’s expressiveness. Finally, the second Permute operation arranged the fused feature map into a format suitable for downstream modules, providing the decoder with a more consistent and expressive input.
The introduction of this feature fusion strategy not only leveraged the respective strengths of ConvNeXt and Vision Mamba but also, through efficient convolutional fusion, empowered the model with superior capabilities in recognizing and processing complex lesion morphologies. Overall, this fusion unit laid a robust foundation for the decoding and segmentation tasks of the model, demonstrating exceptional performance in handling diverse lesion shapes and complex backgrounds.

2.5. Loss Function

To further enhance the performance of the tomato leaf lesion segmentation model, we optimized the loss function by implementing a composite loss function instead of the traditional cross-entropy loss function for training the VMC-Unet model. Specifically, we combined Dice loss [25] with Focal loss [26] and introduced label smoothing [27] to increase the model’s robustness against imbalanced data and noise, thereby improving segmentation accuracy.
Dice loss is an effective metric for measuring the overlap between predicted and true segmentation areas, addressing the prevalent issue of class imbalance in semantic segmentation datasets. Its primary advantage is its sensitivity to small target regions, which is particularly critical for lesion segmentation tasks. Dice loss is defined as follows:
L D i c e = 1 2 × P G P + G ,
where P denoted the predicted lesion area, and G represented the ground truth lesion area. By maximizing the overlap between the predicted results and the true labels, Dice loss effectively mitigated the issue of small lesion regions being overlooked due to data imbalance, thus enhancing the model performance in segmenting small regions.
Focal loss is an extension of traditional cross-entropy loss designed to address class imbalance by introducing a modulating factor that focuses the model training on hard-to-classify samples. Focal loss is expressed as follows:
L F o c a l = α t 1 p t γ l o g p t ,
where p t is the model predicted probability for the true class, and α t and γ are adjustable parameters that balance the contribution of positive and negative samples and modulate the focus on hard samples, respectively. By incorporating Focal loss, the model can allocate greater attention to challenging lesion areas, thereby improving overall segmentation performance, especially in cases where lesion morphology is complex and boundaries are blurred.
Considering these factors, we designed a composite loss function that integrates Dice loss and Focal loss, enhanced with label smoothing, as the optimization objective for the tomato leaf lesion segmentation model. The composite loss function is defined as follows:
L o s s = λ 1 × L D i c e + λ 2 × L F o c a l ,
where λ 1 and λ 2 were hyperparameters used to balance the weights of Dice and Focal losses, optimized through experimentation. This composite loss function not only accounted for lesion regions of varying scales and difficulties during the optimization process but also effectively balanced model accuracy and robustness, ensuring stable and reliable performance in real-world applications.
To further improve the model generalization ability, label smoothing was incorporated into the loss function. Label smoothing is a regularization technique that prevents overfitting by introducing slight perturbations into the target labels, thereby reducing the model overconfidence in specific classes.

2.6. Experimental Environment and Evaluation Metrics

The model was trained on an AutoDL GPU cloud server equipped with 15 vCPUs and two NVIDIA RTX 3090 GPUs. The deep learning framework used was PyTorch 1.12.0 with Python 3.8 (Ubuntu 20.04) for network construction. During the experiment, weight files were saved after each completed epoch. The network was optimized using the SGD optimizer, with an initial learning rate of 10-3 during the frozen training phase. A batch size of 8 was employed over 100 training epochs. Transfer learning was conducted using pretrained weights from the ImageNet dataset.
To comprehensively evaluate the performance of the tomato leaf lesion segmentation model, five commonly used and representative metrics were selected: precision, recall, F1 score, Mean Intersection over Union (mIoU), and pixel accuracy. These metrics provided a multifaceted assessment of the model’s performance in segmentation tasks. The calculation methods for these metrics are as follows:
P r e c i s i o n = T P T P + F P   ,
R e c a l l = T P T P + F N   ,
F 1 = 2 × P r e c i s i o n × R e c a l l P r e c i s i o n + R e c a l l   ,
PA = T P + T N T P + T N + F P + F N  
where TP represents the number of samples with actual positive labels and predicted positive labels; TN represents the number of samples with actual negative labels and predicted negative labels; FP represents the number of samples with actual negative labels but predicted positive labels; and FN represents the number of samples with actual positive labels but predicted negative labels.

3. Results

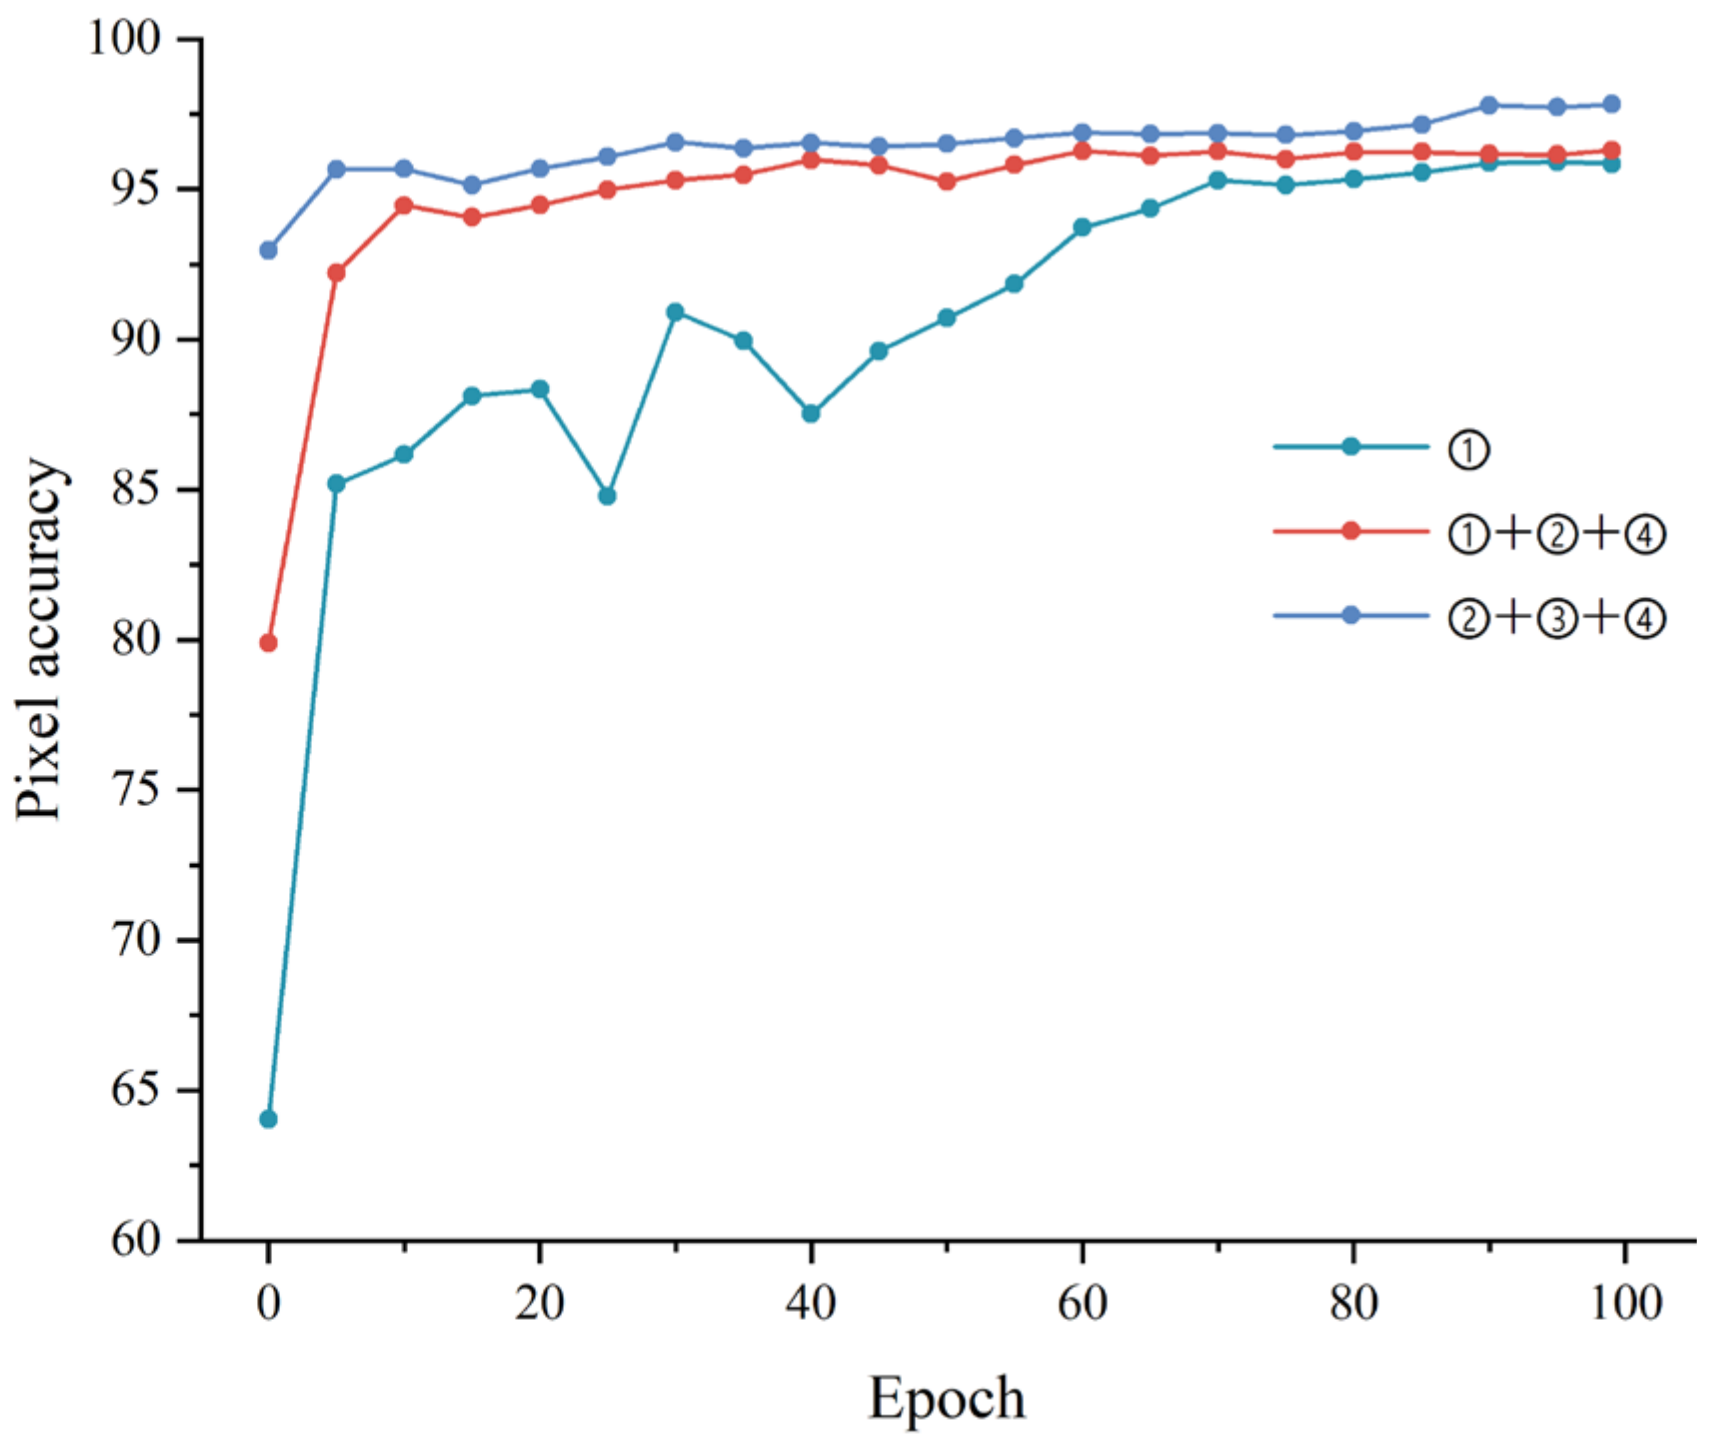
3.1. Impact of Loss Functions
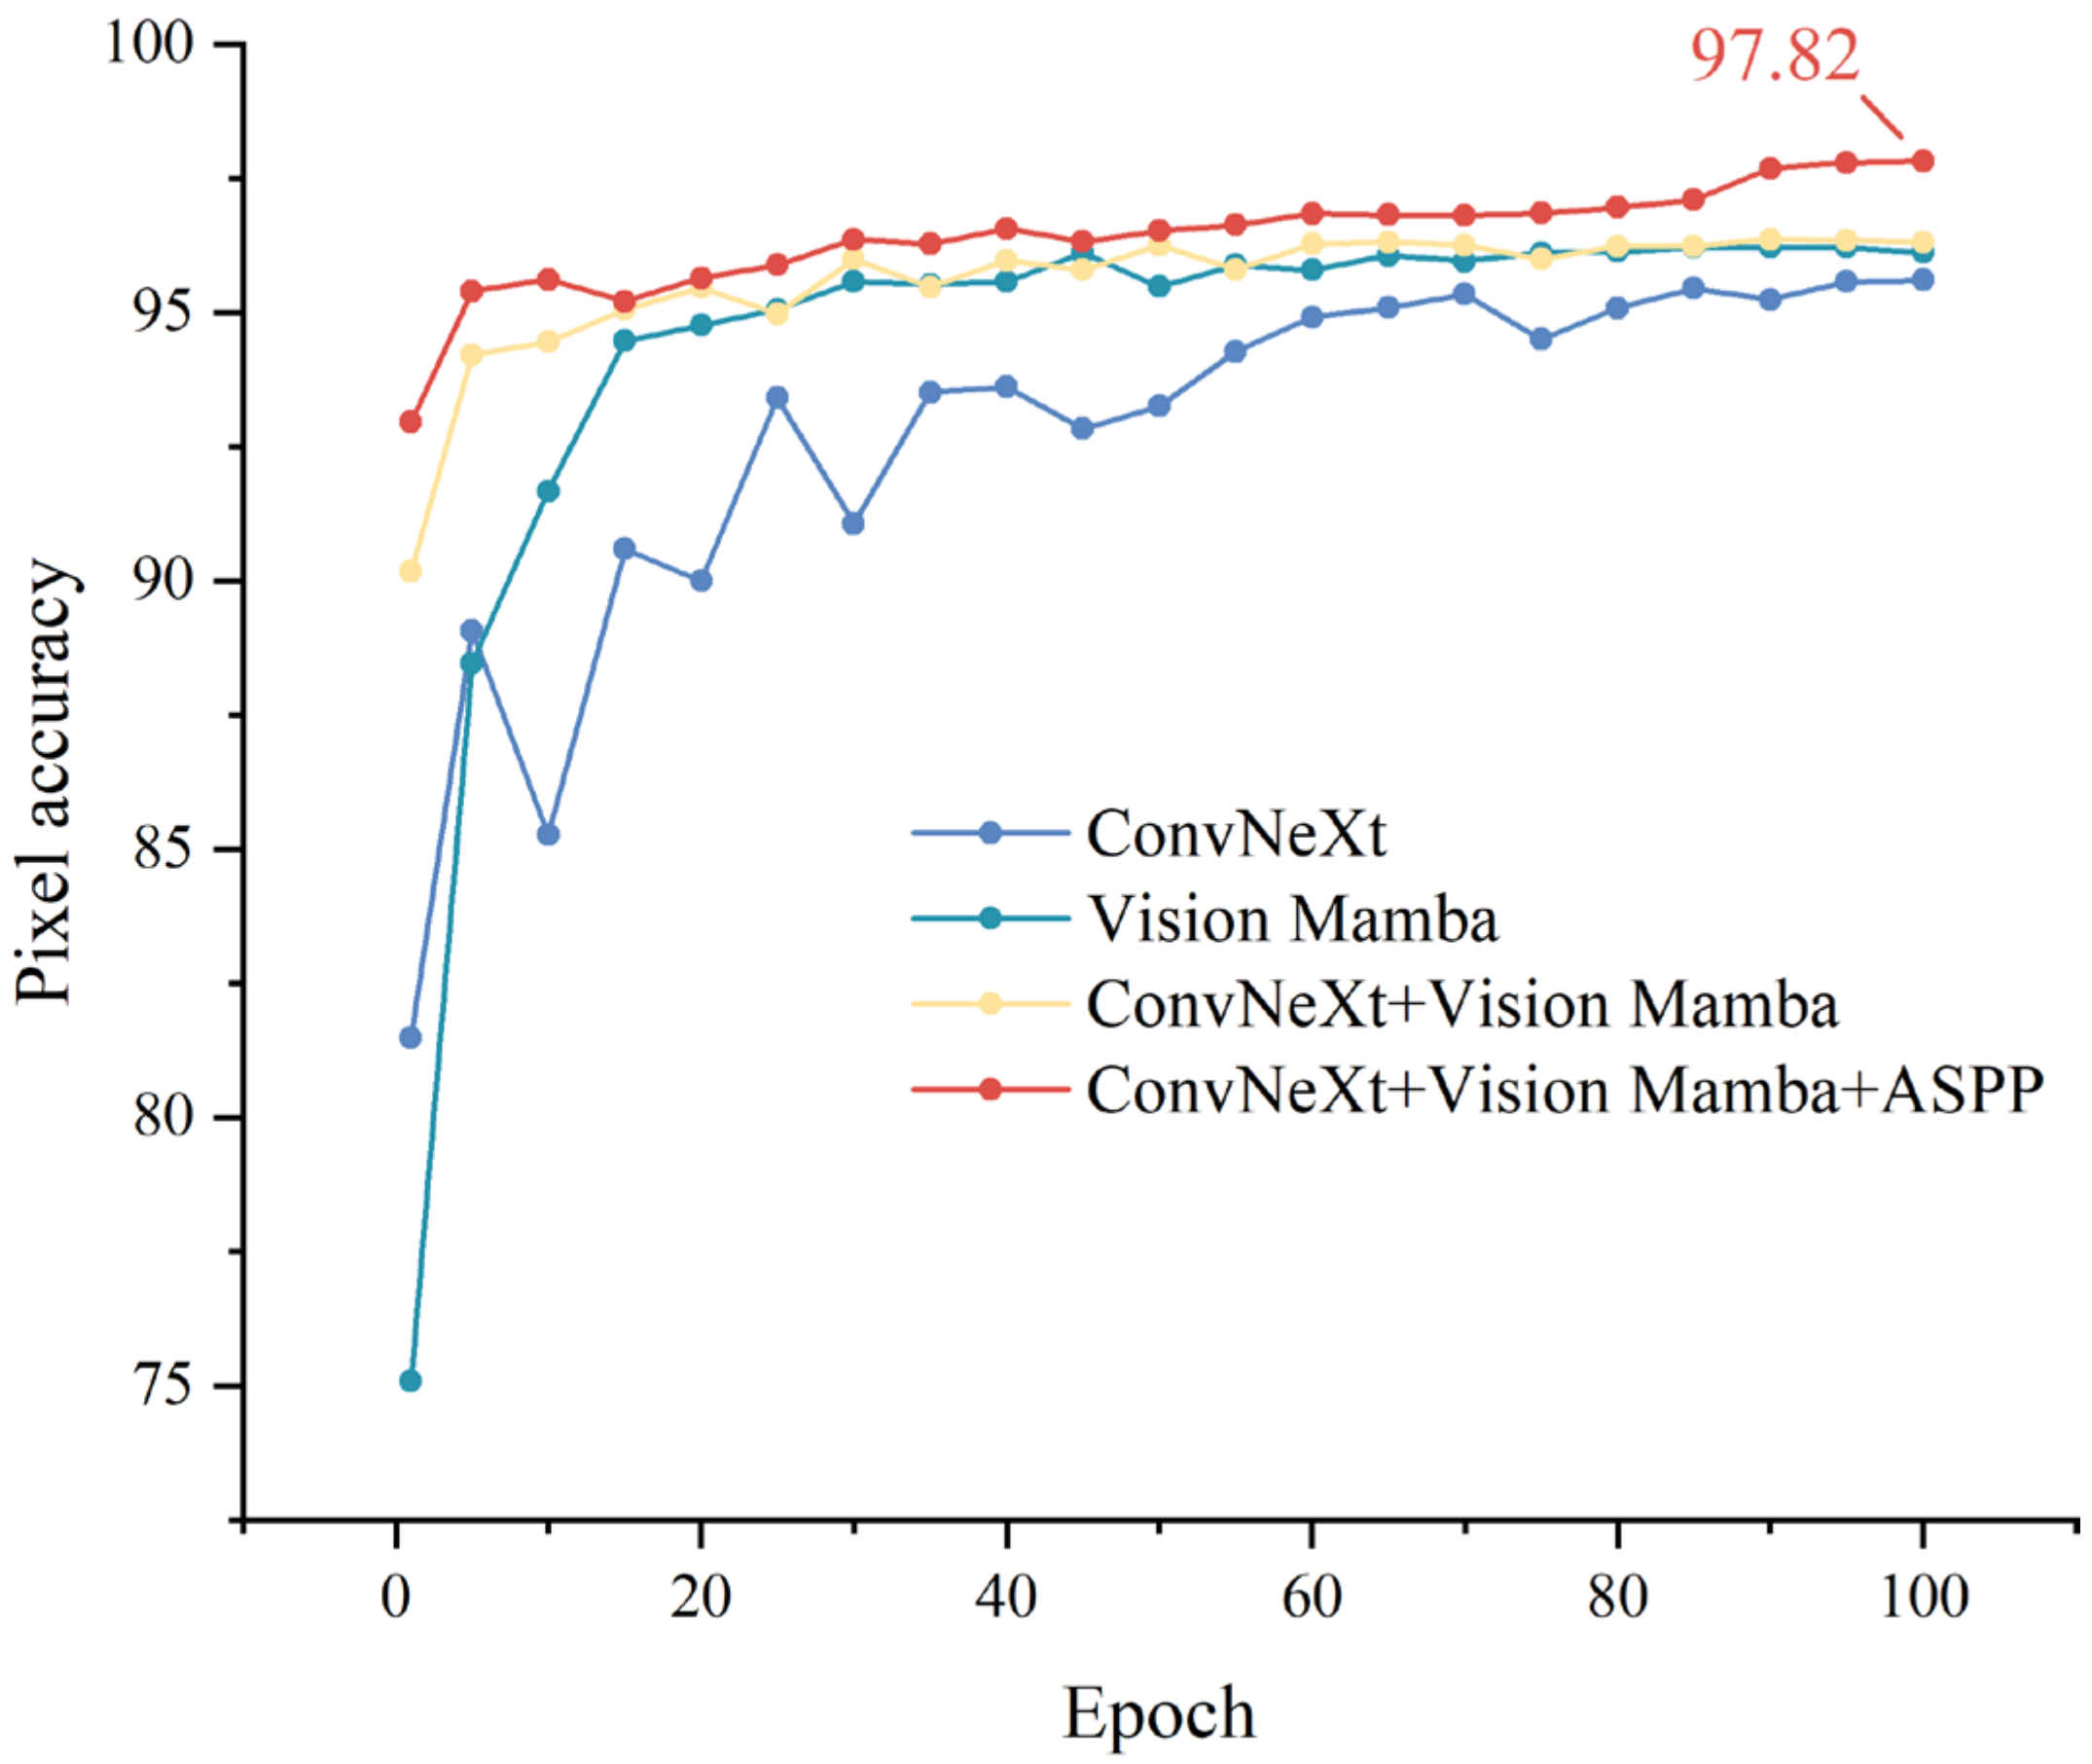
To investigate the influence of different loss function combinations on the performance of the tomato leaf lesion segmentation model, we systematically compared and analyzed the model performance using three distinct loss function combinations. Table 2 presented the performance metrics for each loss function combination, while Figure 5 and Figure 6 illustrated the trends in loss value and pixel accuracy throughout the training process.
When the model was trained using only the cross-entropy loss (➀), the loss value decreased rapidly during the initial stages and plateaued after 30 epochs. However, the final loss value remained relatively high (approximately 0.5), indicating that the model struggled to achieve further optimization during later training stages, often converging to a local optimum. As shown in Table 2, with the cross-entropy loss, the model achieved an accuracy of 77.27%, a recall rate of only 50.54%, leading to an F1 score of 61.11%, an average Intersection over Union (mIoU) of 65.28%, and a pixel accuracy of 87.84%. These results suggested that the model trained with a single cross-entropy loss exhibited limited performance in lesion segmentation, particularly in recalling lesion regions, resulting in suboptimal overall segmentation performance.
In contrast, when the model employed a combination of cross-entropy, Dice loss, and label smoothing (➀ + ➁ + ➃), the loss value decreased progressively with each iteration, eventually stabilizing at approximately 0.25. This loss function design enabled the model to converge rapidly during early training stages while maintaining stability throughout the process. As seen in Figure 5, this combination demonstrated a significantly better loss value reduction trend compared to the single cross-entropy loss, reflecting enhanced optimization capability. According to Table 2, this combination improved the model’s accuracy to 85.39%, with a recall rate of 81.77%, an F1 score of 83.51%, and mIoU and pixel accuracy increased to 83.84% and 96.33%, respectively. These findings indicate that the inclusion of Dice loss and label smoothing substantially improved the model’s ability to capture lesion region details and handle imbalanced data, leading to a marked enhancement in overall segmentation performance.
The model exhibited its best training and testing results when using the combination of Dice loss, Focal loss, and label smoothing (➁ + ➂ + ➃). As depicted in Figure 5, this combination resulted in a rapid decrease in loss value during early training, eventually stabilizing at a low level of approximately 0.15, indicating not only the fastest convergence speed but also the highest pixel accuracy (Figure 6). Table 2 further corroborates this: under this combination, the model achieved an accuracy of 90.03%, a recall rate of 85.94%, an F1 score of 87.94%, and mIoU and pixel accuracy of 86.75% and 97.82%, respectively. These data demonstrate that the combined use of Dice loss, Focal loss, and label smoothing significantly enhances the model’s ability to identify lesion regions, maintaining high segmentation accuracy and stability even in complex backgrounds.

3.2. Ablation Study

To evaluate the contributions of different modules to the performance of the tomato leaf lesion segmentation model, we conducted an ablation study, testing the model’s performance under various module combinations. Table 3 showed the impact of each module combination on model precision, recall, F1 score, mIoU, and pixel accuracy, while Figure 7 illustrated the trends in pixel accuracy across training epochs for each combination.
According to the results presented in Table 3, the baseline model, which employed the original Unet without any advanced feature extraction modules, exhibited relatively low performance across all metrics. Specifically, it achieved an accuracy of 74.44%, a recall of 63.30%, an F1 score of 68.42%, an mIoU of 71.93%, and a pixel accuracy of 92.52%. These findings indicated that the baseline model struggled with the complex task of lesion segmentation, lacking sufficient feature extraction capabilities and segmentation precision. The curve in Figure 7 further corroborated this limitation, showing that while pixel accuracy improves gradually in the early stages of training, it remains consistently lower than other configurations, stabilizing at around 92%. When the ConvNeXt or Vision Mamba modules were introduced individually, there was a marked improvement in model performance. With the ConvNeXt module, the model achieved an accuracy of 85.90%, a recall of 80.11%, an F1 score of 82.91%, an mIoU of 82.94%, and a pixel accuracy of 95.6%. Similarly, the Vision Mamba module boosted the accuracy to 85.31%, recall to 79.29%, F1 score to 82.23%, mIoU to 82.72%, and pixel accuracy to 96.23%. These results underscored the powerful feature extraction capabilities of both ConvNeXt and Vision Mamba, significantly enhancing the model performance in lesion segmentation tasks. The curves in Figure 7 further highlight the advantages of these modules, as they rapidly improve pixel accuracy during the early stages of training and maintain stability throughout the process.
When ConvNeXt and Vision Mamba modules were combined, the model’s overall performance was further enhanced. Experimental results indicated an accuracy of 85.37%, a recall of 81.77%, an F1 score of 83.53%, an mIoU of 83.94%, and a pixel accuracy of 96.35%. This suggests that the combination of ConvNeXt and Vision Mamba modules complements each other, achieving a better balance in extracting and processing features at different levels, thereby improving the model’s overall segmentation performance. When the ASPP module was added on top of the ConvNeXt and Vision Mamba modules, all performance metrics reached their highest levels. Accuracy improves significantly to 90.03%, recall to 85.94%, F1 score to 87.94%, mIoU to 86.75%, and pixel accuracy to 97.82%.

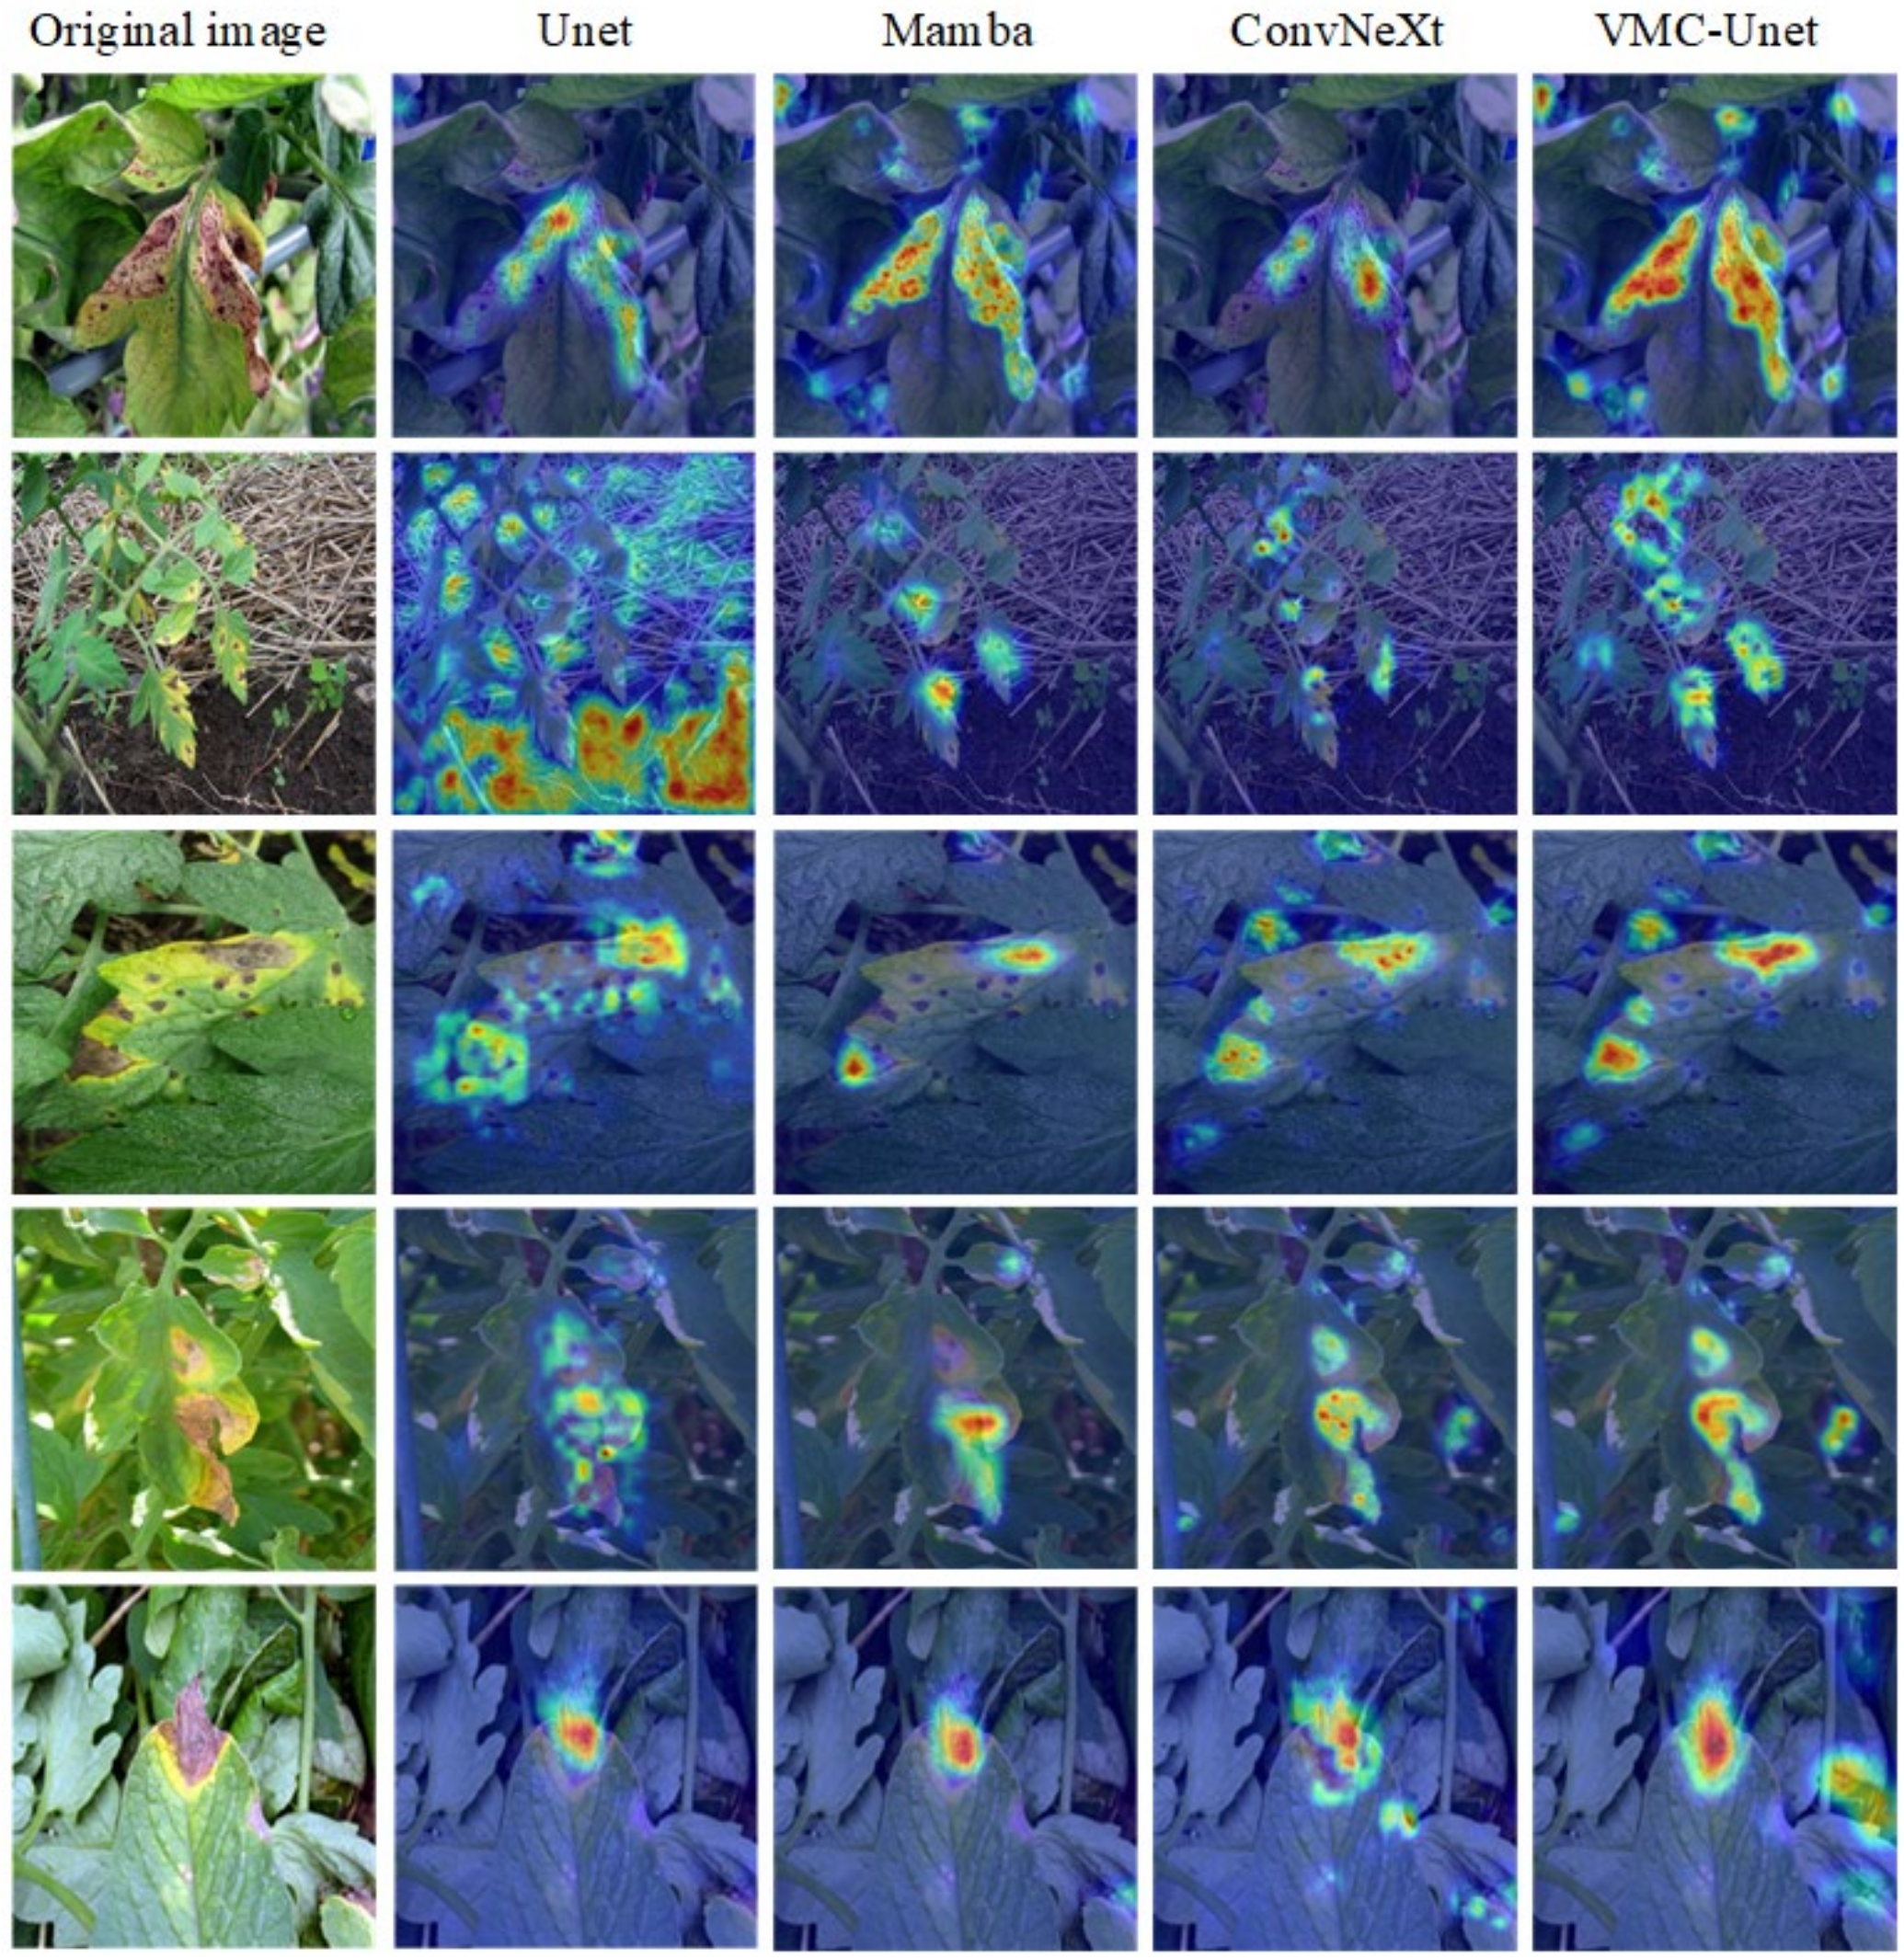
3.3. Model Interpretability Analysis

To gain a deeper understanding of the contributions of different model modules to the task of tomato leaf lesion segmentation and their roles in feature extraction, we generated heatmaps in Figure 8 to analyze the interpretability of the models.
The second column in Figure 8 (Unet) revealed that the original Unet model has certain limitations in detecting lesions. Although the model captured some lesion areas, its hotspot regions were dispersed, with evident misclassification or missed detection in some images. The third column showed the heatmap results after applying the Vision Mamba module. It was evident that the Vision Mamba model significantly improved feature extraction, with more concentrated hotspot regions, allowing the model to better focus on lesion areas. However, the Vision Mamba model still exhibited some errors when dealing with images with complex backgrounds or blurred lesion boundaries. The fourth column (ConvNeXt) displayed the heatmap after incorporating the ConvNeXt module. The ConvNeXt model excelled in feature extraction, with hotspot regions highly aligned with lesion locations, and it performed well in distinguishing lesion areas against complex backgrounds. Compared to the Mamba model, the ConvNeXt model hotspots were more precise, reflecting its powerful convolutional feature extraction capabilities, particularly in capturing the details of lesion edges.
The final column of Figure 8 demonstrated that the VMC-Unet model exhibited the best feature extraction capabilities across all test images, with hotspot regions closely matching the actual lesion locations and providing comprehensive and precise coverage. The model not only accurately identified various lesion regions but also effectively eliminated background noise interference. This performance was attributed to the synergistic effect of the different modules: ConvNeXt provides strong local feature extraction, Vision Mamba enhances spatial feature focus, and the ASPP module effectively captured multi-scale information, enabling the model to excel in processing lesions of varying sizes and shapes.

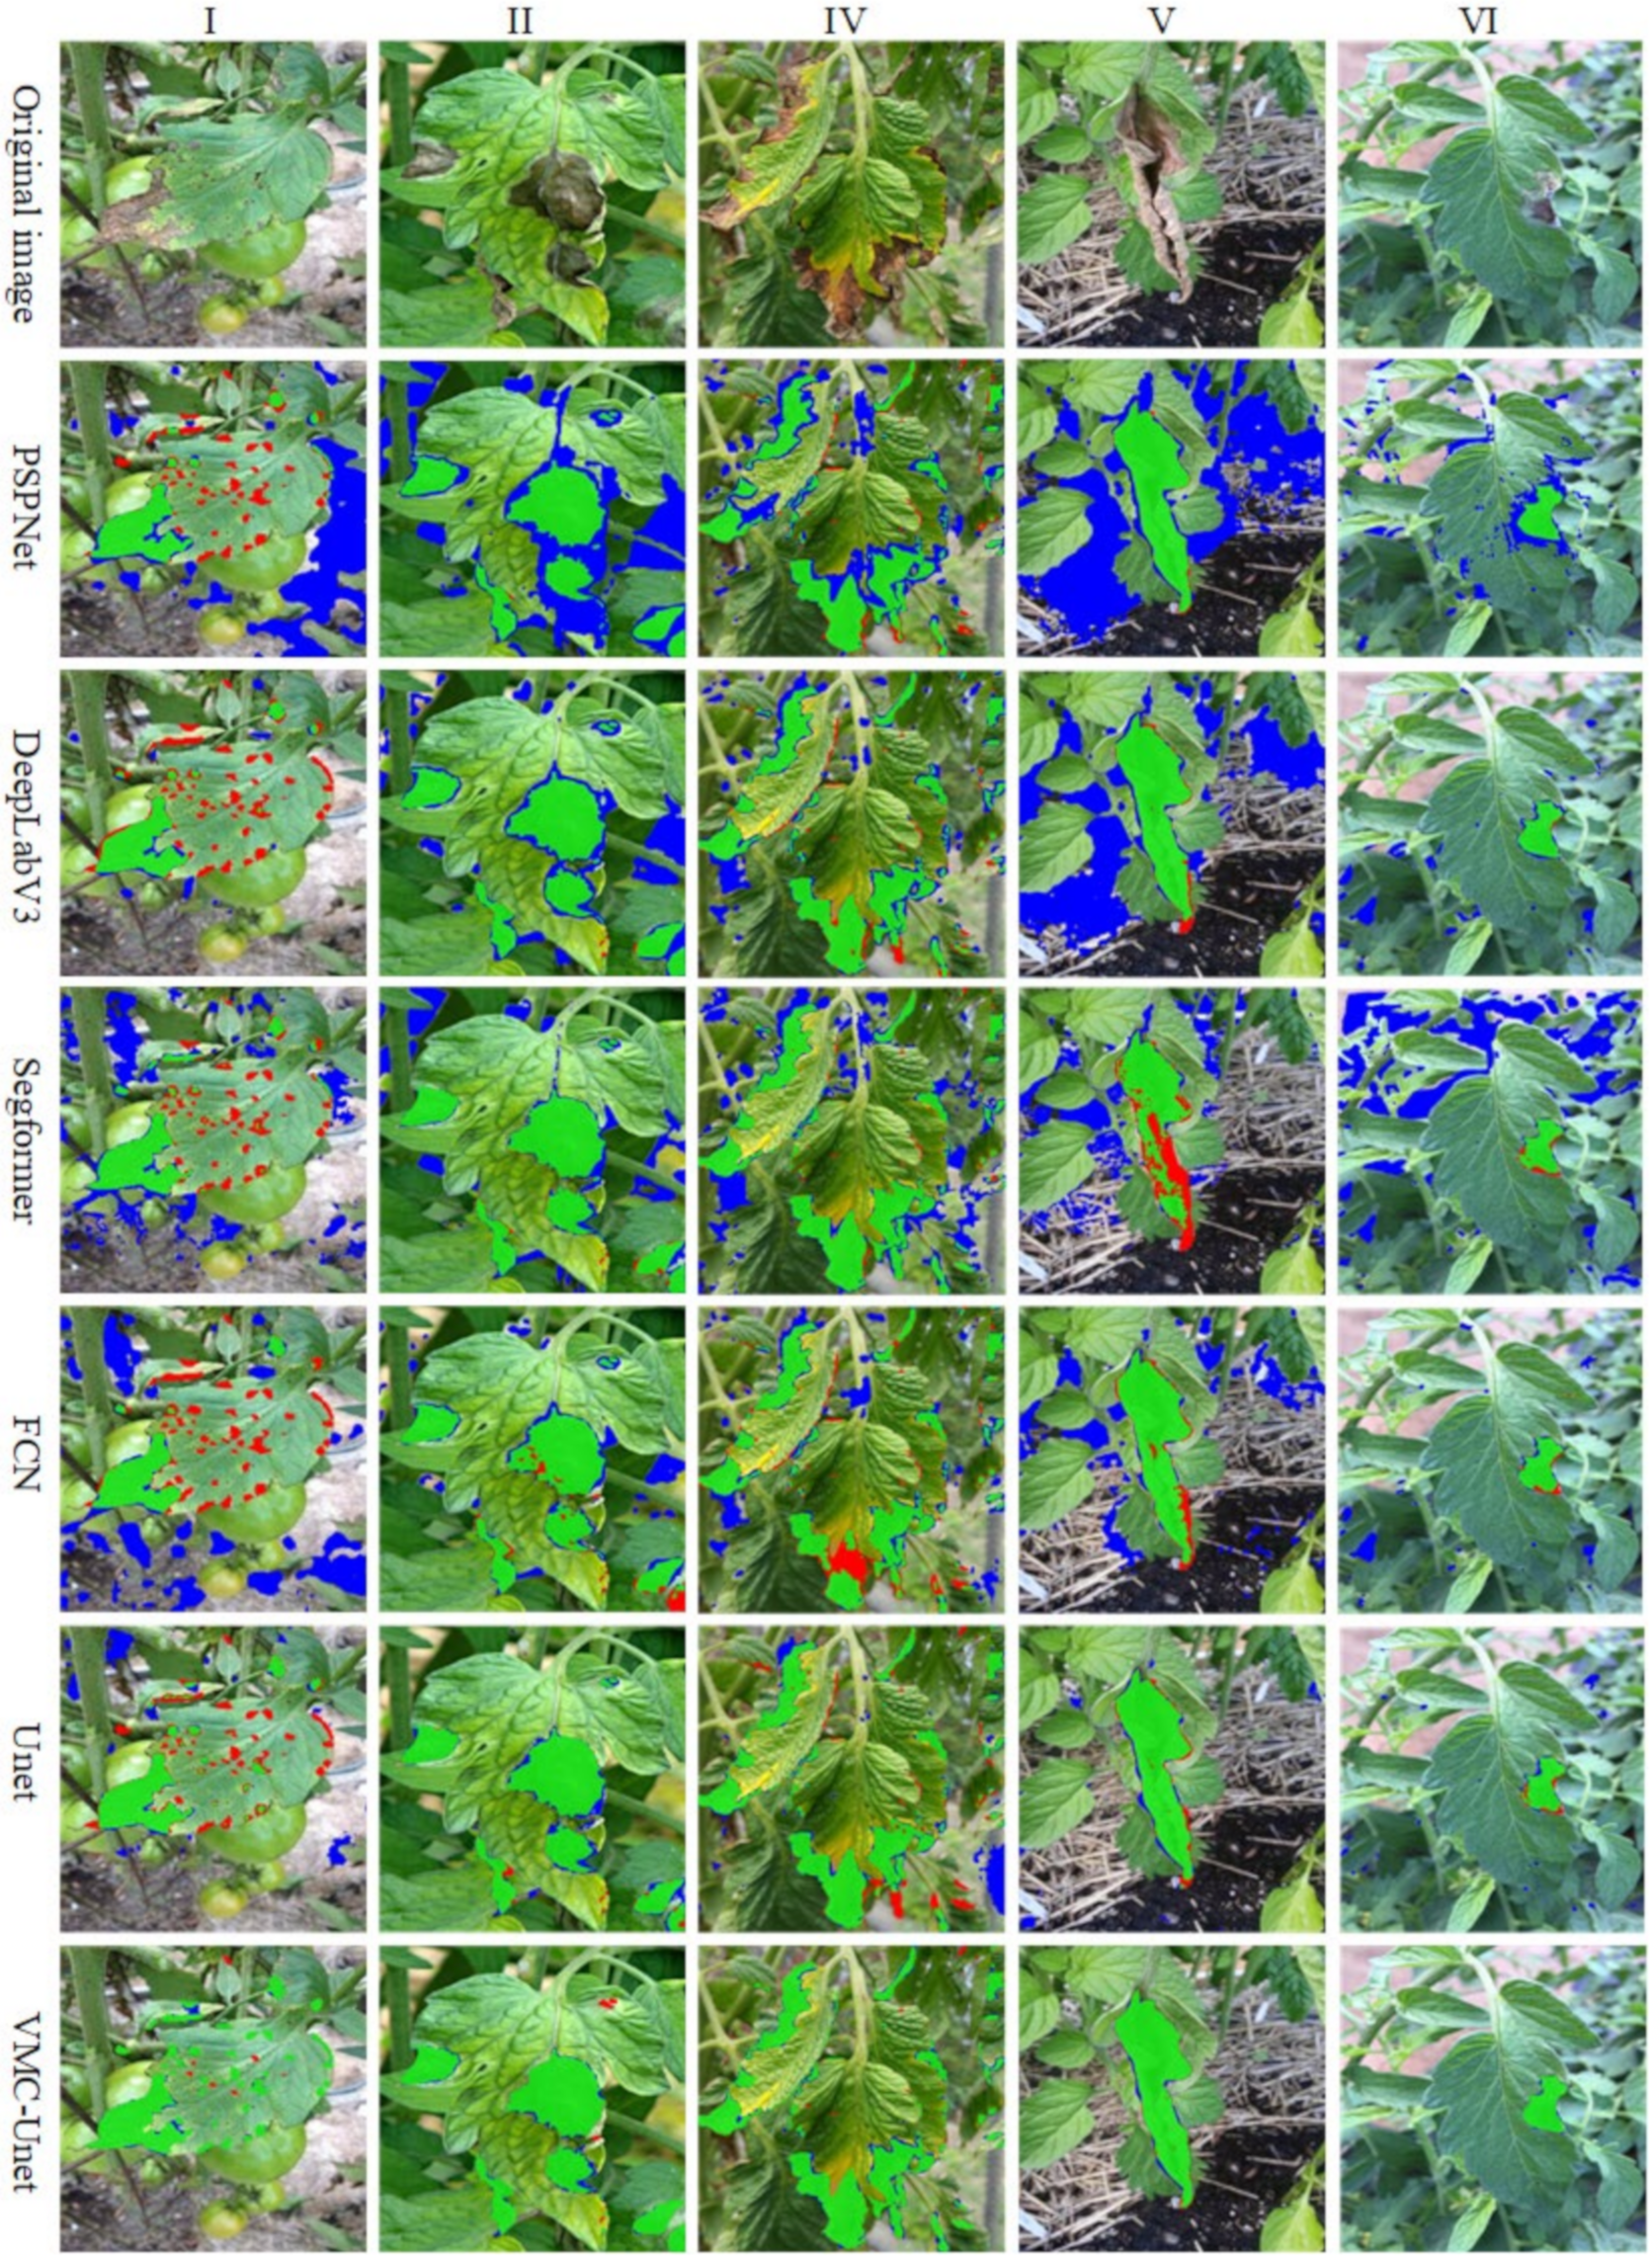
3.4. Comprehensive Model Performance Evaluation

To comprehensively evaluate the performance of different segmentation models on the tomato blight dataset, we conducted a comparative analysis of various network models, including FCN [28], PSPNet [29], SegFormer [30], DeepLabV3 [31], Unet [8], and our proposed VMC-Unet model. By comparing the performance metrics of each model, we can gain deeper insights into their overall effectiveness in lesion segmentation tasks.
Table 4 presents the detailed segmentation performance of different models on the tomato blight dataset. It is evident that traditional models such as FCN, PSPNet, and SegFormer exhibit relatively weak performance across various metrics, with accuracy scores of 76.93%, 75.87%, and 75.14% and F1 scores of 71.43%, 68.83%, and 63.24%, respectively. These results indicate that these models struggle with handling complex lesion morphologies and background noise. Although DeepLabV3 performs well in terms of accuracy (85.53%), its low recall rate (56.30%) results in a modest F1 score of 67.90%, indicating a high rate of missed detections.
In contrast, while the Unet model shows stable performance in early segmentation tasks, its overall performance remains limited, particularly in recall (63.30%) and F1 score (68.42%), where it fails to demonstrate a clear advantage. Conversely, the VMC-Unet model excels across all metrics, achieving an accuracy of 90.03%, a recall of 85.94%, and an F1 score of 87.94%. These data suggest that the VMC-Unet model, through the integration of ConvNeXt, Vision Mamba, and ASPP modules, significantly enhances the ability to recognize and segment complex lesion areas, achieving performance that substantially surpasses that of traditional models.
The performance of the models throughout the training process was reflected in Figure 9. Figure 9a illustrates the trend of pixel accuracy across epochs for each model during training. The VMC-Unet model demonstrated a clear advantage from the early stages, with pixel accuracy increasing rapidly and maintaining stability in subsequent training, ultimately reaching a high level of 97.82%. In contrast, other models showed slower growth in pixel accuracy and exhibit significant fluctuations in the later stages of training, particularly the SegFormer and PSPNet models, whose accuracy fluctuated noticeably across multiple epochs, indicating instability in handling complex segmentation tasks. Figure 9b further illustrated the changes in loss values during the training process. The VMC-Unet model consistently exhibited significantly lower loss values throughout training, stabilizing quickly within 10 epochs and ultimately maintaining a loss value below 0.2. In contrast, other models showed a slower decline in loss values, which remain relatively high, especially for the SegFormer and PSPNet models, whose loss values decreased minimally in the later stages of training, indicating bottlenecks in optimization and difficulty in further improving segmentation performance.
Figure 10 illustrates the performance of various models in practical segmentation tasks, providing a clear visual comparison of how each model handles complex lesion morphologies and background noise. It was evident from Figure 10 that the PSPNet model consistently exhibited significant over-segmentation across all test images, particularly in images I, II, and V, where extensive background areas were erroneously marked as lesions (highlighted in red). Furthermore, the model also suffered from under-segmentation, especially when lesion boundaries were blurred or lesions were small (e.g., in image VI), resulting in incomplete recognition of lesion areas. The DeepLabV3 model showed relatively better segmentation performance, particularly in images II, IV, and V, where the segmentation results were more accurate, with concentrated green areas. However, in images I and VI, some background regions were incorrectly segmented as lesions, and the model still struggled with fine detail processing at the lesion edges. The SegFormer model segmentation results in Figure 11 revealed more pronounced deficiencies. This model frequently encountered significant over-segmentation (as seen in images I, III, and V) and was prone to under-segmentation as well. The FCN model also struggled with over-segmentation and under-segmentation issues. In images I, III, and V, over-segmentation was particularly evident, and in more complex backgrounds (such as in image VI), the model failed to effectively distinguish between lesions and background. This indicated that while FCN was stable in basic segmentation tasks, it showed clear limitations in handling highly complex lesion morphologies and backgrounds. The Unet model demonstrated relatively stable segmentation performance in Figure 10. In most images, the Unet model effectively segments the lesion areas with fewer instances of over-segmentation or under-segmentation. However, in cases with blurred boundaries (e.g., in images I and VI), Unet still exhibited some recognition bias, leading to minor under-segmentation. In contrast, the VMC-Unet model showed superior segmentation results in Figure 10. Compared to other models, VMC-Unet exhibited almost no significant over-segmentation or under-segmentation, with green areas accurately covering all lesion regions and effectively excluding background noise. In all test images, the VMC-Unet model precisely identified and segmented the lesion areas, excelling in boundary processing and demonstrating strong feature extraction capabilities, even in complex backgrounds.
To comprehensively verify the robustness and generalization capabilities of different segmentation models, we tested the models on a public dataset in addition to the tomato blight dataset. The quantitative analysis in Table 5 and the visual comparison in Figure 11 evaluated the segmentation performance of each model across different lesion types, assessing their adaptability to varying data distributions and scenarios.
Table 5 presented the segmentation performance of each model on the public dataset, showing that the VMC-Unet model excelled across all metrics, demonstrating exceptional robustness and generalization capabilities. Specifically, VMC-Unet achieves 94.15% accuracy, 90.18% recall, 92.12% F1-score, 91.90% mIoU, and 97.33% pixel accuracy. These results significantly outperformed other models, indicating that VMC-Unet can maintain high segmentation accuracy and consistency across different lesion types. In contrast, the performance of other models was relatively weaker. Although the DeepLabV3 model performed well in terms of accuracy (93.42%), its recall was low (67.92%), leading to an F1-score of only 78.66% and a lower mIoU of 77.25%. The Unet model performed slightly below VMC-Unet on the public dataset but still surpasses other traditional models. Unet achieved an F1-score of 86.57%, an mIoU of 85.28%, and a pixel accuracy of 95.15%, showing strong generalization ability. However, its performance in handling complex lesions still had room for improvement compared to VMC-Unet. The performance of the PSPNet and SegFormer models was less impressive, particularly in terms of recall and F1-score, with recall rates of 65.53% and 60.24%, respectively, and F1-scores of 75.24% and 65.96%. This suggested that these models struggle to maintain high segmentation accuracy on new datasets, leading to higher risks of missed and false detections.
Figure 11 displays the lesion segmentation results of each model on the public dataset. The PSPNet and SegFormer models exhibited significant over-segmentation in most test images, especially in images I and IV, where the red areas are prominent. Due to their inadequate feature extraction capabilities, these models failed to accurately distinguish between lesions and background, resulting in large background areas being mistakenly identified as lesions. Additionally, the blue areas indicated that these models often miss true lesions, posing a high risk of under-segmentation. The DeepLabV3 model performed relatively well in images I and II; however, in images IV and V, it still showed noticeable over-segmentation and under-segmentation, indicating that its segmentation ability under complex lesion morphologies needs further improvement. The FCN model demonstrated some stability in segmentation results, but over-segmentation and under-segmentation issues persisted, particularly in images V and VI, where the blue and red areas were relatively large, indicating the model’s instability on the new dataset. The Unet model generally exhibited good segmentation performance in most images, but in cases with blurred boundaries or complex lesions (such as in images IV and V), there were still some instances of misjudgment and omission. The VMC-Unet model, however, performed exceptionally well in Figure 11, showing almost no significant over-segmentation or under-segmentation, with green areas accurately covering all lesion regions. Notably, in images I, II, and VI, the VMC-Unet model precisely identified lesions and effectively eliminated background noise interference.

4. Discussion

Agriculture serves as the foundation of global economic and social development, with crop diseases being a significant threat to agricultural productivity. In high-yield and economically valuable crops such as tomatoes, disease outbreaks can lead to severe economic losses. As agricultural practices have scaled up and intensified, traditional manual detection methods have become insufficient to meet modern agricultural demands, making the automation and intelligent detection of disease spots an increasingly critical research focus. The VMC-Unet model proposed in this study, which integrates ConvNeXt and Vision Mamba as backbone networks along with the ASPP module, achieves precise segmentation of tomato blight lesions and excels across several key performance metrics. Specifically, VMC-Unet attained a pixel accuracy of 97.82%, an F1 score of 87.94%, and a mIoU of 86.75% on the tomato blight dataset. These results indicated that the model enhanced segmentation accuracy while mitigating the risks of over-segmentation and under-segmentation in complex backgrounds and diverse lesion morphologies.
In line with related studies, our research focused on improving the robustness and generalization capabilities of lesion segmentation models, achieving notable success. For instance, Sun et al. (2023) introduced a multi-scale attention-based segmentation model that performed well in detecting maize rust but faced limitations in complex backgrounds [32]. Similarly, Fu et al. (2022) developed a lightweight deep segmentation network, which, while advantageous for specific disease detection, did not match the performance of our VMC-Unet in handling diverse lesion morphologies [33]. In contrast, VMC-Unet parallel backbone networks, ConvNeXt and Vision Mamba, not only improved adaptability to complex backgrounds but also enhanced multi-scale feature extraction through the ASPP module, resulting in superior performance across various challenging scenarios. Furthermore, compared to the lightweight CNN-based tomato leaf mold detection model proposed by Paul et al. [34], VMC-Unet demonstrated greater robustness when confronting more complex lesion morphologies. Although Paul’s model offered advantages in speed and computational efficiency, it lacked precision in handling lesion boundary details. VMC-Unet, by incorporating multi-level feature fusion, not only improved segmentation granularity but also showed stronger generalization across different crop diseases.
The ablation study results in Table 3 underscored the significant contributions of each module to the VMC-Unet model. Specifically, the independent introduction of ConvNeXt or Vision Mamba modules markedly improves the model’s accuracy, recall, and F1 score, highlighting their critical role in enhancing segmentation performance through multi-scale and feature-level extraction. Notably, when ConvNeXt and Vision Mamba were combined with the ASPP module, the model’s metrics reached their optimum, demonstrating the effectiveness of multi-scale feature fusion and parallel feature awareness in complex lesion segmentation tasks. The heatmap analysis in Figure 8 clearly illustrated the roles and contributions of each module in the lesion segmentation task. While the Unet model had certain limitations in feature extraction, making it challenging to address complex lesion morphologies and backgrounds, Vision Mamba and ConvNeXt excelled in enhancing feature focusing and precise localization, though they still left room for improvement when used independently. The combined application of these modules in VMC-Unet achieved optimal performance in lesion detection and segmentation tasks, accurately and efficiently identifying lesion regions while reducing the risks of false positives and missed detections. This demonstrated that a well-designed and integrated deep learning model can significantly enhance its practical application, especially in complex tasks like agricultural disease detection.
Further analysis of the impact of loss functions on the model (see Table 2 and Figure 5 and Figure 6) revealed that the traditional cross-entropy loss function underperforms in complex lesion segmentation tasks, with its loss value stabilizing but remaining relatively high in the later stages of training, resulting in lower accuracy, recall, and F1 scores. In contrast, the joint loss function incorporating Dice loss and Focal loss effectively addressed data imbalance and significantly improved the model’s ability to detect small lesion areas, consistent with the findings of Liu et al. (2023) in their study on the NanoSegmenter model [14]. Similarly, Momeny et al. (2023) applied a comparable loss function combination in their segmentation of apple scab, significantly enhancing the detection accuracy of small lesion areas [35]. Notably, the VMC-Unet model demonstrated strong robustness and generalization across multiple experimental datasets, as further evidenced by its performance on public datasets (see Table 5 and Figure 11). The model achieved over 90% accuracy and an F1 score on these datasets, indicating its capability to handle lesion segmentation tasks across different crops and its strong cross-dataset applicability. This robustness and generalization capability laid a solid foundation for the model’s widespread application.
However, this study has certain limitations: the dataset primarily consisted of tomato samples from greenhouse environments in the Xinjiang region, which imposed some geographic and environmental constraints. Therefore, the model’s generalization ability required further validation across broader regions and more diverse crop environments. Additionally, despite the use of data augmentation techniques, the dataset’s limited scale may restrict the model’s performance in larger-scale and more complex real-world scenarios. Furthermore, the model training relies on high-performance computing resources, posing challenges for maintaining efficiency in resource-constrained agricultural environments. Therefore, further research is needed to optimize and lightweight the model to ensure its practicality and efficiency in real agricultural applications.
Although VMC-Unet has shown outstanding performance in tomato lesion segmentation tasks, its effectiveness in detecting diseases in other crops remains underexplored. Future studies should aim to apply this model to the detection of various crop diseases, verifying its generalization capability across different crops and disease types to further enhance its applicability. Moreover, in practical agricultural production, disease detection is often part of an integrated system. Future research could consider integrating VMC-Unet with other agriculturally intelligent systems, such as disease prediction and precision spraying systems, to build a more comprehensive and intelligent agricultural management system that achieves full-process automation from disease detection to prevention. Additionally, with the growing use of multimodal data, integrating information from spectral and thermal imaging for lesion detection presents a promising research direction. By fusing different types of multimodal data, the model segmentation accuracy and applicability can be further improved, particularly in complex agricultural environments.

5. Conclusions

In this study, we developed the VMC-Unet model, an innovative asymmetric segmentation architecture tailored for the precise detection of tomato blight lesions. The model demonstrated exceptional robustness and generalization capabilities, as evidenced by its high accuracy and F1 scores on both tomato-specific and public datasets, highlighting its potential for broad applicability in agricultural disease detection. Our conclusions are as follows:
  • This study designed the VMC-Unet model, an advanced asymmetric lesion segmentation model tailored for the complex task of tomato blight detection. By integrating ConvNeXt and Vision Mamba as dual backbone networks and employing the ASPP module, the model significantly improved segmentation accuracy in challenging agricultural environments.
  • Extensive experiments demonstrated that VMC-Unet outperforms traditional segmentation models across multiple key metrics. Specifically, the model achieved a pixel accuracy of 97.82%, an F1 score of 87.94%, and an mIoU of 86.75% on the tomato blight dataset.
  • We designed the joint loss function for training the lesion segmentation model and achieved satisfactory results.
Although VMC-Unet showed exceptional performance in tomato lesion segmentation, its application to other crops and disease types remains underexplored. Future research should aim to extend the model’s applicability across various crops and integrate it with other intelligent agricultural systems, such as disease prediction and precision spraying, to create a comprehensive and automated agricultural management system.

Author Contributions

Conceptualization, M.D. and H.L.; methodology, D.S. and C.L; software, D.S.; validation, L.L., D.S., H.S. and C.L.; formal analysis, C.L. and L.L.; investigation, L.L., H.S. and C.L.; resources, M.D.; data curation, D.S.; writing—original draft preparation, D.S.; writing—review and editing, D.S. and C.L.; supervision, M.D. and H.L.; project administration, M.D. and H.L.; funding acquisition, M.D. and H.L. All authors have read and agreed to the published version of the manuscript.

Funding

This research was funded by the Xinjiang Uygur Autonomous Region Key R&D Project (2022B02032-3), the National Key Technology Research and Development Program of China (2022YFE0199500), and the EU FP7 Framework Program (PIRSES-GA-2013-612659).

Data Availability Statement

The original contributions presented in this study are included in the article; further inquiries can be directed to the corresponding author.

Conflicts of Interest

The authors declare no conflicts of interest.

References

  1. Fatima, A.; Ali, S.; Azmat, S.; Amrao, L.; Ghani, M.U.; Iftikhar, Y.; Zeshan, M.A.; Ahmad, A.; Kalsoom, H. Morphological assessment of resistance potential in tomato against early blight disease and its management. Pak. J. Agric. Res. 2024, 37, 88–189. [Google Scholar] [CrossRef]
  2. Sundararaman, B.; Jagdev, S.; Khatri, N. Transformative role of artificial intelligence in advancing sustainable tomato (Solanum lycopersicum) disease management for global food security: A comprehensive review. Sustainability 2023, 15, 11681. [Google Scholar] [CrossRef]
  3. Thangaraj, R.; Anandamurugan, S.; Pandiyan, P.; Kaliappan, V.K. Artificial intelligence in tomato leaf disease detection: A comprehensive review and discussion. J. Plant Dis. Prot. 2022, 129, 469–488. [Google Scholar] [CrossRef]
  4. Al Hiary, H.; Ahmad, S.B.; Reyalat, M.; Braik, M.; Alrahamneh, Z. Fast and accurate detection and classification of plant diseases. Int. J. Comput. Appl. 2011, 17, 31–38. [Google Scholar] [CrossRef]
  5. Kamilaris, A.; Prenafeta-Boldú, F.X. Deep learning in agriculture: A survey. Comput. Electron. Agric. 2018, 147, 70–90. [Google Scholar] [CrossRef]
  6. Zhang, Y.; Wa, S.; Liu, Y.; Zhou, X.; Sun, P.; Ma, Q. High-accuracy detection of maize leaf diseases CNN based on multi-pathway activation function module. Remote Sens. 2021, 13, 4218. [Google Scholar] [CrossRef]
  7. Alzahrani, M.S.; Alsaade, F.W. Transform and deep learning algorithms for the early detection and recognition of tomato leaf disease. Agronomy 2023, 13, 1184. [Google Scholar] [CrossRef]
  8. Ronneberger, O.; Fischer, P.; Brox, T. U-Net: Convolutional Networks for Biomedical Image Segmentation. In Proceedings of the International Conference on Medical Image Computing and Computer-Assisted Intervention, Munich, Germany, 5–9 October 2015; pp. 234–241. [Google Scholar]
  9. He, K.; Gkioxari, G.; Dollár, P.; Girshick, R. Mask R-CNN. In Proceedings of the IEEE International Conference on Computer Vision, Venice, Italy, 22–29 October 2017; pp. 2961–2969. [Google Scholar]
  10. Chen, L.-C.; Papandreou, G.; Kokkinos, I.; Murphy, K.; Yuille, A.L. DeepLab: Semantic Image Segmentation with Deep Convolutional Nets, Atrous Convolution, and Fully Connected CRFs. IEEE Trans. Pattern Anal. Mach. Intell. 2018, 40, 834–848. [Google Scholar] [CrossRef]
  11. Li, L.; Zhang, S.; Wang, B. Plant disease detection and classification by deep learning—A review. IEEE Access 2021, 9, 56683–56698. [Google Scholar] [CrossRef]
  12. Hu, X.; Wang, R.; Du, J.; Hu, Y.; Jiao, L.; Xu, T. Class-attention-based lesion proposal convolutional neural network for strawberry diseases identification. Front. Plant Sci. 2023, 14, 1091600. [Google Scholar] [CrossRef]
  13. Bhujel, A.; Kim, N.-E.; Arulmozhi, E.; Basak, J.K.; Kim, H.-T. A lightweight attention-based convolutional neural networks for tomato leaf disease classification. Agriculture 2022, 12, 228. [Google Scholar] [CrossRef]
  14. Liu, Y.; Song, Y.; Ye, R.; Zhu, S.; Huang, Y.; Chen, T.; Zhou, J.; Li, J.; Li, M.; Lv, C. High-Precision Tomato Disease Detection Using NanoSegmenter Based on Transformer and Lightweighting. Plants 2023, 12, 2559. [Google Scholar] [CrossRef] [PubMed]
  15. Deng, Y.; Xi, H.; Zhou, G.; Chen, A.; Wang, Y.; Li, L.; Hu, Y. An effective image-based tomato leaf disease segmentation method using MC-UNet. Plant Phenomics 2023, 5, 0049. [Google Scholar] [CrossRef]
  16. Perveen, K.; Debnath, S.; Pandey, B.; Chand, S.P.; Bukhari, N.A.; Bhowmick, P.; Alshaikh, N.A.; Arzoo, S.; Batool, S. Deep learning-based multiscale CNN-based U network model for leaf disease diagnosis and segmentation of lesions in tomato. Physiol. Mol. Plant Pathol. 2023, 128, 102148. [Google Scholar] [CrossRef]
  17. Kaur, P.; Harnal, S.; Gautam, V.; Singh, M.P.; Singh, S.P. Performance analysis of segmentation models to detect leaf diseases in tomato plant. Multimed. Tools Appl. 2024, 83, 16019–16043. [Google Scholar] [CrossRef]
  18. Zhao, X.; Li, X.; Ye, S.; Feng, W.; You, X. Multi-Scale Tomato Disease Segmentation Algorithm Based on Improved U-Net Network. J. Comput. Eng. Appl. 2022, 58, 216. [Google Scholar]
  19. Mohanty, S.P.; Hughes, D.P.; Salathé, M. Using deep learning for image-based plant disease detection. Front. Plant Sci. 2016, 7, 1419. [Google Scholar] [CrossRef]
  20. Lu, Y.; Yi, S.; Zeng, N.; Liu, Y.; Zhang, Y. Identification of rice diseases using deep convolutional neural networks. Neurocomputing 2017, 267, 378–384. [Google Scholar] [CrossRef]
  21. Yadav, S.; Shukla, S. Analysis of k-fold cross-validation over hold-out validation on colossal datasets for quality classification. In Proceedings of the 2016 IEEE 6th International Conference on Advanced Computing (IACC), Bhimavaram, India, 27–28 February 2016; pp. 78–83. [Google Scholar]
  22. Liu, Z.; Mao, H.; Wu, C.Y.; Feichtenhofer, C.; Darrell, T.; Xie, S. A convnet for the 2020s. In Proceedings of the IEEE/CVF Conference on Computer Vision and Pattern Recognition, New Orleans, LA, USA, 18–24 June 2022; pp. 11976–11986. [Google Scholar]
  23. Zhu, L.; Liao, B.; Zhang, Q.; Wang, X.; Liu, W.; Wang, X. Vision mamba: Efficient visual representation learning with bidirectional state space model. arXiv 2024, arXiv:2401.09417. [Google Scholar]
  24. Wang, Y.; Liang, B.; Ding, M.; Li, J. Dense semantic labeling with atrous spatial pyramid pooling and decoder for high-resolution remote sensing imagery. Remote Sens. 2018, 11, 20. [Google Scholar] [CrossRef]
  25. Sudre, C.H.; Li, W.; Vercauteren, T.; Ourselin, S.; Jorge Cardoso, M. Generalised dice overlap as a deep learning loss function for highly unbalanced segmentations. In Deep Learning in Medical Image Analysis and Multimodal Learning for Clinical Decision Support: Third International Workshop, DLMIA 2017, Proceedings of the 7th International Workshop, ML-CDS 2017, Held in Conjunction with MICCAI 2017, Québec City, QC, Canada, 14 September 2017; Proceedings 3; Springer International Publishing: Berlin/Heidelberg, Germany, 2017; pp. 240–248. [Google Scholar]
  26. Lin, T.Y.; Goyal, P.; Girshick, R.; He, K.; Dollar, P. Focal loss for dense object detection. In Proceedings of the IEEE International Conference on Computer Vision (ICCV), Venice, Italy, 22–29 October 2017; pp. 2980–2988. [Google Scholar]
  27. Müller, R.; Kornblith, S.; Hinton, G.E. When does label smoothing help? In Proceedings of the Advances in Neural Information Processing Systems, Vancouver, BC, Canada, 8–14 December 2019; p. 32. [Google Scholar]
  28. Long, J.; Shelhamer, E.; Darrell, T. Fully convolutional networks for semantic segmentation. In Proceedings of the IEEE Conference on Computer Vision and Pattern Recognition, Boston, MA, USA, 7–12 June 2015; pp. 3431–3440. [Google Scholar]
  29. Zhao, H.; Shi, J.; Qi, X.; Wang, X.; Jia, J. Pyramid scene parsing network. In Proceedings of the IEEE Conference on Computer Vision and Pattern Recognition, Honolulu, HI, USA, 21–26 July 2017; pp. 2881–2890. [Google Scholar]
  30. Xie, E.; Wang, W.; Yu, Z.; Anandkumar, A.; Alvarez, J.M.; Luo, P. SegFormer: Simple and efficient design for semantic segmentation with transformers. Adv. Neural Inf. Process. Syst. 2021, 34, 12077–12090. [Google Scholar]
  31. Chen, L.C. Rethinking atrous convolution for semantic image segmentation. arXiv 2017, arXiv:1706.05587. [Google Scholar]
  32. Sun, L.; He, J.; Zhang, L. CASF-MNet: Multi-scale network with cross attention mechanism and spatial dimension feature fusion for maize leaf disease detection. Crop. Prot. 2024, 180, 106667. [Google Scholar] [CrossRef]
  33. Fu, L.; Li, S.; Sun, Y.; Mu, Y.; Hu, T.; Gong, H. Lightweight-convolutional neural network for apple leaf disease identification. Front. Plant Sci. 2022, 13, 831219. [Google Scholar] [CrossRef]
  34. Paul, S.G.; Biswas, A.A.; Saha, A.; Zulfiker, S.; Ritu, N.A.; Zahan, I.; Rahman, M.; Islam, M.A. A real-time application-based convolutional neural network approach for tomato leaf disease classification. Array 2023, 19, 100313. [Google Scholar] [CrossRef]
  35. Momeny, M.; Jahanbakhshi, A.; Neshat, A.A.; Hadipour-Rokni, R.; Zhang, Y.-D.; Ampatzidis, Y. Detection of citrus black spot disease and ripeness level in orange fruit using learning-to-augment incorporated deep networks. Ecol. Inform. 2022, 71, 101829. [Google Scholar] [CrossRef]
Figure 1. Example of dataset images and masks. Red areas indicate labelled spot masks.
Agronomy 14 02227 g001
Figure 2. Structure of the VMC-Unet model.
Agronomy 14 02227 g002
Figure 3. Parallel feature-aware backbone network structure.
Agronomy 14 02227 g003
Figure 4. Structure of feature fusion module.
Agronomy 14 02227 g004
Figure 5. Trend of loss values with training rounds for different loss functions. ➀: Cross-entropy loss; ➁: Dice loss; ➂: Focal loss; ➃: Label smoothing.
Agronomy 14 02227 g005
Figure 6. Effect of different loss functions on pixel accuracy. ➀: Cross-entropy loss; ➁: Dice loss; ➂: Focal loss; ➃: Label smoothing.
Agronomy 14 02227 g006
Figure 7. Effect of different modules on pixel accuracy.
Agronomy 14 02227 g007
Figure 8. Heat maps of the modules focusing on tomato leaf spot characteristics. Warm regions represent the regions that the model pays most attention to, the darker the colour indicates that the part contributes more to the prediction of the current category; cool regions indicate the parts that the model considers irrelevant to the category or contributes less to it, with lower activation values and the darker the colour, the lower the contribution.
Agronomy 14 02227 g008
Figure 9. Comparison of segmentation performance of different network models. (a) Pixel accuracy of different models. (b) Loss variation of different models.
Agronomy 14 02227 g009
Figure 10. Examples of segmentation of tomato blight lesions by different network models. The red area indicates that the model mistakenly segmented the background as a diseased spot (over-segmentation); the green area indicates that the model accurately segmented the diseased spot; and the blue area indicates that the model incorrectly recognized the diseased spot as the background.
Agronomy 14 02227 g010
Figure 11. Examples of segmentation of diseased spots on the public dataset by different network models. The red area indicated that the model mistakenly segmented the background as a diseased spot (over-segmentation); the green area indicated that the model accurately segmented the diseased spot; and the blue area indicated that the model incorrectly recognized the diseased spot as the background.
Agronomy 14 02227 g011
Table 1. Details of the experimental dataset.
Dataset CategoryOriginal ImageData AugmentationDataset Division
Training SetTraining SetTraining Set
Tomato blight dataset6301328930930930
Kaggle dataset5882940205820582058
Table 2. Effect of different loss functions on model performance.
Loss FunctionPrecisionRecallF1mIoUAccuracy
77.2750.5461.1165.2887.84
➀ + ➁ + ➃85.3981.7783.5183.8496.33
➁ + ➂ + ➃90.0385.9487.9486.7597.82
➀: Cross-entropy loss; ➁: Dice loss; ➂: Focal loss; ➃: Label smoothing.
Table 3. Results of ablation experiments.
ModulePrecisionRecallF1mIoUPA
ASPPConvNeXtVision Mamba
×××74.4463.3068.4271.9392.52
××85.9080.1182.9182.9495.6
××85.3179.2982.2382.7296.23
×85.3781.7783.5383.9496.35
90.0385.9487.9486.7597.82
×××74.4463.3068.4271.9392.52
× means this module is not included. √ means this module is included.
Table 4. Comprehensive evaluation of segmentation effectiveness of different network models on the tomato blight dataset.
ModelPrecisionRecallF1mIoUPA
FCN76.9366.6671.4373.5592.35
PSPNet75.8762.9968.8371.5291.46
SegFormer75.1454.6063.2467.9090.42
DeepLabV385.5356.3067.9070.8191.13
Unet74.4463.3068.4271.9392.52
VMC-Unet90.0385.9487.9486.7597.82
Table 5. Comprehensive evaluation of segmentation effectiveness of different network models on public datasets.
ModelPresionRecallF1mIoUPA
FCN87.3271.5178.6377.6291.88
PSPNet88.3265.5375.2474.3090.06
SegFormer72.8860.2465.9667.2687.14
DeepLabV393.4267.9278.6677.2591.33
Unet91.4082.1286.5785.2895.15
VMC-Unet94.1590.1892.1291.9097.33
Disclaimer/Publisher’s Note: The statements, opinions and data contained in all publications are solely those of the individual author(s) and contributor(s) and not of MDPI and/or the editor(s). MDPI and/or the editor(s) disclaim responsibility for any injury to people or property resulting from any ideas, methods, instructions or products referred to in the content.

