Article

Impact of Pulse Electric Field Stimulation on Negative Air Ion Release Capacity of Snake Plants

1
College of Agriculture, Fujian Agriculture and Forestry University, Fuzhou 350002, China
2
College of Mechanical and Electrical Engineering, Fujian Agriculture and Forestry University, Fuzhou 350002, China
3
Ministry of Agriculture and Rural Affairs Cross-Strait Agricultural Technology Cooperation Center, Fuzhou 350002, China
*
Author to whom correspondence should be addressed.
These authors contributed equally to this work.
Agronomy 2024, 14(10), 2248; https://doi.org/10.3390/agronomy14102248
Submission received: 23 August 2024 / Revised: 22 September 2024 / Accepted: 27 September 2024 / Published: 29 September 2024
(This article belongs to the Section Horticultural and Floricultural Crops)

Abstract

:
To investigate the effects of pulse electric field stimulation on the photosynthetic electron transport chain and negative air ion (NAI) release capacity of snake plants, the chlorophyll content, fluorescence induction kinetics curve (OJIP curve), chlorophyll fluorescence parameters, and NAI release concentration of snake plants kept under identical greenhouse conditions under different pulse electric field stimulations were compared and analyzed. The experimental results show that (1) after pulse electric field stimulation, the chlorophyll content in treatment group T1 (5 kv) and T2 (7 kv) of snake plants increased by 6.30% and 6.70%, respectively, with significant differences observed between the two treatment groups and the control group (CK). (2) In both treatment groups, the OJIP curve exhibited higher values for the inflection point (I) and peak (P) compared to the origin (O) and inflection point (J) values, with the rising trend in the I–P segment being more gentle than that of the O–J segment. Additionally, the J band was above 0, with the peak value in the T2 group being higher than that in the T1 group. (3) The chlorophyll fluorescence parameters showed fluctuating variations. Specifically, Fm, TRo/CSo, ETo/CSo, and DIo/CSo showed ascending trends in the treatment groups. Fv/Fo, Sm, and ABS/RC exhibited descending trends; Fv/Fm, Vj, ETo/RC, and φEo showed relatively minor changes. The PIabs displayed a decreasing trend. The PItotal in the CK was greater than that in the T1 and T2 groups. (4) After 4 h of pulse electric field stimulation, the NAI concentration increased by 87.60% in the T1 group and by 62.09% in the T2 group, compared to the same measurement taken at 3 h. Pulse electric field impacts the photosynthetic electron transport chain of snake plants, thereby influencing their NAI release capacity. This study aims to elucidate the physiological responses of the chloroplasts in snake plants to pulsed electric field stimulation and to lay the foundation for enhancing the plant’s release of negative air ion concentrations through physical and technological means.

1. Introduction

The snake plant (Sansevieria trifasciata var. harnii) is a perennial herbaceous plant belonging to the family of Asparagaceae under the genus Agave americana L. [1,2]. It prefers warm and humid environments, is drought-tolerant, and thrives in both bright and shaded conditions [3,4]. Due to its ornamental and medicinal properties, it has important applications in areas such as nutrition, health, and landscaping. In its natural state, the snake plant emits negative air ions (NAIs), which are known for their ability to improve air quality in small spaces, boost memory and immunity, and act as natural sterilizers [5,6]. NAIs are known for their various potential applications and are often referred to as “air vitamins” or “phytohormones” [7,8]. Under normal circumstances, plants release a low concentration of NAIs. To enhance the production of NAIs in plants, artificial interventions can be employed to stimulate plants to release more ions. One common method is the use of pulsed electric field technology. Pulsed electric field (PEF) technology is a novel physical processing technique characterized by its short processing time, low energy consumption, and eco-friendly nature, making it suitable for applications in food processing, material extraction, and plant treatment [9,10,11,12]. Chlorophyll fluorescence parameters are effective indicators of a plant’s photosynthetic reaction process and its relationship with the external environment [13,14,15,16,17]. Therefore, it is crucial to further analyze the snake plant’s resilience to pulsed electric field stimulation and investigate the impact of this stimulation on the plant’s photosynthetic electron transport chain. Among thousands of plants from over dozens of families, snake plants have been identified as one of the plants that can endure continuous pulsed electric field stimulation and exhibit strong negative ion-emitting capabilities. Xi et al. reported that low-pressure pulsed electric fields can influence the mechanism of drought resistance in crop seedlings [18]. Fratianni, A. et.al. utilized PEF to stimulate carrots and found that PEF can shorten the drying time of carrots [19]. Wang et al. demonstrated that by applying PEF stimulation to the root zone soil of potted plants, the plants’ ability to release negative ions can be significantly enhanced [20]. They also proved that the release of NAIs by plants is a physiological change rather than a simple physical change. Wu R.Y. et al. used PEF to stimulate plants and observed that the plants’ ability to release NAIs is closely related to the characteristics of leaf stomata [21]. They also pointed out that under the influence of pulsed electric fields, the greater the opening degree and density of leaf stomata, the stronger the ion release capacity. Wang Hongyan utilized PEF to stimulate plants and found that the chlorophyll content of plants is related to their ability to release NAIs. Additionally, as the intensity of pulsed electric fields increases, cell organelles like chloroplasts experience different degrees of damage, leading to a decrease in the plant’s ability to release NAIs [22].
The experiment integrated previous research on stimulating plants with pulsed electric fields and simultaneously applied additional experimental factors targeting plant photosynthesis, aiming to explore the correlation between the concentration level of negative air ions released by plants and factors such as daily photosynthetic rate and light intensity [23,24]. Stimulating plants with pulsed electric fields has been proved to increase the opening of stomata, but excessive electric field strength can lead to damage to the chloroplast structure, chlorophyll degradation, and a decrease in the plant’s ability to release NAIs. This suggests a close relationship between a plant’s NAI release capability and photosynthesis, as well as its chloroplast structure. Building upon these findings, this study analyzed the NAI release capacity, changes in chlorophyll content, rapid chlorophyll fluorescence induction kinetics curve (OJIP), and variations in chlorophyll fluorescence parameters of snake plants. The objective is to enhance the snake plant’s ability to release NAIs, providing a theoretical basis for cultivation control techniques and the utilization of physical technology to develop plant genetic resources that efficiently release NAIs.

2. Materials and Methods

2.1. Experimental Samples

To investigate the mechanism of chloroplast response to pulsed electric field stimulation in the release of NAIs by snake plants, the materials for this experiment were purchased from the Baihua Village Flower Wholesale Market in Zhangzhou, Fujian. Snake plants of consistent growth cycles, uniform growth status, and basically identical agronomic morphological indicators such as leaf length and leaf area, with an average height of about 35 cm and a width of 20 cm, were selected to eliminate other influencing factors. The materials were transplanted into 20 cm diameter non-porous flower pots, with one plant per pot, for the later pulsed electric field experiments. Prior to the experiment, the materials in each group were acclimatized to the indoor greenhouse environment for about a week.
The KEC-990 Improved Air Ion Counter (Kyouritsu Electronics Co., Ltd., Japan), with a measuring range of 100 to 19.99 × 10⁴ individuals per cubic centimeter, was used for the experiment.
The pulsed electric field was generated using an electric pulse stimulator (College of Mechanical and Electrical Engineering, Fujian Agriculture and Forestry University, Fuzhou, China) jointly developed by the Cross-Strait Agricultural Technology Cooperation Center of Fujian Agriculture and Forestry University and the School of Mechanical and Electrical Engineering of Fujian Agriculture and Forestry University.

2.2. Experimental Method

2.2.1. Pulsed Electric Field Setup

Due to the impact of external factors such as light, the experiment was conducted at the end of January 2024 under clear, dry weather conditions with no wind. The experimental setup was located at the experimental base of the School of Mechanical and Electrical Engineering of Fujian Agriculture and Forestry University. The indoor temperature was maintained at around 26 ± 2 °C to ensure consistency. The pulsed device was placed in a self-built indoor space to minimize the influence of natural and human factors on the experiment results. Our team previously stimulated snake plants with different intensities of pulsed electric fields, and the optimal pulsed electric field stimulation parameter for snake plants was 5 kv [25]. Therefore, for this experiment, the following three experimental groups were set up: 0 kv (control group), 5 kv (Treatment 1; T1), and 7 kv (Treatment 2; T2), for which the experimental pulse frequency was 1 Hz. Each group consisted of 5 pots of snake plant samples. Four fully expanded leaves from each snake plant were measured, including one new leaf at an approximately 75° angle to the ground, two mature leaves at around 65°, and one old leaf at approximately 50°. The process of taking four leaves from the same plant material sample and selecting three points on each leaf for sampling, thus constituting three repetitions, lead to a total of 12 data points per snake plant. Before measuring the concentration of NAIs released by plants under the influence of pulsed electric fields, the non-porous flower pots were placed in the experimental setup. Subsequently, the probes of the electric pulse stimulator were buried 5 cm deep in the soil around the plant stem at a distance of 5 cm to prevent potential damage to the roots of the snake plant that could affect the experimental results.

2.2.2. Measurement of Negative Air Ions

During the experiment, the KEC-990 negative oxygen ion detector (Kyouritsu Electronics Co., Ltd., Japan) was placed in the self-built space along with the plant samples. The receiving end of the detector was aimed at the tip of the snake plant leaves to collect the released negative air ions (NAIs). The plant samples had been acclimated in a greenhouse for one week to eliminate the influence of indoor environmental factors on the experimental results. Therefore, the time for detecting the release of NAIs was chosen to be between 8:00 a.m. and 6:00 p.m. The T1 group experiment was conducted from 8:00 a.m. to 1:00 p.m., and the T2 group experiment was conducted from 1:00 p.m. to 6:00 p.m. The NAI concentration for each treatment group was recorded every hour at 0 h, 1 h, 2 h, 3 h, and 4 h, respectively. The experimental data were collected using the KEC-990 negative oxygen ion detector connected to the KEC-R2 voltage recorder (Kyouritsu Electronics Co., Ltd., Japan). The KEC-R2 voltage recorder was connected to a computer via an RS-232 interface to store and organize the data. The KEC-R2 voltage recorder system was set to collect data every 30 s. Accordingly, a total of 120 data points were collected for each treatment group during each experimental time period.

2.2.3. Measurement of Chlorophyll Content and Chlorophyll Fluorescence Parameters

For the CK and the T1 and T2 treatment groups that received pulsed electric field stimulation, the data collection method was consistent with the method used to measure NAI concentration. The treatment groups were continuously stimulated for 4 h, with data being measured once every hour, meaning data were collected at one hour intervals, specifically at 0 h, 1 h, 2 h, 3 h, and 4 h, to measure the chlorophyll content and chlorophyll fluorescence parameters of the leaves.
The SPAD-502 chlorophyll meter (Konica Minolta, Japan) was utilized to detect the relative chlorophyll content of snake plant leaves. Four leaves were selected from each of the three groups (CK, T1, and T2). Since the NAIs were primarily released at the leaf tip, the SPAD chlorophyll meter was positioned approximately 7 to 10 cm from the leaf tip to take measurements. Three experimental points were selected on each leaf for three repetitions to observe the changes in snake plant chlorophyll content after pulsed electric field stimulation.
The portable plant efficiency analyzer (PEA, Hansatech Instruments, UK), was used to measure the chlorophyll fluorescence parameters of the leaves. Before measurement, snake plant leaves underwent a 30 min dark adaptation period and OJIP curves were plotted (data from OJIP curves were analyzed using the JIP test method). Various chlorophyll fluorescence parameters were calculated, including initial fluorescence intensity (Fo), maximum fluorescence intensity (Fm), maximum light quantum efficiency (Fv/Fm), potential activity of the PSII photosynthetic system (Fv/Fo), relative variable fluorescence intensity at point J (Vj), number of electron transfers at the PSII acceptor side (Sm), electron transfer quantum yield (φEo), energy absorbed per reaction center (ABS/RC), energy dissipated per reaction center (DIo/RC), electron transfer energy per reaction center (ETo/RC), energy captured per reaction center (TRo/RC), energy of electron transfer per unit area (ETo/CSo), energy capture per unit area (TRo/CSo), dissipated energy per unit area (DIo/CSo), performance index based on the absorption of light energy (PIabs), and comprehensive performance (PItotal). These chlorophyll fluorescence parameters can be classified into raw fluorescence parameters and physiological parameters. The physiological parameters can be derived from basic fluorescence parameters.

2.3. Data Statistics and Analysis

The data were processed using SPSS 16.0. An ANOVA was employed for data statistical analysis, and the LSD method was used for analyzing significant differences. Graphs and charts were created using Excel 2016 and Origin 2022.

3. Results

3.1. Changes in Chlorophyll Content in Snake Plant Leaves

Table 1 shows the dynamic changes in the chlorophyll content of snake plant leaves after pulsed electric field stimulation at 0 kV (CK), 5 kV (T1), and 7 kV (T2). In the period of 0 to 4 h after pulsed electric field stimulation, there was a fluctuating trend in SPAD values across all treatment groups as time progressed. Specifically, at 0, 1, 2, 3, and 4 h, both the T1 and T2 groups exhibited significant fluctuations in SPAD values, generally showing an increasing trend. In contrast, the CK, due to the 0 kV pulse voltage, showed no significant changes in SPAD values. After 4 h of pulsed electric field stimulation, the SPAD values of both the T1 and T2 groups were significantly higher than that of the CK. The T1 group only surpassed the T2 group in SPAD values after 3 h of pulsed electric field stimulation, with SPAD values lower than the T2 group for the remaining time points. After 4 h of stimulation, the SPAD values of the T1 group and T2 group increased by 6.30% and 6.70%, respectively, compared with the initial value. Overall, following pulsed electric field stimulation, the SPAD values of snake plants in the T1 and T2 groups increased significantly compared to the CK. However, the T2 group exhibited more noticeable changes in chlorophyll content, indicating the significant impact of pulsed electric field stimulation on chlorophyll content in snake plants.

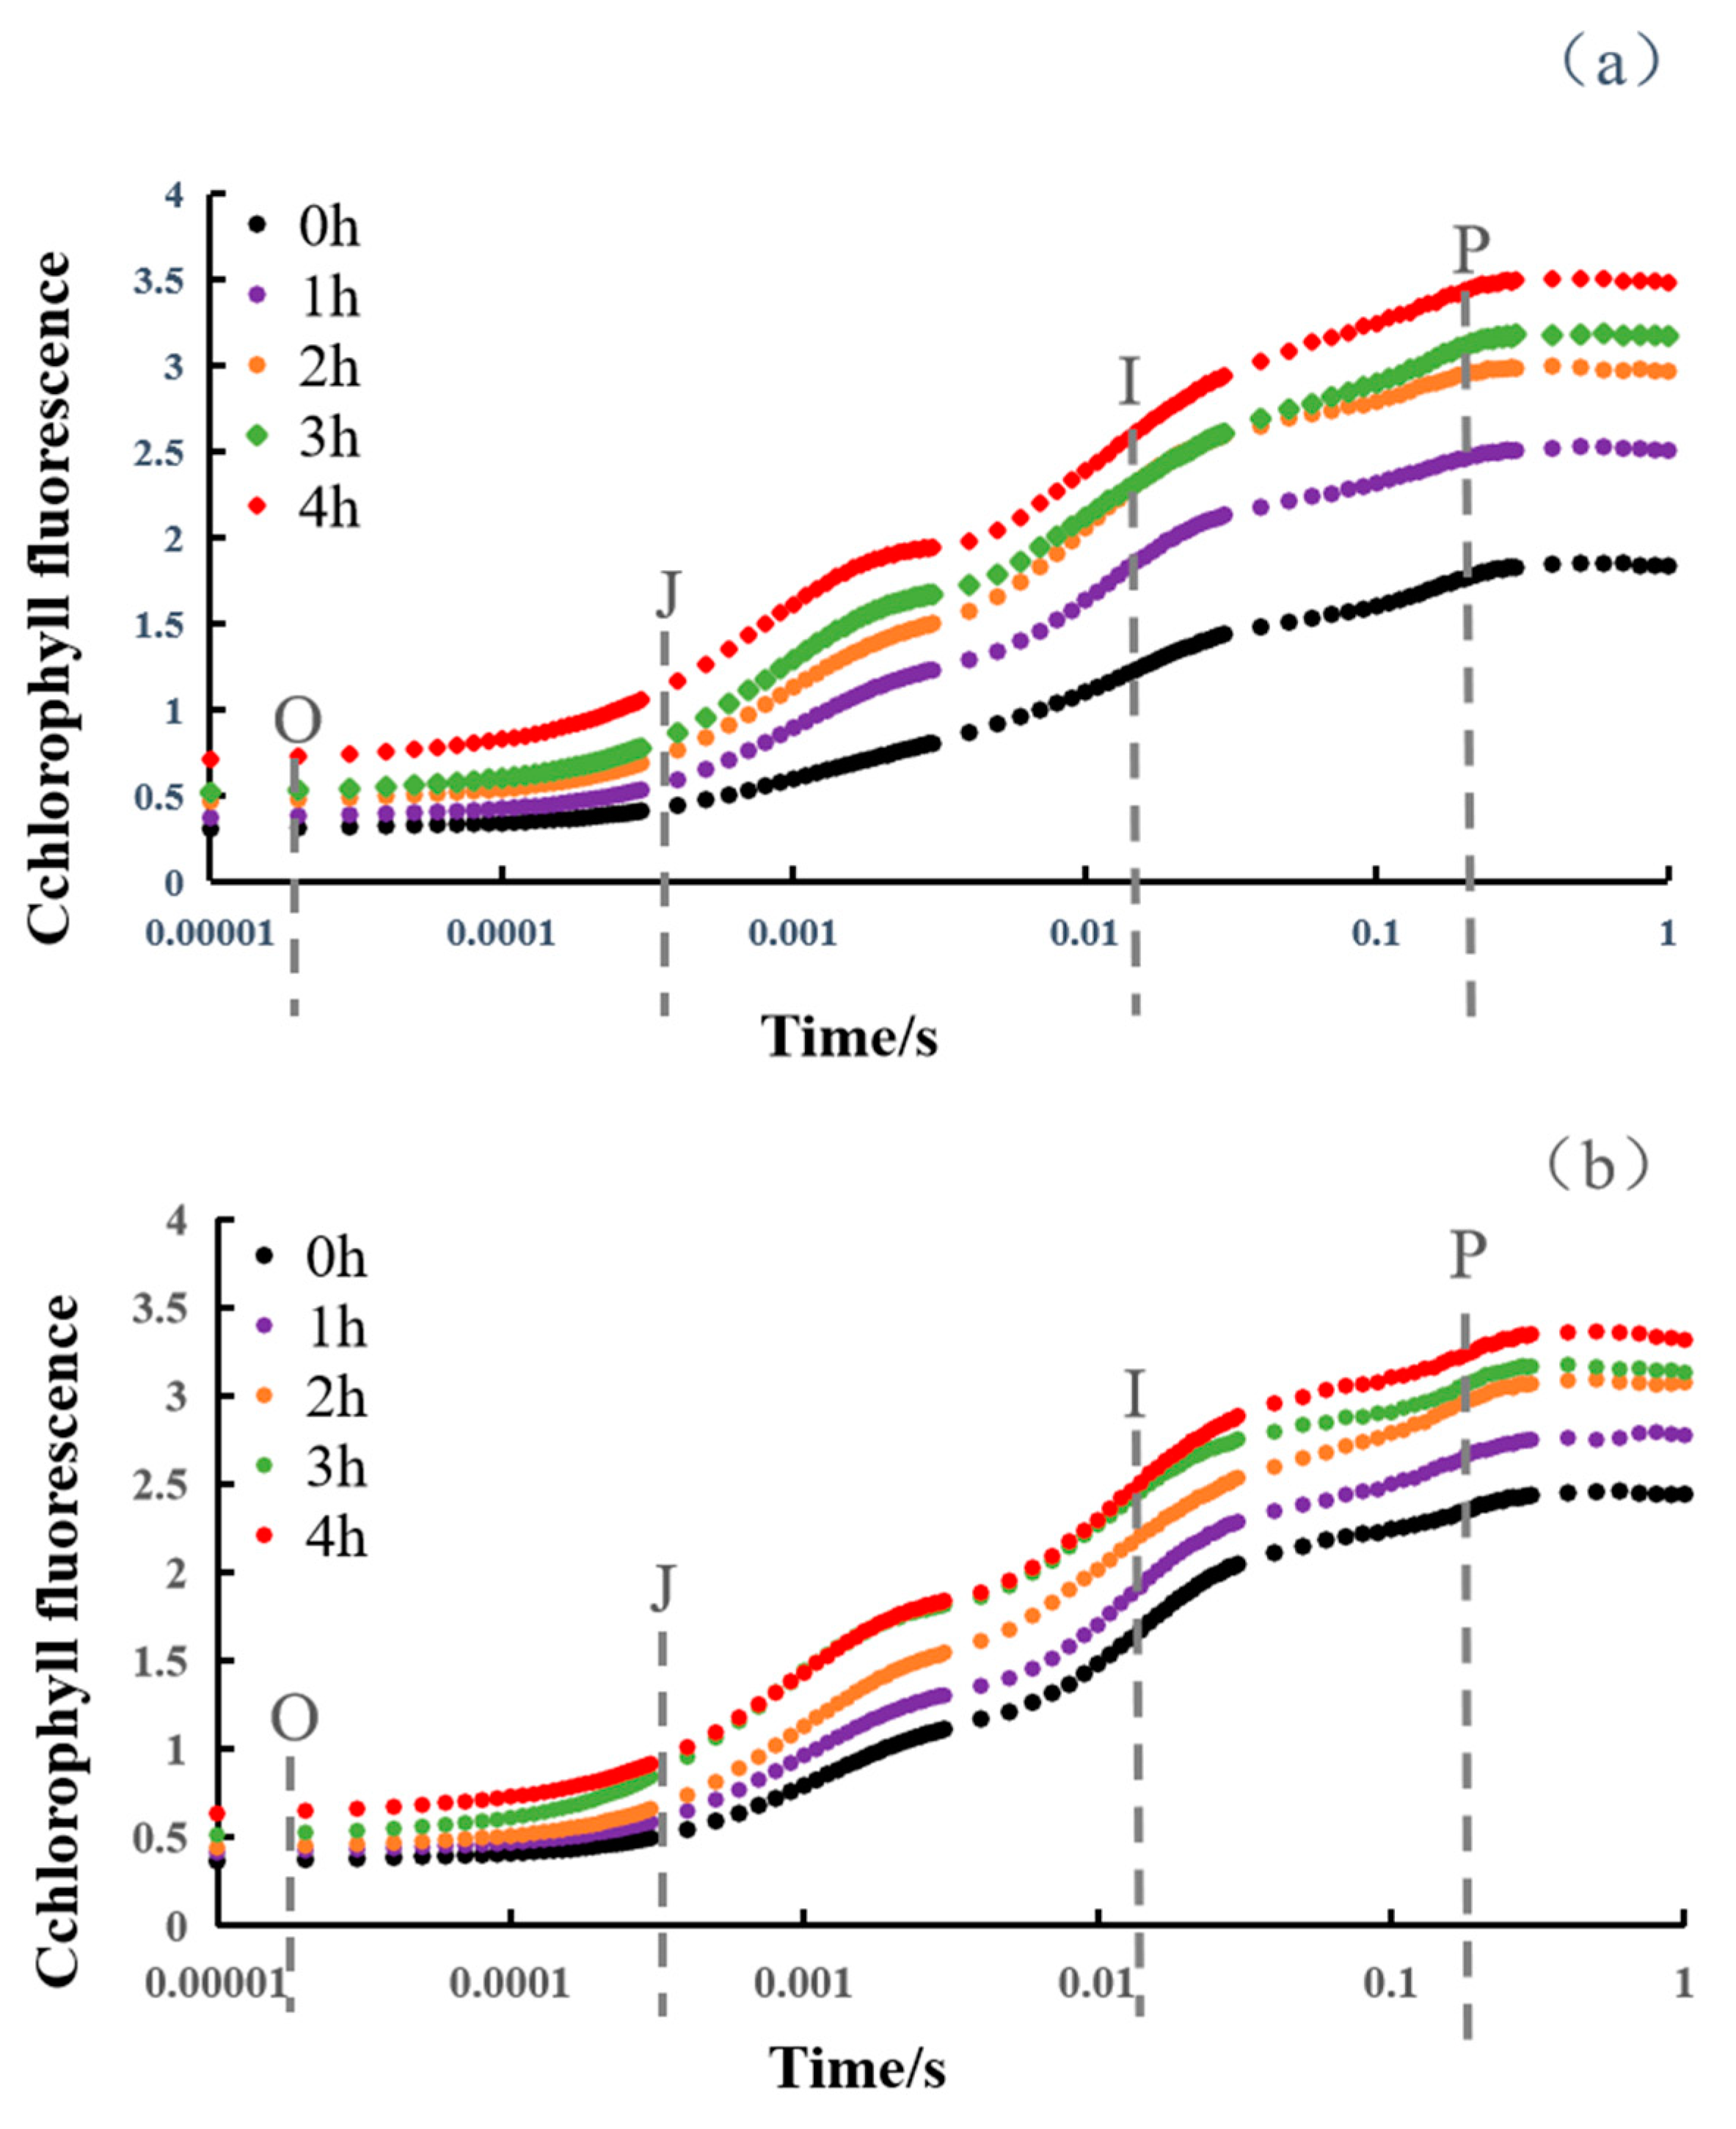
3.2. Dynamic Changes in OJIP Curve of Snake Plant Leaves

3.2.1. ChlF Rise

The dynamic changes in the chlorophyll content of snake plant leaves after pulsed electric field stimulation at 0 kV (CK), 5 kV (T1), and 7 kV (T2) are shown in Figure 1. Chlorophyll fast fluorescence is rapidly enhanced within a second in the form of OJIP, providing structural information on photosynthesis. In this experiment, the chlorophyll fluorescence curve was measured to evaluate the data of snake plants after adequate dark adaptation. The differences in the curves under different pulsed electric field stimulations are minimal at point O, reaching a maximum at point P as electrons accumulate at point J. The OJ segment corresponds to the accumulation of QA electrons in the photosynthetic electron transfer chain, which cannot receive electrons in a timely manner, leading to electron accumulation at QA and the generation of point J [26]. As shown in Figure 1, after 4 h of pulsed electric field stimulation, the deviation (I) and peak (P) values in the OJIP curves of the T1 and T2 groups are higher than the values at the origin (O) and inflection point (J). The amplitude of the curves gradually increases from 0 to 4 h as the duration of the pulse extends. The upward trend in the IP segment in the T1 and T2 groups is smoother compared to the OJ segment. The gradual increase in the JI and IP segments indicates that a certain level of pulsed electric field can promote the reduction in the PQ pool, enhancing electron transfer capacity. At the same time point, with increasing pulse voltage, the ascending trend in O value and the descending trend in p value in the T1 group are more pronounced than those of the T2 group. In both treatment groups, the changes at 2 h and 3 h are relatively small, probably due to the snake plant’s temporary adaptation to the pulse voltage intensity. However, with prolonged duration, the magnitude of the curve changes gradually increases.

3.2.2. The Relative Variable Fluorescence Changes in Snake Plant Leaves

To further observe the main bands relative to the OJIP curve from the O to P phase, a differential curve analysis was performed to further evaluate the difference in the kinetics of OJIP fluorescence rise between different time periods under the same pulsed electric field stimulation. Differential analysis was conducted on the main bands of the OJIP curve from the O to P phases to evaluate the differences in fluorescence rise dynamics under the same pulsed electric field stimulation across different time periods. The curves of the L band (between O and K; WL), K band (between O and J; WK), and J band (between O and I; WJ) exhibit bimodal characteristics between Fo and FK, FJ, and FI. After pulsed electric field stimulation, significant changes were observed in the J band compared to the L and K bands during the transition process between O and J in chlorophyll fluorescence. The relative fluorescence of the J band was associated with the reduction degree of QA. As shown in Figure 2, from 0 to 4 h, the peak values increased (ΔWJ > 0) for both the T1 and T2 groups. With the increase in pulse duration, the band amplitudes gradually increased. As time progressed, QA accumulated on the acceptor side of the PSII reaction center, causing more light to be used for QA reduction, leading to an obstruction in the electron transfer process. The magnitude of changes in the T2 group was greater than that in the T1 group, probably because the stronger pulse voltage exerted a more pronounced effect on the photosynthetic electron transfer in snake plants. In the T2 group, fluctuations were observed in the curve at 4 h. This may be due to the short-term disruptive effect on the root system of snake plants under high-voltage (7 kV) stimulation, which affected the chlorophyll fluorescence parameters. Therefore, snake plants entered a transient adaptive phase after the stimulation.

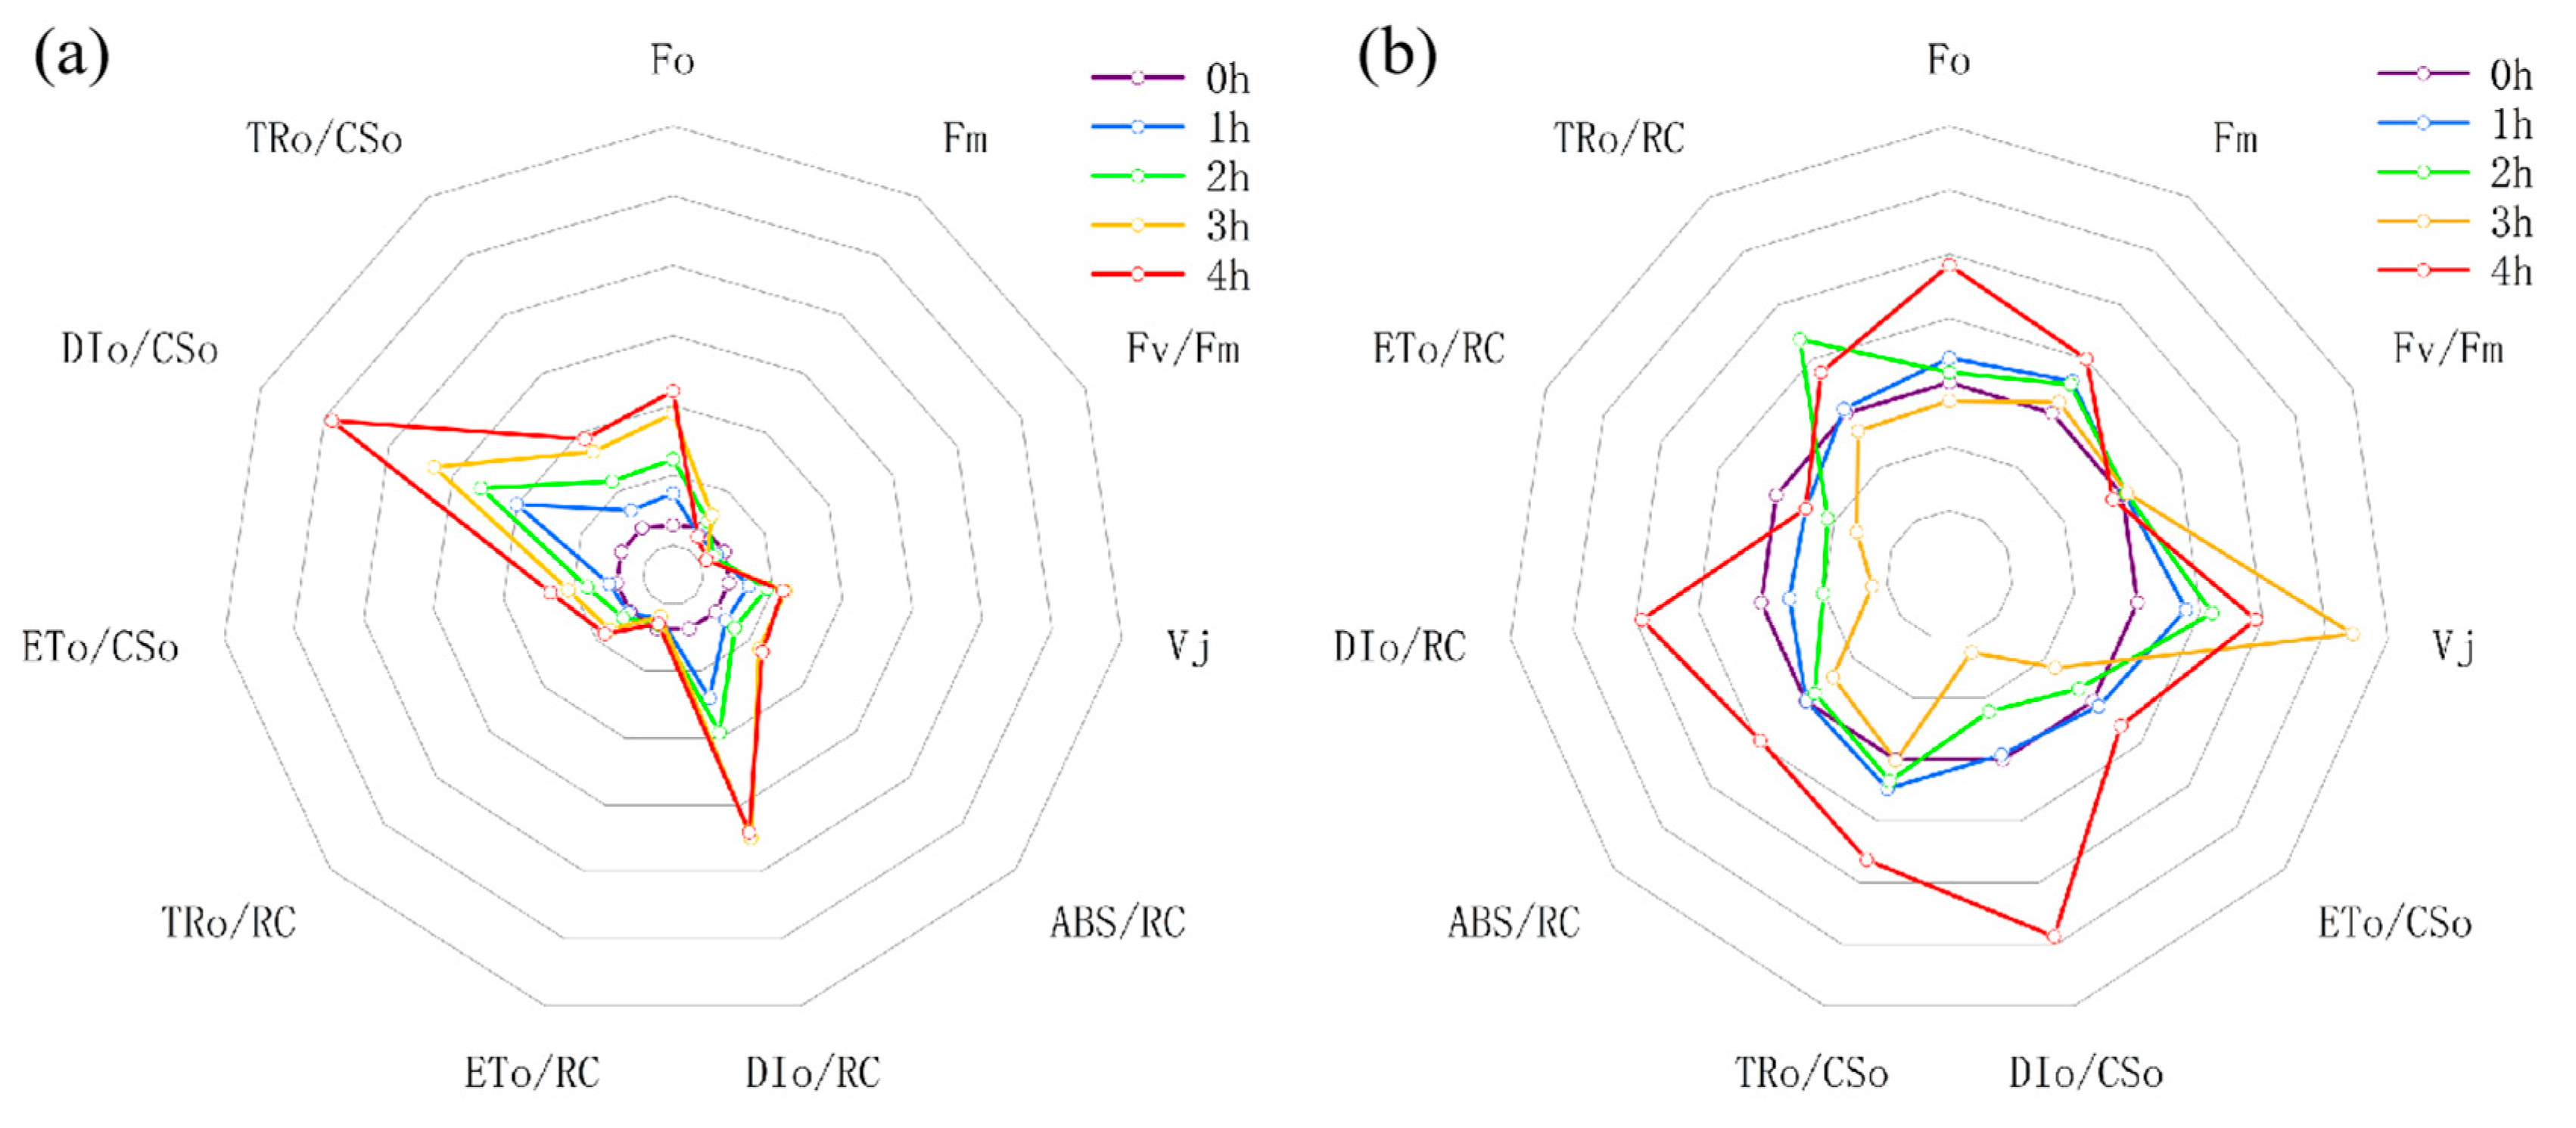
3.3. Dynamic Changes in Chlorophyll Fluorescence Parameters of Snake Plant Leaves

3.3.1. Basic Parameters

The dynamic changes in the chlorophyll content of snake plant leaves after pulsed electric field stimulation at 0 kV (CK), 5 kV (T1), and 7 kV (T2) are presented in Table 2 During the 0~4 h period, various chlorophyll fluorescence parameters exhibited fluctuating trends over time. Specifically, Fm, DIo/RC, TRo/CSo, ETo/CSo, and DIo/CSo showed an overall increasing trend, while values like Fv/Fo, Sm, ABS/RC, and PIabs showed a decreasing trend.
After continuous pulsed electric field stimulation for 4 h, the T1 group showed higher values of chlorophyll fluorescence parameters related to quantum energy (ABS/RC, DIo/RC, ETo/RC, and TRo/RC) compared to the T2 group. At 1 h and 2 h, the Fm of the T2 group was higher than that of the CK and T1 groups, with a significant difference. However, at 3 h and 4 h, there was no significant change in the Fm between the T1 and T2 groups. Overall, after 4 h of pulsed electric field stimulation, the values of Fo, TRo/CSo, TRo/RC, ETo/CSo, DIo/CSo, and Fm in the T1 and T2 groups were higher than those in the CK.
From Table 2, it can be observed that with increasing pulse duration, there was a decreasing trend in the PIabs for both the T1 and T2 groups, with a reduction of 18.60% in the T1 group and 14.1% in the T2 group. After 4 h of stimulation, the PItotal in the CK was higher than that in the T1 and T2 groups, indicating that pulsed electric field stimulation may have a negative impact on snake plants that have been acclimated to greenhouse conditions and have received no other treatments.

3.3.2. Specific Energy Fluxes

To further investigate the effect of pulsed electric field stimulation on the photosynthetic electron transport chain of snake plants, eleven JIP test parameters were selected to reflect the changes in the electron transport chain activity. These parameters included ETo/CSo, ETo/RC related to the activity of the PSII reaction centers on the acceptor side, TRo/RC, TRo/CSo related to the PSII reaction center, and comprehensive characterization parameters such as Fv/Fm that reflect the photosynthetic performance of PSII. Figure 3a,b illustrate the dynamic changes in the chlorophyll fluorescence parameters of snake plant leaves under pulsed electric field stimulation in the T1 and T2 groups at different time intervals. The baseline, denoted as 0 h without pulsed electric field stimulation, reflects the chlorophyll fluorescence parameters of snake plants under natural conditions. Obviously, pulsed electric field stimulation had a significant impact on JIP test parameters, primarily including the specific energy of various PSII reaction centers (DIo/RC, TRo/RC, ETo/RC, and ABS/RC), the variable fluorescence intensity at the J point (Vj), dissipated energy per unit area (DIo/CSo), energy capture per unit area (TRo/CSo), and energy of electron transfer per unit area (ETo/CSo).
In the T1 group, with increasing time of continuous pulsed electric field stimulation, DIo/RC, ETo/RC, and ABS/RC increased, while TRo/RC did not show significant changes. Conversely, in the T2 group, from 0 h to 3 h, DIo/RC, ETo/RC, and ABS/RC decreased, while TRo/RC increased. This indicates an exacerbation in the deactivation level of the PSII reaction center, with a downward trend in the energy used for electron capture and transfer (TRo/CSo and ETo/RC). Additionally, according to Figure 3, the electron transfer efficiency (φEo) also declined. For snake plants growing under natural conditions, pulsed electric field stimulation can be considered a kind of stress treatment. High-voltage pulses may affect the capture of light energy in the photosynthetic system, reduce the absorption of light energy by the photosynthetic reaction centers, and potentially damage the plant’s photosynthetic organs, leading to a decrease in effective photosynthetic rate.

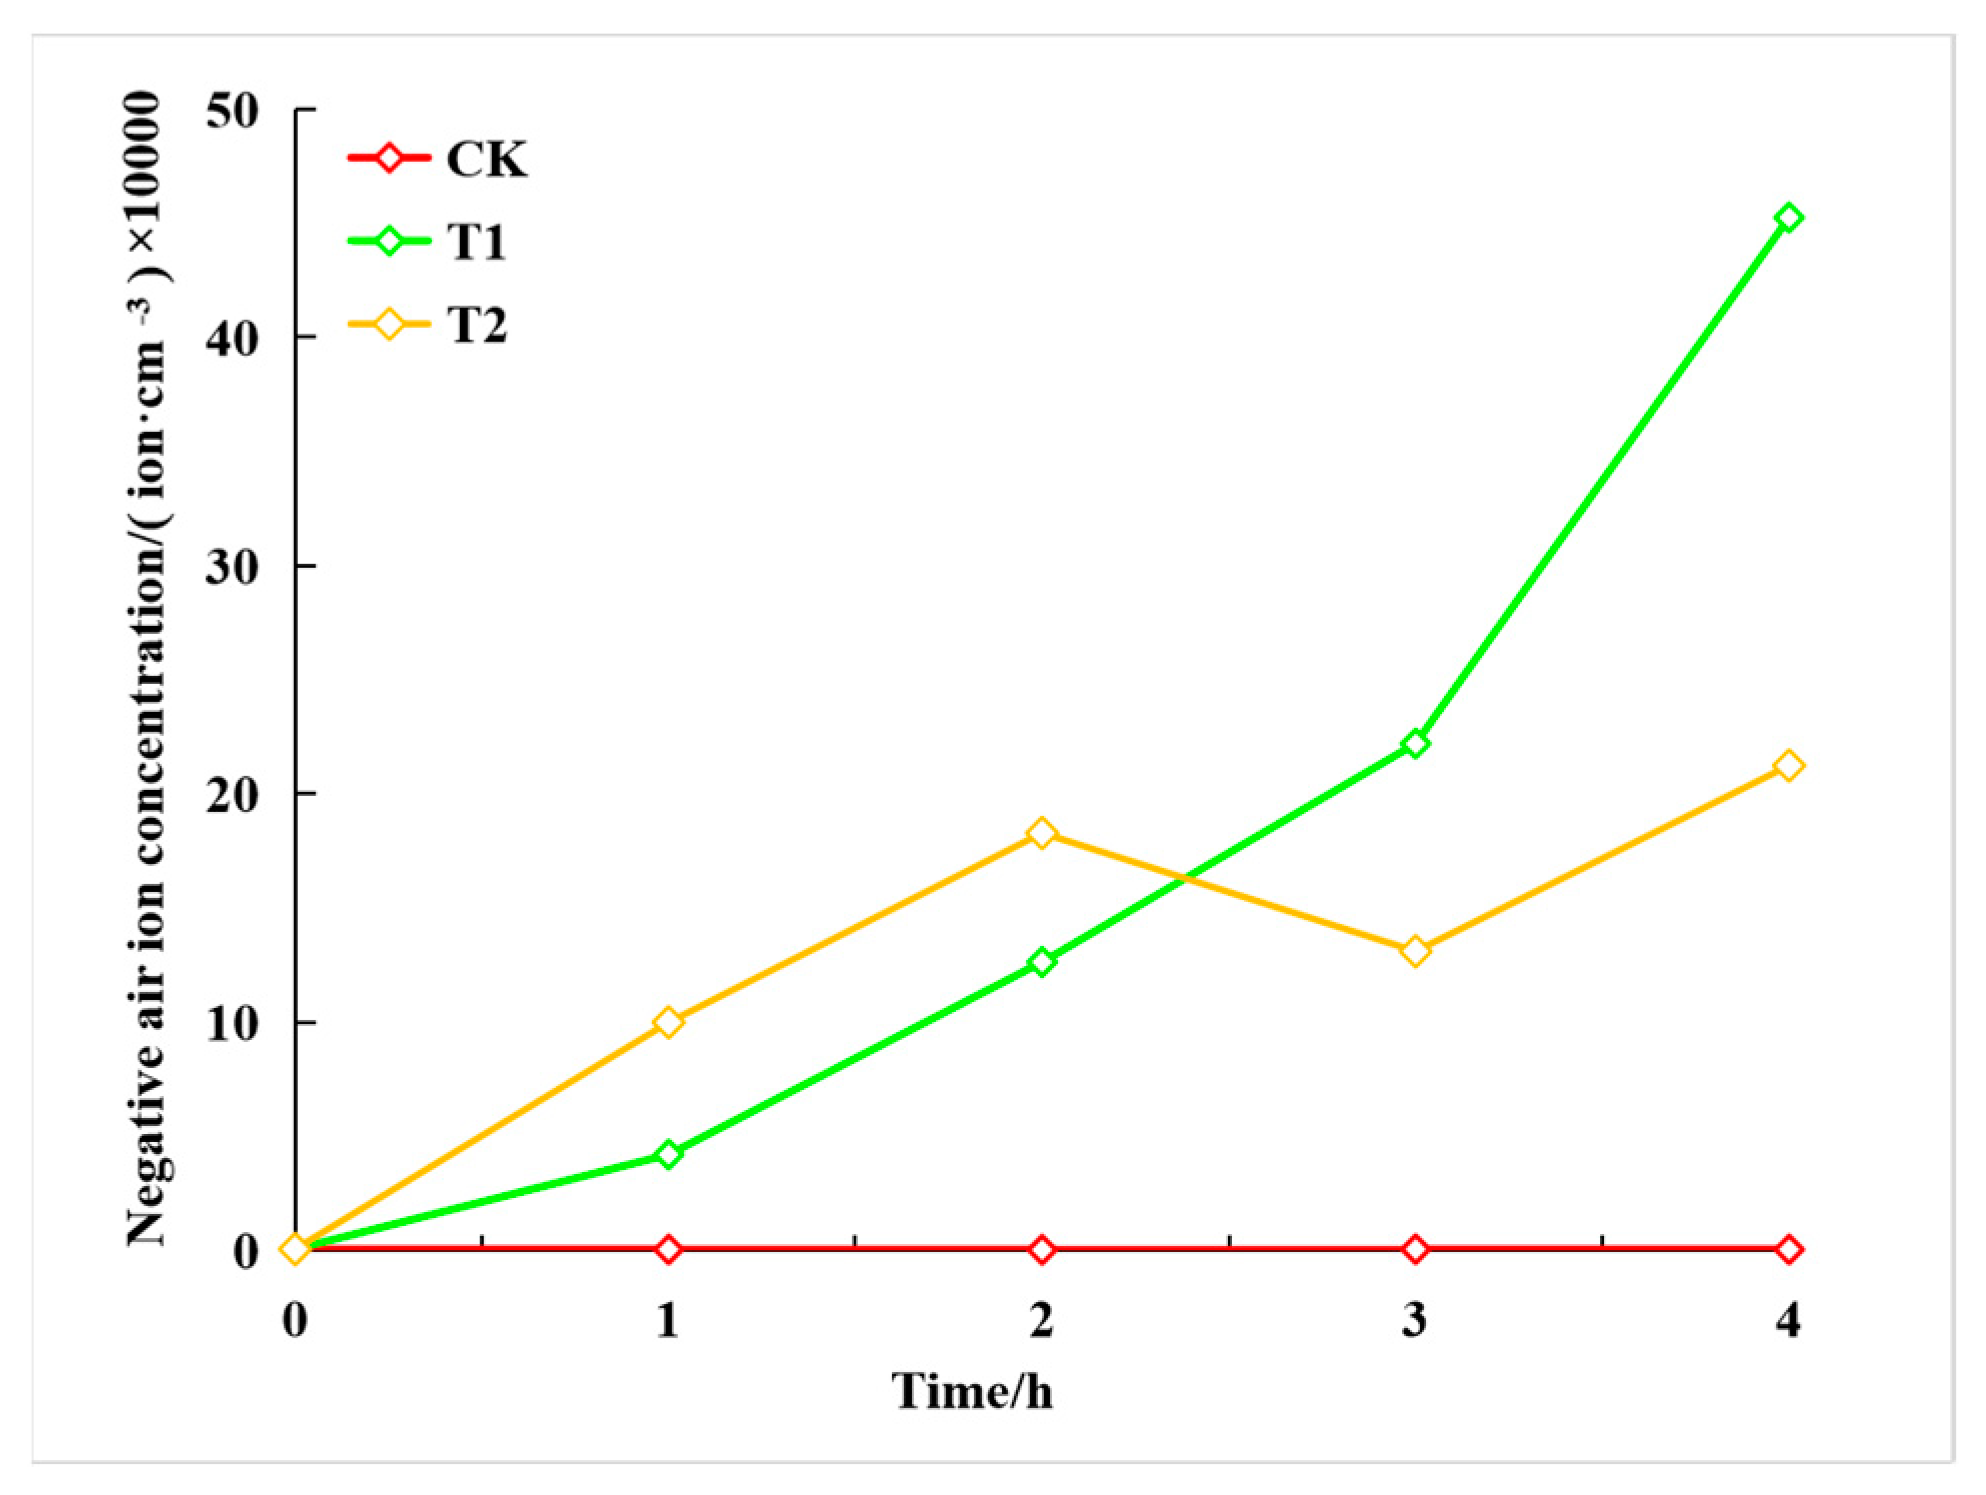
3.4. Dynamic Changes in NAI Concentration Released by Snake Plants

The dynamic changes in the concentration of NAIs released by snake plants after pulsed electric field stimulation at 0 kV (CK), 5 kV (T1), and 7 kV (T2) are depicted in Figure 4 and Table 3. As shown in Table 3, after pulsed electric field stimulation for 1 h, 2 h, 3 h, and 4 h, the NAI concentrations in the T1 and T2 groups were higher compared with the CK, with no significant changes observed in the CK. At 3 h and 4 h after pulsed electric field stimulation, the NAI concentration in the T1 group was higher than that in the T2 group. Specifically, in the T1 group, the NAI concentration increased by 87.60% after 4 h of pulse electric field stimulation compared to 3 h, and by 75.89% after 3 h compared to 2 h. In the T2 group, the NAI concentration increased by 62.09% at 4 h compared to 3 h, although there was a slight decrease in concentration at 3 h compared to the previous time point. Overall, the NAI concentration in the CK did not show significant changes, with the growth rate in the T1 group showing a more pronounced trend compared to the T2 group (Figure 4).

4. Discussion

Extensive research findings suggest that under natural conditions, plants release low concentrations of NAIs, but pulse electric field stimulation can significantly enhance the plant’s ability to release NAIs. This experimental study demonstrates that under pulsed electric field stimulation, the snake plants in the T1 and T2 groups released higher concentrations of NAIs compared to the CK. Plants’ ion release capacity is closely related to the characteristics of leaf stomata, with greater opening and density of stomata under the action of pulsed electric fields resulting in increased release capabilities. The concentration of chlorophyll in plants is directly proportional to their ability to release NAIs. Therefore, a higher chlorophyll content corresponds to increased NAI release capacity. In this study, at the time points of 3 h and 4 h after the beginning of the pulsed electric field stimulation, the T2 group exhibited lower NAI concentrations compared to the T1 group. This indicates that increased voltage intensity from pulsed electric fields may cause varying degrees of damage to cell organelles like chloroplasts, leading to a decrease in NAI release capacity.
According to the OJIP curve analysis, under continuous pulsed electric field stimulation, the O and J values in the T1 and T2 groups were higher than in the CK. Under the condition of identical material samples being subjected to pulsed electric field stimulation for the same duration, a comparison is made between plants that had not undergone pulsed electric field stimulation (0 h) and plants that have been stimulated for 4 h. The results show that the increase in the OJIP curve is greater in the T1 group than in the T2 group, indicating that pulse electric field stimulation promotes changes in chlorophyll fluorescence parameters in snake plants. As shown in Figure 2, the J band (ΔWJ) amplitude of the T2 group was higher than of the T1 group. The Vj value reflects the number of closed PSII reaction centers at point J, i.e., the accumulation of QA [27,28]. This suggests that increasing the voltage and duration of the pulse electric field stimulation can lead to a significant accumulation of QA in the photosynthetic electron transport chain of snake plants, resulting in decreased PSII reaction center activity and lower electron transfer capacity. The increase in Vj in Figure 3b also indicates that the T2 group had a negative impact on the chlorophyll fluorescence parameters of snake plants, possibly due to damage to the chloroplasts caused by high-voltage pulses.
Chlorophyll fluorescence parameters are effective for evaluating the impact of environmental stress on plants’ photosynthetic characteristics and serve as important indicators for studying plant responses to stress [29,30]. PIabs is a performance index of PSII based on absorbed light energy [31,32,33] and it is sensitive to most stress effects and reflects the state of the photosynthetic system, so damage to the photosynthetic organs can possibly lead to a decrease in PIabs [34,35,36,37]. The PItotal is a comprehensive performance index calculated from PIabs and Vj [38,39,40]. Both the T1 and T2 groups showed a decreasing trend in PIabs values as the pulse duration increased, with the PItotal value in the CK being higher than those in the T1 and T2 groups at the 4 h time point of pulse stimulation. Under pulse electric field stimulation, the TRo/RC in the T1 group did not show significant changes. In the T2 group, the DIo/RC, ETo/RC, and ABS/RC decreased, whereas TRo/RC increased. TRo/RC represents the energy captured by the unit reaction center, and an increase in TRo/RC indicates damage to the oxygen-evolving complex (OEC) within PSII reaction centers, reflecting the intensified deactivation of the PSII reaction center [41,42].

5. Conclusions

In conclusion, the chloroplast is a crucial organelle for the release of NAIs in plants. Pulse electric field treatment can promote snake plants to release more NAIs compared to the CK, as well as increase chlorophyll content and affect fluorescence parameters. Changes in φEo, PItotal, and Vj, along with fluctuations in NAI concentrations and chlorophyll content, indicate that although pulse electric field stimulation may promote the reduction in the PQ pool and enhance electron transfer capabilities, it can still lead to the accumulation of QA on the acceptor side of PSII reaction centers. Consequently, light is more frequently used to reduce QA, hindering electron transport and thus affecting the photosynthetic electron transport chain in snake plants.

Author Contributions

R.W. and J.L. designed the experiments; J.L., D.H. and Z.C. performed the experiments; J.L. and D.H. wrote the paper. All authors have read and agreed to the published version of the manuscript.

Funding

This research was funded by the Natural Science Foundation of Fujian Province, grant Number 2021J01077; the Fujian Agriculture and Forestry University Science and Technology Development Fund, grant Number CXZX2019030G; and the Fujian Agriculture and Forestry University Science and Technology Development Fund, grant Number CXZX2019031.

Data Availability Statement

Data for this paper can be obtained by contacting the corresponding author of this paper.

Acknowledgments

We thank the anonymous reviewers for their constructive comments and suggestions on revising the manuscript.

Conflicts of Interest

The authors declare no conflicts of interest.

References

  1. Kasmawati, H.; Ruslin, R.; Arfan, A.; Sida, N.A.; Saputra, D.I.; Halimah, E.; Mustarichie, R. Antibacterial potency of an active compound from Sansevieria trifasciata Prain: An integrated in vitro and in silico study. Molecules 2023, 28, 6096. [Google Scholar] [CrossRef]
  2. Wantahe, E.; Bigambo, P. Review of Sansevieria Ehrenbergii (SE) leaf fibers and their potential applications. Cellulose 2023, 30, 9241–9259. [Google Scholar] [CrossRef]
  3. Permana, B.H.; Krobthong, S.; Yingchutrakul, Y.; Thiravetyan, P.; Treesubsuntorn, C. Sansevieria trifasciata’s specific metabolite improves tolerance and efficiency for particulate matter and volatile organic compound removal. Environ. Pollut. 2024, 355, 124199. [Google Scholar] [CrossRef] [PubMed]
  4. Gunasinghe, Y.H.K.I.; Rathnayake, I.V.N.; Deeyamulla, M.P. The entophytic and potting soil bacteria of the Sansevieria trifasciata plant have a purifying impact on indoor toluene. Int. J. Environ. Res. 2023, 17, 48. [Google Scholar] [CrossRef]
  5. Tikhonov, V.P.; Tsvetkov, V.D.; Litvinova, E.G.; Sirota, T.V.; Kondrashova, M.N. Generation of negative air ions by plants upon pulsed electrical stimulation applied to soil. Russ. J. Plant Physiol. 2004, 51, 414–419. [Google Scholar] [CrossRef]
  6. Buckley, R.; Zhong, L.; Yu, H.; Zhu, D.; Cooper, M. Health benefits of airborne terpenoids and aeroanions: Insights from thematic review of Chinese-Language research on forest sensory experiences. Environments 2024, 11, 79. [Google Scholar] [CrossRef]
  7. Shi, G.; Zhang, J.; Sang, Y.; Du, L.; Ni, X.; Hu, Y. Empirical analysis of the influence of vegetation photosynthetic productivity on negative air ions in forest ecosystems driven by solar radiation. Ecol. Indic. 2024, 166, 112377. [Google Scholar] [CrossRef]
  8. Liu, S.; Huang, Q.; Wu, Y.; Song, Y.; Dong, W.; Chu, M.; Yang, D.; Zhang, X.; Zhang, J.; Chen, C.; et al. Metabolic linkages between indoor negative air ions, particulate matter and cardiorespiratory function: A randomized, double-blind crossover study among children. Environ. Int. 2020, 138, 105663. [Google Scholar] [CrossRef]
  9. Akdemir Evrendilek, G.; Atmaca, B.; Bulut, N.; Uzuner, S. Development of pulsed electric fields treatment unit to treat wheat grains: Improvement of seed vigour and stress tolerance. Comput. Electron. Agric. 2021, 185, 106129. [Google Scholar] [CrossRef]
  10. Zhang, Z.; Chen, Y.; Cheng, Y.; Gao, Z.; Qu, K.; Chen, Z.; Yue, L.; Guan, W. Effects of pulsed electric field and high-pressure processing treatments on the juice yield and quality of sea buckthorn. Foods 2024, 13, 1829. [Google Scholar] [CrossRef]
  11. Wang, D.; Hayashi, Y.; Enoki, T.; Nakahara, K.; Arita, T.; Higashi, Y.; Kuno, Y.; Terazawa, T.; Namihira, T. Influence of pulsed electric fields on photosynthesis in Light/Dark-Acclimated Lettuce. Agronomy 2022, 12, 173. [Google Scholar] [CrossRef]
  12. Akdemir Evrendilek, G.; Atmaca, B.; Uzuner, S. Corn processing by pulsed electric fields with respect to microbial inactivation and improvement of seed vigour. Comput. Electron. Agric. 2024, 219, 108830. [Google Scholar] [CrossRef]
  13. Kalaji, H.M.; Jajoo, A.; Oukarroum, A.; Brestic, M.; Zivcak, M.; Samborska, I.A.; Center, M.D.; Łukasik, I.; Goltsev, V.; Ladle, R.J. Chlorophyll a fluorescence as a tool to monitor physiological status of plants under abiotic stress conditions. Acta Physiol. Plant. 2016, 38, 102. [Google Scholar] [CrossRef]
  14. Markulj Kulundžić, A.; Sudarić, A.; Matoša Kočar, M.; Duvnjak, T.; Liović, I.; Mijić, A.; Varga, I.; Viljevac Vuletić, M. Detailed insight into the behaviour of Chlorophyll a fluorescence transient curves and parameters during different times of dark adaptation in sunflower leaves. Agronomy 2024, 14, 954. [Google Scholar] [CrossRef]
  15. Itam, M.; Hall, D.; Kramer, D.; Merewitz, E. Early detection of Kentucky bluegrass and perennial ryegrass responses to drought stress by measuring chlorophyll fluorescence parameters. Crop Sci. 2024, 64, 1015–1026. [Google Scholar] [CrossRef]
  16. Zhuang, J.; Wang, Q. Hyperspectral indices developed from fractional-order derivative spectra improved estimation of leaf chlorophyll fluorescence parameters. Plants 2024, 13, 1923. [Google Scholar] [CrossRef]
  17. Nie, R.; Wei, X.; Jin, N.; Su, S.; Chen, X. Response of photosynthetic pigments, gas exchange and chlorophyll fluorescence parameters to light quality in Phoebe bournei seedlings. Plant Growth Regul. 2024, 103, 675–687. [Google Scholar] [CrossRef]
  18. Xi, G.; He, R.; Liu, K.; Zhao, Y. Effect of pulsed electric field on spontaneous photon emission of corn seedlings under osmotic stress. Trans. Chin. Soc. Agric. Eng. 2015, 31, 319–324. [Google Scholar]
  19. Fratianni, A.; Niro, S.; Messia, M.C.; Panfili, G.; Marra, F.; Cinquanta, L. Evaluation of carotenoids and furosine content in air dried carrots and parsnips pre-treated with pulsed electric field (PEF). Eur. Food Res. Technol. 2019, 245, 2529–2537. [Google Scholar] [CrossRef]
  20. Wang, Y.; Deng, C.; Zheng, J.; Xin, G.; Wu, R. Study on the indoor application of the plants-NAI generator. J. Guangzhou Univ. Nat. Sci. Ed. 2014, 13, 29–37. [Google Scholar]
  21. Wu, R.; Zheng, J.; Sun, Y.; Wang, Q.; Deng, C.; Ye, D. Research on generation of negative air ions by plants and stomatal characteristics under pulsed electrical field stimulation. Int. J. Agric. Biol. 2017, 19, 1235–1245. [Google Scholar] [CrossRef]
  22. Wang, H. Changes of Anion Concentration and Ultrastructure of Mesophyll Cells Stimulated by Pulsed Electric Field. Master’s Thesis, Fujian Agriculture and Forestry University, Fuzhou, China, 2013. [Google Scholar]
  23. Tikhonov, V.P.; Tsvetkov, V.D.; Litvinova, E.G.; Sirota, T.V.; Kondrashova, M.N. Generation of negative air ions by wheat seedlings in a high voltage electrization of soil. Biofizika 2002, 47, 130–134. [Google Scholar] [PubMed]
  24. Wang, J.; Li, S. Changes in negative air ions concentration under different light intensities and development of a model to relate light intensity to directional change. J. Environ. Manag. 2009, 90, 2746–2754. [Google Scholar] [CrossRef] [PubMed]
  25. Wu, R. The Efficient Release of Anions and Their Generator in Functional Plants. Ph.D. Thesis, Fujian Agriculture and Forestry University, Fuzhou, China, 2011. [Google Scholar]
  26. Strasserf, R.J.; Srivastava, A. Polyphasic Chlorophyll a fluorescence transient in plants and cyanobacteria. Photochem. Photobiol. 1994, 61, 32–42. [Google Scholar] [CrossRef]
  27. Kalaji, H.M.; Schansker, G.; Ladle, R.J.; Goltsev, V.; Bosa, K.; Allakhverdiey, S.I.; Brestic, M.; Bussotti, F.; Calatayud, A.; Dabrowski, P.; et al. Frequently asked questions about in vivo chlorophyll fluorescence: Practical issues. Photosynth. Res. 2014, 122, 121–158. [Google Scholar] [CrossRef]
  28. Srinivasarao, C.; Shanker, A.K.; Kundu, S.; Reddy, S. Chlorophyll fluorescence induction kinetics and yield responses in rainfed crops with variable potassium nutrition in K deficient semi-arid alfisols. J. Photochem. Photobiol. B Biol. 2016, 160, 86–95. [Google Scholar] [CrossRef]
  29. Speranza, A.; Crosti, P.; Malerba, M.; Stocchi, O.; Scoccianti, V. The environmental endocrine disruptor, bisphenol A, affects germination, elicits stress response and alters steroid hormone production in kiwifruit pollen. Plant Biol. 2011, 13, 209–217. [Google Scholar] [CrossRef]
  30. Li, C.; Yang, Z.; Zhang, C.; Luo, J.; Jiang, N.; Zhang, F.; Zhu, W. Heat stress recovery of chlorophyll fluorescence in tomato (Lycopersicon esculentum Mill.) leaves through nitrogen levels. Agronomy 2023, 13, 2858. [Google Scholar] [CrossRef]
  31. Zushi, K.; Matsuzoe, N. Using of chlorophyll a fluorescence OJIP transients for sensing salt stress in the leaves and fruits of tomato. Sci. Hortic. 2017, 219, 216–221. [Google Scholar] [CrossRef]
  32. Dai, Y.; Yuan, L.; Zhang, S.; Wang, J.; Xie, S.; Zhao, M.; Chen, G.; Sun, R.; Wang, C. Comprehensive evaluation for cold tolerance in Wucai (Brassica campestris L.) by the performance index on an absorption basis (PIabs). Agronomy 2019, 9, 61. [Google Scholar] [CrossRef]
  33. Rodriguez, A.A.; Vilas, J.M.; Sartore, G.D.; Bezus, R.; Colazo, J.; Maiale, S.J. Field and genetic evidence support the photosynthetic performance index (PIABS) as an indicator of rice grain yield. Plant Physiol. Biochem. 2023, 201, 107897. [Google Scholar] [CrossRef] [PubMed]
  34. Appenroth, K.J.; Stockel, J.; Srivastava, A. Multiple effects of chromate on the photosynthetic apparatus of Spirodela polyrhiza as probed by OJIP chlorophyll a fluorescence measurements. Environ. Pollut. 2001, 115, 49–64. [Google Scholar] [CrossRef] [PubMed]
  35. Sousa, D.D.C.V.; Bessa, L.A.; Silva, F.G.; Rosa, M.; Vasconcelos Filho, S.D.C.; Vitorinol, L.C. Morpho-Anatomical and physiological responses can predict the ideal period for the transplantation of hydroponic seedlings of Hymenaea courbaril, a neotropical fruit tree. Plants 2020, 9, 721. [Google Scholar] [CrossRef] [PubMed]
  36. Athar, H.U.; Ambreen, S.; Javed, M.; Hina, M.; Rasul, S.; Zafar, Z.U.; Manzoor, H.; Ogbaga, C.C.; Afzal, M.; Al-Qurainy, F.; et al. Influence of sub-lethal crude oil concentration on growth, water relations and photosynthetic capacity of maize (Zea mays L.) plants. Environ. Sci. Pollut. Res. Int. 2016, 23, 18320–18331. [Google Scholar] [CrossRef] [PubMed]
  37. Chiango, H.; Figueiredo, A.; Sousa, L.; Sinclair, T.; Da Silva, J.M. Assessing drought tolerance of traditional maize genotypes of Mozambique using chlorophyll fluorescence parameters. S. Afr. J. Bot. 2021, 138, 311–317. [Google Scholar] [CrossRef]
  38. Snider, J.L.; Thangthong, N.; Pilon, C.; Virk, G.; Tishchenko, V. OJIP-fluorescence parameters as rapid indicators of cotton (Gossypium hirsutum L.) seedling vigor under contrasting growth temperature regimes. Plant Physiol. Biochem. 2018, 132, 249–257. [Google Scholar] [CrossRef]
  39. Weng, H.; Liu, Y.; Captoline, I.; Li, X.; Ye, D.; Wu, R. Citrus Huanglongbing detection based on polyphasic chlorophyll a fluorescence coupled with machine learning and model transfer in two citrus cultivars. Comput. Electron. Agric. 2021, 187, 106289. [Google Scholar] [CrossRef]
  40. Liu, Y.; Gong, C.; Pei, W.; Fan, K.; Shen, W. Chlorophyll a fluorescence as a tool to monitor physiological status in the leaves of Artemisia ordosica under root cutting conditions. Front. Plant Sci. 2023, 14, 1308209. [Google Scholar] [CrossRef]
  41. Weng, H.; Wu, M.; Li, X.; Wu, L.; Li, J.; Atoba, T.O.; Zhao, J.; Wu, R.; Ye, D. High-throughput phenotyping salt tolerance in JUNCAOs by combining prompt chlorophyll a fluorescence with hyperspectral spectroscopy. Plant Sci. 2023, 330, 111660. [Google Scholar] [CrossRef]
  42. Oukarroum, A.; El Madidi, S.; Strasser, R.J. Differential heat sensitivity index in barley cultivars (Hordeum vulgare L.) monitored by chlorophyll a fluorescence OKJIP. Plant Physiol. Biochem. 2016, 105, 102–108. [Google Scholar] [CrossRef]
Figure 1. Fast chlorophyll fluorescence dynamics curve (OJIP) of snake plant leaves after pulsed electric field stimulation. (a) 5 kV (T1 group); (b) 7 kV (T2 group).
Agronomy 14 02248 g001
Figure 2. Differential analysis of ∆WJ (J band) at different time periods in snake plant leaves under pulsed electric field stimulation. (a) 5 kV (T1 group); (b) 7 kV (T2 group).
Agronomy 14 02248 g002
Figure 3. Dynamic changes in chlorophyll fluorescence parameters of snake plant leaves under pulsed electric field stimulation. (a) 5 kV (T1 group); (b) 7 kV (T2 group).
Agronomy 14 02248 g003
Figure 4. Dynamic changes in NAI concentration released by snake plants after pulsed electric field stimulation.
Agronomy 14 02248 g004
Table 1. Changes in chlorophyll content in snake plant leaves after pulsed electric field stimulation ( X ¯ ± SD) 1.
Treatment GroupSPAD Value of Leaf at Different Times
0 h1 h2 h3 h4 h
0 kv (CK)71.92 ± 0.79 a71.12 ± 1.69 b70.05 ± 1.58 b70.39 ± 1.16 b72.94 ± 0.81 b
5 kv (T1)72.54 ± 0.86 a75.72 ± 0.74 a74.46 ± 2.65 a76.50 ± 0.85 a77.11 ± 0.69 a
7 kv (T2)72.44 ± 0.98 a75.73 ± 0.63 a75.22 ± 2.30 a75.51 ± 0.71 a77.28 ± 1.81 a
Note: 1 lowercase letters within the same column indicate significant differences between different treatment groups at the same time point.
Table 2. Dynamic changes in chlorophyll fluorescence parameters of snake plants after pulsed electric field stimulation ( X ¯ ± SD) 1.
Treatment GroupChange in Chlorophyll Fluorescence Parameter Values of Ga at Different Times 2
0 h1 h2 h3 h4 h
0 kv (CK) Fv/Fo5.25 ± 0.14 b5.17 ± 0.68 a5.41 ± 0.23 a5.22 ± 0.27 a5.39 ± 0.15 ab
5 kv (T1) Fv/Fo5.53 ± 0.09 a5.36 ± 0.26 a5.26 ± 0.27 a5.14 ± 0.28 a5.10 ± 0.23 b
7 kv (T2) Fv/Fo5.42 ± 0.30 ab5.42 ± 0.29 a5.40 ± 0.24 a5.41 ± 0.19 a5.30 ± 0.24 a
0 kv (CK) Sm27.38 ± 5.78 a27.44 ± 4.37 a28.78 ± 4.82 a28.56 ± 5.26 a28.46 ± 4.91 a
5 kv (T1) Sm29.07 ± 5.24 a29.73 ± 4.78 a29.73 ± 0.01 a28.32 ± 4.29 a27.72 ± 4.17 a
7 kv (T2) Sm27.47 ± 3.09 a28.00 ± 3.25 a27.12 ± 3.49 a27.96 ± 4.90 a26.77 ± 3.73 a
0 kv (CK) φEo0.52 ± 0.02 a0.53 ± 0.01 a0.52 ± 0.02 a0.50 ± 0.02 b0.51 ± 0.02 a
5 kv (T1) φEo0.52 ± 0.01 a0.51 ± 0.01 a0.51 ± 0.01 a0.52 ± 0.00 a0.50 ± 0.01 a
7 kv (T2) φEo0.53 ± 0.02 a0.52 ± 0.02 a0.52 ± 0.02 a0.52 ± 0.02 a0.51 ± 0.02 a
0 kv (CK) PIabs9.05 ± 1.51 a8.89 ± 2.15 a9.24 ± 1.65 a9.16 ± 1.65 a9.47 ± 1.50 a
5 kv (T1) PIabs9.77 ± 0.30 a9.22 ± 0.64 a8.81 ± 0.41 a8.42 ± 0.28 a8.24 ± 0.53 a
7 kv (T2) PIabs10.75 ± 1.4 a10.25 ± 11 a10.09 ± 1.27 a9.83 ± 1.98 a9.42 ± 1.51 a
0 kv (CK) PItotal3.20 ± 0.70 a2.94 ± 0.97 b3.12 ± 0.71 a2.95 ± 0.68 b3.22 ± 0.57 a
5 kv (T1) PItotal3.25 ± 1.31 a3.23 ± 0.65 a3.13 ± 0.58 a3.00 ± 0.58 a2.87 ± 1.81 a
7 kv (T2) PItotal3.29 ± 0.81 a3.19 ± 0.72 b3.15 ± 0.87 a3.10 ± 0.94 a2.92 ± 0.83 a
Note: 1 lowercase letters in the same column indicate significant differences between different treatment groups at the same time; 2 pulsed electric field stimulation time.
Table 3. Dynamic changes in the concentration of NAIs released by snake plants after pulsed electric field stimulation ( X ¯ ± SD) 1.
Treatment GroupNegative Ion Concentration Changes/(ion·cm−3)
0 h1 h2 h3 h4 h
0 V (CK)521.36 ± 17.86 a406.25 ± 32.60 b364.45 ± 12.35 b539.33 ± 14.29 b400.78 ± 10.25 b
5 kv (T1)526.17 ± 19.67 a41,986.22 ± 5293.44 a126,217.45 ± 119,339.75 a222,001.80 ± 256,322.90 a416,466.58 ± 328,669.54 a
7 kv (T2)592.93 ± 21.17 a32,412.12 ± 25,969.57 ab182,844.66 ± 93,041.30 a131,039.77 ± 44,299.84 a212,401.10 ± 91,149.66 ab
Note: 1 lowercase letters in the same column indicate significant differences between different treatment groups at the same time (p < 0.05).
Disclaimer/Publisher’s Note: The statements, opinions and data contained in all publications are solely those of the individual author(s) and contributor(s) and not of MDPI and/or the editor(s). MDPI and/or the editor(s) disclaim responsibility for any injury to people or property resulting from any ideas, methods, instructions or products referred to in the content.

