Article

Overexpression of GmXTH1 Enhances Salt Stress Tolerance in Soybean

by
Yang Song
,
Kun Wang
,
Dan Yao
,
Qi Zhang
,
Boran Yuan
and
Piwu Wang
*
College of Agronomy, Jilin Agricultural University, 2888 Xincheng Street, Nanguan District, Changchun 130118, China
*
Author to whom correspondence should be addressed.
These authors contributed equally to this work.
Agronomy 2024, 14(10), 2276; https://doi.org/10.3390/agronomy14102276
Submission received: 25 August 2024 / Revised: 26 September 2024 / Accepted: 2 October 2024 / Published: 3 October 2024
(This article belongs to the Section Plant-Crop Biology and Biochemistry)

Abstract

:
Soybean is an important grain, oil and feed crop, which plays an important role in ensuring national food security. However, soil salinization hinders and destroys the normal physiological metabolism of soybean, resulting in the abnormal growth or death of soybean. The XTH gene can modify the plant cell wall and participate in the response and adaptation of plants to negative stress. To elucidate the role of the overexpressed GmXTH1 gene under NaCl-induced stress in soybean, we determined the germination rate, the germination potential, the germination index, seedling SOD activity, POD activity, the MDA content and the MDA content during the germination stage of the overexpressed lines of the GmXTH1 gene, the OEAs (OEA1, OEA2 and OEA3), the interference expression line IEA2, the control mutant M18, the CAT content and the chlorophyll content. The relative expression of the GmXTH1 gene in the material OEA1 and the contents of Na+ and K+ in the roots after stress were also determined. The results showed that OEAs exhibited enhanced germination indices, including the germination rate and germination potential, and were less sensitive to stress compared with the mutant M18. In contrast, the inhibitory effect of NaCl was more pronounced in the line with a disturbed expression of GmXTH1 (IEA2). The OEAs exhibited more enzyme activities and a lower MDA content, indicating reduced oxidative stress, and maintained higher chlorophyll levels, suggesting improved photosynthetic capacity. Relative expression analysis showed that the GmXTH1 gene was rapidly up-regulated in response to NaCl, peaking at 4 h after treatment, and subsequently declining. This temporal expression pattern correlated with the enhanced salt tolerance observed in OEA1. Notably, OEA1 accumulated more Na+ and maintained higher K+ levels, indicating effective ionic homeostasis under stress. Collectively, these results suggest that the overexpression of the GmXTH1 gene may positively regulate plant responses to salt stress by modulating the antioxidant defense and ion transport mechanisms.

1. Introduction

Soybean is an crucial grain, oil and feed crop, providing humans with abundant vegetable proteins, oils and fats [1]. Global soybean production in the 2022/23 season reached 370,421,000 tons, representing an increase of 2.9% compared to that of the previous year. Among them, the production of the top three countries were Brazil, the United States and Argentina, while for China, as a global soybean consumer, the production share is only about 5.5%, ranking fourth [2]. China’s soybean import dependence is as high as 80% or more; the total amount of imported soybean in 2022 was 91.08 million tons. Within this total, 54.39 million tons were imported from Brazil, accounting for 59.72%; 29.53 million tons were imported from the United States, accounting for 32.42%; and 3.64 million tons were imported from Argentina, accounting for 4.00% [3]. This heavy reliance on imports underscores the vulnerability of China’s soybean supply chain to fluctuations in the international markets and the necessity of strengthening the soybean industry in China.
Soil salinization, a pervasive global issue, poses a significant threat to agricultural productivity and ecological integrity, thereby impeding sustainable development [4,5]. Therefore, it is even more important to understand the dangers of soil salinity to minimize the losses caused by soil salinity on soybean yields. Soil salinization is a process in which salts from the soil substrate or groundwater rise to the surface with capillary water, and then the water evaporates so that salts accumulate in the surface soil. Soil salinization not only hinders water uptake by plant roots, but also severely affects plant growth, reproduction and plant yield negatively [6,7,8]. In saline environments, excessive Na+ uptake disrupts the osmotic equilibrium, resulting in an increased osmotic potential that outpaces the surrounding saline solution. This osmotic imbalance leads to water loss from the plant tissues, further exacerbating the ionic imbalance and negatively affecting germination and plant growth. Additionally, elevated extracellular sodium concentrations can detrimentally influence the intracellular level of essential potassium ions, as well as calcium and magnesium, which are vital for plant growth. Such ionic disruptions can weaken the cell walls, diminish enzyme activity and impair chlorophyll synthesis, all of which are critical for plant health and productivity.
Currently, the degree of soil salinization worldwide continues to show an increasing trend. The total area of saline soil in the world is about 1.1 × 10¹³ m2, and the total area of saline soil in China is 3.69 × 10¹¹ m2 [9]. According to the statistics from Liaoning, Jilin and Heilongjiang Provinces, there is a total of 3.2 × 10¹⁰ m2 of saline and alkaline soils [10]. In Jilin Province, as a major soybean-producing province, soil salinization has seriously impacted soybean yield. Therefore, it is of great significance to cultivate salt-resistant soybean strains through breeding improvement. This would not only enhance soybean yields and quality in saline and alkaline soils, but also contribute significantly to addressing food security concerns.
XTH is a class of protein encoded by a multigene family that has the dual function of catalyzing xyloglucan endoglycosyltransferase (XET) and xyloglucan hydrolase (XEH) activities. XTH proteins are members of the glycoside hydrolase GH16 family and play an important role in resistance to abiotic stress, plant growth, development and fruit softening. They achieve these functions by altering the extensibility of plant cell walls through the shearing or rearrangement of the cell wall xyloglucan backbone. Currently, XTH genes have been identified in various species, and their functions vary due to differences in protein function and amino acid sequences, leading to a broader range of applications (Table 1).
As shown in the table above, the functions and applications of the different XTH genes vary in different species. The functions possessed by the XTH genes in this table can be categorized into three parts: promoting the ripening and softening of plant fruits, participating in the response of plants to abiotic stresses (drought stress, salt stress, cold stress, high-temperature stress and metal ion stress), and participating in the growth and development of plants. It has also been shown that the heterologous expression of the soybean gene XTH43 in cotton improves cotton’s defense against parasitic nematode infection [32]. XTH family member genes play a role for plants in the response to both biotic and abiotic stresses. However, research into the function of the XTH gene does not stop there. It has been shown that the GmXTH1 gene is involved in the response to drought stress in soybean, but the response to salt stress is not clear. In order to clarify the response of the soybean GmXTH1 gene to NaCl stress, M18, OEA1, OEA2, OEA3 and IEA2 were used as test materials in this study, and we set up 0 mmol, 100 mmol and 150 mmol NaCl stress treatments at the germination and seedling stages, respectively. The germination rate; the germination potential; the germination index; the seedling SOD, POD, CAT, MDA, and chlorophyll contents; and the relative expression of target genes, as well as the Na+ and K+ contents were determined at the germination stage.

2. Materials and Methods

2.1. Experimental Materials

M18 was the mutant material, which was named OEA after the overexpression of the GmXTH1 gene or IEA after interference with the GmXTH1 gene in the mutant material. In this study, we used the T5-generated overexpression of the GmXTH1 gene in the materials OEA1, OEA2 and OEA3 and T5-generated interference with the expression of the GmXTH1 gene in the material IEA2, which were provided by the Center for Plant Biotechnology, Jilin Agricultural University, Jilin, China.

2.2. Determination of Germination Percentage, Germination Potential and Germination Index

M18, OEA1, OEA2, OEA3 and IEA2 were soaked in 75% ethanol and 5% sodium hypochlorite for 120 s and washed three times with distilled water. Twenty seeds each were selected and placed in disposable and 9 cm size petri dishes lined with moistened filter paper, and this was repeated three times. A 0 mmol treatment (control), a 100 mmol treatment and a 150 mmol treatment were prepared. Twenty mL of solution was added to each treatment group, and an equal amount of distilled water was added to the control group. The seeds were placed in an artificial climatic incubator with 14 h of light and 10 h of darkness. Germination was accelerated at a constant temperature of 25 °C and 70% relative humidity. Germination rate (GR), germination potential (GE) and germination index (GI) were determined by the germination criterion that the radicle broke through the seed coat by 1 mm. The germination index was calculated according to the following formula [33]:
GR (%) =total number of germinations on the 6th day × 100/number of tested seeds
GE (%) =number of germinations in the first 3 days × 100/number of tested seeds
GI = Σ(DG/DT)
DG is the number of germinations per day
DT is the number of days corresponding to DG

2.3. Measurement of Physiological and Biochemical Indicators

For each material, three plants were selected and cultured in plastic bottles that were 16 cm in height and 4.6 cm in diameter, each containing 200 mL of solution, and placed in an artificial climate chamber, and this was replicated three times. A 0 mmol treatment (control), a 100 mmol treatment and a 150 mmol treatment were prepared. Samples were taken on the 7th day of the experiment to determine the indices of the plants. The SOD, POD, CAT, MDA and chlorophyll contents were determined according to the instructions of catalase (CAT) activity, peroxidase (POD) activity, phytochlorophyll content, malondialdehyde (MDA) content and superoxide dismutase (SOD) activity assay kits. The above kits were provided by Solarbi Technology Co, Beijing, China.

2.4. Determination of Root Phenotypes

The material culture methods and treatment groups used to determine root phenotypes were consistent with those in Section 2.3. The total root length, root volume, root surface area and mean diameter of the plants at stage V2 (the V2 stage is the period of nutritional growth of soybeans, which is the period of the full growth of the first compound leaf above a single leaf) were determined using an Epson Perfection V800 photo root scanner.

2.5. Measurement of Relative Expression of Target Genes

The expression of the GmXTH1 gene at 0 h, 4 h, 8 h, 24 h and 48 h was determined in three replicates using RNA extracted from the roots and leaves of two strains, M18 and OEA1, subjected to 100 mmol stress and reverse-transcribed into cDNA. The internal reference gene was selected as β-actin, and primers were designed for β-actin and GmXTH1, respectively (Table 2). Expression was determined according to the instructions of the Reverse Transcription Kit and Fluorescence Quantification Kit from TransGen Biotech Co, Beijing, China. The relative expression of the GmXTH1 gene was calculated by the 2−∆∆Ct method [34].

2.6. Determination of Ion Content

Roots of M18 and OEA1 treated with 0 mmol and 100 mmol at the seedling stage were selected to determine the Na+ and K+ contents in three replicates. A Swiss Aptar Ion Chromatography ECO-IC instrument was used, and the column Metrosep C4-150 was set up. The mobile phases were 1.7 mmol/L nitric acid and 0.7 mmol/L pyridinedihydroxyacid, and the column temperature was 25 °C. After sampling, 20 mL was added, and ultrasonic extraction was performed for 30 min. Then, the samples were filtered using a 0.45 um filter membrane. The contents of Na+ and K+ were determined by ion chromatography, which was determined by Sangon Biotech Co, Shanghai, China.

2.7. Methods of Data Analysis

The data and indicators obtained were analyzed for the significance of differences using spss 18.0 data processing software. Each experimental treatment was repeated three times, and the mean ± standard deviation of the measurements was used as the final result; * p < 0.05 indicates when the difference was significant, and ** p < 0.01 indicates when the difference was highly significant. Origin was used for graphing.

3. Results and Analysis

3.1. Effect of Different Stress Treatments on Soybean Germination Period

It can be observed that under unstressed conditions (0 mmol), the germination of M18, the OEAs and IEA2 progressed well with no significant difference. Under the 100 mmol and 150 mmol stress conditions, the shoot lengths of the OEAs were longer than those of the control material M18, and the germination performance was relatively better, while the opposite was true for IEA2 (Figure 1). This indicates that the overexpression of the GmXTH1 gene can attenuate the inhibitory effect of salt stress on the germination situation of soybean at the emergence stage.
It can be seen that the germination rate, the germination potential and the germination index of each strain were different in the different treatment groups. There was no significant difference between the germination indexes of the strains at 0 mmol. The germination rate, the germination potential and the germination index of the OEAs were significantly higher than those of the control material M18 under the 100 mmol and 150 mmol stress treatments, while the opposite was true for the germination rate, the germination potential and the germination index of IEA2 (Table 3). This suggests that the GmXTH1 gene may improve the tolerance to salt stress during seed germination.

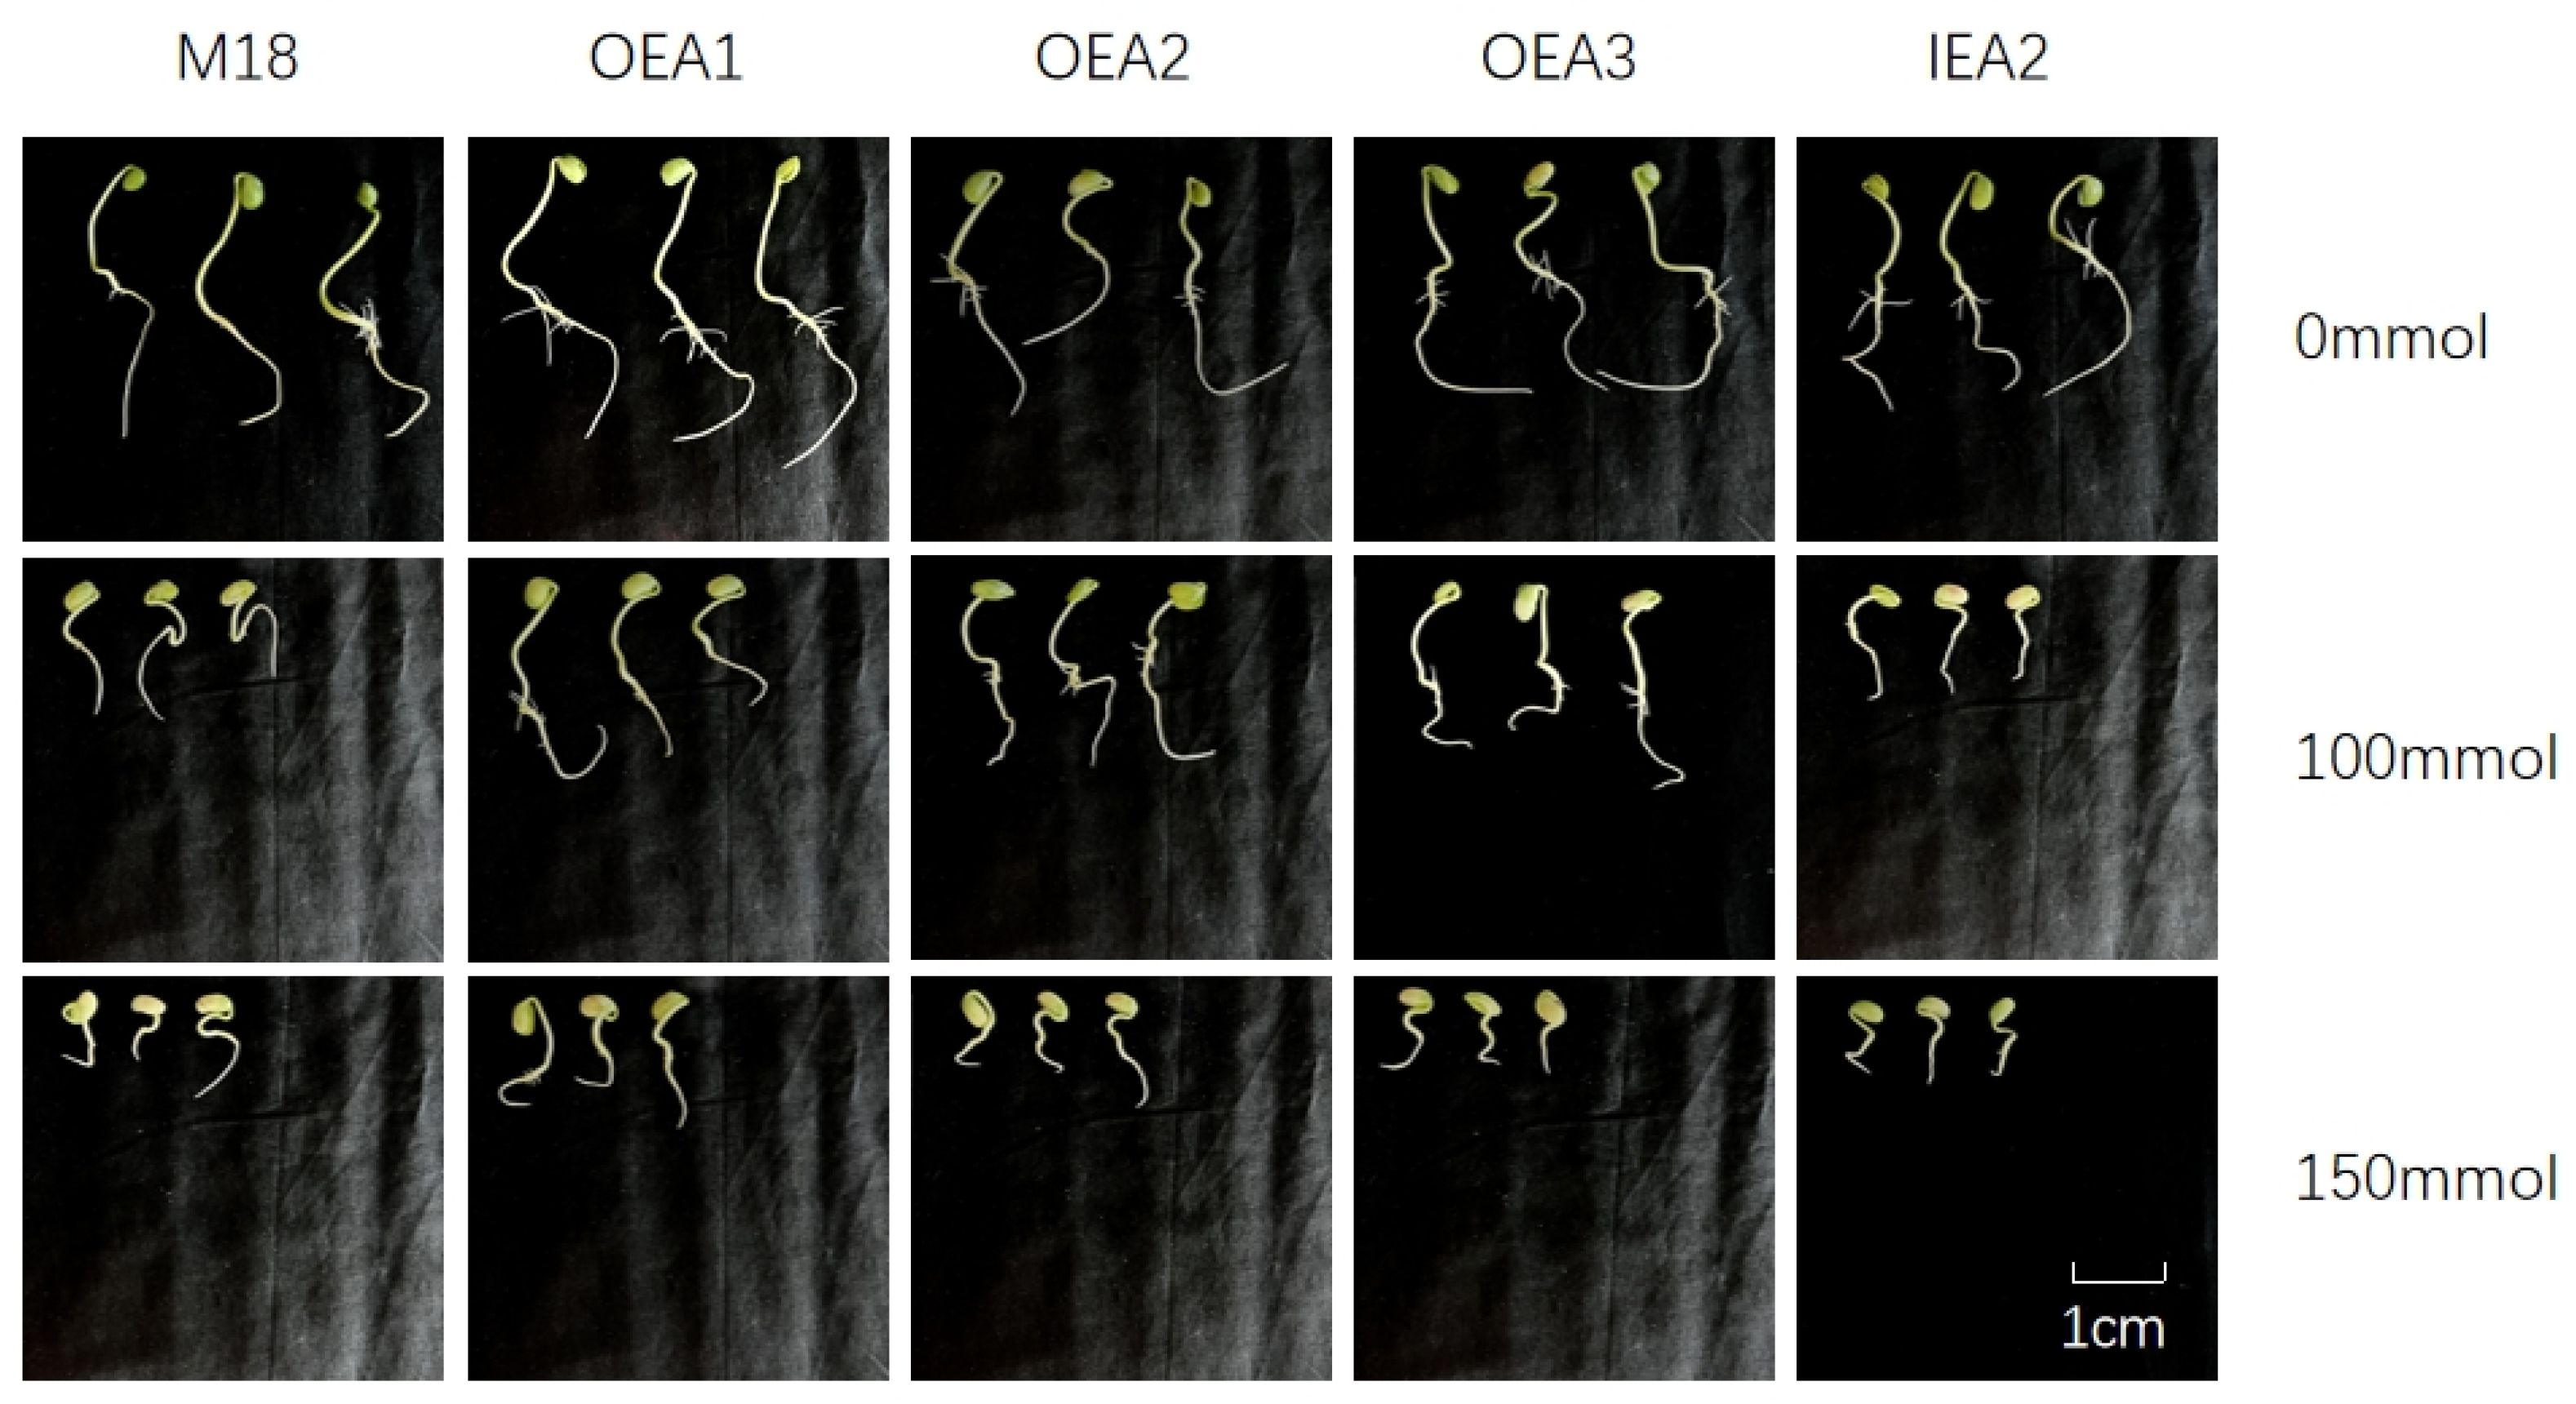
3.2. Effects of Different Stress Conditions on Soybean Seedling Growth and Development

The OEAs and IEA2 performed well in the unstressed condition, with dense green leaves and thick stems and with no significant difference compared with the control M18 (Figure 2).
There were significant differences in the overall phenotypes among the lines after the 100 mmol stress treatment. The OEAs had intensely green, slightly drooping leaves and stout erect stalks. The IEA2 plants were moderately wilted, with moderately drooping leaves, which were curled and crumpled, and the stalks appeared to be curved due to stress. M18 was mildly wilted, with slightly drooping leaves, slightly yellowed, and the margins were slightly curled and crumpled. The IEA2 plants were moderately wilted, with moderately drooping and curled and crumpled leaves. The IEA2 plants were moderately wilted, with moderately drooping and curled and crumpled leaves.
Under 150 mmol stress, OEA1 was very severely crumpled, while OEA2 and OEA3 were severely crumpled, but there were a smaller number of leaves with normal extension and more erect stalks. The M18 plants had severely crumpled leaves and severely bent stalks. The IEA2 plants had very severely crumpled leaves, and the stalks became dry and short. This indicates that overexpression of the GmXTH1 gene promotes stout and erect stalks and normal leaf extension and improves the tolerance of soybean plants to salt stress.

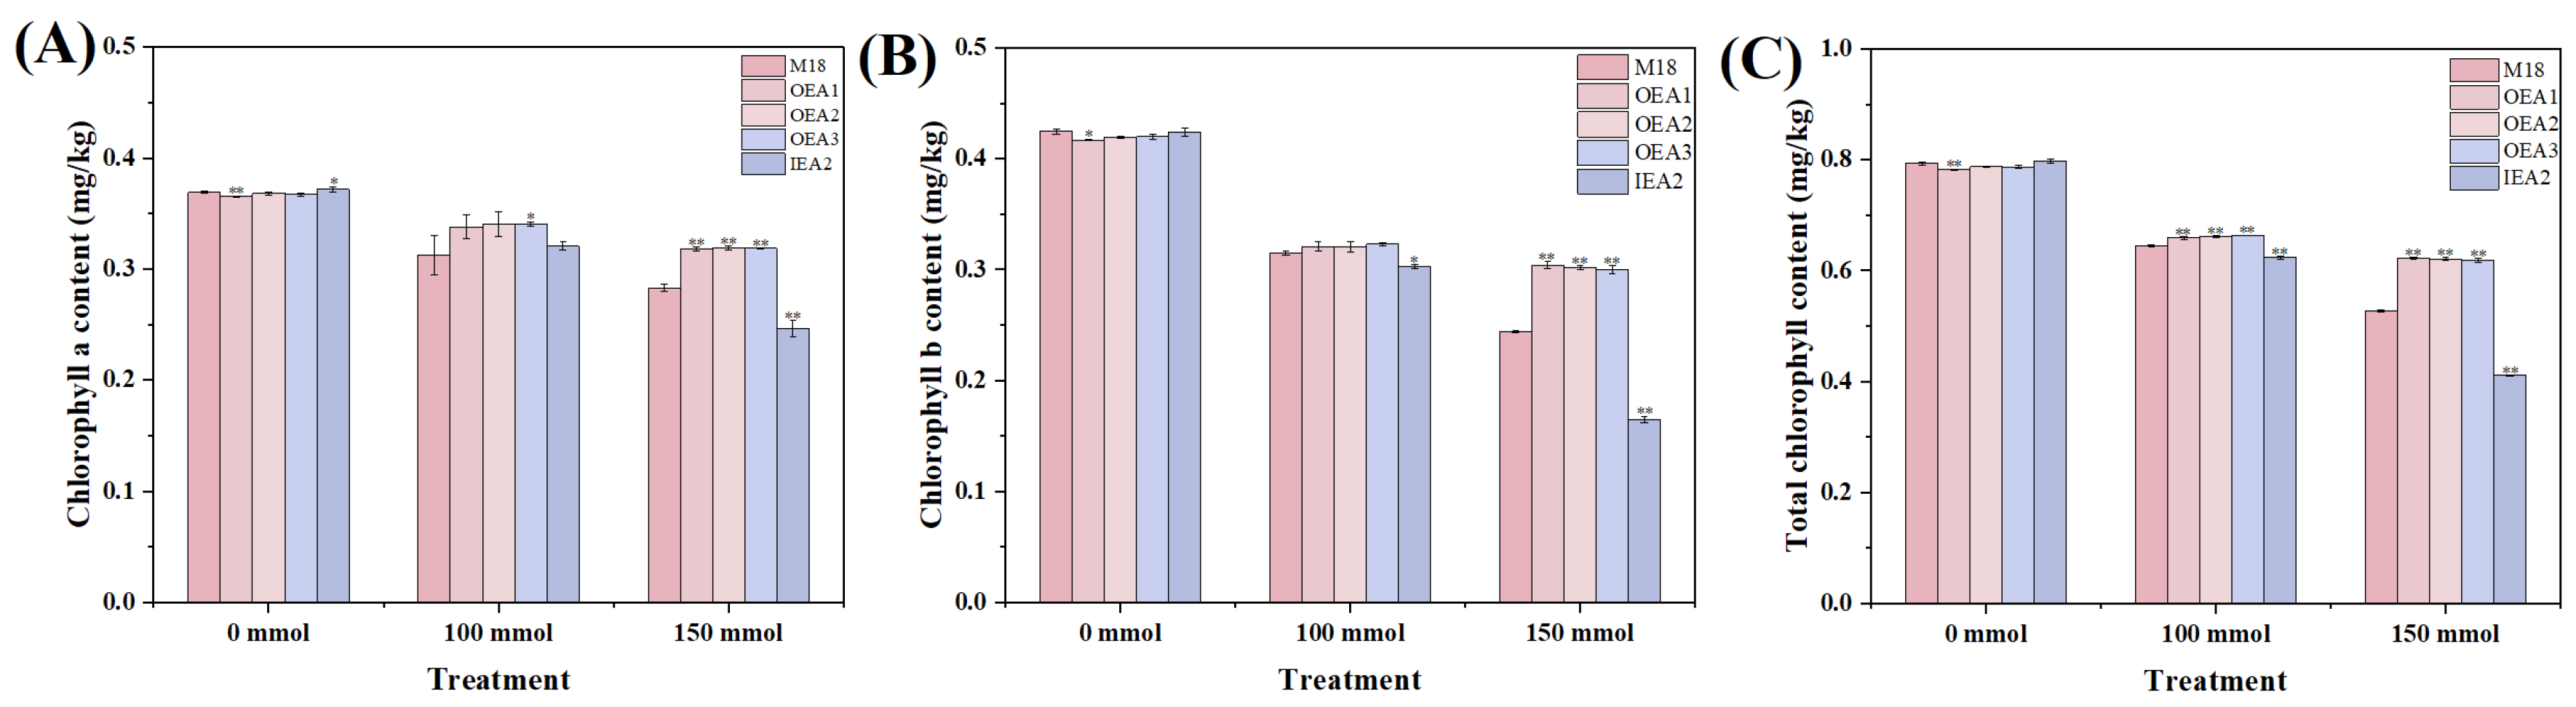
3.3. Effects of Different Stress Conditions on Physiological and Biochemical Indicators of Soybean

Under no stress conditions, there were no significant differences in overall leaf SOD activity among the various soybean lines. After exposure to 100 mmol stress, the mean value of SOD for M18 was 360.18 U/g (U/g is the unit of enzyme activity per gram of enzyme preparation). The mean values of SOD for the leaves of OEA1, OEA2 and OEA3 were 383.89 U/g, 384.72 U/g and 395.99 U/g, which were significantly higher than that of the control group. The mean value of SOD for the leaves of IEA2 was 328.58 U/g, which was significantly lower than that of the control group. After the 150 mmol stress treatment, the mean value of SOD for M18 was 261.32 U/g. The mean SOD value of the leaves was 328.58 U/g, which was significantly lower than that of the control. The mean SOD value of M18 was 261.32 U/g after the 150 mmol stress treatment. The mean SOD values of the OEA1, OEA2 and OEA3 leaves were 276.12 U/g, 274.55 U/g and 277.53 U/g, respectively, which were significantly higher than that of the control. The mean SOD value of the IEA2 leaves was 243.25 U/g, which was significantly lower than that of the control (Figure 3A). This suggests that the overexpression of the GmXTH1 gene enhances SOD activity in plants of soybean subjected to salt stress.
Under no stress conditions, the mean POD activity value in the leaves of M18 was 1.18 U/g. The mean POD activity values of the OEA1, OEA2 and OEA3 leaves were 1.17 U/g, 1.18 U/g and 1.19 U/g, respectively, and that of the IEA2 leaves was 1.2 U/g. The POD value of OEA1 was significantly lower than that of the control, while the value of IEA2 was significantly higher than that of the control material M18. After 100 mmol stress, the mean value of POD for the M18 leaves was 2 U/g, and the mean values of POD for the OEA1, OEA2 and OEA3 leaves were 2.18 U/g, 2.18 U/g and 2.19 U/g, respectively, which were significantly higher than that of the control material. However, that of the IEA2 leaves was 1.65 U/g, which was significantly lower than that of the control material. After the 150 mmol stress treatment, the mean POD value of the M18 leaves was 1.45 U/g, and the mean POD values of the OEA1, OEA2 and OEA3 leaves were 1.52 U/g, 1.55 U/g and 1.54 U/g, respectively, which were significantly higher than that of the control group. The mean POD value of the IEA2 leaves was 1.43 U/g, which was significantly lower than that of the control group (Figure 3B). This indicates that the overexpression of the GmXTH1 gene increased POD activity.
Without a stress treatment, the mean CAT activity value in the M18 leaves was 494.71 U/g. The mean CAT activity values in the leaves of OEA1, OEA2 and OEA3 were 491.10 U/g, 498.10 U/g and 495.00 U/g, respectively. The CAT activity level in the OEA1 leaves was significantly higher than that of the control group, while the activity level in the IEA2 leaves at 485.90 U/g was significantly lower than that of the control. Under 100 mmol stress, the mean CAT values of the M18, OEA1, OEA2, OEA3 and IEA2 leaves were 809.76 U/g, 874.39 U/g, 854.76 U/g, 830.78 U/g and 771.60 U/g, respectively. The CAT value of the OEA leaves was significantly higher than that of the control, and the CAT value of the IEA2 leaves was significantly lower than that of the control. Under 150 mmol stress, the mean CAT values of the M18, OEA1, OEA2, OEA3 and IEA2 leaves were 627.60 U/g, 779.70 U/g, 731.01 U/g, 727.83 U/g and 578.96 U/g, respectively. The CAT value of the OEAs was significantly higher than that of the control group, and the CAT value of IEA2 was significantly lower than that of the control group (Figure 3C). The differences in CAT activities among the leaves of the trans-GmXTH1 gene overexpression lines (OEAs), the trans-GmXTH1 gene interference expression line (IEA2) and the control M18 were significant. This indicates that the overexpression of the GmXTH1 gene increased CAT activity.
In the absence of a stress treatment, the mean MDA value of the M18 leaves was 13.16 nmol/g, the mean MDA values of the OEA1, OEA2 and OEA3 leaves were 13.46 nmol/g, 13.27 nmol/g and 13.58 nmol/g, respectively, and the mean MDA value of the IEA2 leaves was 13.4. There was no significant difference in the MDA values among the materials. After 100 mmol stress, the mean MDA value of the M18 leaves was 17.99 nmol/g, and those of the OEA1, OEA2 and OEA3 leaves were 14.62 nmol/g, 14.91 nmol/g and 15.19 nmol/g, respectively, which was significantly lower than that of control group. The mean MDA value of the IEA2 leaves was 20.53 nmol/g, which was significantly higher than that of the control group. After the 150 mmol stress treatment, the mean MDA value of the M18 leaves was 29.91 nmol/g, and the mean MDA values of the OEA1, OEA2 and OEA3 leaves were 25.39 nmol/g, 25.66 nmol/g and 26.23 nmol/g, which were significantly lower than that of the control group, and the IEA2 leaves had a mean MDA value of 34.00 nmol/g. The mean value of MDA was 34.00 nmol/g, which was significantly higher than that of the control (Figure 3D). The differences in MDA content among the leaves of the trans-GmXTH1 overexpression lines (OEAs), the trans-GmXTH1 interference expression line (IEA2) and the control M18 were significant. This suggests that overexpression of the GmXTH1 gene can inhibit the accumulation of MDA in plants.
Under no stress conditions, the mean value of the chlorophyll a content of M18 was 0.3690 mg/g; the mean value of the chlorophyll a content of OEA1 was 0.3653 mg/g, which was significantly lower than that of the control group. In contrast, IEA2 had a mean chlorophyll a content of 0.3718 mg/g, which was higher than that of the control, with no significant difference observed among the other strains. Upon application of the 100 mmol stress treatment, the mean value of the chlorophyll a content of M18 was 0.3125 mg/g, and the mean value of the chlorophyll a content of OEA1 was 0.3379 mg/g, which was higher than that of the control group. No significant differences were found among the other strains. Under 150 mmol stress, the mean chlorophyll a contents of the M18, OEA1, OEA2, OEA3 and IEA2 leaves were 0.2831 mg/g, 0.3180 mg/g, 0.3189 mg/g, 0.3186 mg/g and 0.2460 mg/g, respectively. The chlorophyll a content of the OEA leaves was significantly higher than that of the control, and the chlorophyll a content of the IEA2 leaves was significantly lower than that of the control (Figure 4A). This indicates that the overexpression of the GmXTH1 gene could produce more chlorophyll a and improve plants’ tolerance to salt stress in plants subjected to salt stress.
Under no stress conditions, the mean value of the chlorophyll b content of M18 was 0.4247 mg/g. The mean value of the chlorophyll b content of OEA1 was 0.4170 mg/g, which was lower than that of the control material M18. There were no significant differences among the other strains. When subjected to a 100 mmol stress treatment, the mean values of the chlorophyll b content of the leaves of M18 and IEA2 were 0.3147 mg/g and 0.3027 mg/g. The chlorophyll b content of the IEA2 leaves was significantly lower than that of the control group, while no significant differences were observed in the other strains. Under the 150 mmol stress conditions, the mean values of the chlorophyll b content in the leaves of M18, OEA1, OEA2, OEA3 and IEA2 were 0.2439 mg/g, 0.3040 mg/g, 0.3017 mg/g, 0.3004 mg/g and 0.1648 mg/g, respectively. And the chlorophyll b contents of the OEAs were significantly higher than that of the control, while that of IEA2 was significantly lower than that of the control (Figure 4B). This indicates that the overexpression of the GmXTH1 gene could produce more chlorophyll b under salt stress and improve the tolerance of plants to salt stress.
Under no stress conditions, the mean value of the total chlorophyll content of M18 was 0.7934 mg/g, and that of OEA1 was 0.7824 mg/g, which was significantly lower than that of the control group. There were no significant differences in the other strains. Upon application of the 100 mmol stress treatment, the mean values of the total chlorophyll content of the M18, OEA1, OEA2, OEA3 and IEA2 leaves were 0.6454 mg/g, 0.6588 mg/g, 0.6611 mg/g and 0.6236 mg/g, respectively. The mean values of total chlorophyll content were 0.6454 mg/g, 0.6588 mg/g, 0.6611 mg/g, 0.6636 mg/g and 0.6234 mg/g, respectively, with the total chlorophyll content of the OEAs being significantly higher than that of the control group, and that of IEA2 being significantly lower than that of the control group. Under the 150 mmol stress treatment, the total chlorophyll contents of the M18, OEA1, OEA2, OEA3 and IEA2 leaves were 0.5271 mg/g, 0.6218 mg/g, 0.6207 mg/g, 0.6186 mg/g and 0.4108 mg/g, respectively. The total chlorophyll content of the OEAs was significantly higher than that of the control, while that of IEA2 was significantly lower than that of the control (Figure 4C). This indicates that the overexpression of the GmXTH1 gene can produce more total chlorophyll in plants under salt stress.
In summary, the overexpression of the GmXTH1 gene increased the SOD, POD, and CAT activity levels and chlorophyll contents, which favors the removal of harmful substances from the plant body [35,36,37,38], reducing the MDA content and attenuating the degree of membrane lipid peroxidation [39]. This suggests that the overexpression of the GmXTH1 gene improves salt tolerance in plants.

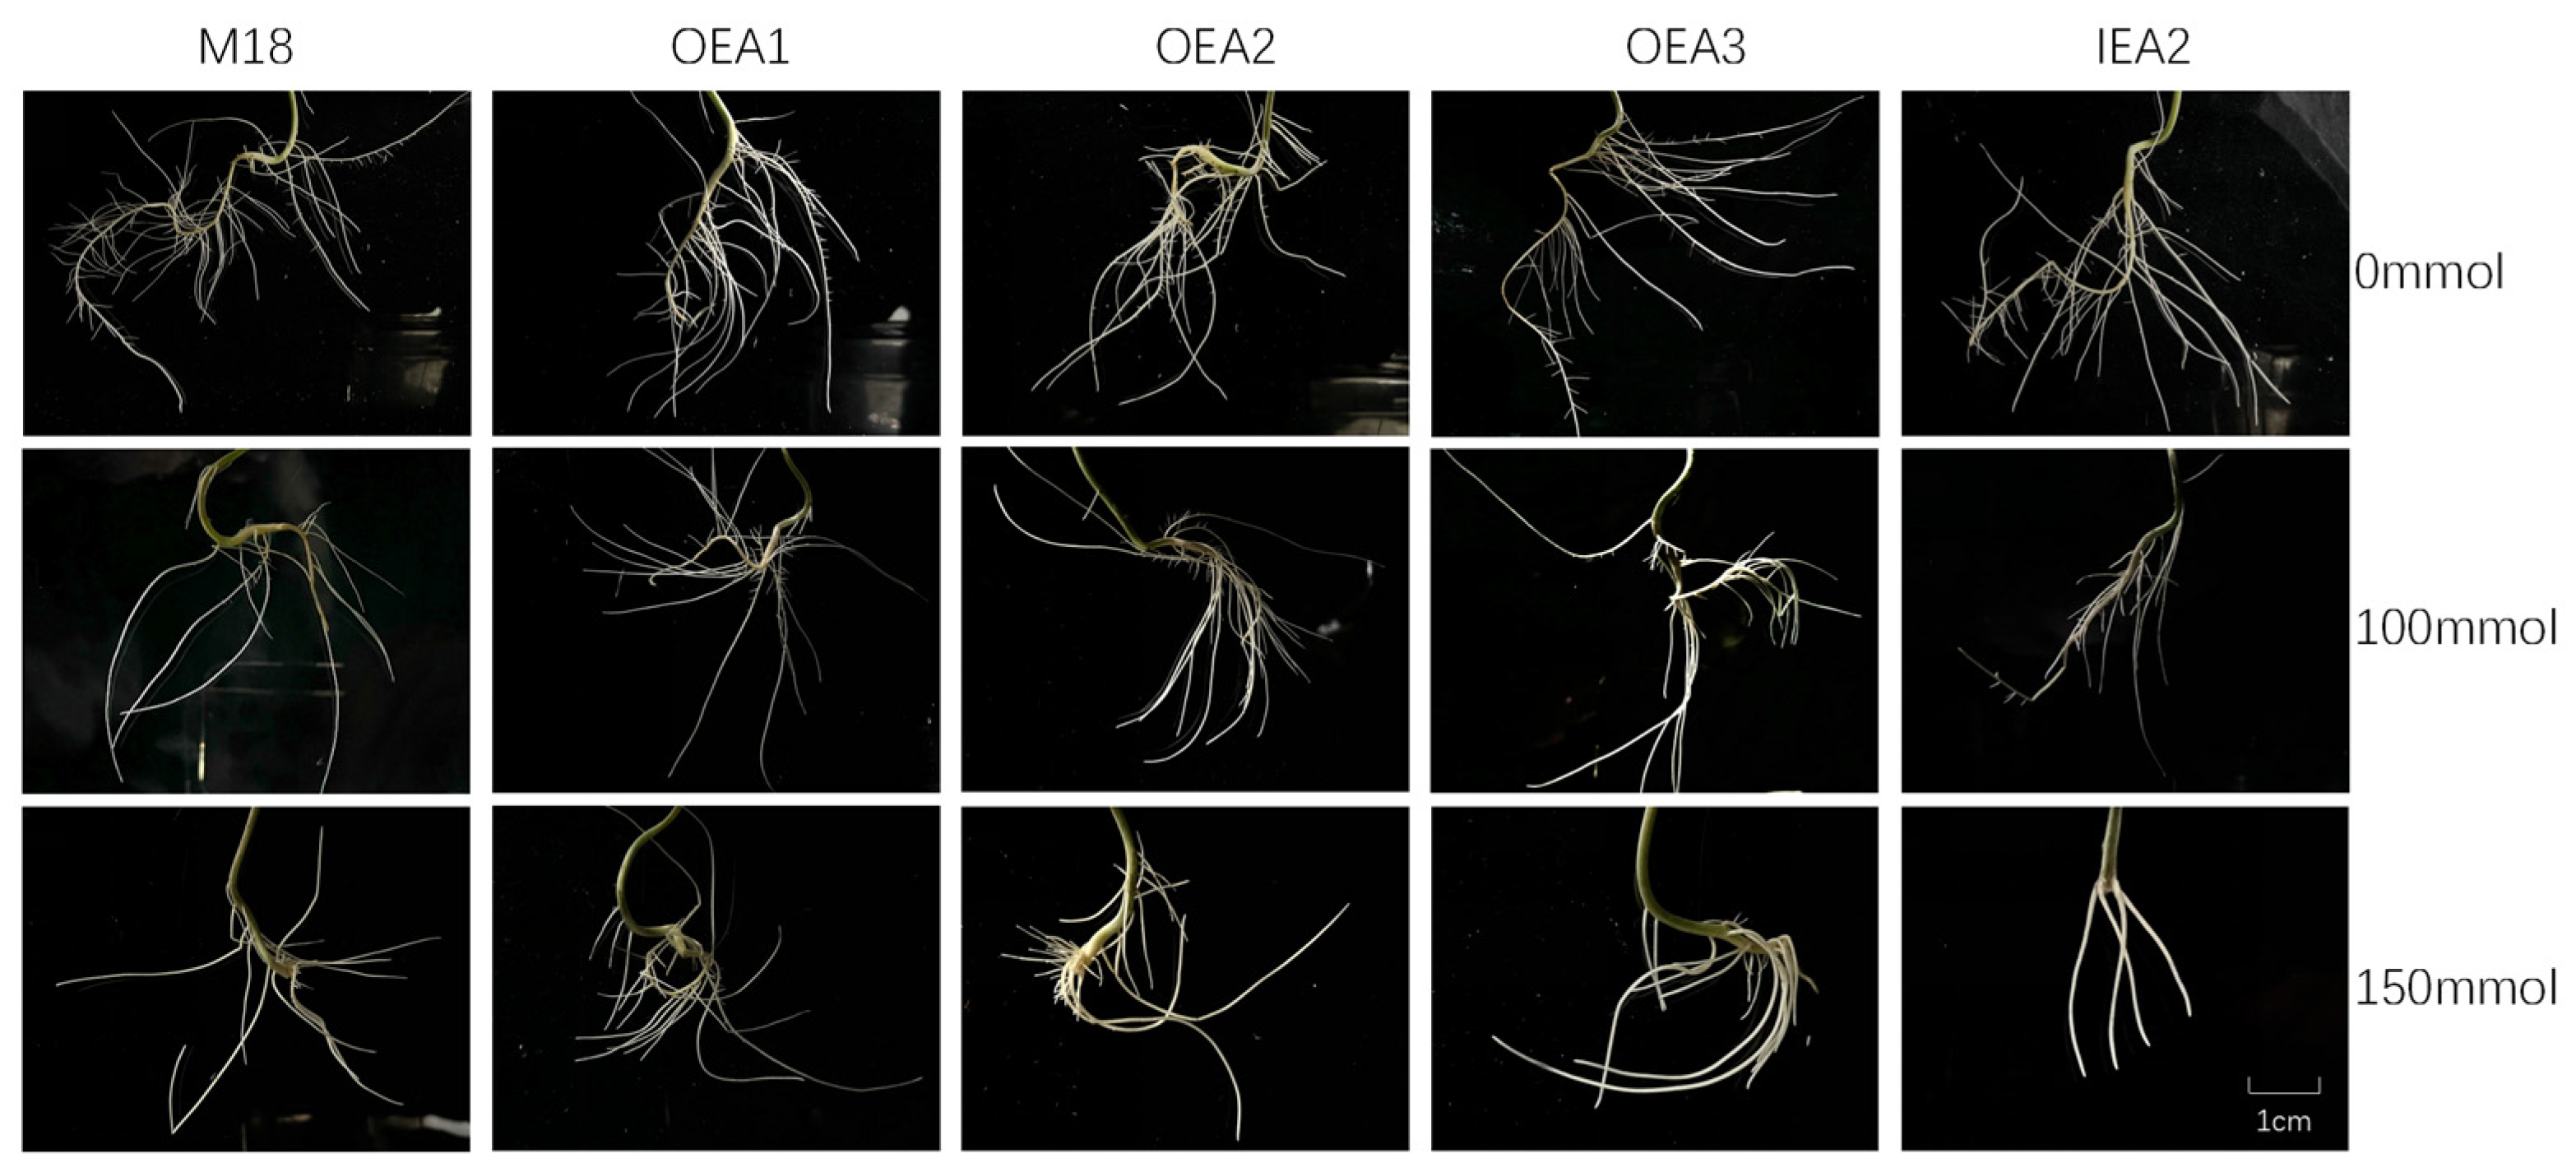
3.4. Phenotypes of the Root System of Each Strain under Different Stress Conditions

Under no stress conditions, there were no significant differences in root growth and development among the strains. They all exhibited thick primary roots, numerous lateral roots and many fibrous roots. However, under the 100 mmol stress treatment, the root growth of the OEA strains was relatively healthy. In contrast, the main root of M18 became curled, with a few yellow-brown spots, and the main root of IEA2 was thinned, grew more slowly, and had yellow-brown spots. Under the 150 mmol stress treatment, the root growth of the OEA strains showed down, and there was a reduction in the number of lateral roots. These strains produced a small number of fibrous roots. The main root of M18 decayed, the lateral roots appeared to be rotten, and no new fibrous roots developed. Similarly, the main root of IEA2 was rotted, and no new fibrous roots grew. The roots of IEA2 exhibited severe decay and extremely slow growth (Figure 5). This indicates that the overexpression of the GmXTH1 gene promotes the growth of soybean roots under stress conditions.

3.5. Root Indexes of Each Strain under Different Stress Conditions

There were no significant differences between the total root lengths of the roots of each strain under unstressed conditions. Under 100 mmol stress, the mean value of the total root length of M18 was 8.68 ± 0.13 cm, that of OEA1 was 9.25 ± 0.37 cm, which was significantly larger than that of the control group. That of IEA2 was 7.29 ± 0.06 cm, which was significantly smaller than that of the control group, while no significant difference was observed in the other strains. The mean values of the total root lengths of M18, OEA1, OEA2, OEA3 and IEA2 under 150 mmol stress were 3.85 ± 0.32 cm, 6.53 ± 0.39 cm, 6.07 ± 0.68 cm, 5.69 ± 0.23 cm and 3.54 ± 0.31 cm, respectively. The total root lengths of the OEA strains were significantly greater than those of the control and IEA2, and the difference between the total root lengths of M18 and IEA2 was not significant (Figure 6A). This indicates that the overexpression of the GmXTH1 gene increased the total root length of soybean plants under stress conditions, implying that the GmXTH1 gene may enhance the salt tolerance of seedling soybean by increasing the total root length of plants.
The differences in root volume of the root systems of the strains under unstressed and 100 mmol stress conditions were not significant. Under the 150 mmol stress condition, the root volume of M18 was 3.34 ± 0.60 cm3, and that of OEA1 was 4.98 ± 0.84 cm3, which was higher than that of the control group, while the differences between the other strains and the control group were not significant (Figure 6B). This suggests that the GmXTH1 gene may have enhanced the salt tolerance of soybean by increasing the root volume.
There were no significant differences in the surface area of the roots of each strain under the unstressed treatment condition. The surface area of the roots of M18 was 16.98 ± 1.15 cm2; the surface areas of the roots of OEA1, OEA2 and OEA3 were 20.69 ± 0.85 cm2, 19.72 ± 0.81 cm2 and 20.68 ± 0.37 cm2, respectively, in the 100 mmol stress treatment; and that of IEA2 was 17.25 ± 1.12 cm2. The surface area of the roots of IEA2 was 17.25 ± 1.12 cm2, where the surface area of the roots of OEA1 and OEA3 was significantly greater than that of the control. The surface area of the roots of M18 was 13.36 ± 1.41 cm2, and those of the roots of OEA1, OEA2 and OEA3 were 20.94 ± 1.59 cm2, 19.05 ± 0.13 cm2 and 19.05 ± 0.71 cm2 when subjected to 150 mmol-induced stress, respectively. The surface area of the roots of IEA2 was 12.45 ± 1.22 cm2. The surface area of the roots of the OEAs was significantly larger than that of the control group, and there was no significant difference between the surface area of the roots of IEA2 and that of the control group (Figure 6C). This suggests that the GmXTH1 gene may enhance soybean tolerance to salt stress by increasing the surface area of soybean roots.
There were no significant differences between the mean root diameter of the strains under the different treatment conditions (Figure 6D).
In summary, the overexpression of the GmXTH1 gene had an effect on the total root length, the root volume and the root surface area of the root system. When subjected to stress, the root indexes of the OEAs were better than those of the control material M18, indicating that the overexpression of the GmXTH1 gene favored the growth of the plant root system, and the plants overexpressing the GmXTH1 gene were more tolerant to salt stress.

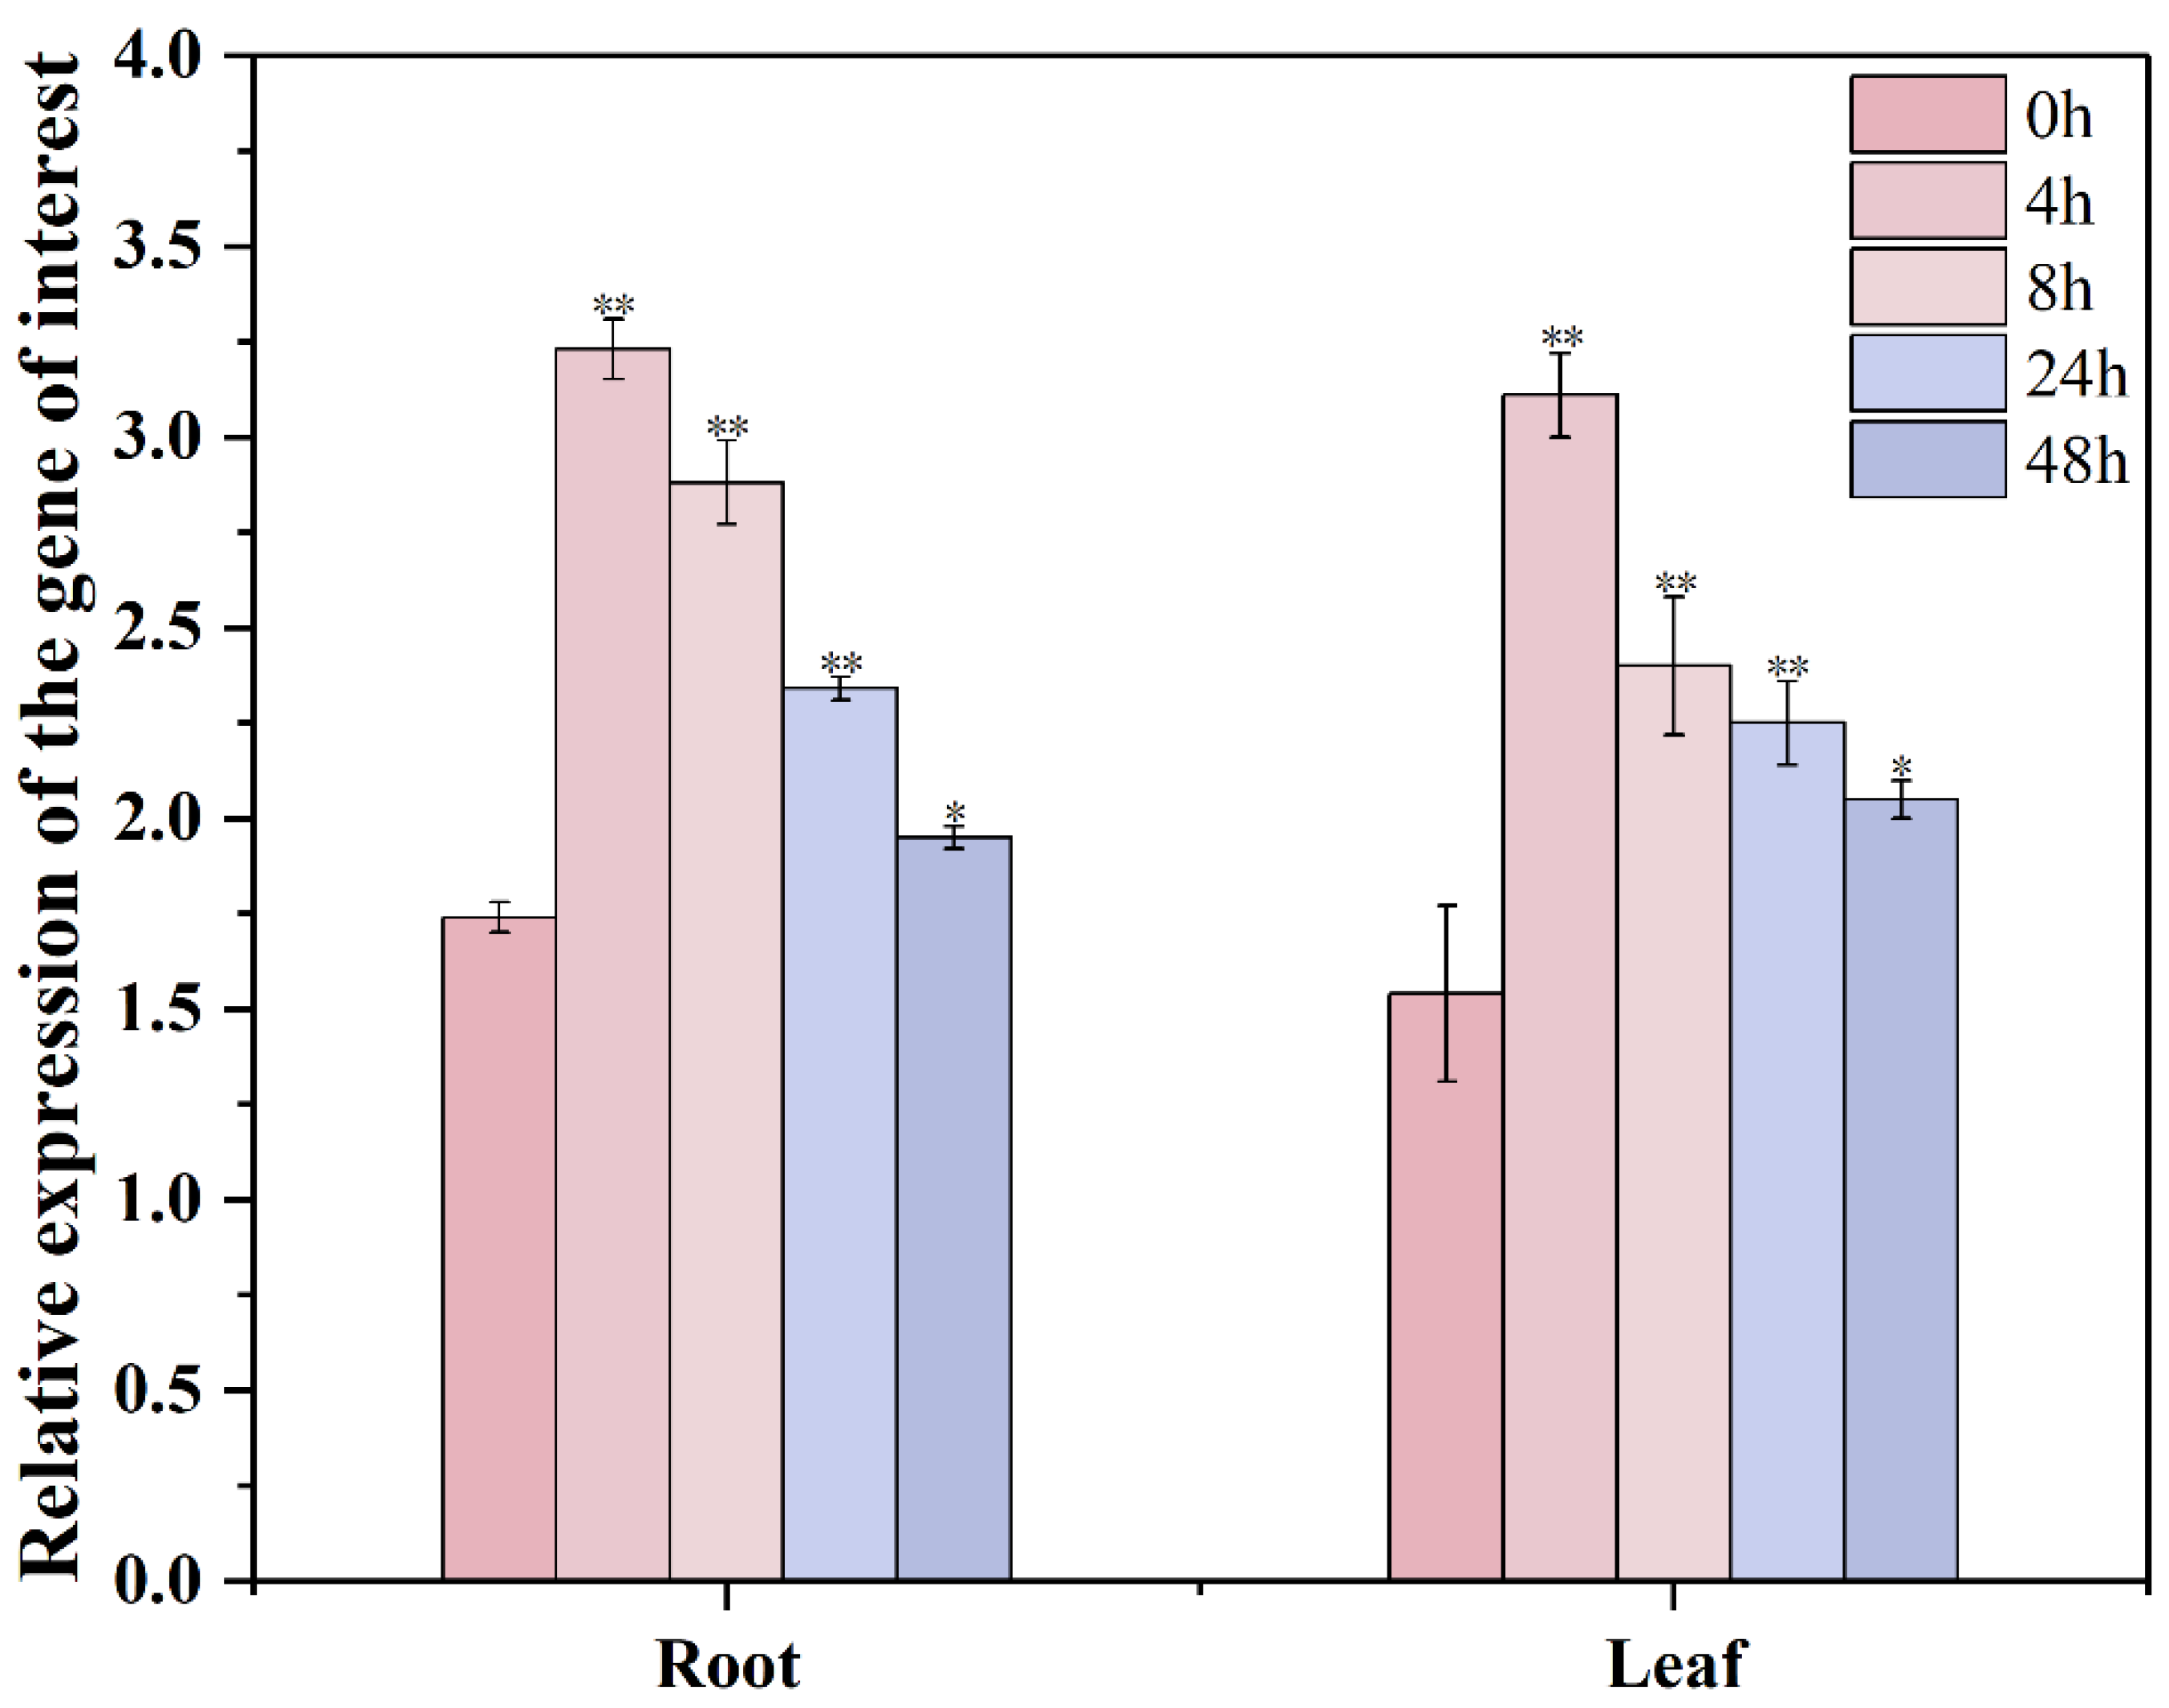
3.6. Changes in Relative Expression of GmXTH1 Gene in Roots and Leaves

M18 was used as the control group, and OEA1 was the experimental group. Under 100 mmol stress, the results of the relative expression of the GmXTH1 gene in the roots showed that at 0 h, 4 h, 8 h, 24 h and 48 h of stress, it was 1.74 ± 0.04, 3.23 ± 0.08, 2.88 ± 0.11, 2.34 ± 0.03 and 1.95 ± 0.03, respectively. Compared with the relative expression at 0 h, 4 h, 8 h and 24 h, the difference in relative expression at 48 h was significant.
The results of the relative expression of the GmXTH1 gene in the leaves showed that at 0 h, 4 h, 8 h, 24 h and 48 h of stress, it was 1.54 ± 0.23, 3.11 ± 0.11, 2.4 ± 0.18, 2.25 ± 0.11 and 2.05 ± 0.05, respectively, with significant differences in relative expression at 4 h, 8 h, 24 h and 48 h compared with that at 0 h (Figure 7). The relative expression at 48 h differed significantly (Figure 7).
The relative expression of the GmXTH1 gene in the soybean roots and leaves showed a trend of increasing, and then decreasing, with the highest relative expression at 4 h of stress, followed by a decrease. This indicates that the GmXTH1 gene responded to salt stress and showed up-regulated expression. The highest relative expression was observed at 4 h of 100 mmol stress, and the relative expression gradually decreased with the continuous progression of stress, which indicates that the plants responded to salt stress most strongly at 4 h, and that the GmXTH1 gene showed an early response under salt stress conditions.

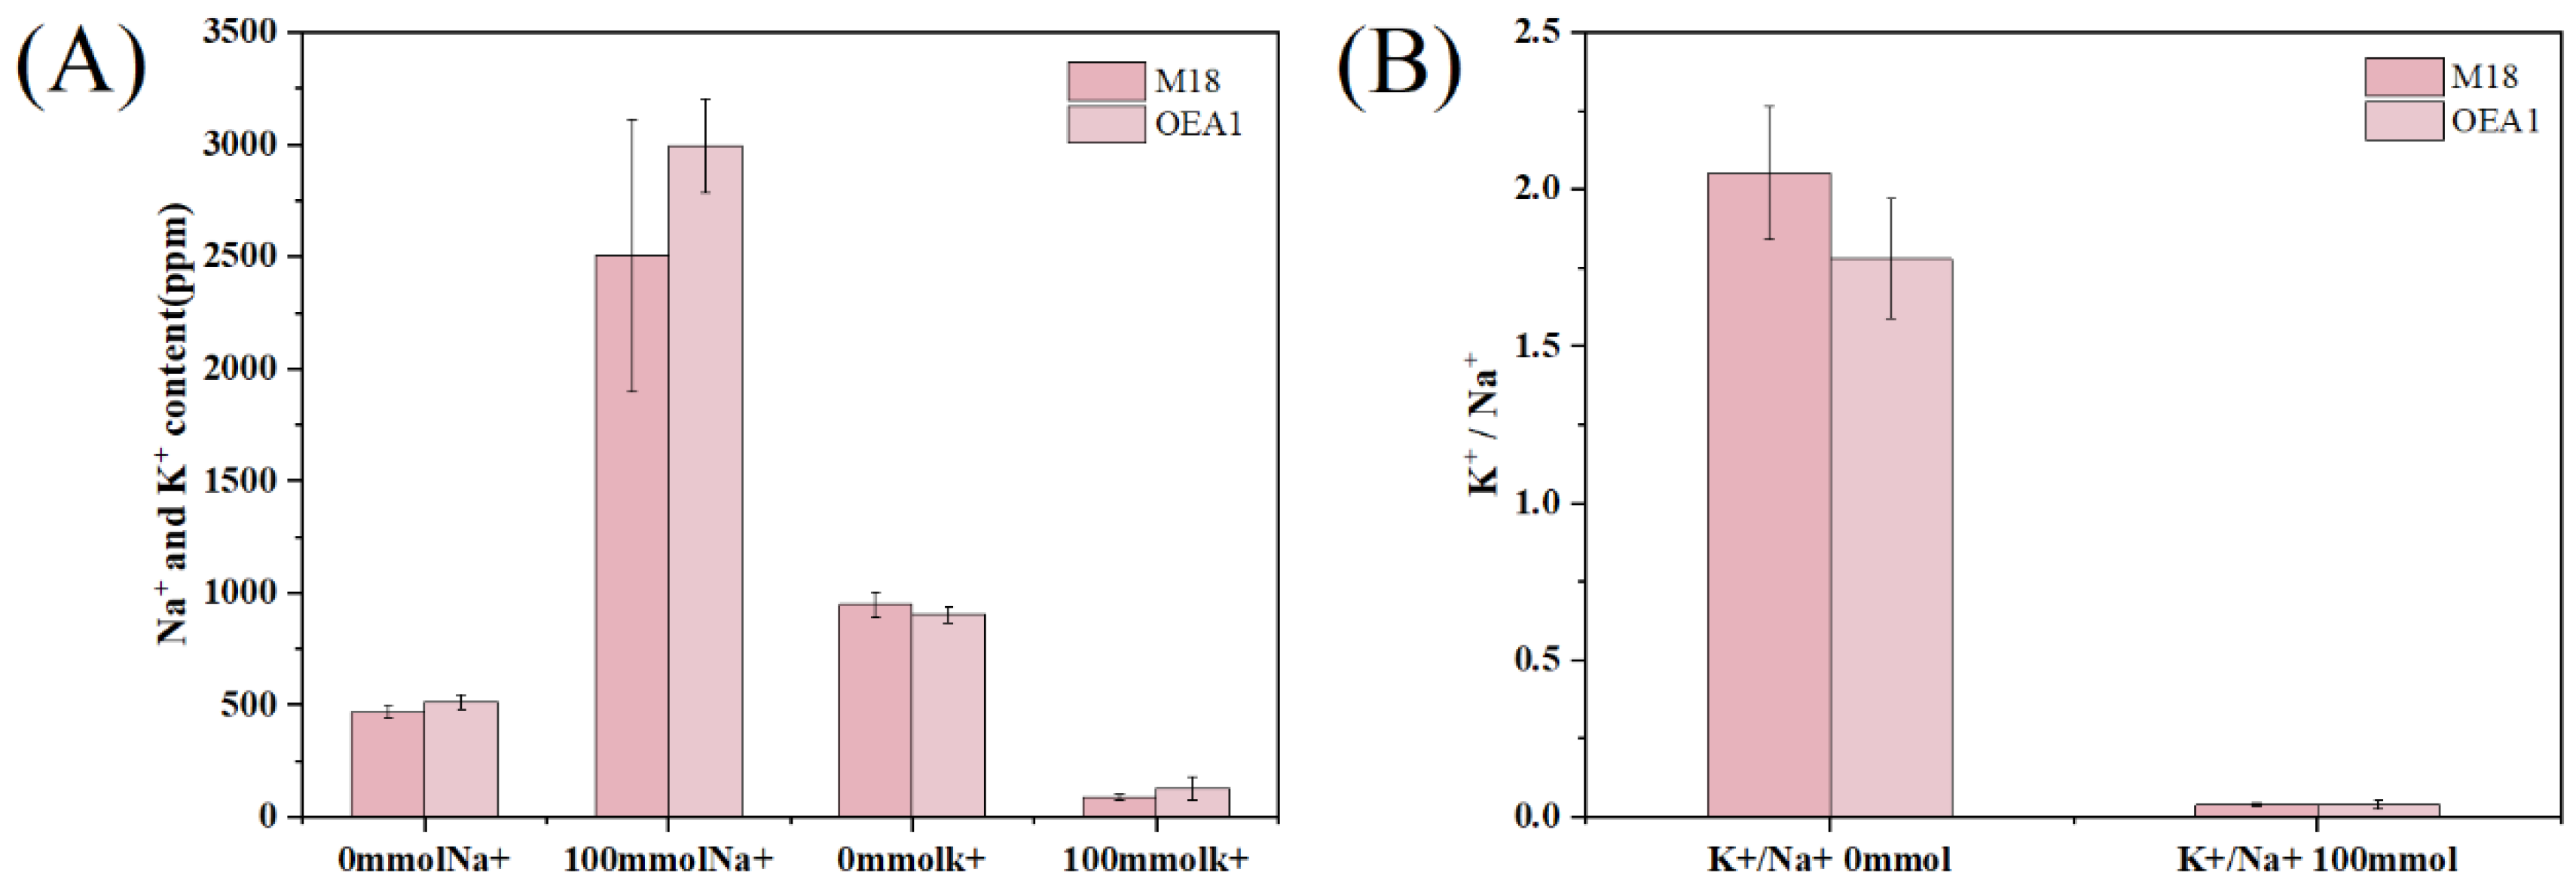
3.7. Na+ and K+ under Different Conditions

As the degree of stress increased, the Na+ content increased, and the K+ content decreased. The Na+ content in the root system of M18 under the unstressed condition was 467.072 ppm, and the K+ content was 947.534 ppm. However, the Na+ content in the root system of OEA1 was 515.078 ppm, which was higher than that of the control group, and the K+ content was 903.929 ppm, which was lower than that of the control group. The Na+ content of the root system of M18 in the treatment of 100 mmol stress was 2504.581 ppm, and the K+ content was 90.247 ppm, while the Na+ content of OEA1 was 2994.706 ppm, which was higher than that of the control, and the K+ content was 129.742 ppm, which was higher than that of the control (Figure 8A). The root system of OEA1 was able to take up more Na+ and had a better phenotype than that of the control M18, which indicates that the overexpression of the GmXTH1 gene improved the tolerance of soybean to stress.
Under normal conditions (0 mmol treatment), the value of K+/Na+ in the root system of the control M18 was 2.053, and that of OEA1 was 1.778, which was lower than that of the control. The 100 mmol stress treatment showed the value of K+/Na+ in the root system of M18 to be 0.038 and that of OEA1 to be 0.041, which were higher than that of the control (Figure 8B). This indicates that ion antagonism increased with an increasing Na+ content under salt stress conditions, but the root system of the GmXTH1-gene-overexpressed strain OEA1 had a higher K+ content compared with that of the control M18, suggesting that the overexpression of the GmXTH1 gene increased the plant’s tolerance to salt stress.

4. Discussion

Plants’ physiological and biochemical indicators adjust in response to various stresses. The physiological and biochemical indices of stress-resistant plants are better than those of non-stress-resistant plants. Research has consistently shown that the overexpression of specific genes in plants can enhance their physiological and biochemical responses to stress, thereby improving their tolerance to adverse conditions such as droughts. Zhang Kaimei et al. [40] found that the leaves of plants overexpressing the PhePLATZ1 gene had a much higher chlorophyll content, CAT activity level and POD activity level under drought stress conditions, while the MDA content was much lower than that of the control plants, indicating that this gene protects the plant from stress-induced oxidative damage and improves plants’ drought tolerance. Li Xiu-fang et al. [41] found that the physiological and biochemical indices (superoxide dismutase, catalase, malondialdehyde and H2O2) of ScDIR-overexpressed lines were superior to those of the wild type, which indicates that specific ScDIRs in sugarcane are involved in drought stress and are beneficial in improving the tolerance of plants to drought stress. Zhu K et al. [42] found that the chlorophyll content of plants overexpressing the SoACLA-1 gene was higher than that of the wild type. The malondialdehyde content was lower than that of the wild type, and the overexpression of SoACLA-1 could enhance the drought tolerance of transgenic sugarcane plants. Liu, W. et al. [43] found that overexpression of the VvWRKY28 gene could reduce the malondialdehyde (MDA) content; increase the chlorophyll content; and increase the superoxide dismutase (SOD), peroxidase (POD) and catalase (CAT) activity levels, which might be involved in the response process of cold and salt stress tolerance in plants. Risky Peachy et al. [44] found that transgenic plants overexpressing GmWRKY172 had lower malondialdehyde (MDA) and higher peroxidase (POD) activity levels than control plants under Cd stress, indicating that the overexpression of the gene enhanced the tolerance of plants to Cd overall. From the above study, it can be seen that high POD activity and CAT activity levels are conducive to the removal of H2O2 in plants, prompting its decomposition into water and oxygen. A high SOD activity level is conducive to reducing the damage to the plant membrane structure and accelerating the removal of hazardous substances; the content of MDA is closely related to the peroxidation of plant membrane lipids, and a reduction in the content of MDA can help to alleviate damage to the membrane. Overall, plants with a high chlorophyll content, SOD activity, POD activity, CAT activity and a low MDA content are more resistant. In this study, under stress conditions, the leaf chlorophyll content and the SOD activity, POD activity and CAT activity levels of plants overexpressing the GmXTH1 gene were higher than those of the control material. The MDA content was lower than that of the control material, indicating that plants overexpressing the GmXTH1 gene are more salt-tolerant, and that the GmXTH1 gene improves the salt tolerance of soybean.
The GmXTH1 gene is involved in the response of plants to salt stress and positively regulates the salt tolerance of plants. Measuring the expression amount and studying the expression pattern of the GmXTH1 gene can better fulfill its salt tolerance function. Other studies have identified key genes that when modulated, can significantly influence a plant’s ability to withstand salt stress. The following research highlights illustrate how specific gene expressions are intricately linked to salt tolerance mechanisms in plants. Li et al. [45] found that the LcSAIN3 gene induced expression via salt stress and showed up-regulated expression under salt stress conditions. The heterologous expression of LcSAIN3 in Arabidopsis thaliana increased the seed germination rate of transgenic plants under salt treatment. Gene expression analysis by Pankaj Kumar Verma et al. [46] showed that the OsGrx_C7 gene was subjected to salt-stress-induced expression, and the silencing of the osgrx_c7 gene resulted in increased sensitivity to salt stress. The osgrx_c7 gene was involved as a positive regulator of salt tolerance in regulating salt tolerance in plants. Ayesha Liaqat et al. [47] found that the expression of AtSPT4-2 was induced by salt stress, and the knockout mutant of AtSPT4-2 showed a salt-sensitive phenotype, while the AtSPT4-2-overexpressed lines showed enhanced salt tolerance, and AtSPT4-2 improves plant salt tolerance mainly by enhancing stress tolerance. Hyun Jin Chun et al. [48] found that the deletion of the Arabidopsis TUB9 gene resulted in the Arabidopsis mutant showing a hypersensitive phenotype to salt stress, and the sustained overexpression of the TUB9 gene in rice transgenic plants enhanced salt stress tolerance. Overall, genes were induced by negative stress to exhibit up- or down-regulated expression, and the deletion and overexpression of genes caused the plants to exhibit sensitive or resistant phenotypes. In this study, the GmXTH1 gene showed up-regulated expression under stress conditions, and plants overexpressing the GmXTH1 gene exhibited a salt-tolerant phenotype, suggesting that the sustained overexpression of the GmXTH1 gene in soybean transgenic plants can improve the salt tolerance of soybean plants. Runming Zhang et al. [49] used qRT-PCR to analyze the expression pattern of the salt tolerance gene CsMAX2 in cucumber roots and leaves after a salt treatment. Under salt stress, CsMAX2 expression in the root system was significantly elevated after 3 and 6 h, and the expression levels in the leaves were significantly down-regulated after 3, 6 and 12 h. The expression level of CsMAX2 in the root system was significantly up-regulated after 3, 6 and 12 h. This is not exactly the same as the finding in the present study that the GmXTH1 gene was significantly up-regulated after 4 h in both the roots and leaves under salt stress conditions. The expression patterns of the two species in the root system were similar, with both of them responding to the early stage of stress and showing up-regulated expression. However, the former was down-regulated, and the latter was up-regulated in the leaves. This difference may be due to the fact that the cucumber CsMAX2 gene belongs to the MAX gene family, while the GmXTH1 gene belongs to the XTH gene family, which has different gene families, protein functions and amino acid sequences, and thus they have different expression patterns under stress conditions.
When plants are subjected to salt stress, the high sodium concentration in the environment disrupts the ionic balance, and the osmotic potential in the plant is too high, leading to water loss and a decrease in the accumulation of potassium, calcium and magnesium ions, which, in turn, affects plant growth and development. Wang Yujie et al. [50] found that the K+ concentration of roots of Xylopia japonica decreased under salt stress, and salt stress led to cell deformation and damage to the epidermal and endothelial mitochondria. Guo Xin et al. [51] found that the Na+ content of the roots, stems and leaves of two asparagus varieties increased under salt stress, and the K+ content showed a decreasing trend, with the salt-tolerant varieties showing a smaller increase in Na+ and a smaller decrease in the K+ content. Du Nanshan et al. [52] found that under salt stress conditions, the morphological indexes of SlNAP1-overexpressed plants were better than those of the wild types. The Na+ content of the leaves and roots decreased, and the K+ content of the leaves, roots and stems increased. SlNAP1 positively regulated salt tolerance in tomato by regulating ion homeostasis. In conclusion, plants with a high K+ content and a better phenotypic performance are more salt-tolerant under salt stress conditions. This is similar to the results of the present study; under stress conditions, the Na+ content was increased, and the K+ content was decreased in the soybean plants. The plants overexpressing the GmXTH1 gene had a greater increase in Na+ than the control material, while the decrease in K+ content was smaller than that of the control group. Additionally, they had a better phenotypic performance than the control group, which suggests that plants overexpressing the GmXTH1 gene are more tolerant to high concentrations of Na+, and that the overexpression of the GmXTH1 gene improved the tolerance of plants to salt stress. Zhang Ling et al. [53] found that the K+/Na+ ratio of plants under stress was significantly lower than the K+/Na+ ratio of plants under stress-free conditions, and that the addition of potassium significantly reduced the accumulation of Na+ in the plants and improved the salt tolerance of the plants. Wei Long et al. [54] showed that improving the ionic homeostasis of K+/Na+ in plants enhanced the salt tolerance of rice, thus reducing the degree of salt stress in rice. In conclusion, plants with a high K+/Na+ ratio are more salt-tolerant. In this study, the K+/Na+ ratio of plants overexpressing the GmXTH1 gene (OEA1) was higher than that of the control group under salt stress, indicating that the overexpression of the GmXTH1 gene increased the K+/Na+ ratio, regulated the Na+ and K+ ionic balance, and improved the salt tolerance of the plants.
The root system is the main determinant of water and nutrient uptake in plants [55], which directly affects plant growth and development. In addition to this, root function is involved in a variety of processes, such as the storage of photosynthetic products and plant stress tolerance [56]. Plant root systems are highly plastic and can be altered to respond to abiotic stresses by changing the root growth phenotypes and traits [57], and plants with better root growth and development are more resistant to negative stresses. Plant growth hormones [58] and the expression of related genes [59] play key roles in root growth and development, and by altering the expression of related genes, it is possible to influence root growth and development, and thus plant resistance. In their study, Xu Juanjuan et al. [60] showed that the heterologous expression of MirMAN promotes root growth mainly by elongating the primary root and increasing the density of lateral roots, which improves plants’ salt tolerance. In this study, plants overexpressing the GmXTH1 gene showed better root growth phenotypes and a larger a total root length, root surface area and root volume than the control group under salt stress conditions, indicating that overexpression of the GmXTH1 gene promoted root growth of the plants, which, in turn, improved their tolerance to salt stress.

5. Conclusions

In this study, we discussed the important role of the GmXTH1 gene in soybean salt stress resistance. The results showed that the expression level of the GmXTH1 gene increased significantly under salt stress, indicating that it may play a key role in coping with salt stress. The overexpression of the GmXTH1 gene can significantly improve the salt tolerance of soybean and make soybean show better physiological and biochemical indexes, such as the SOD content and the POD content. At the same time, the GmXTH1 gene may improve the adaptability of soybean to salt by regulating the construction of cell wall and enhancing the growth of root system. To sum up, the GmXTH1 gene plays an important role in soybean resistance to salt stress, which provides an important basis for improving the salt tolerance of soybean in the future.

Author Contributions

Conceptualization; writing—review and editing, Y.S. Investigation; writing—original draft, K.W. Formal analysis, D.Y. Resources, Q.Z. Investigation, B.Y. Funding acquisition, P.W. All authors have read and agreed to the published version of the manuscript.

Funding

This research was funded by the Science and Technology Research Project of the Education Department of Jilin Province; grant number 1629091220546.

Data Availability Statement

The original contributions presented in this study are included in the article material; further inquiries can be directed to the corresponding author.

Conflicts of Interest

The authors declare no conflicts of interest.

References

  1. Pu, Y.; Yan, R.; Jia, D.; Che, Z.; Yang, R.; Yang, C.; Wang, H.; Cheng, H.; Yu, D. Identification of soybean mosaic virus strain SC7 resistance loci and candidate genes in soybean [Glycine max (L.) Merr.]. Mol. Genet. Genom. MGG 2024, 299, 54. [Google Scholar] [CrossRef] [PubMed]
  2. Available online: https://cj.sina.com.cn/articles/view/7829375716/1d2aacae4001017boz?subch=futures (accessed on 8 September 2023).
  3. Available online: http://www.news.cn/fortune/2023-07/04/c_1129730839.htm (accessed on 4 July 2023).
  4. Omar, M.M.; Shitindi, M.J.; Massawe, B.J.; Fue, K.G.; Meliyo, J.L.; Pedersen, O. Salt-affected soils in Tanzanian agricultural lands: Type of soils and extent of the problem. Sustain. Environ. 2023, 9, 2205731. [Google Scholar] [CrossRef]
  5. Li, S.; Yang, G.; Chang, C.; Wang, H.; Zhang, H.; Zhang, N.; Peng, Z.; Song, Y. Remote Sensing Inversion of Salinization Degree Distribution and Analysis of Its Influencing Factors in an Arid Irrigated District. Land 2024, 13, 422. [Google Scholar] [CrossRef]
  6. Rossi, M.; Borromeo, I.; Capo, C.; Glick, B.R.; Del Gallo, M.; Pietrini, F.; Forni, C. PGPB improve photosynthetic activity and tolerance to oxidative stress in Brassica napus grown on salinized soils. Appl. Sci. 2021, 11, 11442. [Google Scholar] [CrossRef]
  7. Liao, X.; Shi, M.; Zhang, W.; Ye, Q.; Li, Y.; Feng, X.; Bhat, J.A.; Kan, G.; Yu, D. Association analysis of GmMAPKs and functional characterization of GmMMK1 to salt stress response in soybean. Physiol. Plant. 2021, 173, 2026–2040. [Google Scholar] [CrossRef]
  8. Rai, G.K.; Mishra, S.; Chouhan, R.; Mushtaq, M.; Chowdhary, A.A.; Rai, P.K.; Kumar, R.R.; Kumar, P.; Perez-Alfocea, F.; Colla, G.; et al. Plant salinity stress, sensing, and its mitigation through WRKY. Front. Plant Sci. 2023, 14, 1238507. [Google Scholar] [CrossRef]
  9. Yang, J.; Yao, R.; Wang, X.; Xie, W.; Zhang, X.; Zhu, W.; Zhang, L.; Sun, R. Research on saline soils in China: History, current status and prospects. Soil J. 2022, 59, 10–27. [Google Scholar]
  10. Available online: https://www.ecsf.ac.cn/info/1133/3547.htm (accessed on 4 July 2023).
  11. De Caroli, M.; Manno, E.; Piro, G.; Lenucci, M.S. Ride to cell wall: Arabidopsis XTH11, XTH29 and XTH33 exhibit different secretion pathways and responses to heat and drought stress. Plant J. Cell Mol. Biol. 2021, 107, 448–466. [Google Scholar] [CrossRef]
  12. Han, J.; Liu, Y.; Shen, Y.; Li, W. A surprising diversity of xyloglucan Endotransglucosylase/Hydrolase in wheat: New in sight to the roles in drought tolerance. Int. J. Mol. Sci. 2023, 24, 9886. [Google Scholar] [CrossRef]
  13. Zhang, Y.; Zhang, H.Z.; Fu, J.Y.; Du, Y.Y.; Qu, J.; Song, Y.; Wang, P.W. The GmXTH1 gene improves drought stress resistance of soybean seedlings. Mol. Breed. New Strateg. Plant Improv. 2021, 42, 3. [Google Scholar] [CrossRef]
  14. Cheng, Z.; Zhang, X.; Yao, W.; Gao, Y.; Zhao, K.; Guo, Q.; Zhou, B.; Jiang, T. Genome-wide identification and expression analysis of the xyloglucan endotransglucosylase/hydrolase gene family in poplar. BMC Genom. 2021, 22, 804. [Google Scholar] [CrossRef] [PubMed]
  15. Yan, J.; Huang, Y.; He, H.; Han, T.; Di, P.; Sechet, J.; Fang, L.; Liang, Y.; Scheller, H.V.; Mortimer, J.C.; et al. Xyloglucan endotransglucosylase-hydrolase30 negatively affects salt tolerance in Arabidopsis. J. Exp. Bot. 2019, 70, 5495–5506. [Google Scholar] [CrossRef] [PubMed]
  16. Qiao, T.; Zhang, L.; Yu, Y.; Pang, Y.; Tang, X.; Wang, X.; Li, L.; Li, B.; Sun, Q. Identification and expression analysis of xyloglucan endotransglucosylase/hydrolase (XTH) family in grapevine (Vitis vinifera L.). Peer J. 2022, 10, e13546. [Google Scholar] [CrossRef]
  17. Ma, Y.; Jie, H.; Zhao, L.; He, P.; Lv, X.; Xu, Y.; Zhang, Y.; Xing, H.; Jie, Y. BnXTH1 regulates cadmium tolerance by modulating vacuolar compartmentalization and the cadmium binding capacity of cell walls in ramie (Boehmeria nivea). J. Hazard. Mater. 2024, 470, 134172. [Google Scholar] [CrossRef]
  18. Danso, B.; Ackah, M.; Jin, X.; Ayittey, D.M.; Amoako, F.K.; Zhao, W. Genome-Wide Analysis of the Xyloglucan Endotransglucosylase/Hydrolase (XTH) Gene Family: Expression Pattern during Magnesium Stress Treatment in the Mulberry Plant (Morus alba L.) Leaves. Plants 2024, 13, 902. [Google Scholar] [CrossRef] [PubMed]
  19. Chen, J.; Wan, H.; Zhao, H.; Dai, X.; Wu, W.; Liu, J.; Xu, J.; Yang, R.; Xu, B.; Zeng, C.; et al. Identification and expression analysis of the Xyloglucan transglycosylase/hydrolase (XTH) gene family under abiotic stress in oilseed (Brassica napus L.). BMC Plant Biol. 2024, 24, 400. [Google Scholar] [CrossRef]
  20. Zhang, Q.; Zhang, A.; Yang, L.; Wei, J.; Bei, J.; Xu, Z.; Wang, X.; Chen, B. Identification of XTH Family Genes and Expression Analysis of Endosperm Weakening in Lettuce (Lactuca sativa L.). Agronomy 2024, 14, 324. [Google Scholar] [CrossRef]
  21. Takahashi, D.; Johnson, K.L.; Hao, P.; Tuong, T.; Erban, A.; Sampathkumar, A.; Bacic, A.; Livingston, D.P.; Kopka, J., 3rd; Kuroha, T.; et al. Cell wall modification by the xyloglucan endotransglucosylase/hydrolase XTH19 influences freezing tolerance after cold and sub-zero acclimation. Plant Cell Environ. 2021, 44, 915–930. [Google Scholar] [CrossRef]
  22. Fu, C.; Han, C.; Wei, Y.; Liu, D.; Han, Y. Two NAC transcription factors regulated fruit softening through activating xyloglucan endotransglucosylase/hydrolase genes during kiwifruit ripening. Int. J. Biol. Macromol. 2024, 263 Pt 1, 130678. [Google Scholar] [CrossRef]
  23. Zhai, Z.; Feng, C.; Wang, Y.; Sun, Y.; Peng, X.; Xiao, Y.; Zhang, X.; Zhou, X.; Jiao, J.; Wang, W.; et al. Genome-Wide Identification of the Xyloglucan endotransglucosylase/Hydrolase (XTH) and Polygalacturonase (PG) Genes and Characterization of Their Role in Fruit Softening of Sweet Cherry. Int. J. Mol. Sci. 2021, 22, 12331. [Google Scholar] [CrossRef]
  24. Li, X.; Su, Q.; Feng, Y.; Gao, X.; Wang, B.; Tahir, M.M.; Yang, H.; Zhao, Z. Identification and analysis of the xyloglucan endotransferase/hydrolase (XTH) family genes in apple. Sci. Hortic. 2023, 315, 111990. [Google Scholar] [CrossRef]
  25. Atkinson, R.G.; Johnston, S.L.; Yauk, Y.K.; Sharma, N.N.; Schröder, R. Analysis of xyloglucan endotransglucosylase/hydrolase (XTH) gene families in kiwifruit and apple. Postharvest Biol. Technol. 2009, 51, 149–157. [Google Scholar] [CrossRef]
  26. Pitaksaringkarn, W.; Matsuoka, K.; Asahina, M.; Miura, K.; Sage-Ono, K.; Ono, M.; Yokoyama, R.; Nishitani, K.; Ishii, T.; Iwai, H.; et al. XTH20 and XTH19 regulated by ANAC071 under auxin flow are involved in cell proliferation in incised Arabidopsis inflorescence stems. Plant J. Cell Mol. Biol. 2014, 80, 604–614. [Google Scholar] [CrossRef]
  27. Malinowski, R.; Fry, S.C.; Zuzga, S.; Wiśniewska, A.; Godlewski, M.; Noyszewski, A.; Barczak-Brzyżek, A.; Malepszy, S.; Filipecki, M. Developmental expression of the cucumber Cs-XTH1 and Cs-XTH3 genes, encoding xyloglucan endotransglucosylase/hydrolases, can be influenced by mechanical stimuli. Acta Physiol. Plant 2018, 40, 130. [Google Scholar] [CrossRef]
  28. Kushwah, S.; Banasiak, A.; Nishikubo, N.; Derba-Maceluch, M.; Majda, M.; Endo, S.; Kumar, V.; Gomez, L.; Gorzsas, A.; McQueen-Mason, S.; et al. Arabidopsis XTH4 and XTH9 Contribute to Wood Cell Expansion and Secondary Wall Formation. Plant Physiol. 2020, 182, 1946–1965. [Google Scholar] [CrossRef] [PubMed]
  29. Cao, J.; Lv, Y.; Li, X. Interspaced Repeat Sequences Confer the Regulatory Functions of AtXTH10, Important for Root Growth in Arabidopsis. Plants 2019, 8, 130. [Google Scholar] [CrossRef]
  30. Xu, P.; Fang, S.; Chen, H.; Cai, W. The brassinosteroid-responsive xyloglucan endotransglucosylase/hydrolase 19 (XTH19) and XTH23 genes are involved in lateral root development under salt stress in Arabidopsis. Plant J. Cell Mol. Biol. 2020, 104, 59–75. [Google Scholar] [CrossRef]
  31. Zhang, J.Z.; He, P.W.; Xu, X.M.; Lü, Z.F.; Cui, P.; George, M.S.; Lu, G.Q. Genome-Wide Identification and Expression Analysis of the Xyloglucan Endotransglucosylase/Hydrolase Gene Family in Sweet Potato [Ipomoea batatas (L.) Lam]. Int. J. Mol. Sci. 2023, 24, 775. [Google Scholar] [CrossRef]
  32. Niraula, P.M.; Lawrence, K.S.; Klink, V.P. The heterologous expression of a soybean (Glycine max) xyloglucan endotransglycosylase/hydrolase (XTH) in cotton (Gossypium hirsutum) suppresses parasitism by the root knot nematode Meloidogyne incognita. PLoS ONE 2020, 15, e0235344. [Google Scholar] [CrossRef]
  33. Bouslama, M.; Schapaugh, W.T., Jr. Stress tolerance in soybeans. I. Evaluation of three screening techniques for heat and drought tolerance 1. Crop Sci. 1984, 24, 933–937. [Google Scholar] [CrossRef]
  34. Livak, K.J.; Schmittgen, T.D. Analysis of relative gene expression data using real-time quantitative PCR and the 2(-Delta Delta C(T)) Method. Methods 2001, 25, 402–408. [Google Scholar] [CrossRef] [PubMed]
  35. Jiménez, A.; Correa, S.; Sevilla, F. Identification of Superoxide Dismutase (SOD) Isozymes in Plant Tissues. Methods Mol. Biol. 2024, 2798, 205–212. [Google Scholar] [PubMed]
  36. Freitas, C.D.T.; Costa, J.H.; Germano, T.A.; de Rocha, R.O.; Ramos, M.V.; Bezerra, L.P. Class III plant peroxidases: From classification to physiological functions. Int. J. Biol. Macromol. 2024, 263 Pt 1, 130306. [Google Scholar] [CrossRef]
  37. González-Gordo, S.; Rodríguez-Ruiz, M.; Palma, J.M.; Corpas, F.J. Comparative Analysis of Catalase Activity in Plants: Spectrophotometry and Native PAGE Approaches. Methods Mol. Biol. 2024, 2798, 213–221. [Google Scholar]
  38. Zhou, L.; Zhou, L.; Wu, H.; Jing, T.; Li, T.; Li, J.; Kong, L.; Zhu, F. Application of Chlorophyll Fluorescence Analysis Technique in Studying the Response of Lettuce (Lactuca sativa L.) to Cadmium Stress. Sensors 2024, 24, 1501. [Google Scholar] [CrossRef] [PubMed]
  39. Morales, M.; Munné-Bosch, S. Malondialdehyde Assays in Higher Plants. Methods Mol. Biol. 2024, 2798, 79–100. [Google Scholar]
  40. Zhang, K.; Lan, Y.; Wu, M.; Wang, L.; Liu, H.; Xiang, Y. PhePLATZ1, a PLATZ transcription factor in moso bamboo (Phyllostachys edulis), improves drought resistance of transgenic Arabidopsis thaliana. Plant Physiol. Biochem. PPB 2022, 186, 121–134. [Google Scholar] [CrossRef]
  41. Li, X.; Liu, Z.; Zhao, H.; Deng, X.; Su, Y.; Li, R.; Chen, B. Overexpression of Sugarcane ScDIR Genes Enhances Drought Tolerance in Nicotiana benthamiana. Int. J. Mol. Sci. 2022, 23, 5340. [Google Scholar] [CrossRef]
  42. Zhu, K.; Huang, C.; Phan, T.T.; Yang, L.T.; Zhang, B.Q.; Xing, Y.X.; Li, Y.R. Overexpression of SoACLA-1 gene confers drought tolerance improvement in sugarcane. Plant Mol. Biol. Report. 2021, 39, 489–500. [Google Scholar] [CrossRef]
  43. Liu, W.; Liang, X.; Cai, W.; Wang, H.; Liu, X.; Cheng, L.; Song, P.; Luo, G.; Han, D. Isolation and Functional Analysis of VvWRKY28, a Vitis vinifera WRKY Transcription Factor Gene, with Functions in Tolerance to Cold and Salt Stress in Transgenic Arabidopsis thaliana. Int. J. Mol. Sci. 2022, 23, 13418. [Google Scholar] [CrossRef]
  44. Xian, P.; Yang, Y.; Xiong, C.; Guo, Z.; Alam, I.; He, Z.; Zhang, Y.; Cai, Z.; Nian, H. Overexpression of GmWRKY172 enhances cadmium tolerance in plants and reduces cadmium accumulation in soybean seeds. Front. Plant Sci. 2023, 14, 1133892. [Google Scholar] [CrossRef] [PubMed]
  45. Li, X.; Yang, W.; Jia, J.; Zhao, P.; Qi, D.; Chen, S.; Cheng, L.; Cheng, L.; Liu, G. Ectopic Expression of a Salt-Inducible Gene, LcSAIN3, from Sheepgrass Improves Seed Germination and Seedling Growth under Salt Stress in Arabidopsis. Genes 2021, 12, 1994. [Google Scholar] [CrossRef] [PubMed]
  46. Verma, P.K.; Verma, S.; Tripathi, R.D.; Pandey, N.; Chakrabarty, D. CC-type glutaredoxin, OsGrx_C7 plays a crucial role in enhancing protection against salt stress in rice. J. Biotechnol. 2021, 329, 192–203. [Google Scholar] [CrossRef] [PubMed]
  47. Liaqat, A.; Alfatih, A.; Jan, S.U.; Sun, L.; Zhao, P.; Xiang, C. Transcription elongation factor AtSPT4-2 positively modulates salt tolerance in Arabidopsis thaliana. BMC Plant Biol. 2023, 23, 49. [Google Scholar] [CrossRef]
  48. Chun, H.J.; Baek, D.; Jin, B.J.; Cho, H.M.; Park, M.S.; Lee, S.H.; Lim, L.H.; Cha, Y.J.; Bae, D.W.; Kim, S.T.; et al. Microtubule Dynamics Plays a Vital Role in Plant Adaptation and Tolerance to Salt Stress. Int. J. Mol. Sci. 2021, 22, 5957. [Google Scholar] [CrossRef]
  49. Zhang, R.; Dong, Y.; Li, Y.; Ren, G.; Chen, C.; Jin, X. SLs signal transduction gene CsMAX2 of cucumber positively regulated to salt, drought and ABA stress in Arabidopsis thaliana L. Gene 2023, 864, 147282. [Google Scholar] [CrossRef] [PubMed]
  50. Wang, Y.; Zhang, J.; Qiu, Z.; Zeng, B.; Zhang, Y.; Wang, X.; Chen, J.; Zhong, C.; Deng, R.; Fan, C. Transcriptome and structure analysis in root of Casuarina equisetifolia under NaCl treatment. PeerJ 2021, 9, e12133. [Google Scholar] [CrossRef]
  51. Guo, X.; Ahmad, N.; Zhao, S.; Zhao, C.; Zhong, W.; Wang, X.; Li, G. Effect of Salt Stress on Growth and Physiological Properties of Asparagus Seedlings. Plants 2022, 11, 2836. [Google Scholar] [CrossRef]
  52. Du, N.; Xue, L.; Xue, D.; Dong, X.; Yang, Q.; Shah Jahan, M.; Guo, H.; Fu, R.; Wang, Y.; Piao, F. The transcription factor SlNAP1 increases salt tolerance by modulating ion homeostasis and ROS metabolism in Solanum lycopersicum. Gene 2023, 849, 146906. [Google Scholar] [CrossRef]
  53. Zhang, L.; Jiang, Q.; Zong, J.; Guo, H.; Liu, J.; Chen, J. Effects of Supplemental Potassium on the Growth, Photosynthetic Characteristics, and Ion Content of Zoysia matrella under Salt Stress. Horticulturae 2023, 10, 31. [Google Scholar] [CrossRef]
  54. Wei, L.; Zhao, H.; Wang, B.; Wu, X.; Lan, R.; Huang, X.; Chen, B.; Chen, G.; Jiang, C.; Wang, J.; et al. Exogenous melatonin improves the growth of rice seedlings by regulating redox balance and ion homeostasis under salt stress. J. Plant Growth Regul. 2022, 41, 2108–2121. [Google Scholar] [CrossRef]
  55. Hu, F.; Fang, D.; Zhang, W.; Dong, K.; Ye, Z.; Cao, J. Lateral root primordium: Formation, influencing factors and regulation. Plant Physiol. Biochem. PPB 2024, 207, 108429. [Google Scholar] [CrossRef] [PubMed]
  56. Xie, X.; Wang, Y.; Datla, R.; Ren, M. Auxin and Target of Rapamycin Spatiotemporally Regulate Root Organogenesis. Int. J. Mol. Sci. 2021, 22, 11357. [Google Scholar] [CrossRef]
  57. García-González, J.; Lacek, J.; Retzer, K. Dissecting Hierarchies between Light, Sugar and Auxin Action Underpinning Root and Root Hair Growth. Plants 2021, 10, 111. [Google Scholar] [CrossRef] [PubMed]
  58. Ding, T.; Zhang, F.; Wang, J.; Wang, F.; Liu, J.; Xie, C.; Hu, Y.; Shani, E.; Kong, X.; Ding, Z.; et al. Cell-type action specificity of auxin on Arabidopsis root growth. Plant J. Cell Mol. Biol. 2021, 106, 928–941. [Google Scholar] [CrossRef] [PubMed]
  59. Lin, Q.; Gong, J.; Zhang, Z.; Meng, Z.; Wang, J.; Wang, S.; Sun, J.; Gu, X.; Jin, Y.; Wu, T.; et al. The Arabidopsis thaliana trehalose-6-phosphate phosphatase gene AtTPPI regulates primary root growth and lateral root elongation. Front. Plant Sci. 2023, 13, 1088278. [Google Scholar] [CrossRef]
  60. Xu, J.; Yang, C.; Ji, S.; Ma, H.; Lin, J.; Li, H.; Chen, S.; Xu, H.; Zhong, M. Heterologous expression of MirMAN enhances root development and salt tolerance in Arabidopsis. Front. Plant Sci. 2023, 14, 1118548. [Google Scholar] [CrossRef]
Figure 1. Germination phenotype of each material under different treatment conditions.
Agronomy 14 02276 g001
Figure 2. Seedling phenotypes of each material under different treatment conditions.
Agronomy 14 02276 g002
Figure 3. The physiological and biochemical indexes of the seedling leaves of each strain. (A) shows the SOD activity of each strain under the different treatment conditions. (B) shows the POD activity of each strain under the different treatment conditions. (C) shows the CAT activity of each strain under the different treatment conditions. (D) shows the MDA content of each strain under the different treatment conditions.
Agronomy 14 02276 g003
Figure 4. The chlorophyll content of each strain under the different treatment conditions. (A) shows the chlorophyll a content of each strain in the different treatments. (B) shows the chlorophyll b content of each strain in the different treatments. (C) shows the total chlorophyll content of each strain in the different treatments.
Agronomy 14 02276 g004
Figure 5. Root growth of each strain at V2 stage.
Agronomy 14 02276 g005
Figure 6. The measurement of the root indexes of each strain at the V2 stage. (A) shows the total root length of each strain for the different treatment conditions. (B) shows the root volume of each strain in the different treatment conditions. (C) shows the root surface area of each strain in the different treatment conditions. (D) shows the mean root diameter of each strain in the different treatment conditions.
Agronomy 14 02276 g006
Figure 7. Relative expression of GmXTH1 gene in roots and leaves of OEA1 over time.
Agronomy 14 02276 g007
Figure 8. (A) shows the Na+ and K+ contents under the different treatment conditions. (B) shows the ratio of K+/Na+.
Agronomy 14 02276 g008
Table 1. XTH genes with different functions and applications.
Functionality Name of MaterialSourceApplianceReferences
Plant resistanceDrought stressXTH11, XTH29 and XTH33ArabidopsisParticipation in the response of Arabidopsis thaliana to drought stress[11]
TaXTH12.5aWheatRegulation of wheat response to drought stress[12]
GmXTH1SoybeanEnhancing drought tolerance in soybean[13]
Salt stressPtrXTHPoplar Important role in salt stress response[14]
XTH30ArabidopsisReduced tolerance to salt stress[15]
VvXTHsVitis vinifera L.Involved in response to salt stress[16]
Metal ion stressBnXTH1Boehmeria niveaInvolved in mediating cadmium tolerance in plants[17]
MaXTHMorus alba L.Possible involvement in plant response to magnesium stress[18]
BnXTHsBrassica napus L. Involved in response to aluminum stress[19]
Heat stressLsXTH43Lactuca sativa L.Promotion of seed germination under high-temperature conditions[20]
Cold stressXTH19ArabidopsisImproving cold tolerance in Arabidopsis thaliana[21]
Fruit softeningAcXTH1 and AcXTH2 KiwifruitRegulation of fruit ripening and softening[22]
PavXTHsSweet CherryReduces fruit firmness[23]
MdXTH3, MdXTH25 and MdXTH26AppleInvolved in regulation fruit softening[24]
Ad-XTH7KiwifruitParticipate in fruit softening[25]
Growth and developmentXTH20ArabidopsisDamaged repair of inflorescence stems in Arabidopsis thaliana[26]
Cs-XTH1 and Cs-XTH3 CucumbersPromotes root elongation[27]
AtXTH4 and AtXTH9 ArabidopsisInvolved in xylem cell production and regulates secondary wall thickening[28]
AtXTH10ArabidopsisPromotes root growth[29]
XTH19 and XTH23 ArabidopsisPromotes root growth in Arabidopsis thaliana[30]
IbXTHsSweet PotatoCritical for root specificity[31]
Table 2. Primers for qRT-PCR internal reference gene and target gene.
Name of PrimerSequence Information (5′→3′)
β-actin-FCGGTGGTTCTATCTTGGCATC
β-actin-RGTCTTTCGCTTCAATAACCCTA
GmXTH1-FAGGCAAGGGTGATAGAGAGCAAAG
GmXTH1-RCCTCGTCCACAAAGAACACAATCTG
Table 3. Germination period indexes of each material under different treatment conditions.
Processing GroupMaterialGermination RateGermination PotentialGermination Index
0 mmolM181.00 ± 0.000.60 ± 0.1025.24 ± 0.64
OEA11.00 ± 0.000.73 ± 0.0729.41 ± 1.46
OEA21.00 ± 0.000.63 ± 0.0826.52 ± 1.12
OEA30.98 ± 0.020.58 ± 0.0626.04 ± 1.00
IEA20.98 ± 0.020.65 ± 0.0827.68 ± 2.03
100 mmolM180.60 ± 0.030.07 ± 0.025.41 ± 0.52
OEA10.83 ± 0.03 **0.23 ± 0.02 **11.49 ± 0.67 **
OEA20.78 ± 0.03 **0.18 ± 0.02 **10.30 ± 0.37 **
OEA30.82 ± 0.03 **0.15 ± 0.00 **9.11 ± 0.50 **
IEA20.42 ± 0.03 **0.02 ± 0.02 *3.31 ± 0.06 **
150 mmolM180.43 ± 0.030.00 ± 0.003.38 ± 0.49
OEA10.65 ± 0.03 **0.03 ± 0.026.26 ± 0.04 **
OEA20.53 ± 0.02 *0.02 ± 0.024.75 ± 0.06 **
OEA30.57 ± 0.02 **0.03 ± 0.025.53 ± 0.15 **
IEA20.35 ± 0.03 *0.00 ± 0.002.58 ± 0.12 *
Disclaimer/Publisher’s Note: The statements, opinions and data contained in all publications are solely those of the individual author(s) and contributor(s) and not of MDPI and/or the editor(s). MDPI and/or the editor(s) disclaim responsibility for any injury to people or property resulting from any ideas, methods, instructions or products referred to in the content.

