Abstract
Vegetation is an important component of an ecosystem, fulfilling various ecological functions in areas such as soil and water conservation, climate regulation, and water source maintenance. This study focuses on the Yongding River Basin as a research area. This study used vegetation indices with long time series as a data source in combination with Landsat land use data. This study applied linear trend estimation to analyze the interannual variation trend in vegetation greenness from 2002 to 2022 in the Yongding River Basin and quantitatively analyzed the impact of land use changes on vegetation greenness. The results show that, from 2002 to 2022, the vegetation greenness in the Yongding River Basin has shown an overall increasing trend. The average growth season and the maximum annual normalized difference vegetation index (NDVI) growth rates were 0.006/10a and 0.008/10a, respectively, and the area of increased vegetation greenness accounted for 90% of the total area. During the main growth season (April to October) in the Yongding River Basin, the NDVI generally showed a spatial pattern of being higher in mountainous areas and lower in water areas, with the largest coefficient of variation in vegetation in the river water areas, and the most stable vegetation in forest land. In terms of the changes in vegetation greenness, the contribution rate of arable land was between 36.73% and 38.63%, followed by grassland and forest land, with contribution rates of 26.86% to 27.11% and 23.94% to 26.43%, respectively. The total contribution rate of water areas, construction land, and unused land was around 10.18%. This study can provide a theoretical basis for environmental protection and rational land use in the Yongding River Basin.
1. Introduction
Vegetation is an important and foundational component of terrestrial ecosystems. It plays a crucial role in ecosystems, and in human production and life, by regulating the exchange of water, carbon, and energy between the land and the atmosphere [1,2,3]. In recent years, due to global climate change, rising atmospheric CO2 concentration, and increasing human activities, ground vegetation ecosystems have experienced unprecedented damage [4,5,6]. Therefore, dynamic changes to vegetation cover and its response to the environment have become research hotspots in ecology and other fields. By studying continuous changes in vegetation and exploring the factors that affect vegetation, we can reflect the trends in and reasons for environmental evolution, which is of great significance for ecological evaluation, ecological security, and sustainable economic development [7,8,9].
The normalized difference vegetation index (NDVI) is used to indicate vegetation greenness, typically referring to the properties of solar radiation absorbed and reflected by the vegetation surface [10,11]. NDVI is widely recognized as an effective indicator of large-scale surface vegetation coverage and growth conditions. It is closely associated with photosynthetically active radiation, green leaf density, vegetation productivity, and cumulative biomass, and it is commonly used to characterize the intensity of vegetation activity [12]. Existing research primarily focuses on patterns of vegetation greenness across regions and large scales, on how vegetation responds to climate factors, and on the contributions of climate change and human activities to changes in vegetation [13,14,15]. For instance, Li et al. [16] discovered that vegetation greenness in southern China has predominantly been on the rise, with areas of consistent change concentrated in the Pearl River Delta, western Guangdong, and eastern Guangdong; land use accounted for 79.4% of the total change, thus representing the primary factor influencing the spatial variation of NDVI in southern China. Research by Tian and Luo noted an increase in the annual variability of vegetation greenness in hot and arid regions. Wang et al. [17] reported that the intensity of the association between vegetation and temperature in China has been declining over the past 34 years, with temperature’s influence on NDVI diminishing, and a similar decline in the control exerted by moisture conditions on NDVI. In summary, over the past two decades, the combination of climate change and human activities has led to a notable intensification of global vegetation activities, a phenomenon commonly referred to as the “greening” of our planet [18,19,20]. This trend is significantly altering the terrestrial water cycle and impacting regional water security.
The Yongding River is not only a key river within the “Six Rivers and Five Lakes” system of the Beijing–Tianjin–Hebei region but also serves as a vital water conservation area, ecological security barrier, and ecological corridor [21]. In recent years, the combined impacts of climate change and human activities have led to ecological issues in the Yongding River Basin, including disrupted river flow, diminished vegetation cover, and reduced biodiversity. Since March 2019, the Yongding River has undergone experimental ecological water replenishment, successfully restoring full river connectivity. Numerous studies have addressed the ecological challenges in the Yongding River Basin, including analyses of factors influencing water level dynamics, the carrying capacity of vegetation restoration, and plant diversity [22,23]. However, research into how vegetation greenness in the Yongding Basin responds to changes in land use has been relatively scarce. Previous studies have found that MODIS (moderate-resolution imaging spectroradiometer) sensors can track changes in vegetation cover and biomass by providing continuous, high spatiotemporal resolution data, enabling analysis of the health and productivity of ecosystems [24,25,26]. However, MODIS data also present some challenges and gaps in monitoring vegetation dynamics. Cloud cover is one of the main limiting factors for the application of MODIS data, especially in cloudy and rainy areas, which may affect the continuity and quality of the data [27,28,29]. This study focuses on the Yongding River Basin, a critical water conservation region within the Beijing–Tianjin–Hebei area. Utilizing NDVI data, this research examined the spatiotemporal shifts in NDVI within the Yongding Basin, and the maximum value synthesis method was applied to mitigate the effects of clouds and aerosols. Combined with land use data from the years 2002, 2007, 2012, 2017, and 2022, this study elucidates the mechanisms driving changes in vegetation greenness in response to land use changes across different periods. This research aims to offer theoretical and practical support for ecological development and policymaking within the basin.
2. Materials and Methods
2.1. Physical Setting of the Study Area
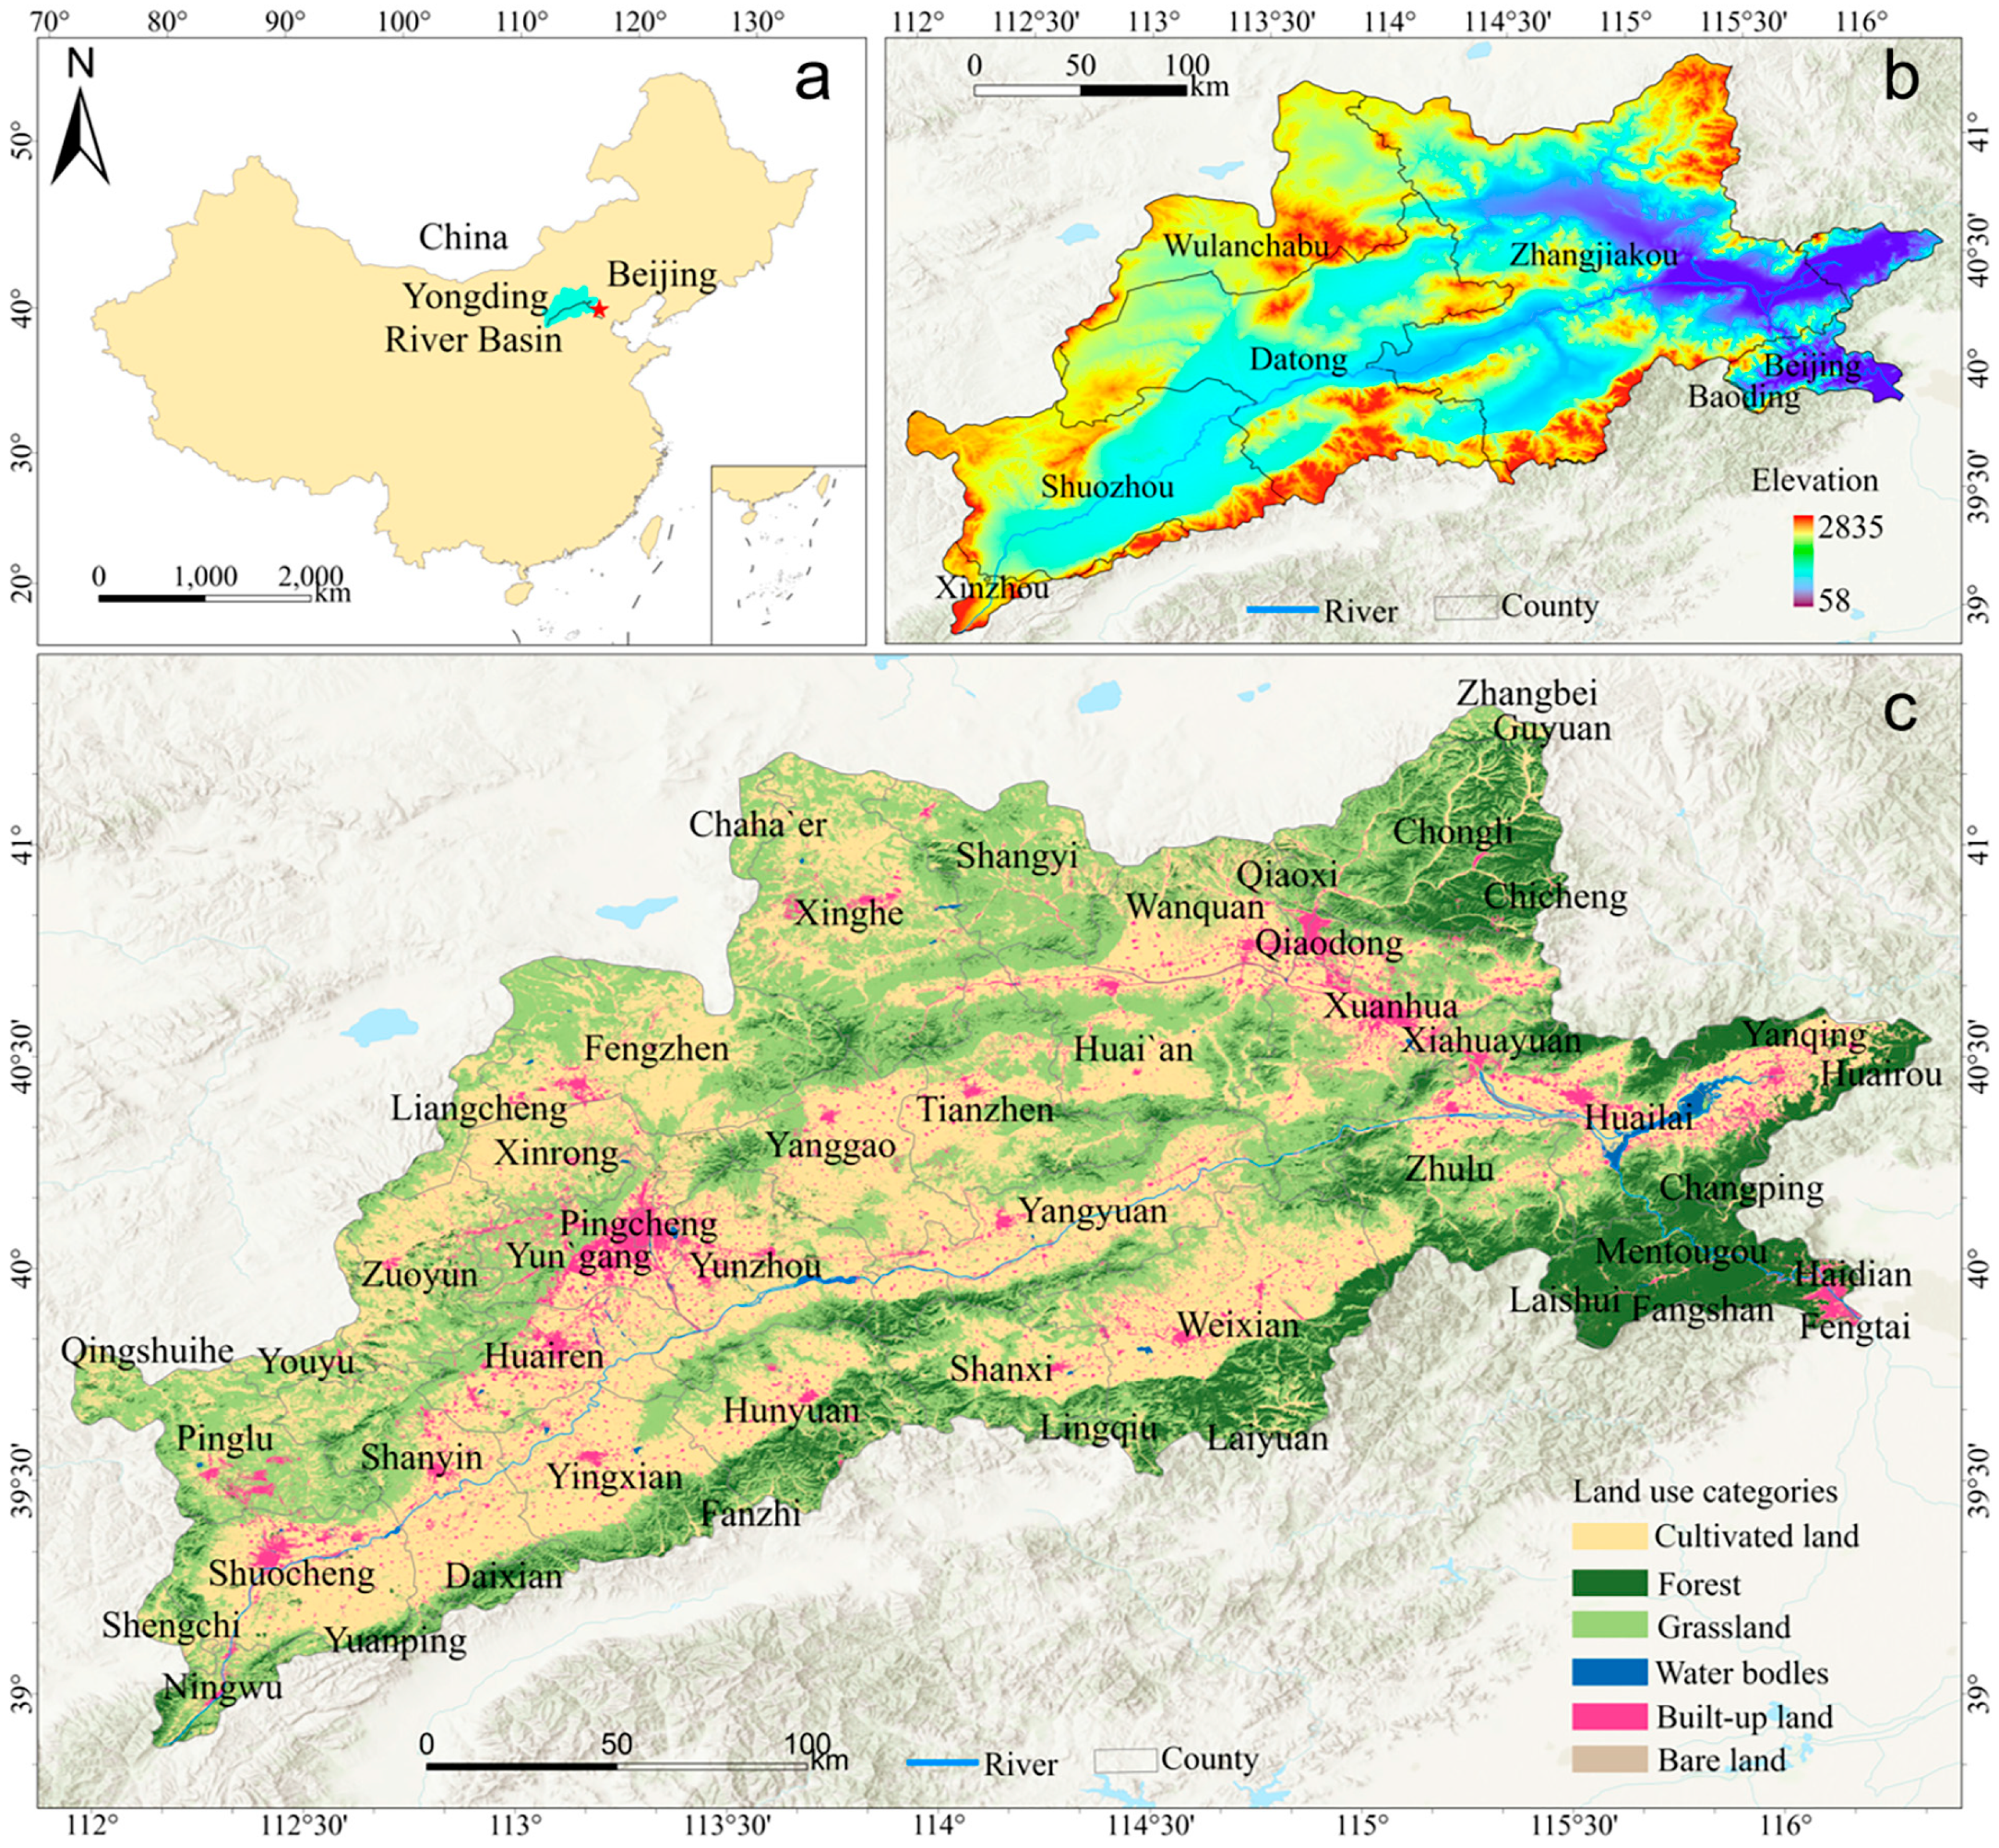
The Yongding River spans five provinces, municipalities, and autonomous regions—Shanxi, Inner Mongolia, Hebei, Beijing, and Tianjin (38–41° E, 111–116° N). The region covers a total area of 47,000 km2, representing 14.7% of the Haihe River Basin. The principal river systems are the Sanggan River, Yang River, Huliu River, Guishui River, Qingshui River, and the Yongding River (Figure 1). The upper reaches of the basin, situated at over 1500 m above sea level, predominantly feature grassland terrain covered by quaternary loose sediments, with small areas of exposed bedrock. Characterized by a typical temperate continental monsoon climate, it experiences an average annual precipitation range of 360 to 650 mm, with considerable variations across different regions. The average annual temperature is 6.9 °C, with temperatures reaching up to 39 °C and dropping to −35 °C. The frost-free period lasts for approximately 120 to 170 days in the basin areas and around 100 days in the mountainous regions. According to the latest data, the average depth of groundwater within a 10-km radius along the Yongding River is 12.38 m. The soil types in the mountainous areas of the basin consist of alluvial soil and loess, predominantly sandy loam. The soil type in the plain areas is saline–alkali soil, mainly composed of clay or loam. The vegetation in mountainous areas is typically dominated by forests and shrubs, including temperate coniferous forests, deciduous broad-leaved forests, and some drought-tolerant shrubs. The vegetation in the valley area includes riparian forests and wetland plants. The vegetation types in the plain areas include farmland, grassland, and artificial vegetation.
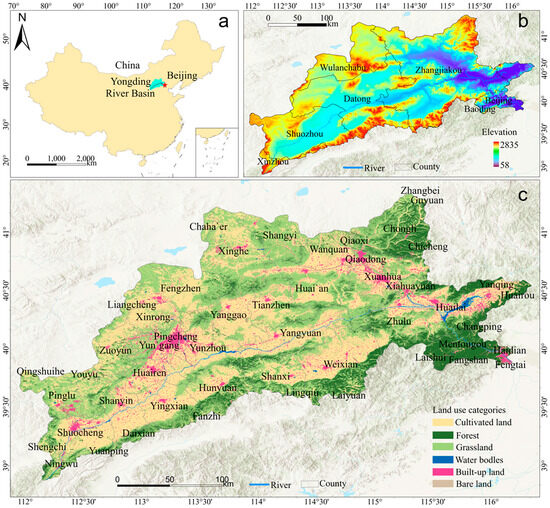
Figure 1.
Overview of the study area: (a) geographical location of the research area; (b) elevation distribution of the research area; (c) land use distribution in 2022.
2.2. Data Sources
2.2.1. Vegetation Data
The vegetation data were derived from the MODIS NDVI, sourced from the MYD13Q1 V6.1 product, covering the time series from 2002 to 2022 and featuring a spatial resolution of 250 m. Due to the significant impact of cloud cover and aerosols on MODIS, especially during the growing season, in order to enhance data accuracy, the maximum value synthesis method was applied to mitigate the effects of clouds and aerosols, resulting in a synthesized dataset with a temporal resolution of 30 days.
2.2.2. Land Use Data
The land use data were derived from the China land cover dataset (CLCD), developed on the GEE platform, with a spatial resolution of 30 m for CLCD products. In order to facilitate the spatial comparison and analysis of CLCD and NDVI, the method employed in this study was the nearest-neighbor interpolation method, which was applied to uniformly resample the resolution of the land use data to 250 m. Images were preprocessed using ArcGIS Pro, resulting in the generation of land use status maps for the years 2002, 2007, 2012, 2017, and 2022. In accordance with the national standard “Classification of Land Use Status” (GB/T 21010-2017) [30], the land use status data for the five periods were reclassified into six primary categories: cultivated land, forest land, grassland, water bodies, construction land, and unutilized land (China National Standards Committee 2017).
2.3. Methods
2.3.1. Vegetation Greenness
This study simultaneously collected the average NDVI of the growing season and the maximum NDVI of the year to evaluate the annual average and maximum greenness of the region, respectively. Due to the influence of climate conditions, vegetation growth in this area is mainly concentrated from April to October. This study used the average NDVI during this period to represent the average vegetation greenness during the growing season. Firstly, the NDVI product of MYD13Q1 V6.1 was synthesized into a file with 12 bands spaced across each month. The average NDVI during the growing season was the average value of the band range from 4 to 10. The calculation formulas for the average NDVI and maximum NDVI per pixel growth season from 2002 to 2022 were as follows:
where represents the average NDVI of a certain pixel during the growing season, k represents the year (2002–2022), and NDVIk,i the value of the i-th band in the kth year of a certain pixel (i = 1, 2, 3, …, 12). NDVImax,k represents the maximum value of year k.
2.3.2. Linear Trend Estimate
Trend Analysis
Using linear regression analysis and the least squares method, the NDVI slope of each grid of the remote sensing image for the most recent n years was fitted by pixels, the trend in NDVI for many years was obtained, and the direction and rate of vegetation greenness change in the basin over many years were comprehensively analyzed using Equation (3):
where is the trend of change and is the value of the t-th year. When the slope > 0, there is an increasing trend, and when the slope < 0, there is a downward trend.
F Test
In order to further evaluate the changes in vegetation cover, the F-test method was used to analyze the significance of the NDVI change trend in order to express the confidence level of the trend change, as follows:
where n represents the research time sequence, and and represent the sum of squared error and the sum of squared regression, respectively. represents the fitted regression value. represents the average value for n years, and represents the value of the ti year.
2.3.3. Attribution Analysis of Land Use Changes in Vegetation Greenness Changes
For a certain year, k, the average growth season of regional vegetation greenness depends on the average and proportion of different land use types, as follows:
where l is the land use type and the area ratio of the corresponding land type adopts the land use classification, so n = 6. From the perspective of land use change, the change in regional vegetation in the two periods is weighted by the mean value of each land use type and its proportional area change, as follows:
where Rl represents the contribution of each land use type to the change in regional vegetation greenness. Note: the annual maximum change in degree of greenness and its quantitative analysis are the same as the average value for the growing season.
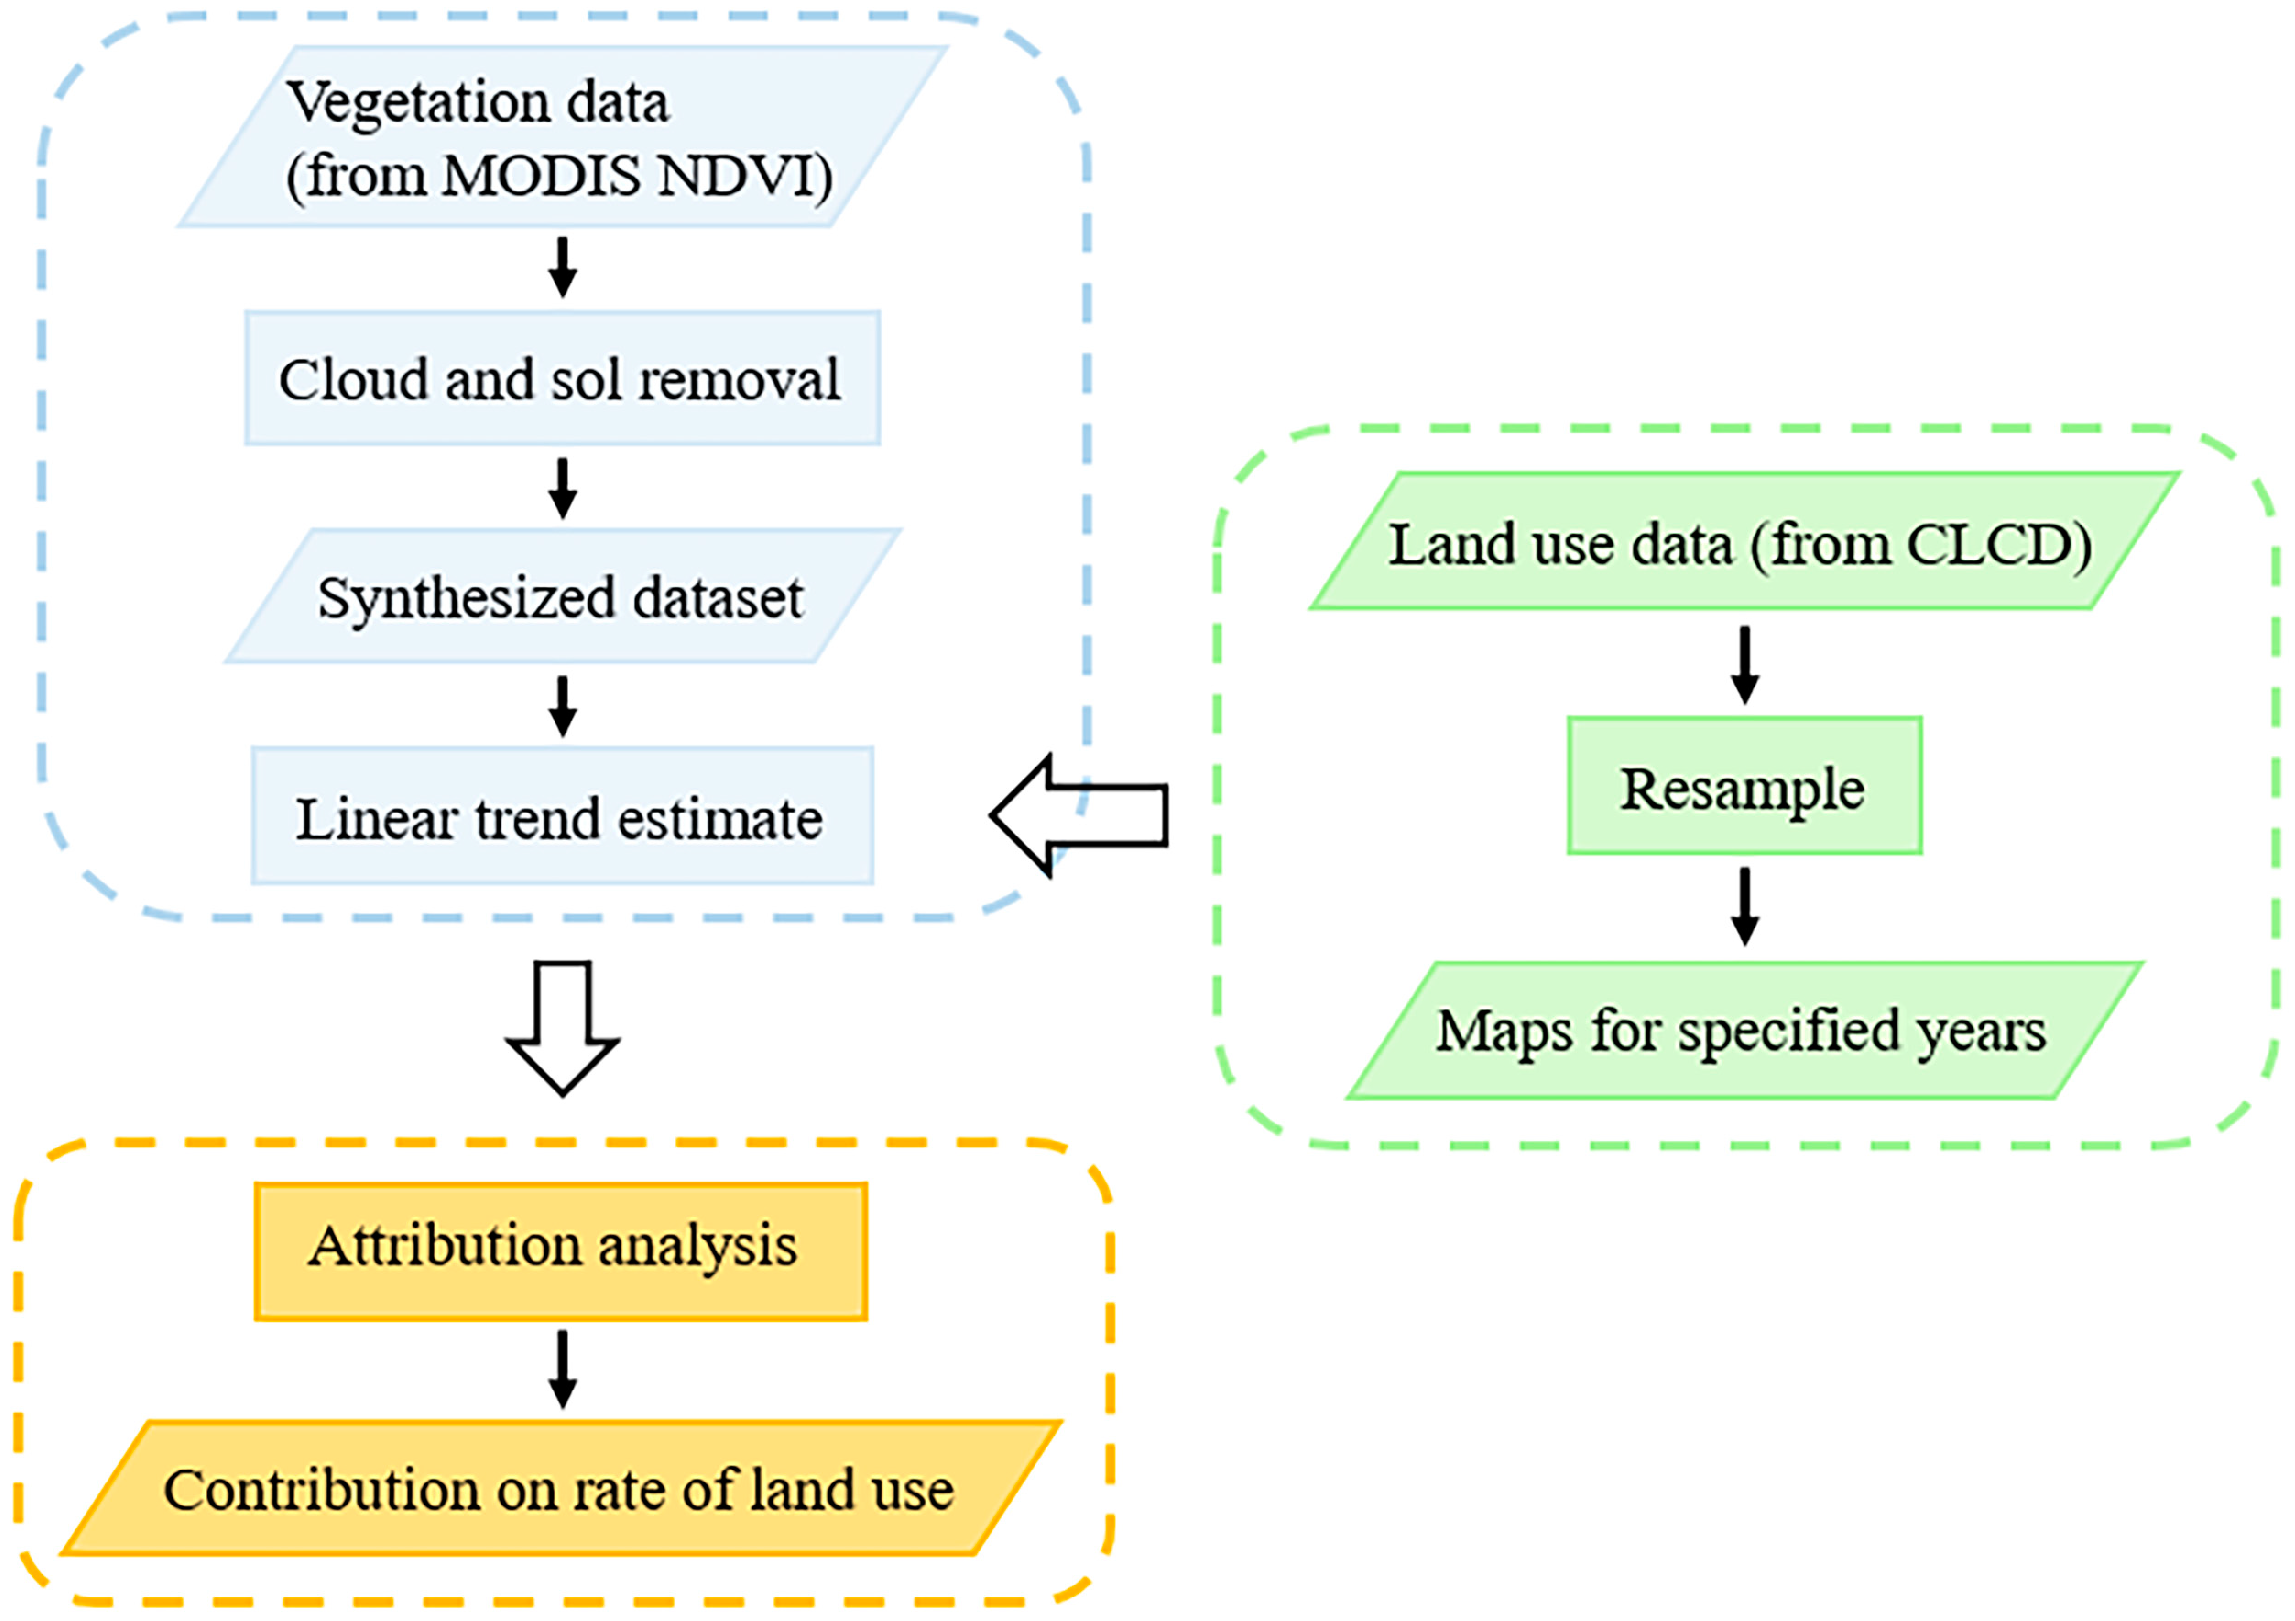
To further demonstrate the processing process and research ideas, a workflow diagram is shown in Figure 2.
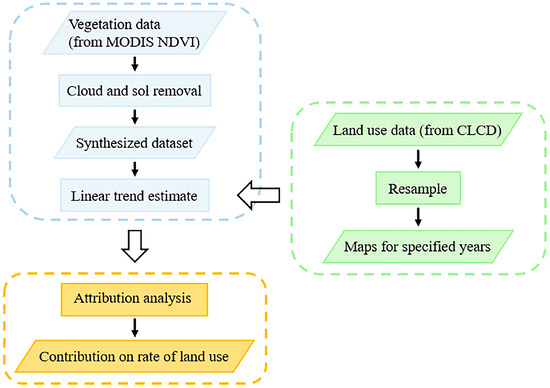
Figure 2.
Overall technical flow chart of this study.
3. Results
3.1. The Spatiotemporal Variation Characteristics of Vegetation Greenness
3.1.1. NDVI Change Trends, 2002–2022
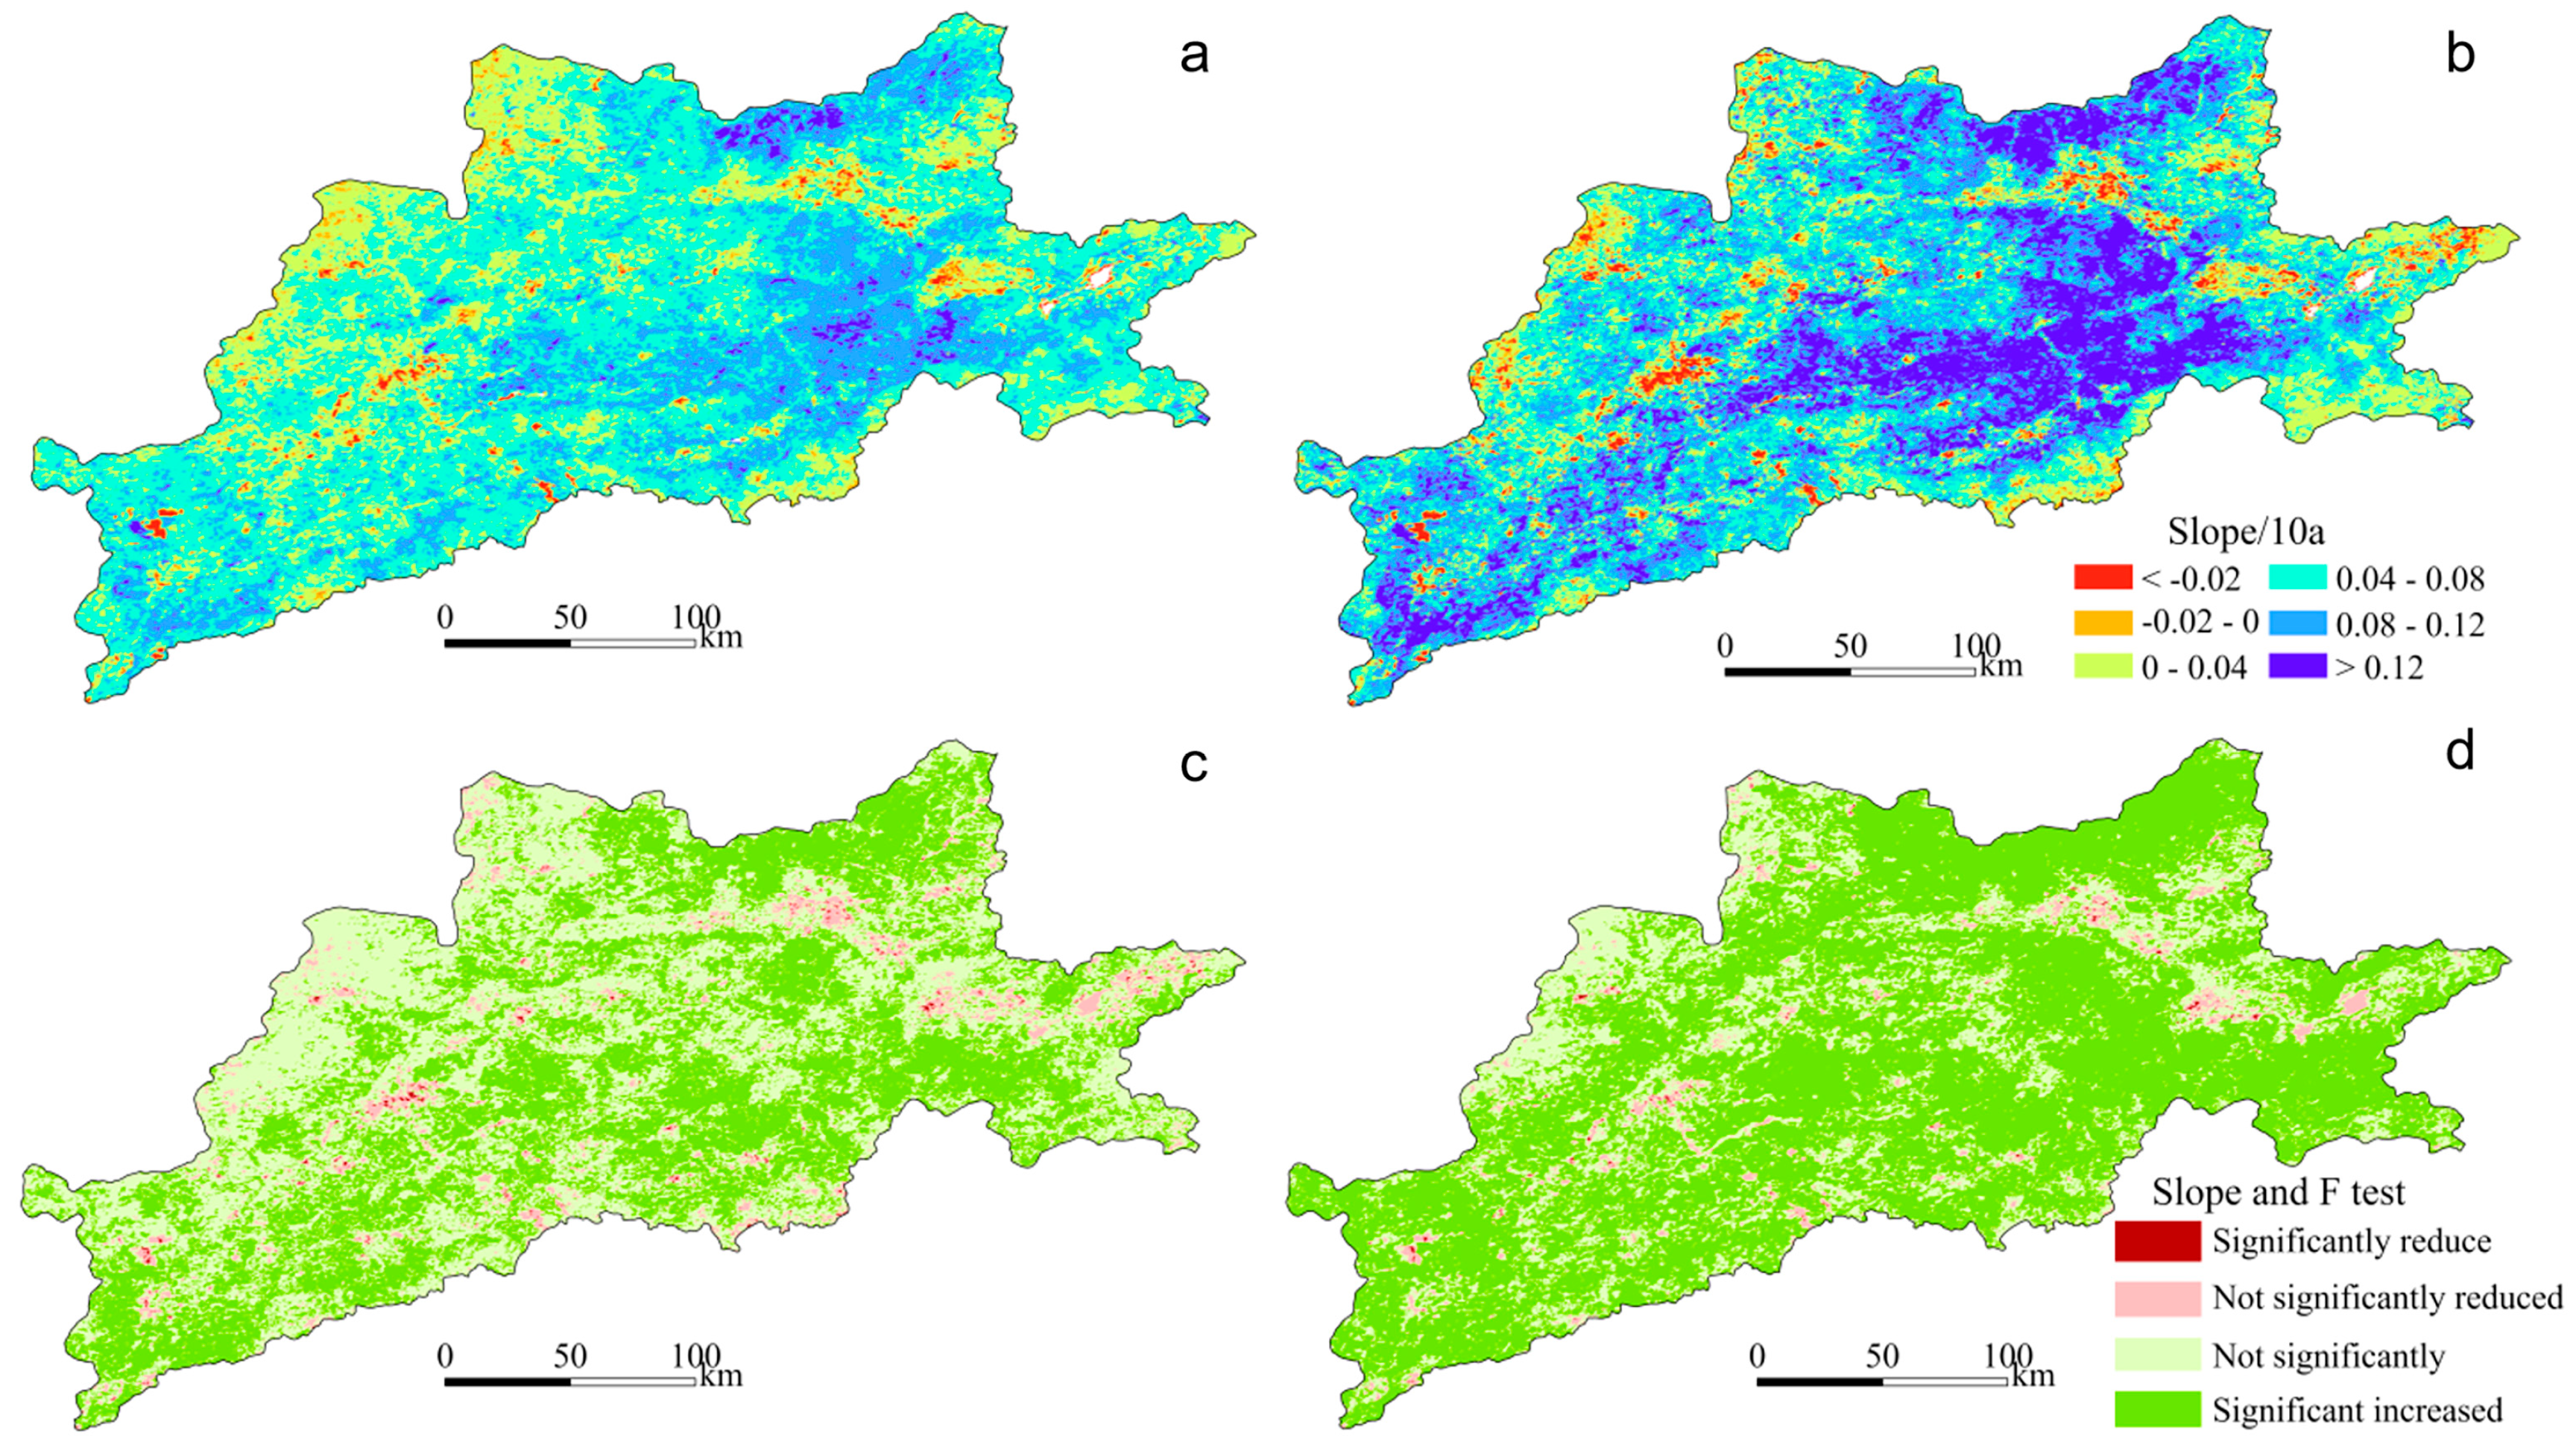
The results of the average NDVI and the annual maximum NDVI in the growth seasons from 2002 to 2022 are shown in Figure 3. From 2002 to 2022, the average growth rate in the annual growth season was 0.006/10a, and the average annual growth rate was higher than the annual growth rate of 0.008/10a. The area with increased vegetation greenness accounted for more than 90% of the total area (Figure 3a,b).
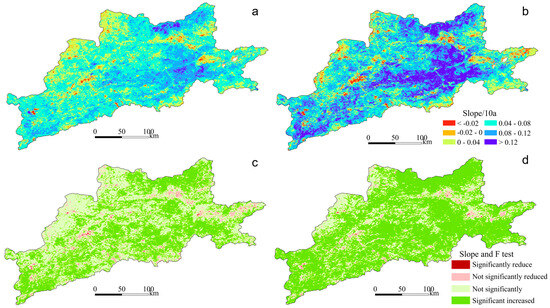
Figure 3.
Trends in and significance analysis of vegetation greening in the Yongding River Basin from 2002 to 2022: (a) the trend in average NDVI changes during the growing seasons from 2002 to 2002; (b) the trend in maximum NDVI changes from 2002 to 2002; (c) significance of average NDVI during the growing season from 2002 to 2022; (d) annual maximum average NDVI significance from 2002 to 2022.
According to Figure 3c,d, the areas with large increases in vegetation greening increase are mainly distributed in the upper forest land of Sanggan River, the forest grassland in the northern part of Yanghe River, and the wetland areas near the Guanting Reservoir. The areas with decreasing vegetation greening are scattered, mainly in areas with urban expansion, and these areas are not significantly higher than the significantly lower areas. In addition, as can be seen from Figure 3c,d, the change trend in NDVI during the growing season was consistent with the change trend in the annual maximum NDVI, but the degree of change was different. Among them, the area with a significant increase in average NDVI in the growing season was 70.35%, the area of non-significant increase was 27.04%, the proportion of significantly reduced area was 0.11%, and the proportion of non-significant decrease was 2.49%. However, the proportion of significantly increased annual maximum NDVI was 46.77%, the proportion of non-significant increase was 48.72%, the proportion of significantly reduced areas was 0.22%, and the proportion of non-significant decrease was 4.29%. Figure 2 shows that both the average greenness of the growing season and the average annual maximum greenness increased in the 21 years from 2002 to 2022, and the proportion of the significantly increasing area was 46.77~70.35%.
3.1.2. Spatial Distribution Characteristics of Vegetation Greenness
Vegetation greenness is spatially distributed primarily in the southern mountain ranges, the Zhangjiakou mountainous regions in the north, and the Changping district of Beijing, among other areas less impacted by human activities, displaying notably higher NDVI values than other regions within the basin. The regions with the lowest vegetation greenness are primarily around Guanting Reservoir, followed by Datong and other areas of urban expansion, where the high proportion of built-up land has resulted in the poorest vegetation greenness (Figure 4a,b). The NDVI coefficient of variation indicates the vegetation’s stability. As shown in 4c, the region with the greatest increase in vegetation greenness from 2002 to 2022 was Xiangshuibao Reservoir, followed by Cetian Reservoir and its vicinity. Consequently, the areas with the highest vegetation variation coefficients were primarily water bodies. Additionally, vegetation in areas such as cultivated land and construction land, which have been significantly impacted by human activities, exhibited higher coefficients of variation, followed by grasslands and unused land, whereas forest vegetation demonstrated the greatest stability.
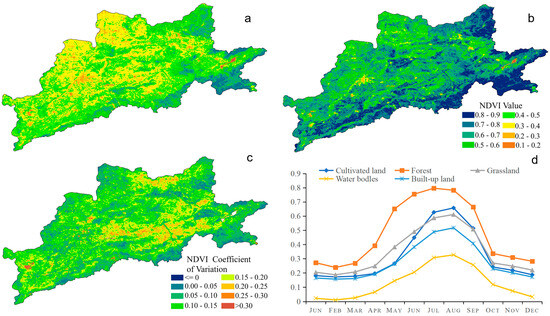
Figure 4.
Spatial distribution characteristics of vegetation greenness in Yongding River Basin: (a) average NDVI value during the growing season from 2002 to 2022; (b) annual maximum NDVI value from 2002 to 2022; (c) coefficient of variation of NDVI; (d) vegetation growth curve.
Figure 4d represents the average NDVI vegetation growth curves for various land types. The results reveal that forest land displayed the highest vegetation greenness, followed by grassland, cultivated land, and construction land, with water areas having the least green vegetation. NDVI values across different monthly scales indicated that from mid-May, the growth rate of cultivated land’s NDVI significantly exceeded that of other vegetation types.
3.2. The Characteristics of Land Use Change in Yongding River Basin from 2002 to 2022
3.2.1. Analysis of Land Use Status
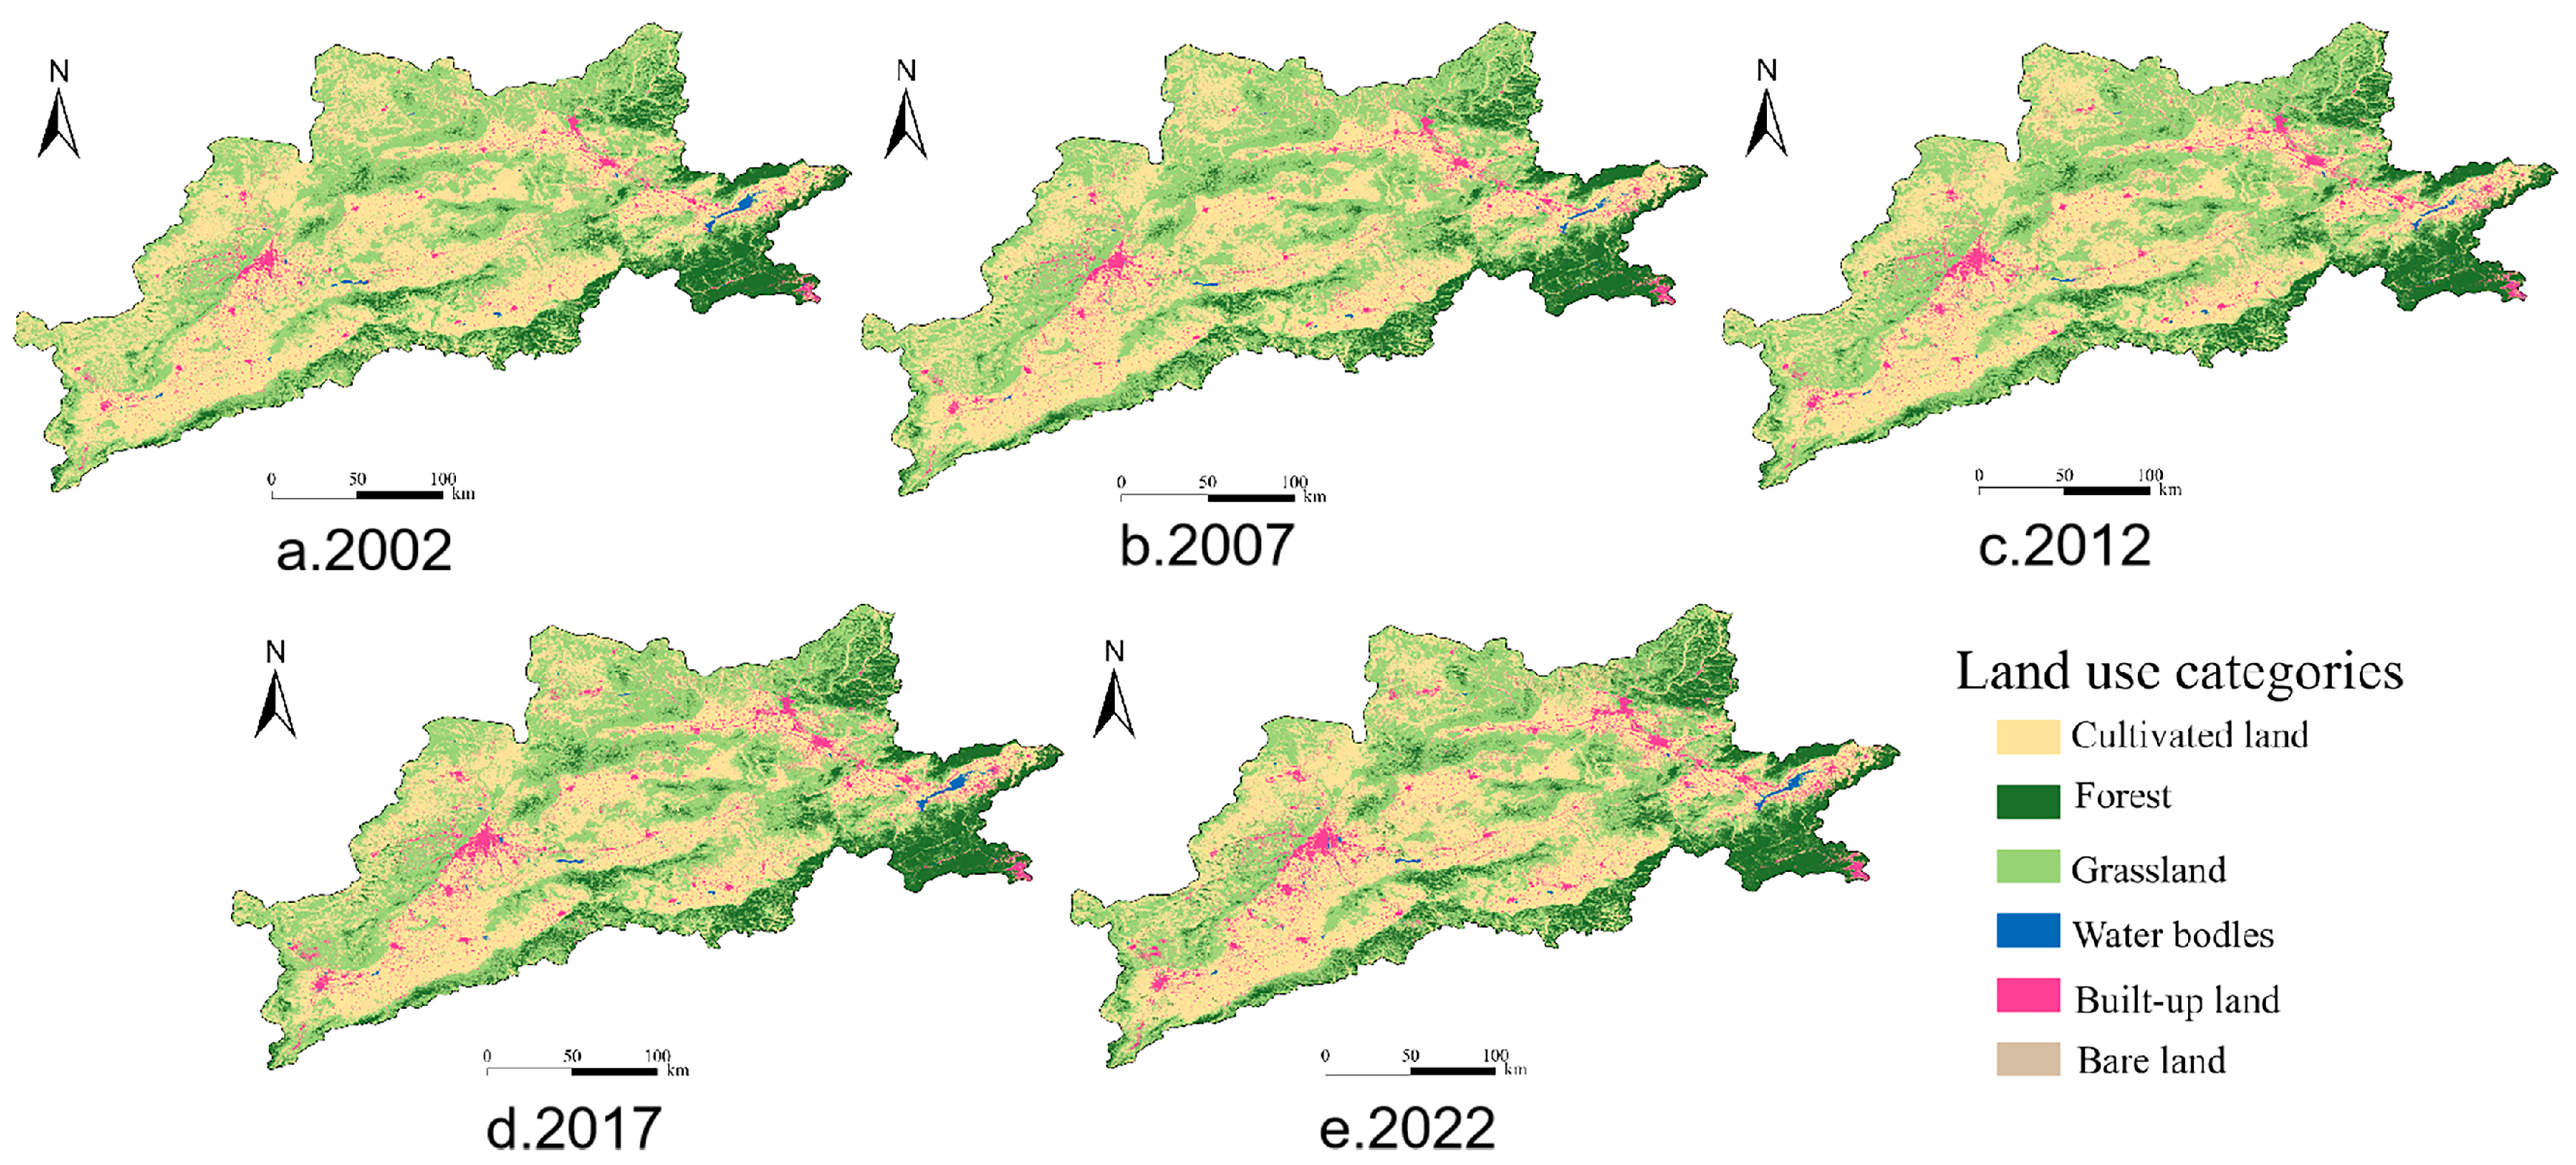
Based on the first-level classification standard GB/T21010-2017 [30], “Land Use Status Classification”, and considering the actual conditions of the Yongding River Basin, ArcMap 10.8 was employed to create land use maps for the Yongding River Basin for the years 2002, 2007, 2012, 2017, and 2022 (Figure 5). The findings indicate that over the past 21 years, the primary land use types in the Yongding River Basin have been cultivated land, forest land, grassland, water bodies, construction land, and unused land, with the majority being cultivated land, forest land, and grassland. In terms of changes, the forest area had expanded by 1437.56 km2 by 2022 compared with 2002, representing a relative increase of 29.20%. Conversely, the areas of arable land and grassland decreased by 829.92 km2 and 1654.47 km2, respectively, with the declines being 4.43% and 9.35%, respectively. Construction land expanded by 1041.17 km2, marking a relative growth of 68.29%.
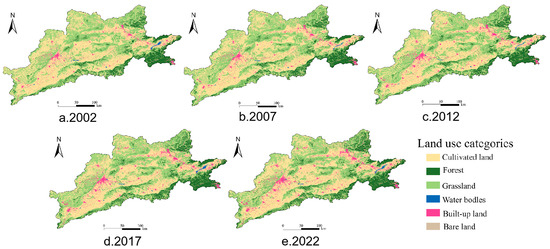
Figure 5.
Land use status of Yongding River Basin in 2002, 2007, 2012, 2017, and 2022: (a) land use distribution in 2002; (b) land use distribution in 2007; (c) land use distribution in 2012; (d) land use distribution in 2017; (e) land use distribution in 2022.
3.2.2. Analysis of Land Use Transfer Matrix
The land use transfer matrix for the Yongding River Basin from 2002 to 2022 is presented in Table 1. The primary land use transitions in the study area have involved shifts between cultivated land, forest land, and grassland, with some cultivated and grassland areas being converted to construction land. As shown in Table 1, the proportion of cultivated land within the basin decreased from 43.56% in 2002 to 41.63% in 2022. The combined area of forest and grassland decreased from 52.55% to 52.04%, while the proportion of construction land increased from 3.54% to 5.96%. The amount of various land use changes was relatively minor, ranging from 0.23% to 4.62% of the basin’s total area. Consequently, the land use pattern in the Yongding River Basin showed minimal changes from 2002 to 2022.

Table 1.
Transfer matrix of land use types in Yongding River Basin from 2002 to 2022.
3.3. Analysis of Vegetation Greenness Dynamics in Response to Land Use Changes
Table 2 illustrates the contributions of land use area and intensity changes to the watershed’s vegetation greenness over different periods. As shown in Table 2, from 2012 to 2022, the contribution rates of land use changes to both the average NDVI and the annual maximum NDVI of the vegetation growth season in the watershed were positive. From 2002 to 2022, within the Yongding River Basin’s growing season, average NDVI changes, cultivated land, grassland, and forest significantly influenced vegetation greenness, with contribution rates of 36.73%, 27.11%, and 26.43%, respectively. Conversely, unused land and water bodies had minimal effects on vegetation greenness, with contribution rates of 0.17% and −0.01%, respectively. The contributions of different land use types varied over time. From 2002 to 2012, the influence of cultivated land notably surpassed that of other land types, with a notable increase in both the area and greenness of cultivated land, comprising over half of the total contribution to changes in vegetation greenness. Since 2012, although the trend of increasing vegetation greenness in cultivated land has continued, policies such as the conversion of farmland to forests and grasslands have led to a decline in arable land. Consequently, the impact of cultivated land on vegetation greenness has been diminishing. Conversely, the conversion of farmland to forests and grassland has led to expansion of the areas of forest and grassland, making their impacts on changes in vegetation greenness more comparable to those of cultivated land.
Table 2.
The contribution rate of land use/cover change to changes in regional vegetation greenness in different periods.
Cultivated land exerted a more significant influence on the annual maximum NDVI compared with its influence on the average NDVI during the growing seasons. Findings indicate that 38.63% of the variation in the annual maximum NDVI from 2002 to 2022 originated from cultivated land, surpassing 36.73% of the growing season’s average. Subsequently, the impact of forest and grassland on the annual maximum NDVI was less pronounced than on the average NDVI during the growing season. The contribution rate of cultivated land differed markedly across time periods, peaking at 58.00% from 2012 to 2022, surpassing the rate from 2002 to 2012. The influence of forest land remained relatively stable, whereas the contribution of grassland initially declined before rising. Given their minor proportions, water bodies, built-up land, and bare land exerted minimal influence on the general trend in regional vegetation greenness.
4. Discussion
The Yongding River Basin is an ecological conservation zone and a critical ecological support area for the Beijing–Tianjin–Hebei region [31]. Its vegetation status, spatiotemporal succession of vegetation, and the spatial heterogeneity of driving factors for vegetation changes at various scales offer a theoretical foundation for assessing ecosystem adaptability in the face of climate change and human activities. Therefore, conducting research on vegetation greenness within the Yongding River Basin holds significant importance. Our results reveal that vegetation greenness in the study area demonstrates pronounced spatiotemporal variability (Figure 2 and Figure 3), aligning with prior research findings [32]. Between 2002 and 2022, the basin’s vegetation greenness generally increased, with degraded areas primarily around Guanting Reservoir and other river water bodies. The regions experiencing the most significant increases in vegetation greenness were primarily in the woodlands of the middle and upper reaches of the Sanggan River, the forested grasslands in the northern Yanghe River Basin, and the wetlands adjacent to Guanting Reservoir. The NDVI index value depends primary on the water availability, which is significantly influenced by the rooting capacity of the plants. Therefore, those vegetation and land use types with higher root coverage or better water retention capacity have higher NDVI values [33,34,35]. This substantial increase in vegetation greenness in the study area may be attributed to vegetation restoration initiatives and ecological water replenishment policies within the basin [36,37]. Since the enactment in 2019 of ecological water replenishment policies within the river basin, the river’s water surface area has expanded, with previously exposed river channels re-covered by water. Consequently, the degree of vegetation coverage in some river areas has diminished, while areas experiencing more significant increases in vegetation greenness are primarily located along the riverbanks and in the surrounding areas. This suggests that the post-replenishment growth in the river area has fostered vegetation growth, leading to notable elevations in both the average NDVI during the growing season and the annual maximum NDVI across the basin.
Vegetation growth and its spatial distribution are the outcomes of the long-term interplay between water and soil resources, topography, climate change, and human activities, which are highly influenced by factors such as temperature and precipitation [38]. We analyzed the monthly average NDVI growth curves for different land types, discovering that forest vegetation boasted the highest greenness levels. However, beginning in mid-May, the NDVI growth rate of cultivated land vegetation markedly surpassed that of other types, including forest land (Figure 3d), aligning with Chen’s research findings [39]. This phenomenon could be influenced by various factors, including climatic conditions, vegetation growth cycles, and human activities. Primarily, climatic conditions are among the key factors influencing NDVI variations, with the rise in NDVI in the study area being attributed to both higher temperatures and increased precipitation, particularly the latter’s more substantial impact [40]. Research indicates that spring is a critical period for vegetation growth, which is highly responsive to temperature and precipitation [41]. Mid-May typically marks the end of spring and the beginning of summer, a time when crops are in their peak growth phase, and optimal temperatures and plentiful rainfall favor rapid vegetation growth, leading to a significant increase in NDVI. Additionally, the physiological and growth cycles of different vegetation types influence the rate of NDVI change [42]. Vegetation on cultivated land, typically annual crops, begins to grow rapidly after spring sowing and this growth continues into mid-May. During this period, the crop’s leaf area index rapidly increases and photosynthetic efficiency improves, thereby accelerating the rate of NDVI increase. In contrast, other vegetation types such as forests and grasslands may experience relatively stable biomass accumulation, resulting in smaller variations in their NDVI growth rates [43]. Lastly, human activities like agricultural cultivation and irrigation significantly impact NDVI [44]. The Yongding River Basin, situated in the arable farming region of the North China Plain, is characterized by a high concentration of human activities. Agricultural management practices such as irrigation and fertilization can significantly enhance crop growth, thereby increasing the NDVI value of cultivated land vegetation. In contrast, forests and grasslands are less influenced by human activities; hence, their rate of NDVI increase under natural growth conditions is not as pronounced as that of cultivated land.
In this study, we chose the Yongding River Basin as our research area. Given the scarcity of research integrating land use change with vegetation cover change, our study focused on exploring the relationship between these two factors. This investigation holds significant importance for addressing ecological issues, optimizing land use structure, and planning future urban development. We quantitatively analyzed the greenness and areas of various land use types, exploring the correlation between vegetation greenness and land use types within the study area. This study found that, from 2002 to 2022, the primary contributor to changes in vegetation greenness was cultivated land, followed by grassland and forest land, with contribution rates of 26.86% to 27.11% and 23.94% to 26.43%, respectively. This finding was influenced not only by climatic conditions but also by large-scale human activities associated with vegetation restoration, such as the conversion of farmland to forests and the management of wind and sand sources. According to surveys, several vegetation restoration projects have been initiated in the Yongding River Basin since the start of the 21st century, notably the first phase of the Beijing–Tianjin Sandstorm Source Control Project in 2000, the Grain for Green Project in 2002, and the second phase of the Beijing–Tianjin–Tangshan Sandstorm Source Control Project in 2013. However, prior to 2000, there were no significant vegetation restoration projects in the basin, suggesting that vegetation growth before 2000 was predominantly influenced by climatic conditions, whereas post-2000 growth was influenced by both climatic conditions and human activities. Nevertheless, this study quantified only the impact of human activities on vegetation greenness by integrating land use data with remote-sensing NDVI data. Natural elements, including climate, soil, and terrain, are also significant factors affecting vegetation greenness. Therefore, further research is required to analyze the driving factors behind the spatiotemporal dynamics of vegetation greenness in watersheds.
5. Conclusions
We utilized a long-term series of vegetation indices and integrated Landsat land use data. We used linear trend estimation to analyze the interannual variations in vegetation greenness in the Yongding River Basin from 2002 to 2022 and quantitatively assessed the impact of land use changes on vegetation greenness. The main findings are as follows:
- (1)
- From 2002 to 2022, the basin’s vegetation greenness exhibited an overall increase, with an average growth rate of 0.006/10a in the annual growing season. The average growth rate of the annual maximum value exceeded that of the growing season average, reaching 0.008/10a. Over 90% of the area experienced an increase in vegetation greenness;
- (2)
- In the Yongding River Basin, the average NDVI during the growing season was 0.45, with an annual maximum of 0.66. Spatially, the NDVI values in mountainous forest land areas were notably higher than those in other parts of the basin. Areas with the lowest vegetation greenness were primarily found around river waters like Guanting Reservoir. The vegetation variation coefficient was highest in these river waters, whereas forest land vegetation demonstrated the greatest stability;
- (3)
- The contribution rate of land use changes to vegetation greenness changes indicated that, within the average NDVI variations during the growing season in the Yongding River Basin, changes in cultivated land, grassland, and forest land exerted a comparatively higher influence on vegetation greenness, with contribution rates of 36.73%, 27.11%, and 26.43%, respectively. Conversely, unused land and water bodies had the least significant impact on vegetation greenness, with contribution rates of 0.17% and −0.01%, respectively. Since 2012, the influence of cultivated land on vegetation greenness has been decreasing. Conversely, under the policy aimed at converting farmland to forests and grassland, the areas of forests and grassland have been expanding, leading to a more balanced impact on changes in vegetation greenness on cultivated land, in forests, and on grassland.
Since this study selected only land use change as the driving factor and considered a limited number of land use types, it is suggested that future research could consider both climate and human activity as dual factors to quantitatively analyze the impact of climate and human activities. At the same time, in the future, machine learning methods can be used to screen driving factors and construct structural equation models, to thereby better understand the complex mechanisms of vegetation cover change.
Author Contributions
D.Z. and M.Y. collected and analyzed the vegetation and land use data, and they were the main writers of the manuscript. Z.S. provided guidance on the theoretical framework of the study and proofread the manuscript. Y.W. downloaded vegetation and land use data, resampled the land use data, and created a workflow diagram. K.S. oversaw the entire project, secured the funding necessary for the research, and provided mentorship to the lead author. K.S. was also responsible for the final review and submission of the manuscript. All authors have read and agreed to the published version of the manuscript.
Funding
Comprehensive Observation and Monitoring, Assessment of Natural Resources in the Yongding–Luanhe River Basin (DD20242329).
Data Availability Statement
The data presented in this study are available upon request from the corresponding author.
Acknowledgments
We thank Zhengguo Sun from the College of Grassland Science, Nanjing Agricultural University, for proofreading the article, and we greatly appreciate the guidance of Xiaohuang Liu from the Key Laboratory of Coupling Process and Effect of Natural Resources Elements, Command Center for Natural Resources Comprehensive Survey.
Conflicts of Interest
The authors declare no conflicts of interest.
References
- Catford, J. Ecohydrology: Vegetation function, water and resource management. Austral Ecol. 2010, 31, 1028–1029. [Google Scholar] [CrossRef]
- Piao, S.; Wang, X.; Park, T. Characteristics, drivers and feedbacks of global greening. Environ. Res. Lett. 2020, 1, 14–27. [Google Scholar] [CrossRef]
- Su, Y.; Chen, S.; Li, X.; Ma, S.; Xie, T.; Wang, J.; Yan, D.; Chen, D.; Chen, J.; Feng, M.; et al. Changes in vegetation greenness and its response to precipitation seasonality in Central Asia from 1982 to 2022. Environ. Res. Lett. 2023, 18, 104002. [Google Scholar] [CrossRef]
- Adepoju, K.; Adelabu, S.; Fashae, O. Vegetation response to recent trends in climate and landuse dynamics in a typical humid and dry tropical region under global change. Adv. Meteorol. 2019, 1, 4946127. [Google Scholar] [CrossRef]
- Piao, S.; Liu, Q.; Chen, A.; Janssens, I.; Fu, Y.; Dai, J.; Liu, L.; Lian, X.; Shen, M.; Zhu, X. Plant phenology and global climate change: Current progresses and challenges. Glob. Chang. Biol. 2019, 25, 1922–1940. [Google Scholar] [CrossRef] [PubMed]
- Juarez, R.; Linares, F.; Sandoval, S.; Maria, L.; Karla, M. Change in land use and vegetation associated with lack of public services and public politics in Atoyatempan, Puebla. Nexo 2021, 36, 1611–1622. [Google Scholar]
- Zhu, Z.; Wang, H.; Harrison, S.; Prentice, I.; Qiao, S.; Tan, S. Optimality principles explaining divergent responses of alpine vegetation to environmental change. Glob. Chang. Biol. 2022, 29, 126–142. [Google Scholar] [CrossRef] [PubMed]
- Guo, B.; Wang, J.; Mantravadi, V.; Zhang, L.; Liu, G. Effect of climate and ecological restoration on vegetation changes in the “Three-River Headwaters” region based on remote sensing technology. Environ. Sci. Pollut. Res. 2022, 29, 16436–16448. [Google Scholar] [CrossRef] [PubMed]
- Ghazvinian, H.; Karami, H. Evaluating the effect of geocell with vegetation and gravel on changes in the effective parameters of runoff using a rainfall simulator (case study: Iran). Phys. Chem. Earth 2024, 134, 103585. [Google Scholar] [CrossRef]
- Jong, R.; Bruin, S.; Wit, A.; Michael, E.; David, D. Analysis of monotonic greening and browning trends from global NDVI time-series. Remote Sens. Environ. 2011, 115, 692–702. [Google Scholar] [CrossRef]
- Huete, A.; Didan, K.; Miura, T.; Rodriguez, E.; Gao, X.; Ferreira, L. Overview of the radiometric and biophysical performance of the MODIS vegetation indices. Remote Sens. Environ. 2002, 83, 195–213. [Google Scholar] [CrossRef]
- Hartoyo, A.P.; Pamoengkas, P.; Mudzaky, R.; Khairunnisa, S.; Ramadhi, A.; Munawi, A.; Komarudin, K.; Hidayati, S.; Sunkar, A. Estimation of vegetation cover changes using normalized difference vegetation index (NDVI) in Mount Halimun Salak National Park, Indonesia. Earth Environ. 2022, 1109, 012068. [Google Scholar] [CrossRef]
- Cui, J.; Lian, X.; Chris, H.; Luis, G.; Wang, T.; Ding, J.; He, M.; Xu, H.; Chen, A.; Pierre, G.; et al. Global water availability boosted by vegetation-driven changes in atmospheric moisture transport. Nat. Geosci. 2022, 15, 982–988. [Google Scholar] [CrossRef]
- Li, X.; Wang, K.; Chris, H.; Zhu, Z.; Josep, P.; Ranga, B.; Piao, S. Vegetation greenness in 2023. Nat. Rev. Earth Environ. 2024, 5, 241–243. [Google Scholar] [CrossRef]
- Yao, T.; Liu, S.; Hu, S.; Mo, X. Response of vegetation ecosystems to flash drought with solar-induced chlorophyll fluorescence over the Hai River Basin, China during 2001–2019. J. Environ. Manag. 2022, 313, 114947. [Google Scholar] [CrossRef] [PubMed]
- Li, H.; Li, K.; Zhao, X.; Zhao, J. Changes in Vegetation Greenness and Their Influencing Factors in Southern China. Remote Sens. Environ. 2022, 14, 3291. [Google Scholar] [CrossRef]
- Wang, H.; Yan, S.; Liang, Z.; Jiao, K.; Li, D.; Wei, F.; Li, S. Strength of association between vegetation greenness and its drivers across China between 1982 and 2015: Regional differences and temporal variations. Ecol. Indic. 2021, 128, 107831. [Google Scholar] [CrossRef]
- Han, X.; Shu, J.; Wu, L.; Li, B.; Lu, S.; Chen, W.; Ge, J. Transformation of regional vegetation driven by climate change during the last deglacial–early Holocene at Chaohu Lake, eastern China: New pollen insights. Rev. Palaeobot. Palynol. 2024, 326, 105115. [Google Scholar] [CrossRef]
- Rigling, A.; Bigler, C.; Eilmann, B.; Bigler, C.; Eilmann, B.; Feldmeyer-Christe, E.; Gimmi, U.; Ginzler, C.; Graf, U.; Mayer, P.; et al. Driving factors of a vegetation shift from Scots pine to pubescent oak in dry Alpine forests. Glob. Chang. Biol. 2012, 19, 229–240. [Google Scholar] [CrossRef]
- Li, H.; Renssen, H.; Didier, M. Global vegetation distribution driving factors in two Dynamic Global Vegetation Models of contrasting complexities. Glob. Planet Chang. 2019, 180, 51–65. [Google Scholar] [CrossRef]
- Wang, H.; Li, X.; Long, H.; Gai, Y.; Wei, D. Monitoring the effects of land use and cover changes on net primary production: A case study in China’s Yongding River basin. For. Ecol. Manag. 2009, 258, 2654–2665. [Google Scholar] [CrossRef]
- Du, Y.; Bao, A.; Zhang, T.; Ding, W. Quantifying the impacts of climate change and human activities on seasonal runoff in the Yongding River basin. Ecol. Indic. 2023, 154, P110839. [Google Scholar] [CrossRef]
- Guo, M.; Xue, W.; Wang, C.; Li, W.; Gao, H.; Neil, S.; Li, C.; Huang, G.; Wang, Y. Environmental flow increases the riparian vegetation diversity and community similarity. Wetl. Ecol. Manag. 2024, 44, 57. [Google Scholar] [CrossRef]
- Kinga, K.; Agata, H. Temporal patterns of vegetation greenness for the main forest-forming tree species in the European temperate zone. Remote Sens. Environ. 2024, 16, 2844. [Google Scholar]
- Sharmistha, B.; Bindu, B. Drought monitoring using modis derived indices and google earth engine platform for Vadodara District, Gujarat. J. Indian Soc. Remote 2024, 52, 1885–1900. [Google Scholar]
- Coops, N.C.; Kearney, S.P.; Bolton, D.K.; Radeloff, V.C. Remotely-sensed productivity clusters capture global biodiversity patterns. Sci. Rep. 2018, 8, 16261. [Google Scholar] [CrossRef] [PubMed]
- Hope, A.S.; Boynton, W.L.; Stow, D.A.; Douglas, D.C. Interannual growth dynamics of vegetation in the Kuparuk River watershed, Alaska based on the Normalized Difference Vegetation Index. Int. J. Remote Sens. 2003, 24, 3413–3425. [Google Scholar] [CrossRef]
- Richardson, A.D.; Hufkens, K.; Milliman, T.; Frolking, S. Intercomparison of phenological transition dates derived from the phenocam dataset v1.0 and modis satellite remote sensing. Sci. Rep. 2018, 8, 5679. [Google Scholar] [CrossRef] [PubMed]
- Reddy, D.S.; Prasad, P.R.C. Prediction of vegetation dynamics using NDVI time series data and LSTM. Model. Earth Syst. Environ. 2018, 4, 409–419. [Google Scholar] [CrossRef]
- GB/T 21010-2017; Classification of Land Use Status. China National Standards Committee: Beijing, China, 2017.
- Dan, D.; Angelos, A. Modeling the impact of land use changes and wastewater treatment on water quality and ecosystem services in the Yongding River basin, North China. Water Res. 2024, 16, 1701. [Google Scholar]
- Ma, Q. Simulation of vegetation cover based on the theory of ecohydrological optimality in the Yongding River watershed, China. Forests 2021, 12, 1377. [Google Scholar] [CrossRef]
- Smith, T.; Boers, N. Global vegetation resilience linked to water availability and variability. Nat. Commun. 2023, 14, 498. [Google Scholar] [CrossRef]
- Martinez, A.; Labib, S.M. Demystifying normalized difference vegetation index (NDVI) for greenness exposure assessments and policy interventions in urban greening. Environ. Res. Lett. 2022, 220, 115155. [Google Scholar] [CrossRef] [PubMed]
- Jimenez, R.B.; Lane, K.J.; Hutyra, L.R.; Fabian, M. Spatial resolution of Normalized Difference Vegetation Index and greenness exposure misclassification in an urban cohort. J. Expo. Sci. Environ. Epidemiol. 2022, 32, 213–222. [Google Scholar] [CrossRef] [PubMed]
- Zhu, Z.; Piao, S.; Myneni, R.B.; Huang, M.; Zeng, Z.; Canadell, J.G.; Ciais, P.; Sitch, S.; Friedlingstein, P.; Arneth, A.; et al. Greening of the Earth and its drivers. Nat. Clim. Chang. 2016, 6, 791–795. [Google Scholar] [CrossRef]
- Zhang, M.; Zhang, F.; Chen, D.; Tan, M.; Chan, N. Urban local surface temperature prediction using the urban gray-green space landscape and vegetation indices. Build. Environ. 2022, 217, 106530. [Google Scholar] [CrossRef]
- Jin, K.; Wang, F.; Han, J.; Shi, S.; Ding, W. Contribution of climatic change and human activities to vegetation NDVI change over China during 1982-2015. Acta Geogr. Sin. 2020, 75, 961–974. [Google Scholar]
- Chen, C.; Park, T.; Wang, X.; Piao, S.; Xu, P.; Rajiv, K.; Richard, F.; Victor, B.; Philippe, C.; Rasmus, F.; et al. China and India lead in greening of the world through land-use management. Nat. Sustain. 2019, 2, 122–129. [Google Scholar] [CrossRef]
- Zhang, Y.; Wang, Y.; Fu, B.; Dixit, A.; Chaudhary, S.; Wang, S. Impact of climatic factors on vegetation dynamics in the upper Yangtze River basin in China. J. Mt. Sci. 2020, 17, 262–277. [Google Scholar] [CrossRef]
- Han, H.; Bai, J.; Ma, G.; Yan, J.; Wang, X.; Ta, Z.; Wang, P. Seasonal Responses of Net Primary Productivity of Vegetation to Phenological Dynamics in the Loess Plateau, China. Chin. Geogr. Sci. 2022, 32, 340–357. [Google Scholar] [CrossRef]
- Pei, T.; Wu, X.; Li, X. Seasonal divergence in the sensitivity of evapotranspiration to climate and vegetation growth in Yellow River basin, China. J. Geophys. Res. Biogeosci. 2017, 122, 103–118. [Google Scholar] [CrossRef]
- Akgz, R.; Deviren, S.; Erpul, G.; Tel, S. Monitoring seasonal and phenological variability of cover management factor for wheat cropping systems under semi-arid climate conditions. Environ. Monit. Assess. 2022, 194, 395. [Google Scholar] [CrossRef] [PubMed]
- Soliveres, S.; Monerris, J.; Cortina, J. Irrigation, organic fertilization and species successional stage modulate the response of woody seedlings to herbaceous competition in a semi-arid quarry restoration. Appl. Veg. Sci. 2012, 15, 175–186. [Google Scholar] [CrossRef]

Disclaimer/Publisher’s Note: The statements, opinions and data contained in all publications are solely those of the individual author(s) and contributor(s) and not of MDPI and/or the editor(s). MDPI and/or the editor(s) disclaim responsibility for any injury to people or property resulting from any ideas, methods, instructions or products referred to in the content. |
© 2024 by the authors. Licensee MDPI, Basel, Switzerland. This article is an open access article distributed under the terms and conditions of the Creative Commons Attribution (CC BY) license (https://creativecommons.org/licenses/by/4.0/).