Article

An Excessive K/Na Ratio in Soil Solutions Impairs the Seedling Establishment of Sunflower (Helianthus annuus L.) through Reducing the Leaf Mg Concentration and Photosynthesis

1
Key Laboratory of Agricultural Soil and Water Engineering in Arid and Semiarid Areas, Ministry of Education, Northwest A&F University, Yangling 712100, China
2
College of Water Resources and Architecture Engineering, Northwest A&F University, Yangling 712100, China
3
Institute of Soil and Water Conservation, Northwest A&F University, Yangling 712100, China
4
Kazakh Research Institute of Soil Science and Agrochemistry Named after U.U. Uspanov, Al-Farabi 75v, Almaty 050060, Kazakhstan
5
Research Center for Ecology and Environment of Central Asia (Almaty), Al-Farabi 75v, Almaty 050060, Kazakhstan
*
Author to whom correspondence should be addressed.
Agronomy 2024, 14(10), 2301; https://doi.org/10.3390/agronomy14102301 (registering DOI)
Submission received: 5 September 2024 / Revised: 24 September 2024 / Accepted: 3 October 2024 / Published: 6 October 2024

Abstract

:
In saline conditions, establishing healthy seedlings is crucial for the productivity of sunflowers (Helianthus annuus L.). Excessive potassium (K+) from irrigation water or overfertilization, similar to sodium (Na+), could adversely affect sunflower growth. However, the effects of salt stress caused by varying K/Na ratios on the establishment of sunflower seedlings have not been widely studied. We conducted a pot experiment in a greenhouse, altering the K/Na ratio of a soil solution to grow sunflower seedlings. We tested three saline solutions with K/Na ratios of 0:1 (P0S1), 1:1 (P1S1), and 1:0 (P1S0) at a constant concentration of 4 dS m−1, along with a control (CK, no salt added), with five replicates. The solutions were applied to the pots via capillary rise through small holes at the bottom. The results indicate that different K/Na ratios significantly influenced ion-selective uptake and transport in crop organs. With an increasing K/Na ratio, the K+ concentration in the roots, stems, and leaves increased, while the Na+ concentration decreased in the roots and stems, with no significant differences in the leaves. Furthermore, an excessive K/Na ratio (P1S0) suppressed the absorption and transportation of Mg2+, significantly reducing the Mg2+ concentration in the stems and leaves. A lower leaf Mg2+ concentration reduced chlorophyll concentration, impairing photosynthetic performance. The lowest plant height, leaf area, dry matter, and shoot/root ratio were observed in P1S0, with reductions of 27%, 48%, 48%, and 13% compared to CK, respectively. Compared with CK, light use efficiency and CO2 use efficiency in P1S0 were significantly reduced by 13% and 10%, respectively, while water use efficiency was significantly increased by 9%. Additionally, improved crop morphological and photosynthetic performance was observed in P1S1 and P0S1 compared with P1S0. These findings underscore the critical role of optimizing ion composition in soil solutions, especially during the sensitive seedling stage, to enhance photosynthesis and ultimately to improve the plant’s establishment. We recommend that agricultural practices in saline regions incorporate tailored irrigation and fertilization strategies that prioritize optimal K/Na ratios to maximize crop performance and sustainability.

1. Introduction

The sunflower (Helianthus annuus L.) is ranked third globally among the oilseed plants, following soybean and peanut [1]. However, salinity is one of its major abiotic stresses, resulting in a more than 60% reduction in sunflower yields worldwide [2]. Currently, about 15% of the salt-affected topsoil, especially that rich in sodium (Na+), is categorized as sodic soil, while the remaining 85% is categorized as saline soil, which is the result of combinations of various salts including Na+ and potassium (K+) salts [3]. The effects of Na+ on crops have been extensively studied. The presence of excess Na+ leads to osmotic problems, ion toxicity, and ion imbalances in crops [4]. Because of the known promotion of plant growth by K supplementation in agricultural fields, most past studies have focused on the uptake of K+ by plants at low concentrations in the soil [5]. Consequently, our understanding of the effects of excess K+ on sunflower establishment is limited.
As one of the nutrient elements, K plays an essential role in many physiological functions in crops [6]. The absorption of K is highly selective and closely associated with the metabolic activity of crop plants. For example, K contributes to pH stabilization as well as osmotic and ionic regulation [7]. An adequate K supply also improves photosynthetic rates and even enhances grain quality [8]. Furthermore, K can regulate the opening and closing of plant stomata [9]. Specifically, the increase in K concentration in the guard cells leads to its water uptake from the neighboring cells and a consequent increase in turgor, which opens the stomata. Thus, an adequate K supply is conducive to ion regulation and improves photosynthesis, thereby promoting crop growth and plant establishment.
Although previous studies have focused more on salt stress caused by Na+, there are many naturally saline soils that are rich in K+ [10,11]. Furthermore, there is increasing interest in studying high levels of K+ in applied water [12,13,14] and the overfertilization of agricultural land [15,16]. Thus, there is a particularly urgent need to study the effects of a high K/Na ratio on crops. Fageria [17] indicated that K+ toxicity is rarely found in crop tissues, but it can cause nutrient imbalances if more K+ is absorbed than the crop needs. An increase in K+ concentration in the growth medium resulted in an increase in K+ uptake versus a decrease in calcium (Ca2+) uptake, suggesting a possible competitive effect between K+ and Ca2+ [17]. Ding et al. [18] highlighted that high K+ levels in the nutrient solution exacerbated the magnesium (Mg) deficiency effect caused by a low Mg supply and contributed to oxidative damage in rice. In high K+ environments, Arabidopsis exhibited a decrease in primary root growth, K+ overaccumulation in shoots and roots, reduced necessary nutrients, and depletion of nitrogenous metabolites, which increased oxidative stress and ultimately led to reduced photosynthesis [5]. Undoubtedly, as described above, the interaction between K and other nutrients is complex, and the effect on crop phenotypes and photosynthesis is unknown. Therefore, the systematic evaluation of crop growth response under high levels of K+ are of central importance for improving crop performance and plant establishment.
Additionally, it is widely recognized that Na+ cannot replace the specific function of K+ because of its large hydration shell [4]. The competition of Na+ with K+ can decrease K’s availability to plants [19]. Compared with Na+, whether the same concentration of K+ is harmful to crops is controversial. Adiloglu et al. [20] found that wheat (Triticum aestivum L.) treated with Na+ showed higher reduction in biomass compared with K+. Reich et al. [21] also demonstrated that oilseed rape (Brassica rapa L.) treated with Na+ exhibited a greater decrease in biomass than K+. In addition, Farahani et al. [22] indicated that at an electrical conductivity (EC) of 3 dS m−1, penetration resistance increased due to clay dispersion with an increasing K/Na ratio, and therefore, plant growth did not increase (p > 0.05), although plant-available water increased. However, plant growth increased due to the increasing amount of plant-available water with an increasing K/Na ratio at EC = 6 dS m−1, under conditions without impedance for root penetration. However, there are also studies that show that a high K+ level is more deleterious than Na+ given the same external concentrations [5,23,24]. Thus, the impact of excessively high or low K/Na ratios on plants is uncertain.
Sunflower is a moderately salt-tolerant crop and is often grown in arid regions, where it is frequently affected by salinity [25,26,27]. However, our understanding of the photosynthesis and ion absorption response of sunflower to different K/Na ratios is limited. In addition, sunflower is more sensitive to salt at the seedling stage than at subsequent growth stages, so salt tolerance at the seedling stage is the key point for plant establishment and even ultimately yield formation [28]. Therefore, we conducted a pot trial to observe the physiological response of sunflower seedlings to different K/Na ratios at the same external electrolyte concentration. We hypothesized that there exists an optimal K/Na ratio capable of promoting plant establishment in sunflower seedlings and an inappropriate K/Na ratio that may cause an ion imbalance and reduced photosynthesis, thereby further hindering seedling establishment. The specific aim of our study was to assess the effect of different K/Na ratios on crop phenotypes, dry matter accumulation, ion uptake, and photosynthesis during the sunflower seedling stage. This study could reveal the ion absorption and photosynthetic response mechanisms of crops to different K/Na ratios, and thus provide a theoretical basis for the efficient use of water and fertilizer to improve agricultural productivity in saline regions.

2. Materials and Methods

2.1. Experimental Materials and Design

The experiment was carried out in a greenhouse at Northwest A&F University (34°15′ N, 108°04′ E and 521 m elevation) in Yangling, Shaanxi Province, China. The study soil was taken from the 0–20 cm soil layer of local farmland. After being air-dried, the soil was ground to pass through a 2 mm seize. Then, the ground soils were filled into polyvinyl chloride pots (inner diameter = 16 cm and height = 40 cm) with a bulk density of 1.35 g cm−3. The physicochemical properties of the used soil are shown in Table 1.
Considering that sunflower has a salt tolerance threshold of 4.8 dS m−1 (ECe, electrical conductivity of saturated soil extract) with a 5.0% reduction in yield for each unit increase in salinity above this threshold [26], our targeted ECw (electrical conductivity of irrigation water) was set to 4 dS m−1 with an acceptable decline of 6% in yield (according to an ECe of 1.5 ECw, as reported by Ayers and Westcot [29]). As for the 4 dS m−1 solution, three different K/Na ratios were implemented: (i) P0S1 (K/Na ratio = 0:1), (ii) P1S1 (K/Na ratio = 1:1), and (iii) P1S0 (K/Na ratio = 1:0). A blank control with an ECw of 0.15 dS m−1 (CK, no salt added in tap water) was also set up (Table 2). Five pots (replicates) were prepared per treatment. The saline solutions were added to the pots by using capillary rise through small holes at the bottom, and the soil in the pots was kept at a constant water content by using a plastic pool around the pots in the greenhouse (Figure 1). To control environmental conditions between experiments, we utilized a standardized greenhouse setup with regulated temperature, humidity, and light intensity. Specifically, an automated temperature control system maintained the set temperature range for each experimental group. Humidity was managed through a scheduled fan and pad system, while light exposure was standardized using a timed artificial lighting system. Considering the problem of environmental homogeneity in greenhouses and ensuring randomization and eliminating the uneven distribution of the air among the treatments, the positions of the pots and pools were randomly changed every three days.
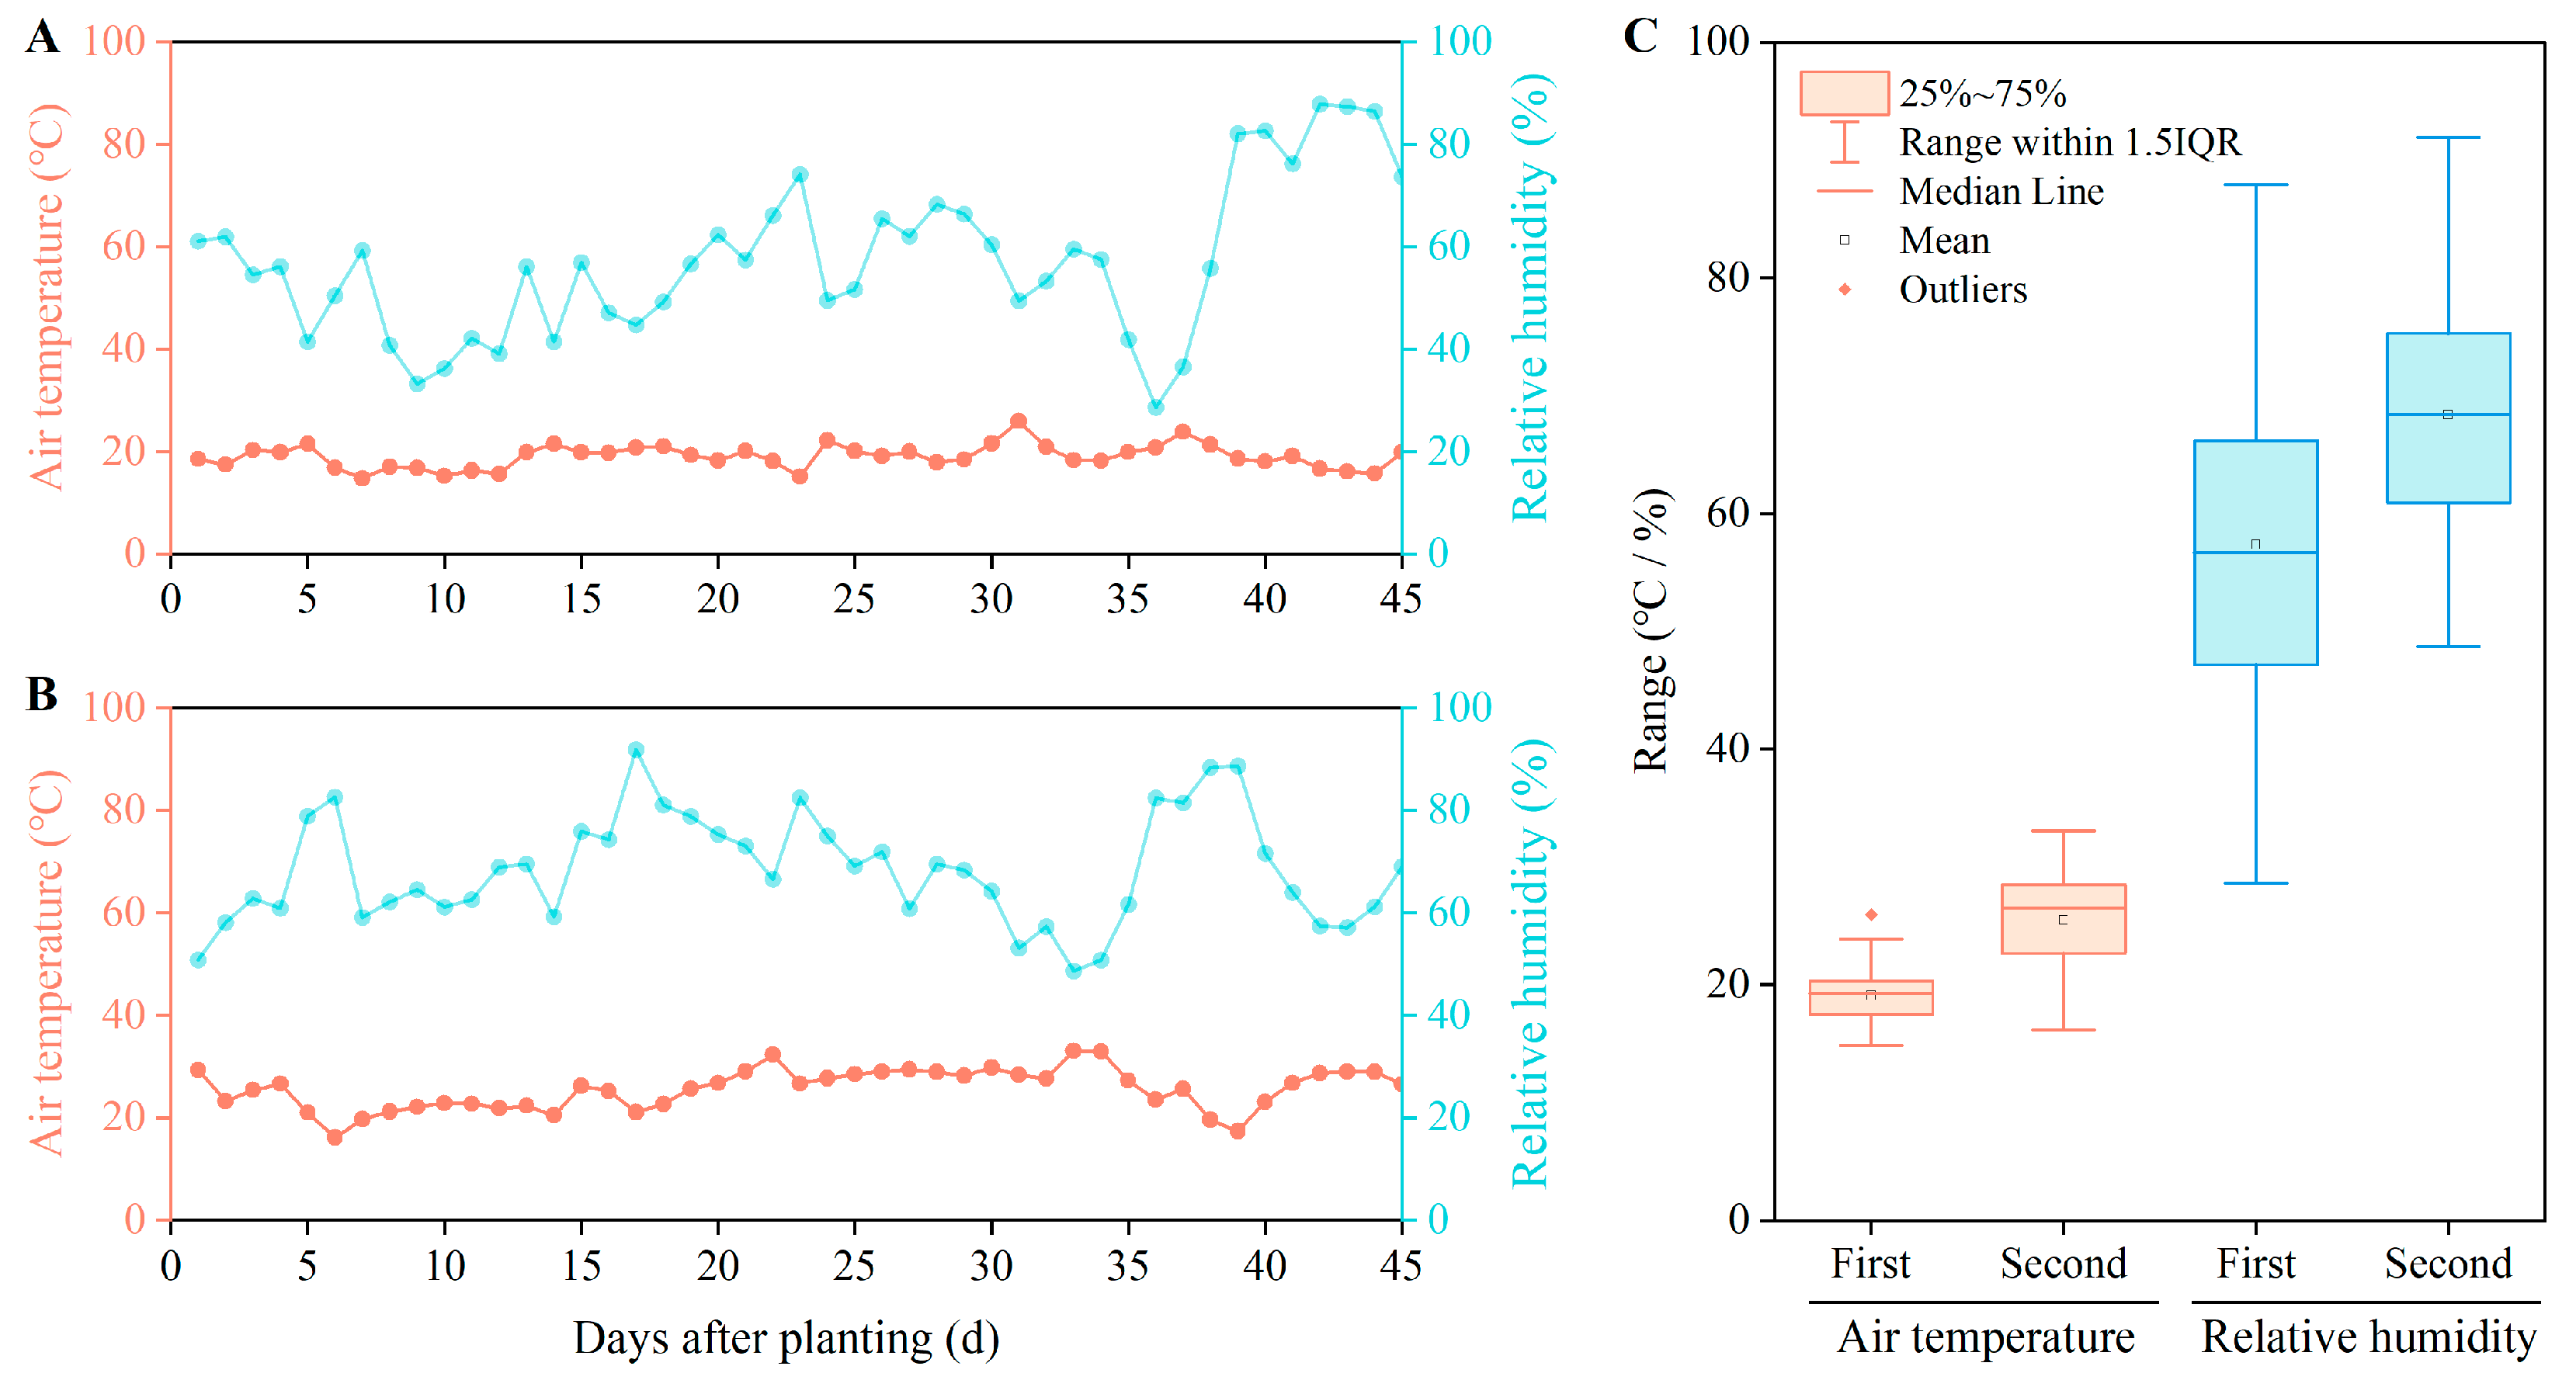
In the first batch experiment, the sunflower seeds (cultivar: AD6199) were sown (two plants per pot) on 13 March 2021 and harvested on 27 April 2021. During the first batch experiment, the average temperature and relative humidity were 19 °C and 58%, respectively (Figure 2). Then, the sunflower seeds were planted on 10 May 2021 and harvested on 24 June 2021 in the second batch experiment. During the second batch experiment, the average temperature and relative humidity were 25 °C and 68%, respectively (Figure 2). This means that both experiments were conducted for 45 days, i.e., the sunflower seedling stage.
In this study, no fertilizers were applied to any of the treatments, as the nitrogen (N) and phosphorus (P) requirements of sunflower seedlings were low. Therefore, the essential elements (N and P) were the same in all treatments. In addition, the applied concentrations of Ca and Mg in the saline solutions were larger than the swelling threshold concentration (>1 mmol L−1) (Table 2) defined by Quirk and Schofield [30] to avoid affecting permeability.

2.2. Data Collection

2.2.1. Study Soil Physicochemical Properties

Soil particle size distribution was determined by the Laser Mastersizer 2000 (Malvern Instruments, Malvern, UK). Extracts from saturated soil paste were used to measure ECe and pH [31]. The concentrations of Na+ and K+ were determined by using a flame photometer apparatus, and the concentrations of Ca2+, Mg2+, Cl, SO42−, CO32−, and HCO3 were measured by means of the titration method in saturated paste extract [31]. The SAR (sodium adsorption ratio) [31] and PAR (potassium adsorption ratio) [32] were calculated as follows:
S A R = N a C a + M g 2
P A R = K C a + M g 2
where the unit of each ion concentration is mmolc L−1 in (1) and (2).

2.2.2. Plant Height, Leaf Area, and Dry Mass of Sunflower

The plant height (PH) of sunflower was measured 12, 16, 18, 22, 25, 28, 31, 34, 37, 40, 43, and 45 days after sowing (DAS) in the first batch experiment and 13, 17, 21, 24, 27, 30, 33, 36, 39, 41, 43, 45 DAS in the second batch experiment. The height of each plant was measured using measuring tapes from the soil surface to the highest point of the plant. In addition, the leaf area (LA) of each plant was determined in the first batch of experiments on 25, 31, 37 and 45 DAS and in the second batch of experiments on 30, 39, 41 and 45 DAS. The length (LL) and the widest part (LW) of the leaves were measured by using measuring tapes. Leaf area = LL × LW × 0.65. Sunflowers were harvested at the end of the seedling stage, and then dry mass (DM) of the roots, stems, and leaves were measured. The plant organs were left in the oven (65 °C) until a constant weight was reached. The shoot/root ratio was calculated as follows:
S h o o t / R o o t = D M S t e m + D M L e a f D M R o o t
where DMStem, DMLeaf, and DMRoot are the dry masses of the roots, stems, and leaves, respectively.

2.2.3. Ion Absorption from Soil and Ion Transport in Different Sunflower Organs

After plant harvesting, the sampled sunflowers were divided into their roots, stems, and leaves. The organs were dried to a constant weight at 70 °C, and ground through a 1 mm sieve, adopting a plant disintegrator. The screened plant samples were extracted with H2SO4–HClO4–HNO3, and analyzed for their concentrations of K, Na, Ca, and Mg by an atomic absorption spectrophotometer (Hitachi Z-2000, Hitachi, Inc., Tokyo, Japan). Ion accumulation (IA) was determined as
I A = i = 1 n C i × D M i
where C is the concentration of the ion for each organ, DM is the dry mass for each organ, and i represents the roots, stems, and or leaves.
The selective absorption (SA) and selective transport (ST) coefficients of ion X (K, Ca, and Mg) displayed by the roots, stems, and leaves were calculated by referring to the methods of Flowers et al. [33] and Pitman [34]:
S o i l R o o t S A X / N a = R o o t X / N a S o i l X / N a
R o o t S t e m S T X / N a = S t e m X / N a R o o t X / N a
R o o t L e a f S T X / N a = L e a f X / N a R o o t X / N a
where X is expressed as the concentration of K, Ca, and Mg. The ionic concentrations in the soil at the end of the experiment are shown in Table S1.

2.2.4. Gas Exchange Parameters and Chlorophyll Concentration

At the end of the seedling stage, leaf photosynthesis was measured in five randomly selected sunflower plants from each treatment group, totaling 10 plants. Photosynthesis was measured using the youngest fully expanded leaf on the main stem. The gas exchange parameters of this leaf, consisting of transpiration rate (Evap, mmol H2O m−2 s−1), net photosynthesis (Pn, μmol CO2 m−2 s−1), stomatal conductance (gs, mol H2O m−2 s−1), and intercellular carbon dioxide concentration (Ci, μmol CO2 mol−1), were determined from 9:00 a.m. to 11:00 a.m. using a Li-6800 Portable Photosynthesis System (LI-COR, Inc., Lincoln, NE, USA). The leaf was exposed to light at an intensity of 1000 μmol m−2 s−1 with an ambient CO2 concentration of approximately 400 μmol mol−1. The settings of LI-COR measurement were as follows: the flow rate was set to 500 μmol s−1, the relative humidity (RH) was set to 65%, the fan speed was set to 10,000 rpm, and the temperature was set to 20 °C.
Stomatal limitation values (Ls) [35] and resource use efficiency, including the instantaneous water use efficiency (WUEi) [36], light use efficiency (LUE) [37], and CO2 use efficiency (CUE) [38] of the leaves, were calculated from the measured gas exchange parameters:
L s = 1 C i C a
W U E i = P n E v a p
L U E = P n P A R
C U E = P n C i
where Ca (μmol CO2 mol−1) is the air CO2 concentration and PAR (μmol photons m−2 s−1) is the photosynthetically active radiation
The chlorophyll concentration (μmol m−2) of the leaves was determined using an MC-100 (Apogee Instruments, Inc., Logan, UT, USA) at the end of the seedling stage. Five fully developed leaves were randomly selected in each treatment group and measured at the center of each leaf.

2.3. Data Analysis

All measured data were first checked for normality and homogeneity of variance using the Shapiro–Wilk test and Levene test. All observations met the normal distribution requirements, so no transformation was required in this study. SPSS 26.0 (https://www.ibm.com/products/spss-statistics (accessed on 13 May 2024)) was used for analysis of variance (ANOVA) of the data. Multiple comparisons of mean values and significant differences between treatments were determined based on the least significant difference (LSD0.05). The results are presented as the mean ± standard error (SE). Statistical significance was determined at the 5% probability level (p < 0.05). The correlation analysis of the K/Na ratio, ion concentration of K, Na, Ca, Mg, and Cl in crop organs, gas exchange parameters, PH, LA, and DM was performed using the “Corrplot” package in R [39].

3. Results

3.1. Plant Height, Leaf Area, and Dry Matter of Sunflower Seedling

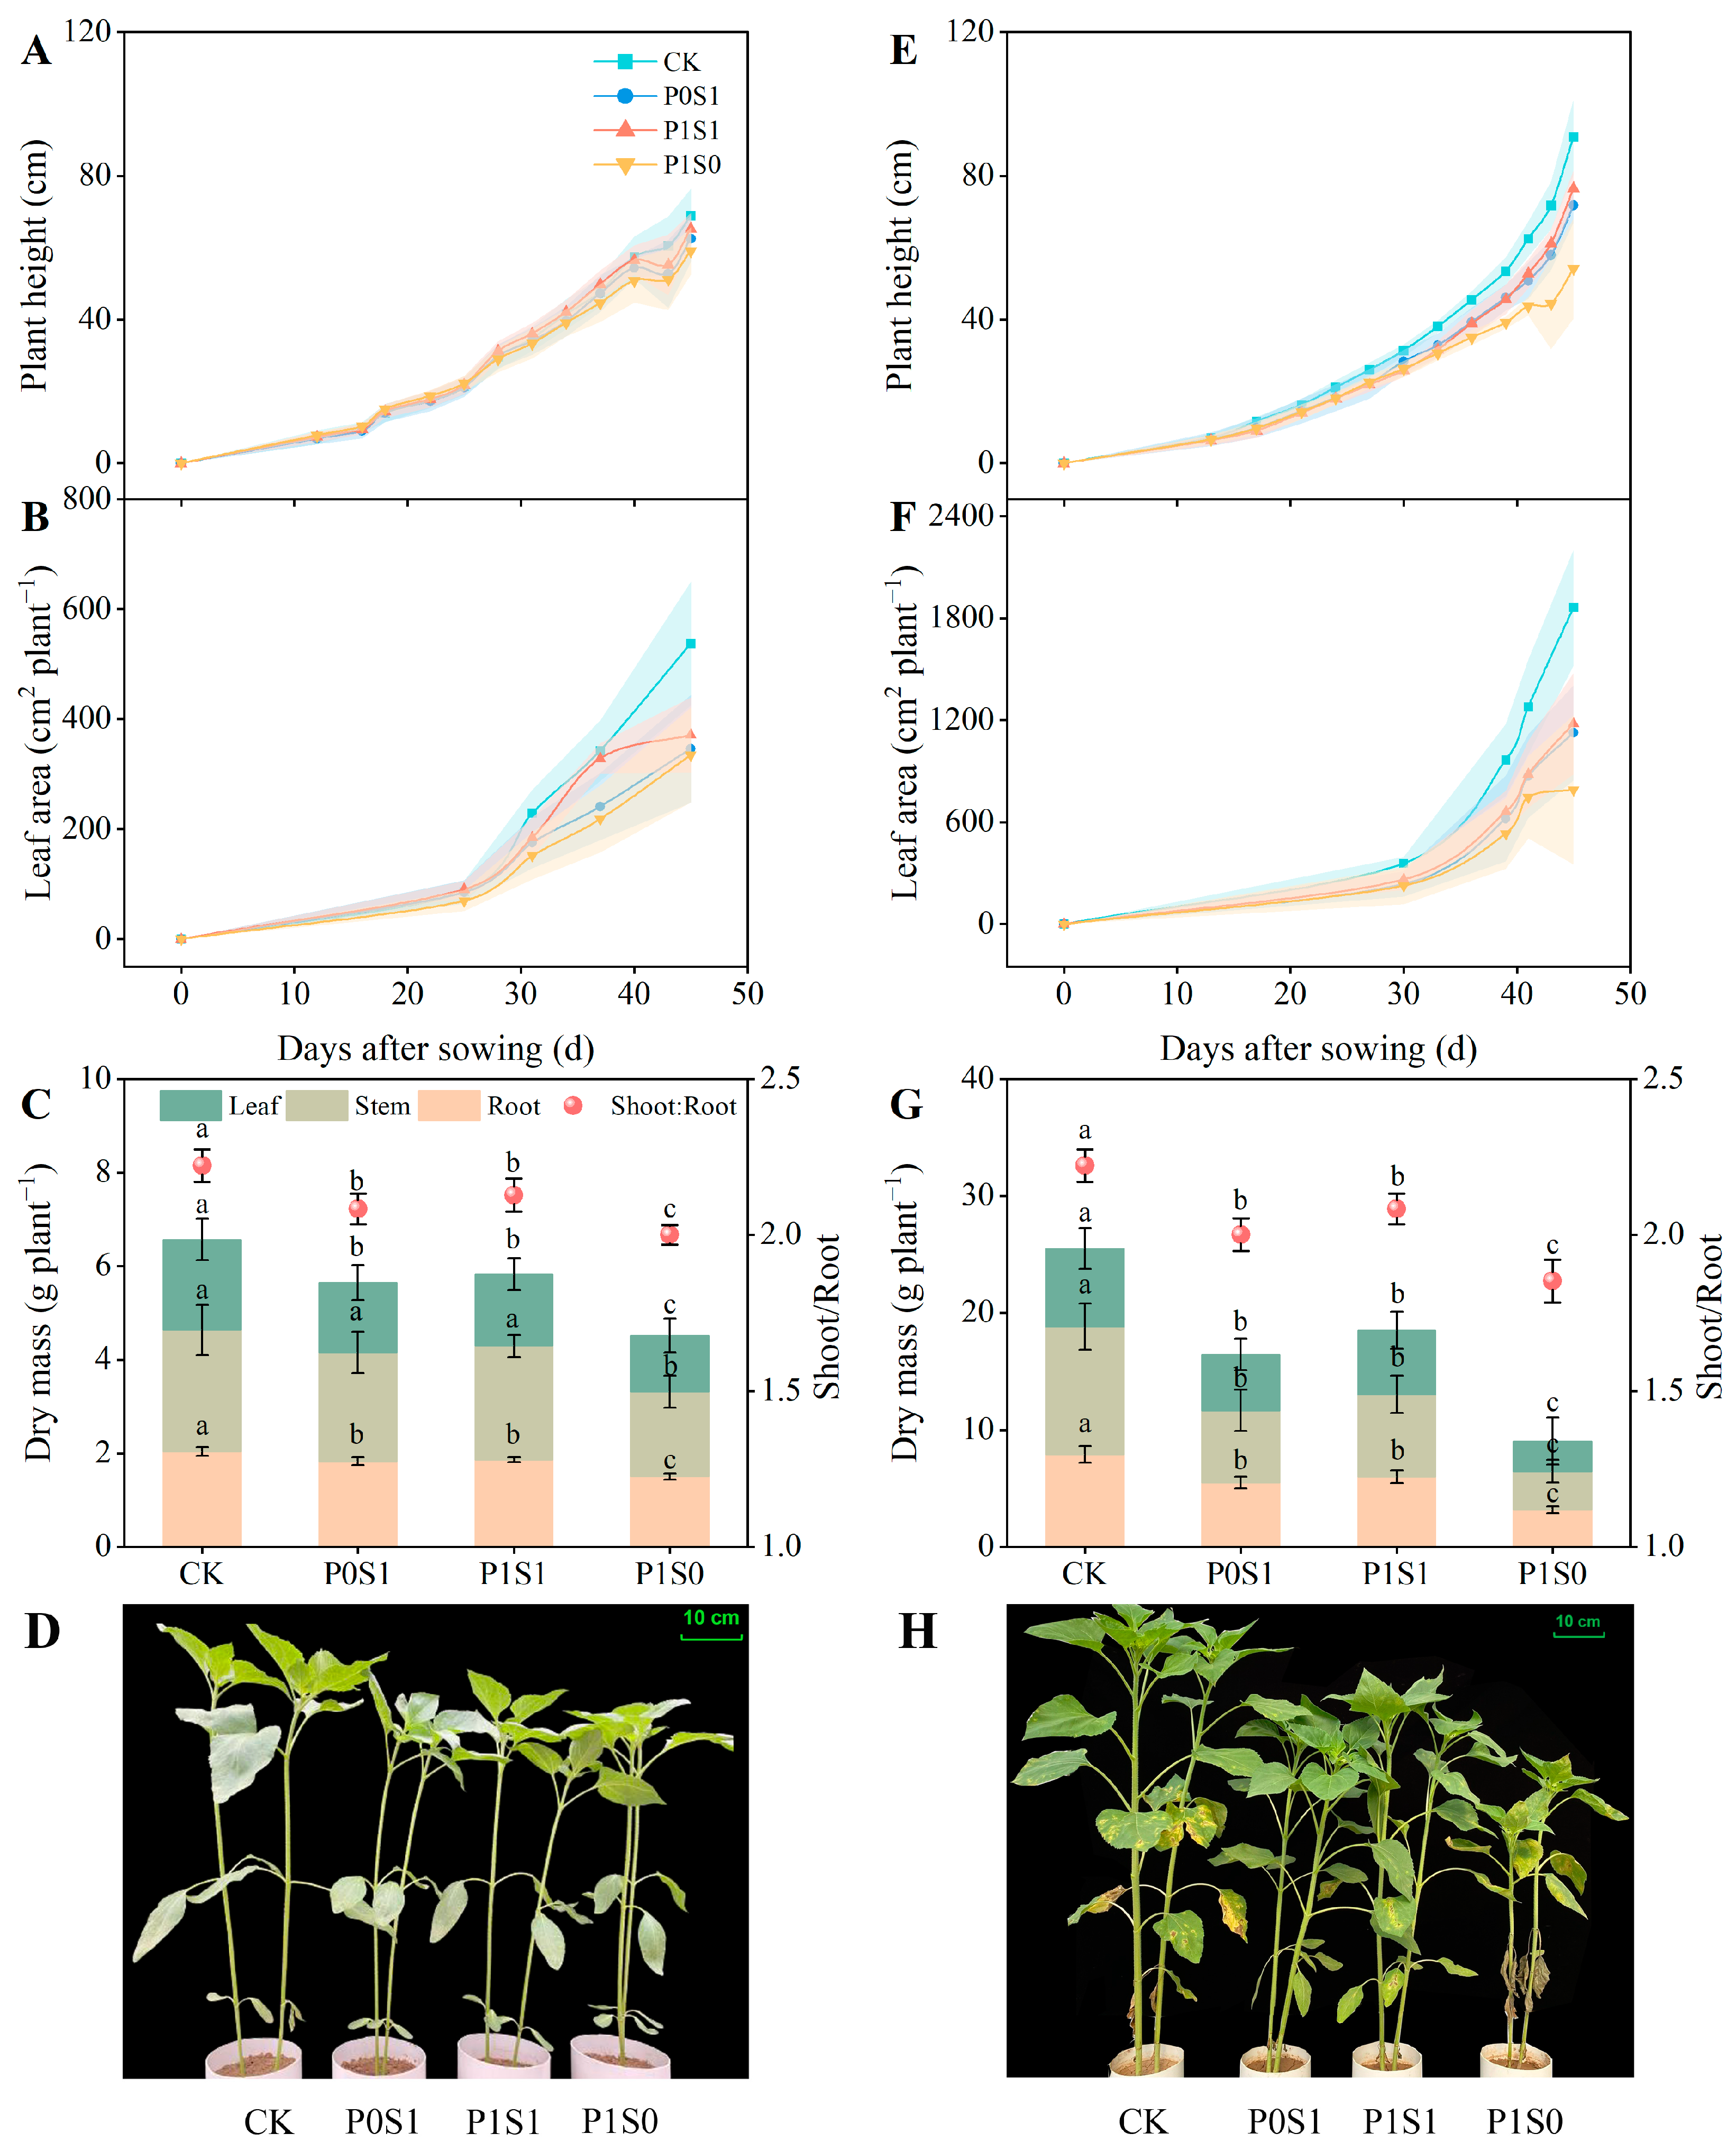
The K/Na ratio significantly affected the plant height, leaf area, and dry mass of sunflower plants at the seedling stage (Figure 3). There was no significant difference (p > 0.05) in plant height between different K/Na ratio treatments and CK in the first batch experiment, which might be due to the short duration. The P1S0 treatment significantly decreased plant height by 14% compared to the CK at the end of the second batch experiment, while there was no significant difference (p > 0.05) between P0S1 and P1S1 (Figure 3E). The leaf area of CK was significantly higher than that of the different K/Na ratio treatments in both batch experiments. There was no significant difference in leaf area under different K/Na ratios in the first batch experiment, while the leaf area of P1S0 was significantly reduced by 30% and 33% compared to P0S1 and P1S1 at the end of the second batch experiment, respectively. The highest dry matter and shoot/root ratio were determined in CK. For different K/Na ratio treatments, the dry mass and shoot/root ratio of P0S1 and P1S1 were significantly higher than those of P1S0 in both batch experiments.

3.2. Ion Concentration and Accumulation in Sunflower Seedling

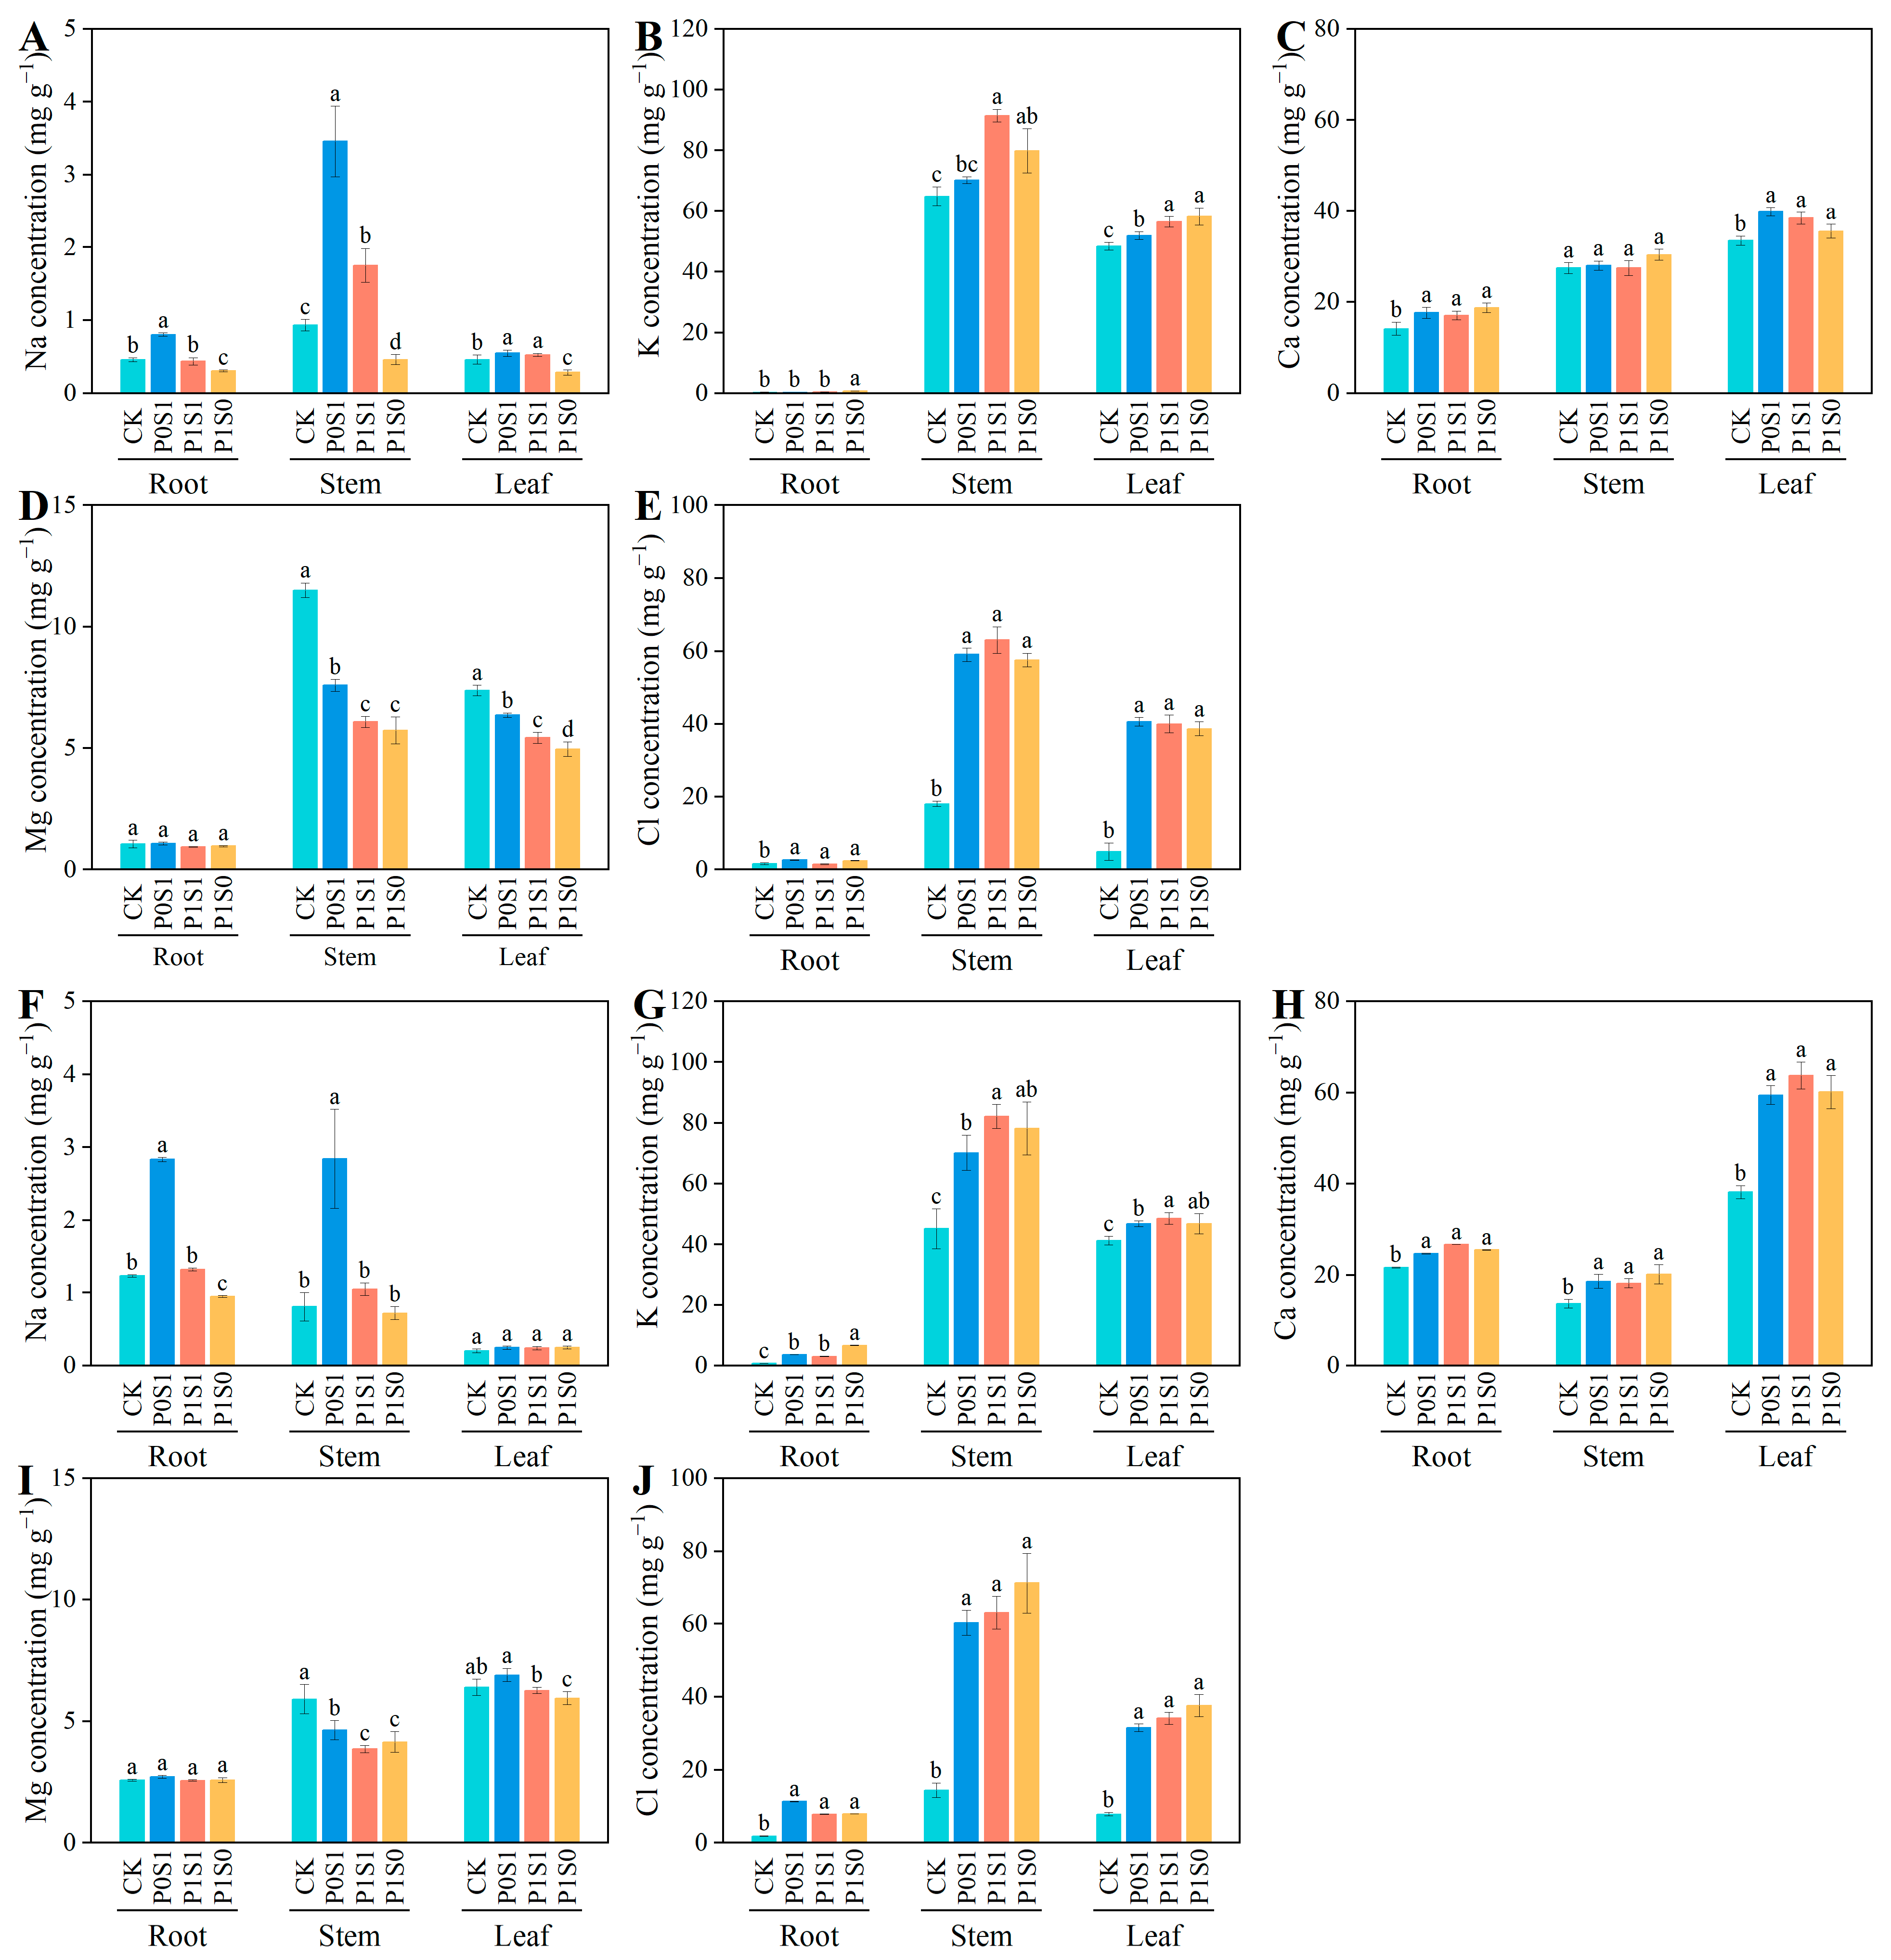
The organ ion concentration in sunflower seedlings was significantly affected by the different K/Na ratio treatments (Figure 4). With an increasing K/Na ratio, the Na and K concentration in the roots, stems, and leaves gradually decreased and increased, respectively. It is worth noting that there was no significant difference in the Na concentration in the leaves between the different K/Na ratios and CK in the second batch experiment (p > 0.05). In addition, the P0S1, P1S1, and P1S0 treatments significantly increased leaf Ca concentration by 39%, 42%, and 34%, respectively, compared to CK, while there was no significant difference between different K/Na ratios (p > 0.05). With an increasing K/Na ratio, the Mg concentration in the stems and leaves gradually decreased, and there was no significant difference in the roots (p > 0.05). The P1S0 treatment on average significantly decreased leaf Mg concentration by 21% compared to CK. The Cl concentration of different K/Na ratios was significantly greater than that of CK, but there was no significant difference between different K/Na ratios.
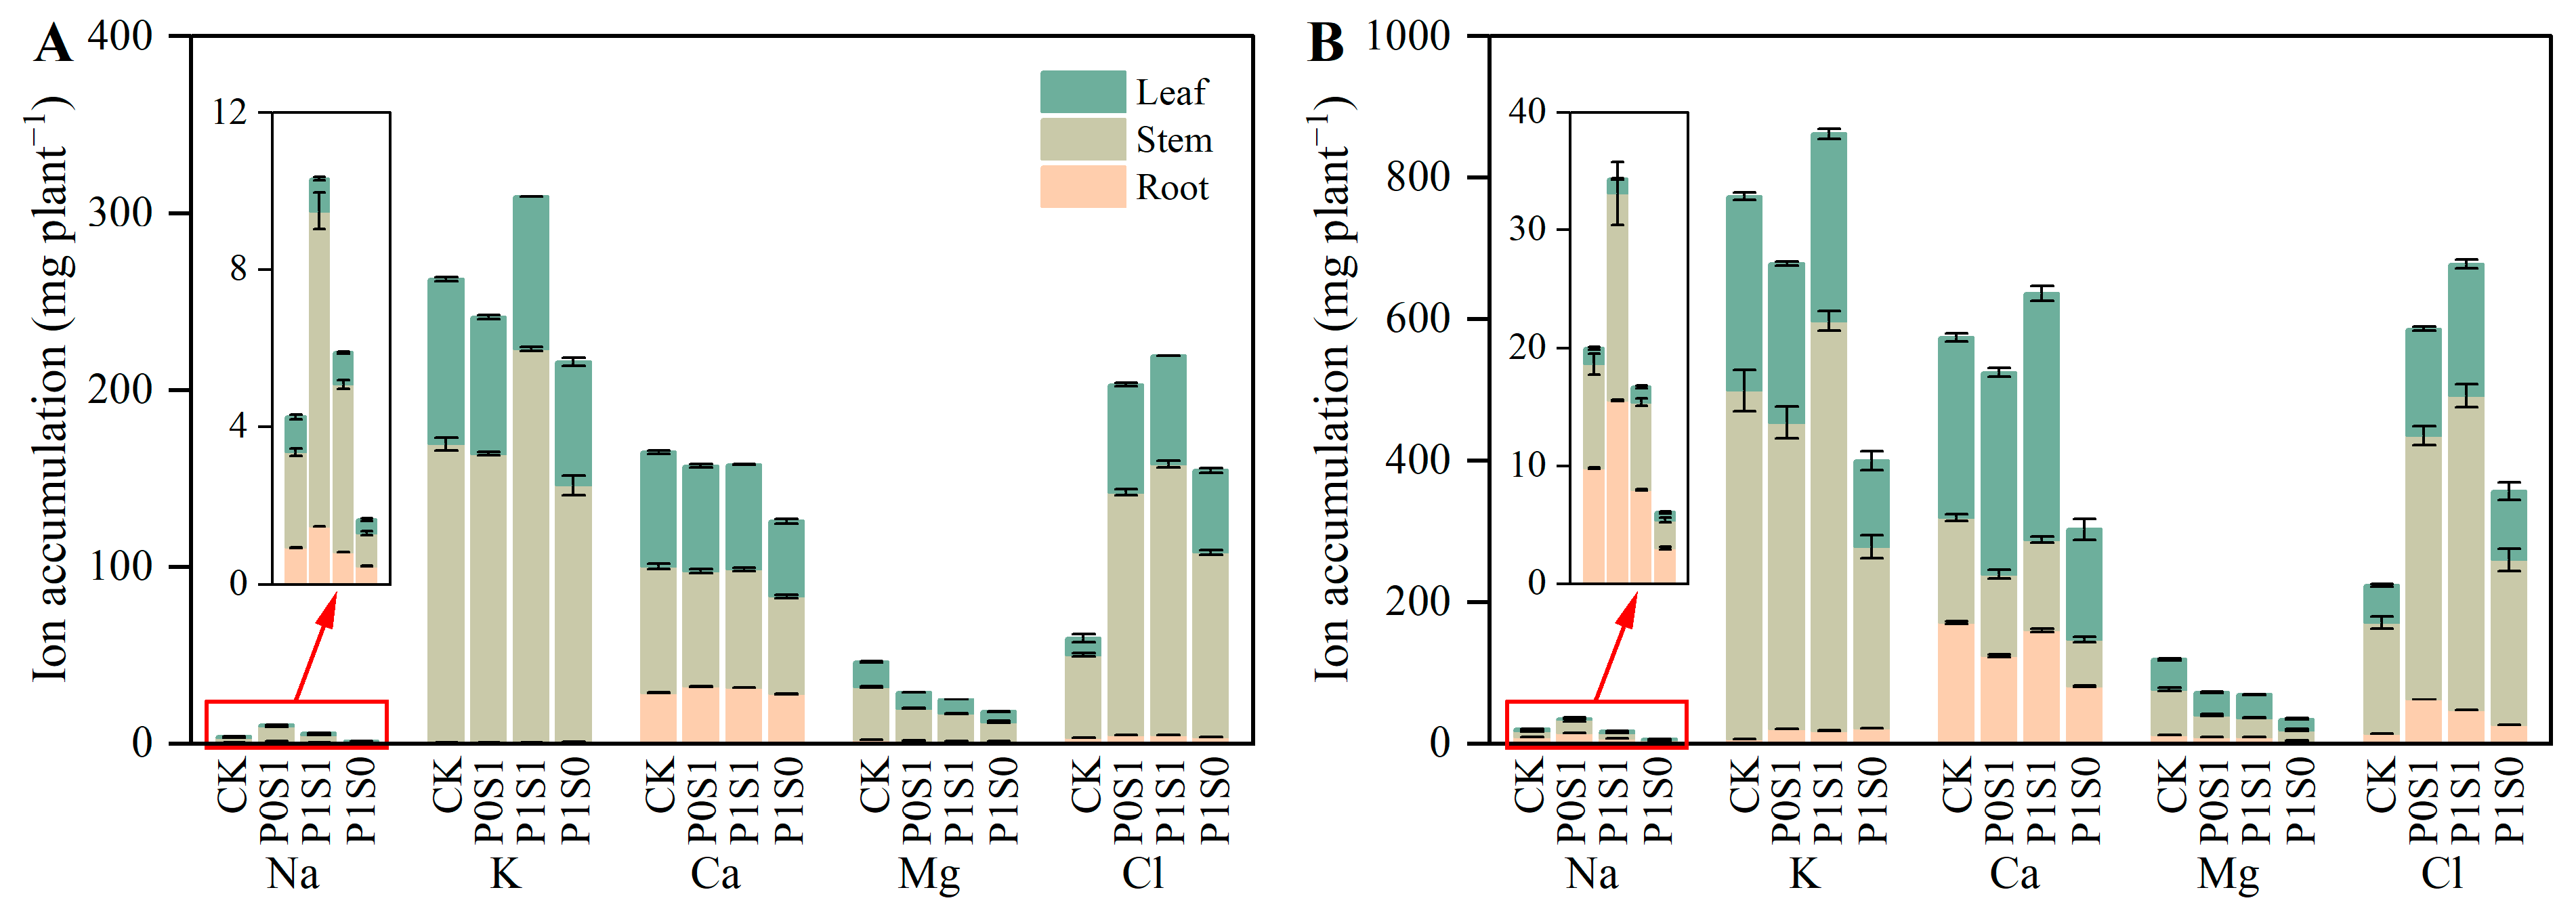
The K/Na ratio significantly affected ion accumulation in plant organs at the seedling stage (Figure 5). The minimum ion accumulation was always recorded in P1S0, resulting from the reduced dry mass. Na was mainly accumulated in roots and stems, and Na accumulation in the roots, stems, and leaves gradually decreased with the increasing K/Na ratio. The maximum K, Ca, and Cl accumulation was always measured in P1S1, except for Ca in the first batch experiment. The P0S1, P1S1, and P1S0 treatments significantly decreased Mg accumulation by 38%, 44%, and 67%, respectively, compared to CK.

3.3. Cation Selective Absorption and Transport in Sunflower Seedling

The selective absorption (SA) and selective transport (ST) of cations were significantly affected by different K/Na ratios (Table 3). The greater the values of SA, the better the roots’ selective absorption ability for K, Ca or Mg. Compared with the CK, the P1S0 treatment significantly decreased selective absorption ability for Mg by 74% and 84%, respectively. In addition, the higher the values of ST, the better the selectivity transport ability of K, Ca or Mg from the roots to the stem or from the roots to the leaves. Different K/Na ratio treatments significantly reduced the selectivity transport ability of K and Mg from the roots to the stem compared with CK. There was no significant difference (p > 0.05) in STCa/Na from the roots to the stem between different K/Na ratio treatments and CK. The P0S1 treatment significantly increased STK/Na, STCa/Na, and STMg/Na from the roots to the leaves compared with other treatments. The lowest STK/Na and STMg/Na values from the roots to leaves were observed in P1S0, which were 70% and 36% lower than those for CK, respectively.

3.4. Gas Exchange Parameters and Chlorophyll Concentration in Sunflower Leaves

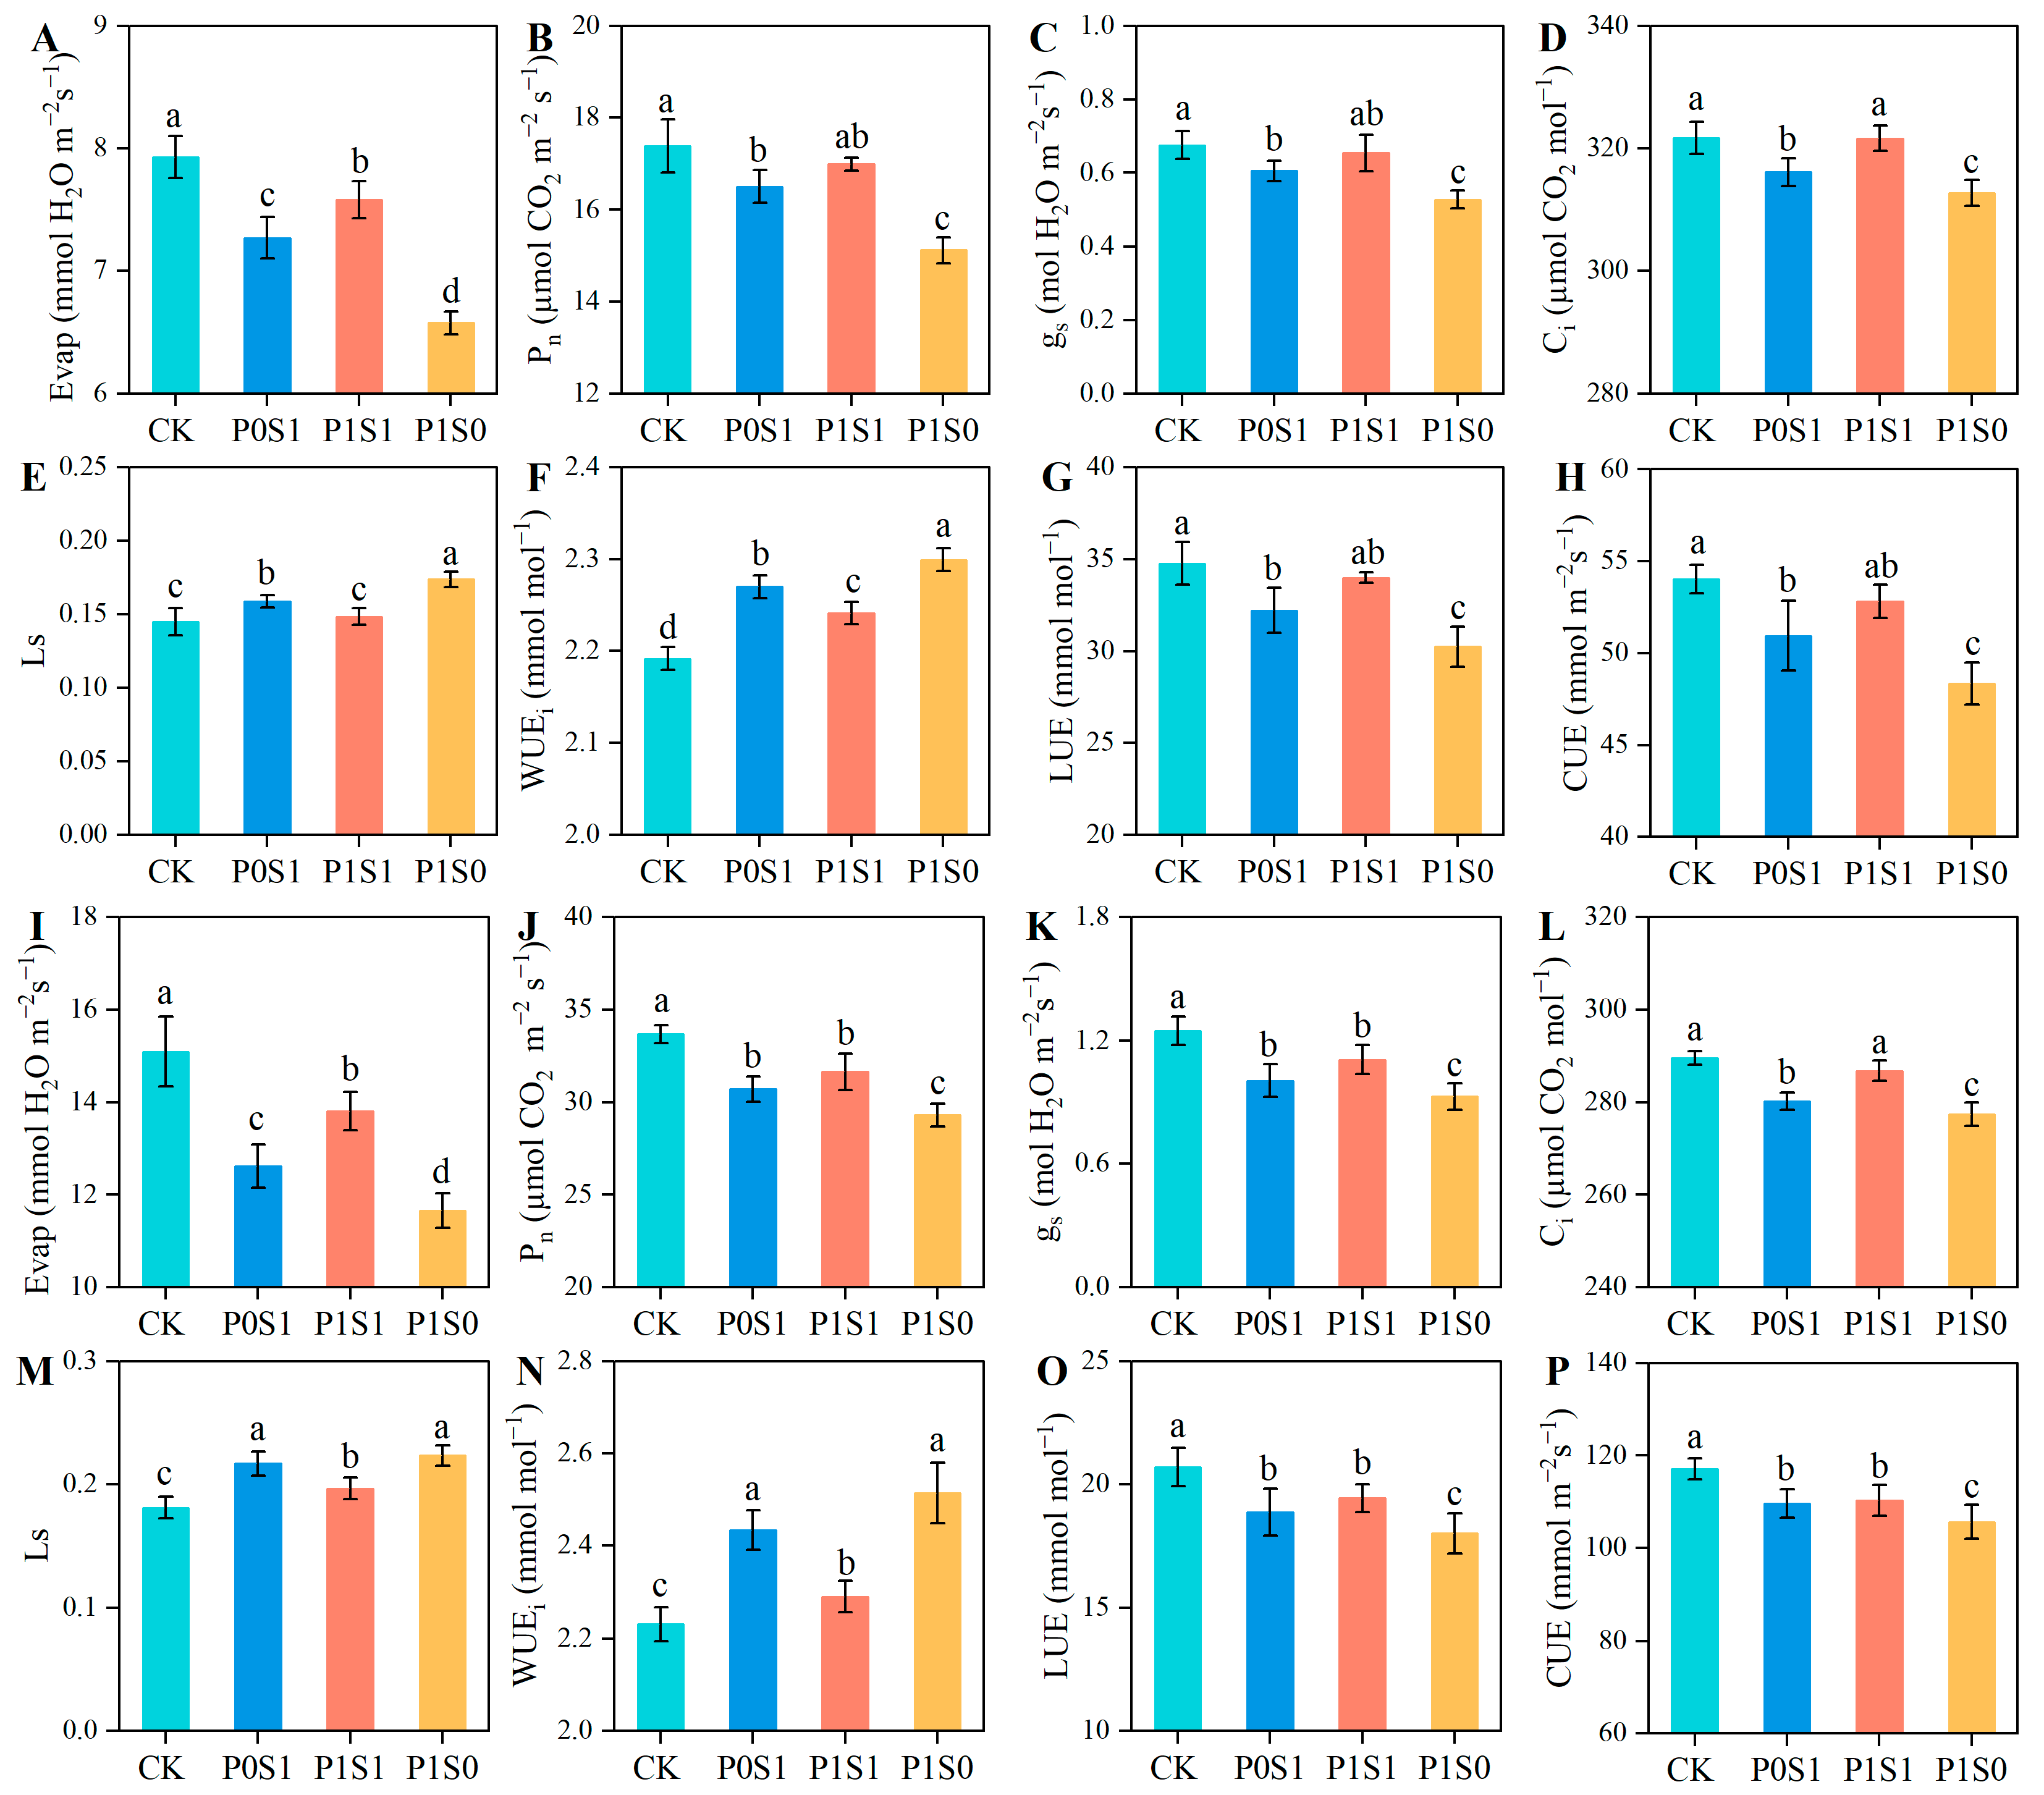
Different K/Na ratio treatments significantly affected the gas exchange parameters of sunflower leaves (Figure 6). The biggest and smallest Evap, Pn, gs, and Ci values were measured in CK and P1S0, respectively. Compared with P0S1, P1S1 significantly increased the Evap by 6.8% and Ci by 2.1%, while there was no significant difference in Pn and gs. Ls is used to characterize the reduction in Ci caused by the decrease in gs and the resulting effect on Pn. The largest Ls was always determined under the highest K/Na ratio, and CK always produced the smallest Ls. Compared with the P0S1 and P1S1 treatments, the P1S0 treatment significantly increased WUE by 2.3% and 6.2%, respectively. In addition, with the increasing K/Na ratio, LUE and CUE decreased. In addition, compared with CK, the P0S1, P1S1, and P1S0 treatments significantly decreased chlorophyll concentration by 3.9%, 2.3%, and 9.0%, respectively (Table 4).

3.5. Correlation of K/Na Ratio, Ions Concentration, Gas Exchange Parameters, and Growth Indicators

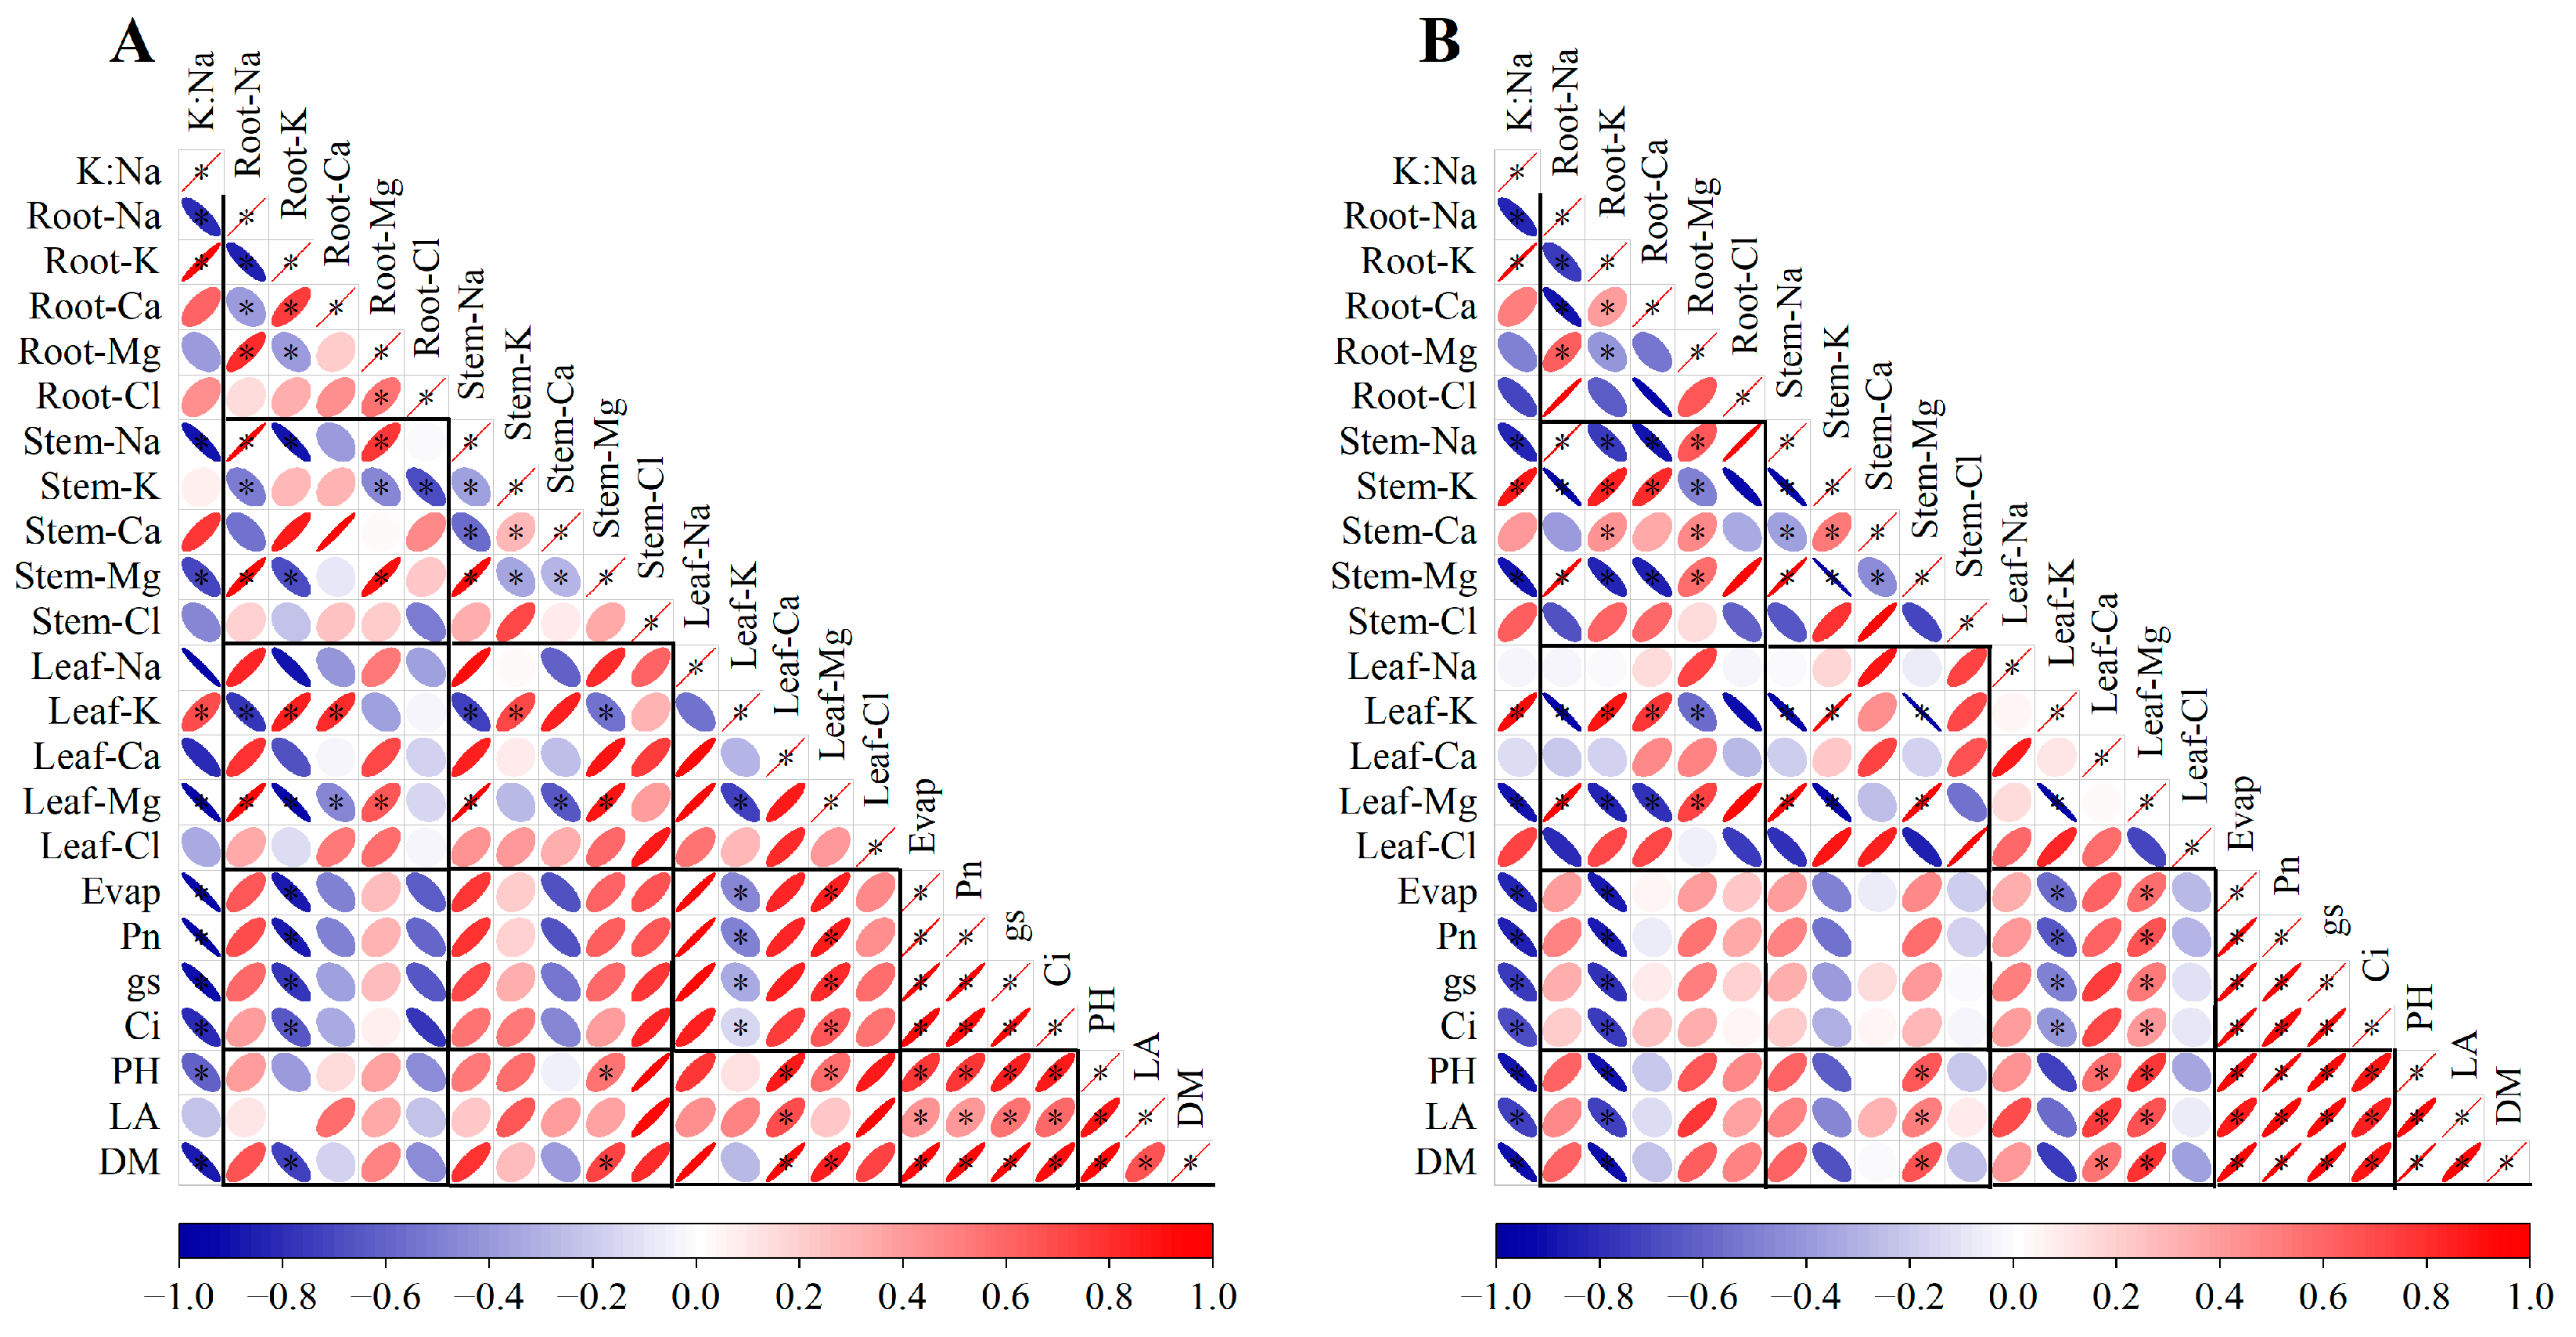
The K/Na ratio was significantly negatively correlated with Root-Na (Na concentration in the roots), Stem-Na, Stem-Mg, Leaf-Na, Leaf-Mg, gas exchange parameters (Evap, Pn, gs, Ci), and growth indicators (PH, LA, and DM), while it was significantly positively correlated with Root-K, Stem-K, and Leaf-K (Figure 7). Remarkably, the K/Na ratio is not significantly correlated with Leaf-Na. In addition, Leaf-K had a significant negative correlation with gas exchange parameters, while Leaf-Mg displayed the opposite trend. There was no significant correlation between Leaf-Na and Leaf-Ca and gas exchange parameters (p > 0.05). Undoubtedly, the gas exchange parameters were significantly positively correlated with crop growth indicators (p < 0.05). Furthermore, the Cl concentration of all organs showed no significant correlation with gas exchange parameters and growth indicators. This indicated that the concentration of Cl in all organs did not reach a level harmful to crops

4. Discussion

Na+ is the main cause of ion-specific damage under salinity stress for many higher plants [40]. However, the overapplication of fertilizers, particularly potassium fertilizer, is very common in greenhouse production in China. Bai et al. [41] found that the exchangeable K content in the topsoil was at a high level in greenhouses after five years of cultivation. Therefore, it is crucial to systematically evaluate the effect of the K/Na ratio, especially for excessive K/Na ratios, on sunflower seedlings.

4.1. Effects of K/Na Ratios on Ion Absorption and Transport

In this study, we found that the concentration and accumulation of K were significantly greater than those of Na in the roots, stems, and leaves for all treatments (Figure 4 and Figure 5). This might be due to plants generally not being able to tolerate cytoplasmic Na+ concentrations greater than 40 mM [40,42]. In contrast, because of the important function of K in enzyme activation, charge balance, and osmoregulation, the cytoplasmic K+ concentration is strictly regulated around 100–200 mM [43]. This consistency is thought to arise from the operation of subtle feedback systems that enable plants to respond to environmental fluctuations in a homeostatic manner [7]. In addition, our results show that an increased K/Na ratio significantly raised the K+ concentration in the roots, stems, and leaves and lowered the Na+ concentration in the roots and stems. In addition, no significant difference in leaf Na concentration was observed with an increasing K/Na ratio. This revealed that the main strategy employed by sunflower seedlings to cope with salinity stress caused by different K/Na ratios was to store the absorbed Na in the roots and stems to prevent excessive Na+ from entering the leaves. This could be attributed to (i) the antagonism of K and Na at sites of uptake in the roots and (ii) the effect of K on Na’s transport into the xylem or the inhibition of uptake processes [44]. Therefore, K+ was more readily absorbed and accumulated in the plant compared to Na+, which caused excessive K+ to impede crop growth under the higher K/Na ratio.
In addition, our results indicate that there were no significant differences in the Ca2+ concentration of the roots, stems, and leaves at different K/Na ratios, whereas the Mg2+ concentration in the stems and leaves was significantly reduced with the increasing K/Na ratios (Figure 4). This demonstrates that there was strong competition between K+ and Mg2+ for the transportation sites in the non-selective cation channels (NSCCs) and/or transporters [45]. In addition, our results indicate that SA (SACa/Na, and SAMg/Na) from the soil to the roots and ST (STCa/Na, and STMg/Na) from the roots to the leaves for the P1S0 treatment were significantly decreased compared with the P0S1 and P1S1 treatments. This suggests that the selectivity for Ca2+ and Mg2+ uptake and transport in sunflower was reduced under the salt stress caused by a higher K/Na ratio. The reduced selectivity level for Ca2+ and Mg2+ could be attributed to the following mechanisms: (i) Various cations (Na+, K+, Ca2+, and Mg2+) enter the root system through NSCCs. There is competition between cations when passing through this channel [46]. The NSCCs maintain a greater number of high-affinity K+-selective sites [47]. Therefore, K+ has stronger competition with Ca2+ and Mg2+ compared with Na+, which is responsible for the reduced selectivity of Ca2+ and Mg2+ uptake in P1S0 treatment. (ii) The transport of Ca2+ and Mg2+ mainly occurs in the xylem, which is driven by transpiration [23]. In this study, the P1S0 treatment significantly decreased crop transpiration rate (Evap) compared with the other treatments (Figure 6A,I), which may explain the lower selectivity for Ca2+ and Mg2+ transport determined in sunflower under a higher K/Na environment.
Although the SA and ST of Ca2+ and Mg2+ were significantly reduced in the P1S0 treatment, we only observed a significant reduction in Mg2+ concentration at the organ level. This may be related to the NSCCs of sunflower showing a much weaker response to extracellular Ca2+ in the range (0.2–2 mM) of physiological Ca2+ levels (1.125 mM in this study) [48]. Therefore, Mg deficiency caused by ion competition during the plant’s growth was another reason for the poor growth performance [49] under a higher K/Na ratio (P1S0). This is consistent with the research results of Ding et al. [50]. Their results showed that excessive K supply can exacerbate Mg deficiency and a Mg concentration below 1.1 g kg−1 DM in the shoot resulted in a decrease in rice dry matter. Li et al. [51] indicated that Mg concentrations and uptake in the shoots of tomato were significantly lower under high-K treatment (468 mg·L−1) compared with CK (156 mg·L−1). Our results also found that dry matter under the P1S0 treatment was significantly decreased. This could be attributed to the following mechanisms: (i) Mg deficiency decreased H+-ATPase activity within the plasma membrane in cells within the sieve tube, which resulted in dysfunction of the phloem and (ii) the transportation of sugars from source leaves to the sink (i.e., new leaves) decreased due to dysfunction of the phloem, thereby reducing dry matter [52]. Therefore, excessive K+ inhibited the uptake and/or transport of divalent cation (Ca2+ and/or Mg2+) [7,23].
Cl is an critical nutrient for crops, but its overaccumulation can result in ionic toxicity as much as that caused by excessive Na+ [53]. Our results suggest that there was no significant difference in Cl concentration among treatments. Normally, the Cl concentration in plant leaves is 50–200 mg kg−1, but some plants may contain up to 20,000 mg kg−1 without adverse effects [54,55]. In this study, the Cl concentration of all organs treated with different K/Na ratios was significantly greater than that of CK, but there was no significant difference between different K/Na ratios treatments, due to the same external Cl concentration. This demonstrates that Cl causes damage to crops, but this effect may be the same for the different K/Na ratios treatments.
It is worth explaining that the adverse effects on sunflower seedling growth were mainly due to ions’ concentration rather than accumulation. Munns et al. [56] found that a decrease in plant growth was attributed to an increase in salt concentration to toxic levels. The accumulation of ions under the P1S0 treatment was significantly lower than that under the other treatments (Figure 5), due to it having the lowest dry matter. Therefore, we discussed the effects of different K/Na ratios on the morphology and photosynthetic characteristics of sunflower seedlings from the perspective of ion concentration. As elaborated above, an excessive K+ concentration inhibited the uptake and transport of Mg2+, and consequently the leaf Mg2+ concentration was significantly reduced.

4.2. Effects of K/Na Ratios on Crop Photosynthesis and Growth

Chlorophyll is the most important plant pigment involved in photosynthesis [57]. Our results indicate that chlorophyll concentration was significantly reduced in the P1S0 treatment (Table 4), mainly due to the reduced leaf Mg concentration (an essential constituent of chlorophyll). Jayaganesh and Senthurpandian [58] demonstrated that the overapplication of K resulted in a 50% reduction in the chlorophyll content of tea tree. Our results indicate that the Pn of P1S0 was significantly decreased compared with the other treatments. This was due to the decreased gs and Ci, resulting in a decreased Pn, thereby increasing Ls [59]. The findings of Liu and Shi [60] are in agreement with our results that the significant reduction in leaf Pn in sunflower under salt stress was accompanied by a decrease in gs and Ci. Furthermore, there was a significant negative correlation between the gas exchange parameter values and K concentration in the leaves (Figure 7). This was attributed to the fact that K contributes to the photosynthesis process by activating ATPase, while the performance of ATPase is best only when the K concentration in the plant is at an optimum level [61]. Additionally, the WUEi is defined as the ratio of Pn to Evap. Our results show that WUEi in the P1S0 treatment was significantly increased compared with CK, which is mainly due to the decrease in Evap being greater than that of Pn, i.e., Evap was reduced by 20% and Pn by 13% in the P1S0 treatment compared with CK. This may be attributed to the fact that plants reduce transpiration by regulating stomatal opening and closing, thus reducing the effects of a high potassium concentration. The LUE and CUE under the P1S0 treatment were significantly reduced, which also confirmed the effect of a higher K/Na ratio on sunflower seedling growth as being more harmful at the same concentration.
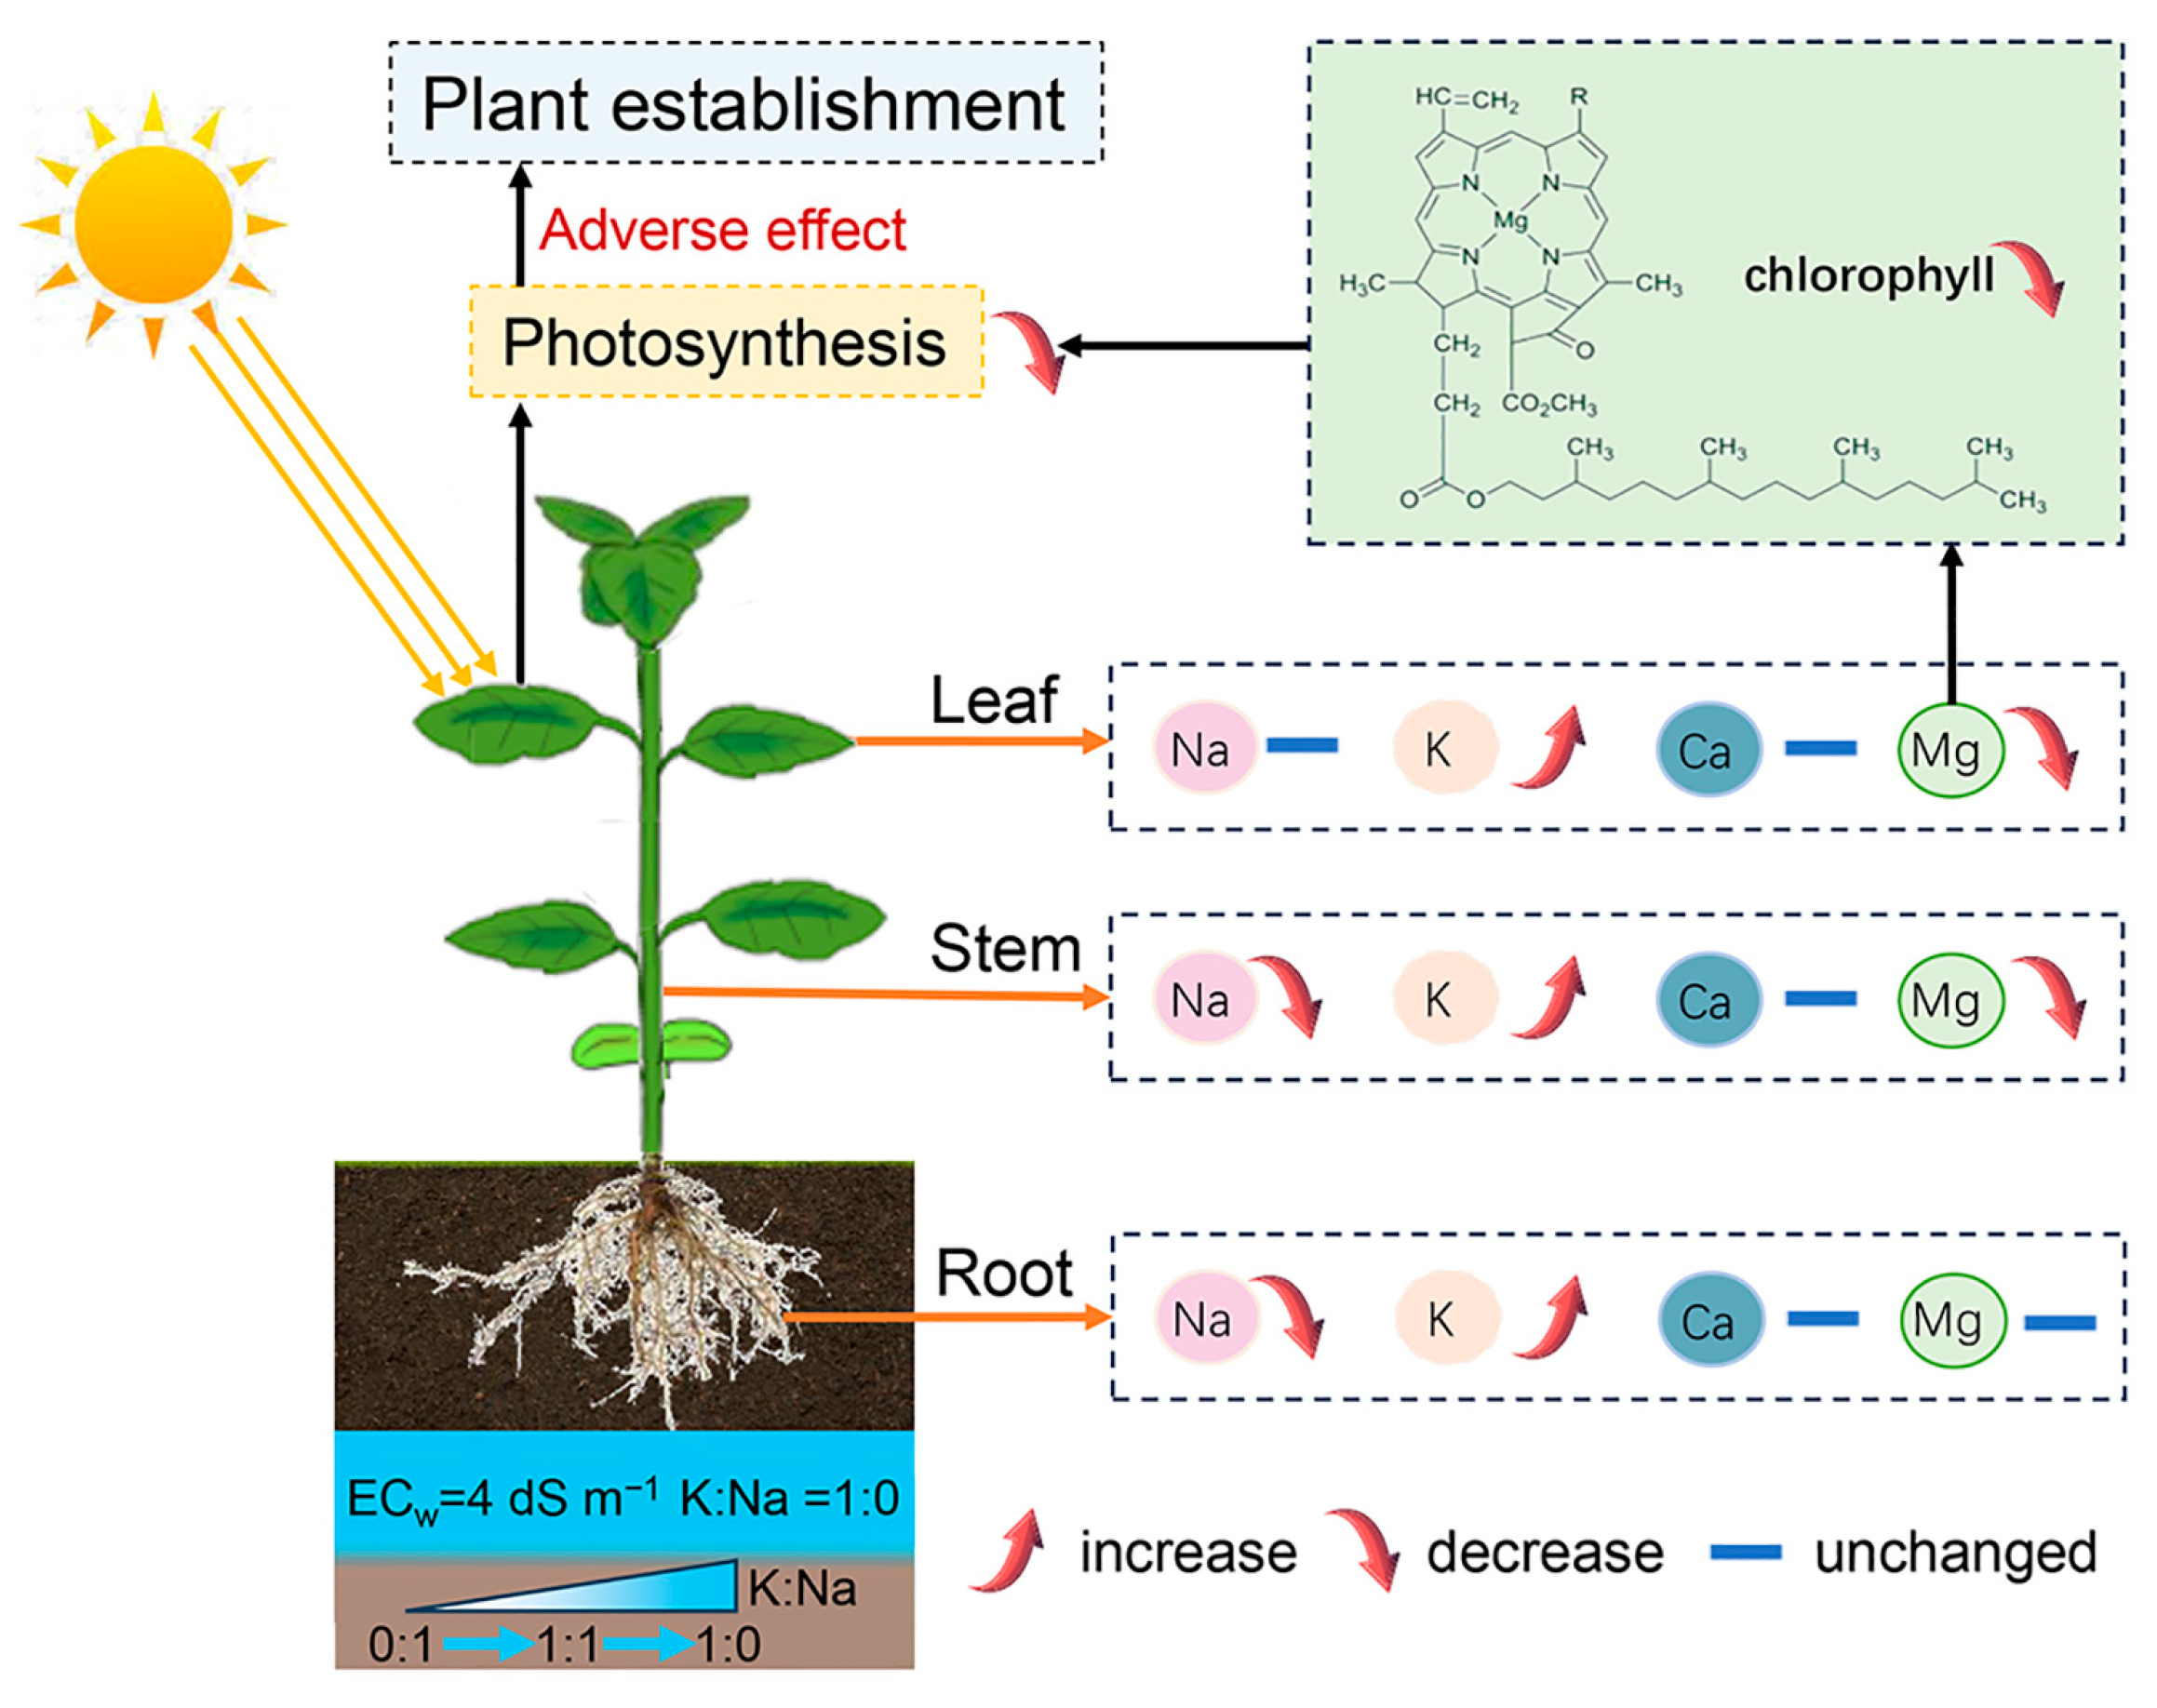
In this study, our results indicate that an excessive K/Na ratio (P1S0) was more detrimental (lower plant height, leaf area, dry matter, and shoot/root ratio) to sunflower seedlings than Na+ at the same concentration (EC = 4 dS m−1) (Figure 3). This observation was supported by previous studies stating that excess K+ caused more severe stress symptoms compared with Na+ [5,23]. A high level of K under the P1S0 treatment inhibit Mg uptake, reducing chlorophyll concentration, and this led to a reduction in the Pn, which in turn inhibited plant growth [62]. In addition, the P1S0 treatment significantly reduced the shoot/root ratio, which was probably due to a larger fraction of the water and nutrients being taken up and retained in the roots when any factor in the water or nutrients limited growth [63]. Therefore, in this study, an excessive K/Na ratio caused a ion imbalance and reduced photosynthesis, thereby further hindering seedling establishment. Mg deficiency induced by ion competition and an excessive K concentration are the main reasons for the more serious stress on sunflower seedlings under a higher K/Na ratio. Meanwhile, the chlorophyll concentration, photosynthetic performance (Pn and Evap), LUE, and CUE of sunflower seedlings were significantly reduced, which in turn hindered crop growth (Figure 8). In addition, the growth and photosynthetic performance of sunflower seedlings in the second batch experiment were improved compared with those in the first batch experiment, whereas the differences between the treatments were more significant (Figure 3 and Figure 6), which was obviously due to better environmental conditions (higher air temperature and relative humidity, Figure 2) during the second batch experiment.
In addition, changes in the ionic composition of soil solutions may affect soil structure and water infiltration, which in turn affects water uptake and plant establishment [22]. In general, the ECw (salinity) and SAR (sodium adsorption ratio) of irrigation water are combined to assess the effects of irrigation water quality on soil physical structure and water infiltration (Table S2) [29]. However, the SAR only considers the effects of Na+, Ca2+, and Mg2+ on soil structural properties and ignores the role of K+. The potassium adsorption ratio (PAR) can be used to evaluate the effect of K+ on soil infiltration performance [32]. Smith et al. [64] found that K+ disperses about one-third as much as Na+ in the soil, and that K+ accumulation decreases the soil’s saturated hydraulic conductivity and reduces the number of soil macropores. Buelow et al. [65] investigated the effect of irrigation water with different PAR values on the soil’s hydraulic conductivity (Table S3). Comparing the SAR and PAR of the solution in plastic pools after harvest with the previous assessment of SAR or PAR thresholds affecting soil infiltration or hydraulic conductivity, the results indicate that the SAR in our study did not or only slightly affected soil infiltration, but the PAR in the P1S0 treatment may pose a major threat to soil hydraulic conductivity (Table S4). Liang et al. [66] found that exchangeable Mg2+ was easily replaced by K+, and the accumulation of K+ in the field led to a decrease in the concentration of Mg2+, and a high concentration of exchangeable K+ may have a potential negative effect on the stability of the soil structure. This may also be one of the reasons for the poorer growth performance of the P1S0-treated plants.

4.3. Optimal K/Na Ratio to Promote Plant Establishment

An optimal K/Na ratio is crucial for maintaining plant establishment and even yield development [19]. Farahani et al. [22] reported that increasing the K/Na ratio under the same EC increased plant-available water in the studied soil, with positive effects on maize growth. This may be attributed to the fact that the K concentration in these plants did not reach the harmful level. Higher K levels (adequate but not excessive) in photosynthetic tissues could alleviate salt-induced damage due to net CO2 assimilation and the growth protection provided by its critical roles, including osmotic solutes and enzyme cofactors [67,68]. In this study, we found that the plant height, leaf area, photosynthetic performance, and dry matter accumulation of sunflower seedlings under S1P0 and P1S1 were significantly higher than those under P0S1; however, there were no significant differences between S1P0 and P1S1 (p > 0.05). Sun et al. [69] found that the optimal alleviation of moderate salt stress for the yield and quality of fiber and cottonseed was achieved at a K/Na ratio of 1:9. This indicated that there might exist an optimal K/Na ratio to promote crop growth and plant establishment. In this study, although we did not find an optimal K/Na ratio, which is the key point for our further study, the plant establishment and yield were affected by the overapplication of K fertilizers and K-rich water due to the fact that it affects ion uptake by influencing the composition of the soil solution. Therefore, on the basis of clarifying the current status of excessive K in soils and the ionic composition of irrigation water, the findings of our study can provide a theoretical basis and technical support for the efficient and sustainable utilization of fertilizers and water in agricultural production, thereby safeguarding regional food security, especially in arid and semi-arid areas. We recommend that agricultural practices in saline regions incorporate tailored irrigation and fertilization strategies that prioritize optimal K/Na ratios to maximize crop performance and sustainability.

5. Conclusions

Our experiments with potted sunflower seedlings indicated that varying K/Na ratios significantly influenced ion selective absorption and transport in plant organs, even at a consistent electrolyte concentration (ECw = 4 dS m−1). An excessive K/Na ratio (P1S0) led to increased K+ levels and Mg2+ deficiency, which in turn reduced chlorophyll concentration and photosynthetic performance, resulting in decreased plant height, leaf area, dry matter accumulation, and CO2 and light use efficiency. In contrast, seedlings treated with P1S1 and P0S1 showed significantly better morphological and photosynthetic traits compared to P1S0, with no significant differences between P1S1 and P0S1. These findings underscore the critical role of optimizing ion composition in soil solutions, especially during the sensitive seedling stage, to enhance photosynthesis and ultimately to improve plant establishment. We recommend that agricultural practices in saline regions incorporate tailored irrigation and fertilization strategies that prioritize optimal K/Na ratios to maximize crop performance and sustainability. Future studies should further explore the specific K/Na ratio that best supports crop growth and development in diverse saline conditions.

Supplementary Materials

The following supporting information can be downloaded at: https://www.mdpi.com/article/10.3390/agronomy14102301/s1, Table S1: Ionic concentrations of soil at the end of the experimental period; Table S2: Reduction degree of water quality on soil infiltration evaluated by sodium adsorption ratio (SAR) and electrical conductivity (ECw); Table S3: Reduction degree of water quality on soil hydraulic conductivity evaluated by potassium adsorption ratio (PAR) and electrical conductivity (ECw); Table S4: Sodium adsorption ratio (SAR) and potassium adsorption ratio (PAR) of solution in plastic pool after harvest.

Author Contributions

Conceptualization, Y.C.; methodology, T.Z.; software, Y.C.; validation, W.G.; formal analysis, Y.C.; investigation, Y.K.; resources, T.Z.; data curation, Q.L.; writing—original draft preparation, Y.C.; writing—review and editing, T.Z. and S.G.; visualization, Y.C.; supervision, T.Z.; project administration, H.F.; funding acquisition, T.Z. All authors have read and agreed to the published version of the manuscript.

Funding

This research was funded by the National Key R&D Program of China (2023YFD2001400), the Innovation Capability Support Program of Shaanxi (2022PT-23), the Key R&D Program of Shaanxi (2023-ZDLNY-53), CAS “Light of West China” Program (XAB2022YW04).

Data Availability Statement

The data presented in this study are available upon request from the corresponding author.

Acknowledgments

We are grateful for the support from the Institute of Modern Agricultural Development, SCO Demonstration Base for Agricultural Technology Exchange and Training, Northwest A&F University.

Conflicts of Interest

The authors declare no conflicts of interest.

References

  1. Khalifani, S.; Darvishzadeh, R.; Azad, N.; Seyed Rahmani, R. Prediction of sunflower grain yield under normal and salinity stress by RBF, MLP and, CNN models. Ind. Crops Prod. 2022, 189, 115762. [Google Scholar] [CrossRef]
  2. Tewari, S.; Arora, K. Talc based exopolysaccharides formulation enhancing growth and production of Hellianthus annuus under saline conditions. Cell. Mol. Biol. 2014, 60, 73–81. [Google Scholar] [CrossRef] [PubMed]
  3. FAO. Halt soil salinization, boost soil productivity. In Proceedings of the Global Symposium on Salt-Affected Soils, Rome, Italy, 20–22 October 2022. [Google Scholar]
  4. Schubert, S. Sodium. In Handbook of Plant Nutrition; Barker, A.V., Pilbeam, D.J., Eds.; CRC Press: Boca Raton, FL, USA, 2015; pp. 697–710. [Google Scholar]
  5. Pantha, P.; Oh, D.H.; Longstreth, D.; Dassanayake, M. Living with high potassium: Balance between nutrient acquisition and K-induced salt stress signaling. Plant Physiol. 2023, 191, 1102–1121. [Google Scholar] [CrossRef]
  6. Fageria, N.K. Nutrient Uptake in Crop Plants; CRC Press: Boca Raton, FL, USA, 2009. [Google Scholar]
  7. Fageria, N.K. Potassium. In Handbook of Plant Nutrition; Barker, A.V., Pilbeam, D.J., Eds.; CRC Press: Boca Raton, FL, USA, 2015. [Google Scholar]
  8. Mengel, K.; Kirkby, E.A.; Kosegarten, H.K.; Appel, T. Principles of Plant Nutrition; Kluwer Academic Publishers: Dordrecht, The Netherlands, 2001. [Google Scholar]
  9. Fageria, N.K.; Baligar, V.C.; Clark, R.B. Physiology of Crop Production; Haworth: New York, NY, USA, 2006. [Google Scholar]
  10. Orris, G.J.; Cocker, M.D.; Dunlap, P.; Wynn, J.; Spanski, G.T.; Briggs, D.A.; Gass, L. Potash—A Global Overview of Evaporite-Related Potash Resources, including Spatial Database of Deposits, Occurrences, and Permissive Tracts; Scientific Investigations Report 2010-5090-S; U.S. Geological Survey: Reston, VA, USA, 2014.
  11. Warren, J.K. Potash Resources: Occurrences and Controls; Springer: Cham, Switzerland, 2016. [Google Scholar]
  12. Rengasamy, P.; Marchuk, A. Cation ratio of soil structural stability (CROSS). Soil Res. 2011, 49, 280–285. [Google Scholar] [CrossRef]
  13. Smiles, D.E.; Smith, C.J. A survey of the cation content of piggery effluents and some consequences of their use to irrigate soils. Aust. J. Soil Res. 2004, 42, 231–246. [Google Scholar] [CrossRef]
  14. Smith, C.J.; Sposito, G.; Oster, J.D. Accounting for potassium and magnesium in irrigation water quality assessment. Calif. Agric. 2016, 70, 71–76. [Google Scholar]
  15. Wang, Y.; Zhang, T.; Li, B.; Feng, G.; Yan, L.; Gao, Q. Effect of long-term potassium fertilizer levels on the yield of rainfed corn in Northeast China. Appl. Ecol. Environ. Res. 2020, 18, 597–607. [Google Scholar] [CrossRef]
  16. Wang, M.; Ye, Y.; Chu, X.; Zhao, Y.; Zhang, S.; Chen, H.; Qin, W.; Wang, Y. Responses of garlic quality and yields to various types and rates of potassium fertilizer applications. Hortscience 2022, 57, 72–80. [Google Scholar] [CrossRef]
  17. Fageria, N.K. Ionic interactions in rice plants from dilute solutions. Plant Soil 1983, 70, 309–316. [Google Scholar] [CrossRef]
  18. Ding, Y.; Chang, C.; Luo, W.; Wu, Y.; Ren, X.; Wang, P.; Xu, G. High potassium aggravates the oxidative stress inducedy by magnesium deflciency in rice leaves. Pedosphere 2008, 18, 316–327. [Google Scholar] [CrossRef]
  19. Wakeel, A. Potassium-sodium interactions in soil and plant under saline-sodic conditions. J. Soil Sci. Plant Nutr. 2013, 176, 344–354. [Google Scholar] [CrossRef]
  20. Adiloglu, S.; Adiloglu, A.; Ozkil, M. Effect of different levels of NaCl and KCl on growth and some biological indexes of wheat plant. Pak. J. Biol. Sci. 2007, 10, 1941–1943. [Google Scholar] [CrossRef] [PubMed]
  21. Reich, M.; Aghajanzadeh, T.; Helm, J.; Parmar, S.; Hawkesford, M.J.; De Kok, L.J. Chloride and sulfate salinity differently affect biomass, mineral nutrient composition and expression of sulfate transport and assimilation genes in Brassica rapa. Plant Soil 2017, 411, 319–332. [Google Scholar] [CrossRef] [PubMed]
  22. Farahani, E.; Emami, H.; Fotovat, A.; Khorassani, R.; Keller, T. Soil available water and plant growth in relation to K:Na ratio. Geoderma 2020, 363, 114173. [Google Scholar] [CrossRef]
  23. Zhao, W.; Faust, F.; Schubert, S. Potassium is a potential toxicant for Arabidopsis thaliana under saline conditions. J. Soil Sci. Plant Nutr. 2020, 183, 455–467. [Google Scholar] [CrossRef]
  24. Richter, J.A.; Behr, J.H.; Erban, A.; Kopka, J.; Zörb, C. Ion-dependent metabolic responses of Vicia faba L. to salt stress. Plant Cell Environ. 2019, 42, 295–309. [Google Scholar] [CrossRef]
  25. Katerji, N.; van Hoorn, J.W.; Hamdy, A.; Mastrorilli, M. Salt tolerance classification of crops according to soil salinity and to water stress day index. Agric. Water Manag. 2000, 43, 99–109. [Google Scholar] [CrossRef]
  26. Francois, L.E. Salinity effects on four sunflower hybrids. Agron. J. 1996, 88, 215–219. [Google Scholar] [CrossRef]
  27. Hussain, M.; Farooq, S.; Hasan, W.; Ul-Allah, S.; Tanveer, M.; Farooq, M.; Nawaz, A. Drought stress in sunflower: Physiological effects and its management through breeding and agronomic alternatives. Agric. Water Manag. 2018, 201, 152–166. [Google Scholar] [CrossRef]
  28. Kong, D.; Shi, H.; Huo, Z.; Yan, Y.; Li, Y.; Zhang, Y. Effects on growth of sunflower under different saline soils in the Hetao Irrigation Area. J. Shenyang Agric. Univ. 2004, 35, 414–416. (In Chinese) [Google Scholar]
  29. Ayers, R.S.; Westcot, D.W. Water Quality for Agriculture; FAO: Rome, Italy, 1985. [Google Scholar]
  30. Quirk, J.P.; Schofield, R.K. The effect of electrolyte concentration on soil permeability. Eur. J. Soil Sci. 1955, 6, 163–178. [Google Scholar] [CrossRef]
  31. Richards, L.A. Diagnosis and Improvement of Saline and Alkali Soils; US Department of Agriculture: Washington DC, USA, 1954.
  32. Chen, Y.; Banin, A.; Borochovitch, A. Effect of potassium on soil structure in relation to hydraulic conductivity. Geoderma 1983, 30, 135–147. [Google Scholar] [CrossRef]
  33. Flowers, T.J.; Troke, P.F.; Yeo, A.R. The mechanism of salt tolerance in halophytes. Annu. Rev. Plant Biol. 1977, 28, 89–121. [Google Scholar] [CrossRef]
  34. Pitman, M.G. Transport across the root and shoot/root interactions. In Salinity Tolerance in Plants: Strategies for Crop Improvement; Staples, R.C., Toenniessen, G.H., Eds.; John Wiley: New York, NY, USA, 1984; pp. 93–123. [Google Scholar]
  35. Song, X.; Zhou, G.; He, Q.; Zhou, H. Stomatal limitations to photosynthesis and their critical Water conditions in different growth stages of maize under water stress. Agric. Water Manag. 2020, 241, 106330. [Google Scholar] [CrossRef]
  36. Zhang, Y.; Yu, X.; Chen, L.; Jia, G. Whole-plant instantaneous and short-term water-use efficiency in response to soil water content and CO2 concentration. Plant Soil 2019, 444, 281–298. [Google Scholar] [CrossRef]
  37. Medlyn, B.E. Physiological basis of the light use efficiency model. Tree Physiol. 1998, 18, 167–176. [Google Scholar] [CrossRef]
  38. He, W.; Ma, F. Effects of water gradient on fluorescence characteristics and gas exchange in Sabina Vulgaris seedlings. Acta Phytoecol. Sin. 2000, 24, 630–634. (In Chinese) [Google Scholar]
  39. Wei, T.; Simko, V. Corrplot: Visualization of a Correlation Matrix. R Package Version 0.77. (Verified June 2017). 2016. Available online: https://github.com/taiyun/corrplot (accessed on 6 June 2024).
  40. Tester, M.; Davenport, R. Na+ tolerance and Na+ transport in higher plants. Ann. Bot. 2003, 91, 503–527. [Google Scholar] [CrossRef]
  41. Bai, X.; Gao, J.; Wang, S.; Cai, H.; Chen, Z.; Zhou, J. Excessive nutrient balance surpluses in newly built solar greenhouses over five years leads to high nutrient accumulations in soil. Agric. Ecosyst. Environ. 2020, 288, 106717. [Google Scholar] [CrossRef]
  42. Munns, R.; Tester, M. Mechanisms of salinity tolerance. Annu. Rev. Plant Biol. 2008, 59, 651–681. [Google Scholar] [CrossRef]
  43. Maathuis, F.J. Physiological functions of mineral macronutrients. Curr. Opin. Plant Biol. 2009, 12, 250–258. [Google Scholar] [CrossRef] [PubMed]
  44. Hu, Y.; Schmidhalter, U. Interactive effects of salinity and macronutrient level on wheat. II. Composition. J. Plant Nutr. 1997, 20, 1169–1182. [Google Scholar] [CrossRef]
  45. Horie, T.; Brodsky, D.E.; Costa, A.; Kaneko, T.; Lo Schiavo, F.; Katsuhara, M.; Schroeder, J.I. K+ transport by the OsHKT2;4 transporter from rice with atypical Na+ transport properties and competition in permeation of K+ over Mg2+ and Ca2+ ions. Plant Physiol. 2011, 156, 1493–1507. [Google Scholar] [CrossRef] [PubMed]
  46. Davenport, R.J.; Tester, M. A weakly voltage-dependent, nonselective cation channel mediates toxic sodium influx in wheat. Plant Physiol. 2000, 122, 823–834. [Google Scholar] [CrossRef] [PubMed]
  47. Sauer, D.B.; Zeng, W.; Canty, J.; Lam, Y.; Jiang, Y. Sodium and potassium competition in potassium-selective and non-selective channels. Nat. Commun. 2013, 4, 2721. [Google Scholar] [CrossRef]
  48. Hryvusevich, P.; Navaselsky, I.; Talkachova, Y.; Straltsova, D.; Keisham, M.; Viatoshkin, A.; Samokhina, V.; Smolich, I.; Sokolik, A.; Huang, X.; et al. Sodium influx and potassium efflux currents in sunflower root cells under high salinity. Front. Plant Sci. 2020, 11, 613936. [Google Scholar] [CrossRef]
  49. Grzebisz, W. Magnesium. In Handbook of Plant Nutrition; Barker, A.V., Pilbeam, D.J., Eds.; CRC Press: Boca Raton, FL, USA, 2015; pp. 199–259. [Google Scholar]
  50. Ding, Y.; Luo, W.; Xu, G. Characterization of magnesium nutrition and interaction of magnesium and potassium in rice. Ann. Appl. Biol. 2006, 149, 111–123. [Google Scholar] [CrossRef]
  51. Li, H.; Chen, Z.; Zhou, T.; Liu, Y.; Raza, S.; Zhou, J. Effects of high potassium and low temperature on the growth and magnesium nutrition of different tomato cultivars. Hortscience 2018, 53, 710–714. [Google Scholar] [CrossRef]
  52. Verbruggen, N.; Hermans, C. Physiological and molecular response to magnesium nutritional imbalance in plants. Plant Soil 2013, 368, 87–90. [Google Scholar] [CrossRef]
  53. Xu, G.; Magen, H.; Tarchitzky, J.; Kafkafi, U. Advances in chloride nutrition of plants. Adv. Agron. 1999, 68, 97–150. [Google Scholar]
  54. Schulte, E.E. Soil and Applied Chlorine (A3556); University of Wisconsin Cooperative Extension Service: Madison, WI, USA, 1999. [Google Scholar]
  55. Kopsell, D.E.; Kopsell, D.A. Chlorine. In Handbook of Plant Nutrition; Barker, A.V., Pilbeam, D.J., Eds.; CRC Press: Boca Raton, FL, USA, 2015; pp. 347–366. [Google Scholar]
  56. Munns, R.; Schachtman, D.P.; Condon, A.G. The Significance of a Two-Phase Growth Response to Salinity in Wheat and Barley. Aust. J. Plant Physiol. 1995, 22, 561–569. [Google Scholar]
  57. Wang, G.; Zeng, F.; Song, P.; Sun, B.; Wang, Q.; Wang, J. Effects of reduced chlorophyll content on photosystem functions and photosynthetic electron transport rate in rice leaves. J. Plant Physiol. 2022, 272, 153669. [Google Scholar] [CrossRef]
  58. Jayaganesh, S.V.; Senthurpandian, V.K. Impact of different sources and doses of magnesium fertilizer on biochemical constituents and quality parameters of black tea. Asian J. Biochem. 2011, 6, 273–281. [Google Scholar] [CrossRef]
  59. Xu, D. Some problems in stomatal limitation analysis of photosynthesis. Plant Physiol. Commun. 1997, 33, 241–244. (In Chinese) [Google Scholar]
  60. Liu, J.; Shi, D.C. Photosynthesis, chlorophyll fluorescence, inorganic ion and organic acid accumulations of sunflower in responses to salt and salt-alkaline mixed stress. Photosynthetica 2010, 48, 127–134. [Google Scholar] [CrossRef]
  61. Shingles, R.; McCarty, R.E. Direct measurement of ATP-dependent proton concentration changes and characterization of a K-stimulated ATPase in pea chloroplast inner envelope vesicles. Plant Physiol. 1994, 106, 731–737. [Google Scholar] [CrossRef]
  62. Li, H.; Chen, Z.; Zhou, T.; Liu, Y.; Zhou, J. High potassium to magnesium ratio affected the growth and magnesium uptake of three tomato (Solanum lycopersicum L.) cultivars. J. Integr. Agric. 2018, 17, 2813–2821. [Google Scholar] [CrossRef]
  63. Carvalho, P.; Foulkes, M.J. Roots and Uptake of Water and Nutrients. In Encyclopedia of Sustainability Science and Technology; Meyers, R., Ed.; Springer: New York, NY, USA, 2018. [Google Scholar]
  64. Smith, C.J.; Oster, J.D.; Sposito, G. Potassium and magnesium in irrigation water quality assessment. Agric. Water Manag. 2015, 157, 59–64. [Google Scholar] [CrossRef]
  65. Buelow, M.C.; Steenwerth, K.; Parikh, S.J. The effect of mineral-ion interactions on soil hydraulic conductivity. Agric. Water Manag. 2015, 152, 277–285. [Google Scholar] [CrossRef]
  66. Liang, X.; Rengasamy, P.; Smernik, R.; Mosley, L.M. Does the high potassium content in recycled winery wastewater used for irrigation pose risks to soil structural stability? Agric. Water Manag. 2021, 243, 106422. [Google Scholar] [CrossRef]
  67. Cuin, T.A.; Shabala, S. Exogenously supplied compatible solutes rapidly ameliorate NaCl-induced potassium efflux from barley roots. Plant Cell Physiol. 2005, 46, 1924–1933. [Google Scholar] [CrossRef] [PubMed]
  68. Wang, N.; Qi, H.; Qiao, W.; Shi, J.; Xu, Q.; Zhou, H.; Yan, G.; Huang, Q. Cotton (Gossypium hirsutum L.) genotypes with contrasting K+/Na+ ion homeostasis: Implications for salinity tolerance. Acta Physiol. Plant 2017, 39, 77. [Google Scholar] [CrossRef]
  69. Sun, L.; Wang, Z.; Xiong, C.; Gu, J.; Zheng, Y.; Ju, F.; Wang, S.; Hu, W.; Zhao, W.; Zhou, Z.; et al. Improving the soil K+/Na+ ratio under moderate salt stress synergistically increases the yield and quality of cotton fiber and cottonseed. Ind. Crops Prod. 2024, 213, 118441. [Google Scholar] [CrossRef]
Figure 1. Experimental device in this study. P1S0, P1S1, and P0S1 indicate treatments with K/Na ratios of 1:0, 1:1, and 0:1 at the same external concentration (4 dS m−1), respectively. CK indicates no added salt in the tap water.
Agronomy 14 02301 g001
Figure 2. Daily air temperature and relative humidity during the seedling stage of sunflower. (A) Daily air temperature and relative humidity of the first batch of experiments from 13 March (planting date) to 27 April (harvest date). Sunflower was harvested at the end of the seedling stage. (B) Daily air temperature and relative humidity of the second batch of experiments from 10 May to 24 June. (C) Data dispersion of air temperature and relative humidity in two batches of experiments by box plot.
Agronomy 14 02301 g002
Figure 3. Plant height and leaf area of sunflower during the experiments, dry matter, and site photos at the end of the seeding stage under different K/Na ratios in the first batch experiment (AD) and second batch experiment (EH). P0S1, P1S1, and P1S0 indicate treatments with K/Na ratios of 0:1, 1:1, and 1:0 at the same external concentration (4 dS m−1), respectively. CK indicates no added salt in the tap water. Different small letters on the same color bar or point in (C,G) indicate significant differences among treatments (p < 0.05).
Agronomy 14 02301 g003
Figure 4. Na, K, Ca, Mg, and Cl concentration of each organ of sunflower at the end of the seeding stage under different K/Na ratios in the first (AE) and second (FJ) batch experiments. P0S1, P1S1, and P1S0 indicate treatments with K/Na ratios of 0:1, 1:1, and 1:0 at the same external concentration (4 dS m−1), respectively. CK indicates no added salt in the tap water. Different small letters on the same organ in the subfigure indicate significant differences among treatments (p < 0.05).
Agronomy 14 02301 g004
Figure 5. Na, K, Ca, Mg, and Cl accumulation of each organ of sunflower at the end of the seeding stage under different K/Na ratios in the first (A) and second (B) batch experiments. P0S1, P1S1, and P1S0 indicate treatments with K/Na ratios of 0:1, 1:1, and 1:0 at the same external concentration (4 dS m−1), respectively. CK indicates no added salt in the tap water.
Agronomy 14 02301 g005
Figure 6. The photosynthetic characteristics (Evap, Pn, gs, and Ci), Ls, and resource use efficiency (WUE, LUE, and CUE) under different K/Na ratios in the first batch experiment (AH) and second batch experiment (IP). Evap, transpiration rate; Pn, net photosynthetic rate; gs, stomatal conductance; Ci, intercellular CO2 concentration; Ls, stomatal limitation; WUE, water use efficiency; LUE, light use efficiency; CUE, CO2 use efficiency. P0S1, P1S1, and P1S0 indicate treatments with K/Na ratios of 0:1, 1:1, and 1:0 at the same external concentration (4 dS m−1), respectively. CK indicates no added salt in the tap water. Different small letters in the subfigure indicate significant differences among treatments (p < 0.05).
Agronomy 14 02301 g006
Figure 7. Correlation matrix between the K/Na ratio, ion concentration of plant organs, gas exchange parameters (Evap, Pn, gs, and Ci), PH, LA, and DM in the first batch experiment (A) and second batch experiment (B). Root-Na, Root-K, Root-Ca, and Root-Mg indicate the Na, K, Ca, and Mg concentration in the roots, respectively. Stem-Na, Stem-K, Stem-Ca, and Stem-Mg indicate the Na, K, Ca, and Mg concentration in the stems, respectively. Leaf-Na, Leaf-K, Leaf-Ca, and Leaf-Mg indicate the Na, K, Ca, and Mg concentration in the leaves, respectively. Evap, transpiration rate; Pn, net photosynthetic rate; gs, stomatal conductance; Ci, intercellular carbon dioxide concentration; PH, plant height; LA, leaf area; DM, dry matter weight. The gradient of the legend is a function of the strength of the correlation (darker colors indicate stronger correlations); ellipse slopes indicate a negative or positive correlation (i.e., increasing towards the right indicates a positive correlation, and decreasing towards the right indicates a negative correlation). The shape of the ellipse also indicates the strength of the correlation; a wide shape indicates a weak correlation and a narrow shape indicates a strong correlation. * indicates p < 0.05. For example, the DM and Pn were significantly and strongly positively correlated.
Agronomy 14 02301 g007
Figure 8. Response of crop organ ion concentration and leaf photosynthesis to an excessive K/Na ratio.
Agronomy 14 02301 g008
Table 1. The physicochemical properties of the studied soil.
IndicatorValue
Sand (% by weight)8.10
Silt (% by weight)60.62
Clay (% by weight)31.28
Soil texture (USDA classification)Silty clay loam
Bulk density (g cm−3)1.35
pH7.66
Electrical conductivity of saturated soil extract (ECe, dS m−1)0.72
Water-soluble ion concentration (mmol L−1)
Sodium (Na+)0.1
Potassium (K+)<0.01
Calcium (Ca2+)0.54
Magnesium (Mg2+)0.32
Chloride (Cl)0.23
Sulfate (SO42−)2.18
Carbonate + bicarbonate (CO32− + HCO3)0.60
Organic matter content (g kg−1)10.25
Total nitrogen (g kg−1)0.93
Total potassium (g kg−1)10.27
Available phosphorus (mg kg−1)15.67
Available potassium (mg kg−1)103.35
Table 2. Ion concentrations of each treatment added into the tap water.
TreatmentAdding Salt (mmolc L−1)K/NaEC (dS m−1)Cation Ratio (mmolc L−1)0.5
Na+K+Ca2+Mg2+ClTargetedMeasuredSARPAR
CK00000-00.15--
P0S135.000.002.252.25400:144.2014.770.01
P1S117.5017.502.252.25401:144.317.567.22
P1S00.0035.002.252.25401:044.440.3614.42
Tap water0.870.030.60.8100.034-0.150.740.03
SAR, sodium adsorption ratio; PAR, potassium adsorption ratio.
Table 3. The selective absorption (SA) and selective transport (ST) coefficients of ion X (K+, Ca2+, and Mg2+) by the roots, stems, and leaves under different K/Na ratios in the first and second batch experiments.
SA or STFirst Batch ExperimentSecond Batch Experiment
CKP0S1P1S1P1S0CKP0S1P1S1P1S0
Soil → RootSAK/Na2.96 d39.71 a15.64 b4.73 c6.23 c50.23 a37.27 a10.26 b
SACa/Na86.12 b228.16 a247.78 a45.29 c31.36 c43.60 b84.94 a13.08 d
SAMg/Na5.17 b7.39 a8.21 a1.27 c2.66 b2.60 b5.35 a0.88 c
Root → StemSTK/Na111.94 a51.19 b55.56 b65.11 b159.74 a59.11 b63.72 b65.30 b
STCa/Na0.95 a0.87 a0.90 a1.08 a0.96 a0.82 a0.86 a1.04 a
STMg/Na5.30 a1.64 b1.61 b3.94 b5.74 a2.85 b2.99 b3.47 b
Root → LeafSTK/Na168.79 b237.48 a114.28 c76.92 d187.37 b322.29 a86.52 c26.38 d
STCa/Na2.35 b3.30 a1.87 b2.05 b10.65 b29.72 a8.59 b8.93 b
STMg/Na6.89 b8.66 a5.52 c4.81 d24.47 b45.61 a21.91 b14.26 c
Different small letters after values in the same row for each batch experiment indicate significant differences among treatments (p < 0.05). P0S1, P1S1, and P1S0 indicate treatments with K/Na ratios of 0:1, 1:1, and 1:0 at the same external concentration (4 dS m−1), respectively. CK indicates no added salt in the tap water.
Table 4. The chlorophyll concentration of leaves at the end of the seedling stage under different K/Na ratios in the first and second batch experiments.
TreatmentChlorophyll Concentration (μmol m−2)
First Batch Pot TrialSecond Batch Pot Trial
CK262.55 ± 2.14 a293.30 ± 3.62 a
P0S1255.32 ± 3.67 b279.00 ± 5.21 b
P1S1258.59 ± 3.13 b284.67 ± 5.85 b
P1S0241.73 ± 5.15 c264.02 ± 4.31 c
Different small letters after values in the same row of each batch experiment indicate significant differences among treatments (p < 0.05). P0S1, P1S1, and P1S0 indicate treatments with K/Na ratios of 0:1, 1:1, and 1:0 at the same external concentration (4 dS m−1), respectively. CK indicates no added salt in the tap water.
Disclaimer/Publisher’s Note: The statements, opinions and data contained in all publications are solely those of the individual author(s) and contributor(s) and not of MDPI and/or the editor(s). MDPI and/or the editor(s) disclaim responsibility for any injury to people or property resulting from any ideas, methods, instructions or products referred to in the content.