Article

Effects of Long-Term Sustainable Inorganic Fertilization on Rice Productivity and Fertility of Quaternary Red Soil

1
Institute of Soil Fertilizer and Resource Environment, Jiangxi Academy of Agricultural Sciences, Nanchang 330200, China
2
National Engineering and Technology Research Center for Red Soil Improvement, Nanchang 330200, China
3
Jiangxi Provincial Key Laboratory of Agricultural Non-Point Source Pollution Control and Waste Comprehensive Utilization, Nanchang 330200, China
*
Author to whom correspondence should be addressed.
Agronomy 2024, 14(10), 2311; https://doi.org/10.3390/agronomy14102311
Submission received: 30 August 2024 / Revised: 5 October 2024 / Accepted: 7 October 2024 / Published: 8 October 2024
(This article belongs to the Section Soil and Plant Nutrition)

Abstract

:
Soil microbial communities play a critical role in soil fertility and crop productivity. The present study investigated the impact of long-term chemical fertilization on microbial communities, rice productivity, and fertility of Quaternary red soil. A long-term experiment was conducted from 1984 to 2018 with the following treatments: unbalanced nitrogen (N), phosphorus (P), potassium (K) fertilization (NP, NK, and PK) and balanced inorganic fertilization (NPK) and non-fertilization (CK) as control. The results indicate that alkaline hydrolyzed nitrogen (AhN), available phosphorus (AP), and available potassium (AK) were higher with the application of NPK fertilizers than in the initial stage of the experiment. The crop yield of fertilizer groups was also higher than that of CK, and the maximum yield was observed in the NPK group. The relative abundance of dominant bacteria, such as Acidobacteriaceae and Proteobacteria, was significantly different among different fertilizer treatments. Different fertilization strategies also had significant effects on soil fungi. For instance, Mortierella had a positive correlation with the soil N content, and Arnium showed a negative correlation with the balanced fertilization of N and P. Therefore, long-term balanced inorganic fertilization can effectively improve rice productivity and fertility of Quaternary red soil.

1. Introduction

Soil is an important part of the agro-ecosystem which plays a key role in crop production. However, intensive agricultural practices deteriorate the soil quality, leading to degradation and depletion of soil cover [1]. Agricultural practices significantly affect the soil quality [2], and soil microorganisms play an important role in nutrient cycling, and biochemical reactions [3,4]. Microorganisms play a significant role in soil fertility and the availability of nutrients [5]. The microbial community composition also affects the soil quality, which in turn affects crop growth [6]. Therefore, a suitable microbial community structure can promote crop productivity and changes in soil microbial composition could be used as an indicator to assess plant growth and soil health [7].
Fertilization is an important factor that affects soil health and crop productivity. The application of chemical fertilizers increases soil nitrogen and phosphorus, which in turn affects microbial composition [8]. The application of both chemical and organic fertilizers and their combination can increase the activity of soil microbes [9,10]. The addition of organic matter from organic fertilizers increases or decreases the activity of microbes [11]. The application of chemical fertilizers increases crop production [7]; however, their excessive use degrades soil quality and poses negative impacts on soil quality and soil microbial balance [12,13]. On the other hand, the application of both chemical and organic fertilizers stimulates microbial growth, leading to improved microbial population and activity [14,15,16].
Bacteria play a crucial role in soil health due to their participation in nutrient cycling, residue decomposition, and their antagonistic impacts against soil pathogens [6]. Numerous studies have witnessed that chemical fertilizers negatively impact bacterial diversity [17,18]. Nonetheless, a positive impact of mineral fertilizers is also reported which is linked with an increase in plant biomass and rhizodeposition [19]. The proportion of liable carbon and nutrient concentration in plant materials varies among different species which play a crucial role in the development of microbial communities [20]. Red soil is a kind of weathered mudstone formed in the middle Pleistocene of Quaternary [21]. The red soil formed by Quaternary laterite is usually lower in fertility and stronger in acidity [22]. Jiangxi is in the southwest of China, which is the typical and representative red soil region in China. The area of red soil in Jiangxi is 10.53 million hectares, accounting for about 71% of the whole province [23]. Therefore, it is important to develop red soil into arable soil. Soil nutrients are good indicators of soil quality and productivity because of their favorable effects on the physical, chemical, and biological properties of soil [24]. Fertilizer application is very important to improve soil quality and rice productivity on red soil. Different combinations of N, P, and K affect soil microbial diversity and community. For instance, N showed a significant impact on bacterial, archaeal, and fungal communities across ecosystems [25,26,27]. In another study, P fertilization, increased the bacterial community in pasture soils [28]. As for K, mineral potassium can be converted into organic potassium by microorganisms and then used by plants [29]. Microorganisms in soil are important for soil quality, playing considerable roles in the decomposition of organic materials and enrichment of compost [30]. Therefore, revealing the diversity of microorganisms in red soil can increase our knowledge of red soil.
To reveal the effects of long-term balanced and unbalanced fertilization on the fertility of red soil, we used the next-generation sequencing (NGS) technology to study microbial diversity. The study has with following objectives: (i) to determine the impacts of long-term chemical fertilizers on rice productivity, (ii) to assess the impacts of long-term chemical fertilizers on soil properties, soil microbial and fungal diversity, and composition.

2. Materials and Methods

2.1. Experimental Location

The experiment was performed at the Jiangxi Academy of Agricultural Sciences. The study site has a subtropical climate with an average annual temperature of 17.5 °C, annual rainfall of 1600 m, and annual evaporation of 1800 mm during the experimental period. The experiment site is present at latitude of 28°57′ N and longitude of 115°94′ E with an elevation of 25 m. The basic properties of red soil before the implementation of the experiment are listed in Table 1, and detailed information to determine soil properties is given in Section 2.3.

2.2. Experimental Design

This long-term fertilization experiment was conducted initially in 1984 under a double rice cropping system (rice–rice–winter fallow), which is one of the most common cropping systems in the region. The early rice was planted on 29 April and harvested on 29 July in each year, while late rice was planted on 2 August and harvested on 3 November. There were 5 treatment groups in the experiment: non-fertilization group (CK), nitrogen-free group (PK), phosphate-free group (NK), potassic-free group (NP), and NPK compound group (NPK: Table 2). All treatments were arranged in a randomized block design with three replications, totaling 15 plots. The area of each plot was 33.3 m2, and cement ridges (0.5 m × 0.5 m) were used to separate different plots. The nitrogen fertilizer used in the fertilization strategy was urea (46%: N), the phosphorus fertilizer source was calcium superphosphate (P2O5: 12% P), and the potassium fertilizer was potassium chloride (K2O: 60% K). In the NPK group, a total of 150 kg ha−1 and 180 kg ha−1 N were fertilized in early- and late-season rice, respectively. Moreover, 60 kg ha−1 P2O5 and 180 kg ha−1 K2O were fertilized in both early- and late-season rice. As for NPK-free groups, the corresponding fertilizer was subtracted, and specific fertilization strategies are presented in Table 2.

2.3. Determination of Soil Properties and Rice Yield

Soil samples (20 cm) were collected immediately after the harvesting of rice in November every year. The soil samples were collected annually since 1985 and soil physical and chemical properties were measured following the methods described by Homer and Pratt [31]. Briefly, the soil organic matter (SOM) content was determined using the potassium dichromate volumetric method. Soil total nitrogen (TN) was determined by the Kjeldahl method, while total phosphorus (TP) and alkaline hydrolyzed nitrogen were determined using sulfuric acid-perchloric acid digestion alkali-hydrolyzed reduction methods, respectively. Moreover, available potassium (AK) was determined using the sodium bicarbonate extraction–molybdenum-antimony anti-spectrophotometric method, and available phosphorus (AP) was determined by the Olsen method. Additionally, slow-acting potassium (saK) was determined by a 1.0 mol L−1 thermo HNO3-flame photometer, and cation exchange capacity (Cec) was determined by the ammonium acid exchange method. The soil pH was measured with a glass electrode in a 1:2.5 soil/water suspension. The rice plants were hand harvested and grains were separated to determine the rice yields.

2.4. Sampling and DNA Extraction for 16s RNA and ITS2 Sequence

The soil samples were collected on November 5, 2018, and roots and stones (>2 mm) were removed from the samples. Thereafter, four samples were randomly selected from each group to determine microbial diversity. The samples used for sequencing were stored at −80 °C until DNA extraction. DNA extraction from soil samples was conducted by a MOBIO power soil DNA isolation kit (QIAGEN, USA). Agarose gel electrophoresis was adopted as a rough measurement to assess the qualities of DNA. Then the DNA concentration was quantified using Qubit2.0 (Invitrogen, USA). Four pairs of primers, including 338F/806R (V3 and V4), ITS1F/ITS2R (ITS2), nifHF/nifHR (nifG), and Cd3aF/R3cdR (nirS) were used for DNA amplification to study the diversity and abundance changes of bacteria, fungi, nitrogen-fixing bacteria and denitrifying bacteria. After amplification and purification, PCR products were detected by Nanodrop (Thermo, USA) and blended equally. Axygen gel extraction kit (Axygen, USA) was used to collect the target fragments of DNA. The densities of the collected fragments were detected by Qubit2.0 (Life Tech, USA), and quality control was performed with Agilent 2100 Bioanalyzer (Agilent, USA). Quantitative PCR (qPCR) was performed to test the efficiency of the adapters. Based on the efficiency, the clone libraries were diluted to a proper concentration for sequencing, and the Miseq system (Illumina, USA) was used to accomplish the sequencing.
In this study, four kinds of microorganisms were studied. Based on the sequence data of 16s (V3 and V4), ITS2, nifH, and nirS genes (or regions) of microorganisms in soil samples, reads with barcode and primers were obtained. After filtering out the low-quality reads and trimming the sequencing adapter, we finally identified 2,656,754 high-quality sequences from the 20 soil samples. For each sequenced gene, the statistical results are shown in Figure S1. Operational taxonomic units (OTUs) were used to organize the fine-scale bacterial diversity based on the DNA sequence similarity (97%). A total of 4965, 1947, 1320, and 704 OTUs were clustered and identified in 16s (V3 and V4), ITS2, nifH, and nirS, respectively. The rarefaction curve and rank abundance curve results indicated that the depths of covered reads could meet the experimental requirement (Figure S1A–H). In addition, the hierarchical clustering tree on the OTU level showed an excellent clustering result. Samples of the same group were gathered together with a few exceptions, which represented excellent biological repeatability (Figure S1I–L). In summary, the sequencing data were adequate and of high quality. Moreover, there was a high consistency between biological repetitions in the same group.

2.5. Sequence Data Analysis

Raw reads were obtained and trimmed using the Trimmomatic program. The sorting of microbial operational taxonomic units (OTUs) and taxonomic assignments were performed using Qiime. Chimera sequences in OTUs were removed using U-search (version 7.1). Annotation of OTUs was performed in SILVA’s SSU rRNA database. The OTUs’ alpha diversity estimators, including community richness (Chao1), community diversity (Shannon and Simpson indices), and sequencing depth (Good’s coverage) were analyzed using Mothur (version v.1.30.1). Rarefaction curves were analyzed using Mothur and OTUs with at 97% identity and >1% relative abundance was retained for further analysis. Beta diversities (Bray–Curtis dissimilarity) between samples were analyzed using Qiime. PCA was performed using R programming language. Differences in taxonomies were analyzed using the non-parametric Kruskal–Wallis sum-rank test, which was performed by the online analysis tool (i-sanger) with default parameter. Differences in the relative abundances of OTUs of dominant bacteria were analyzed using Welch’s t test or Mann–Whitney u test. Moreover, distance-based redundancy analysis (db-RDA) and two-way correlation network analysis were performed using the online analysis tool i-sanger.

2.6. Statistical Analyses

The collected data were analyzed by GraphPad Prism 8 software. The data were expressed as the mean ± SD and analyzed by one-way ANOVA. The differences among the treatments were compared by using Tukey’s honestly significant difference test (p ≤ 0.05). A value of p < 0.05 was considered significant, and p < 0.01 was considered highly significant.

3. Results

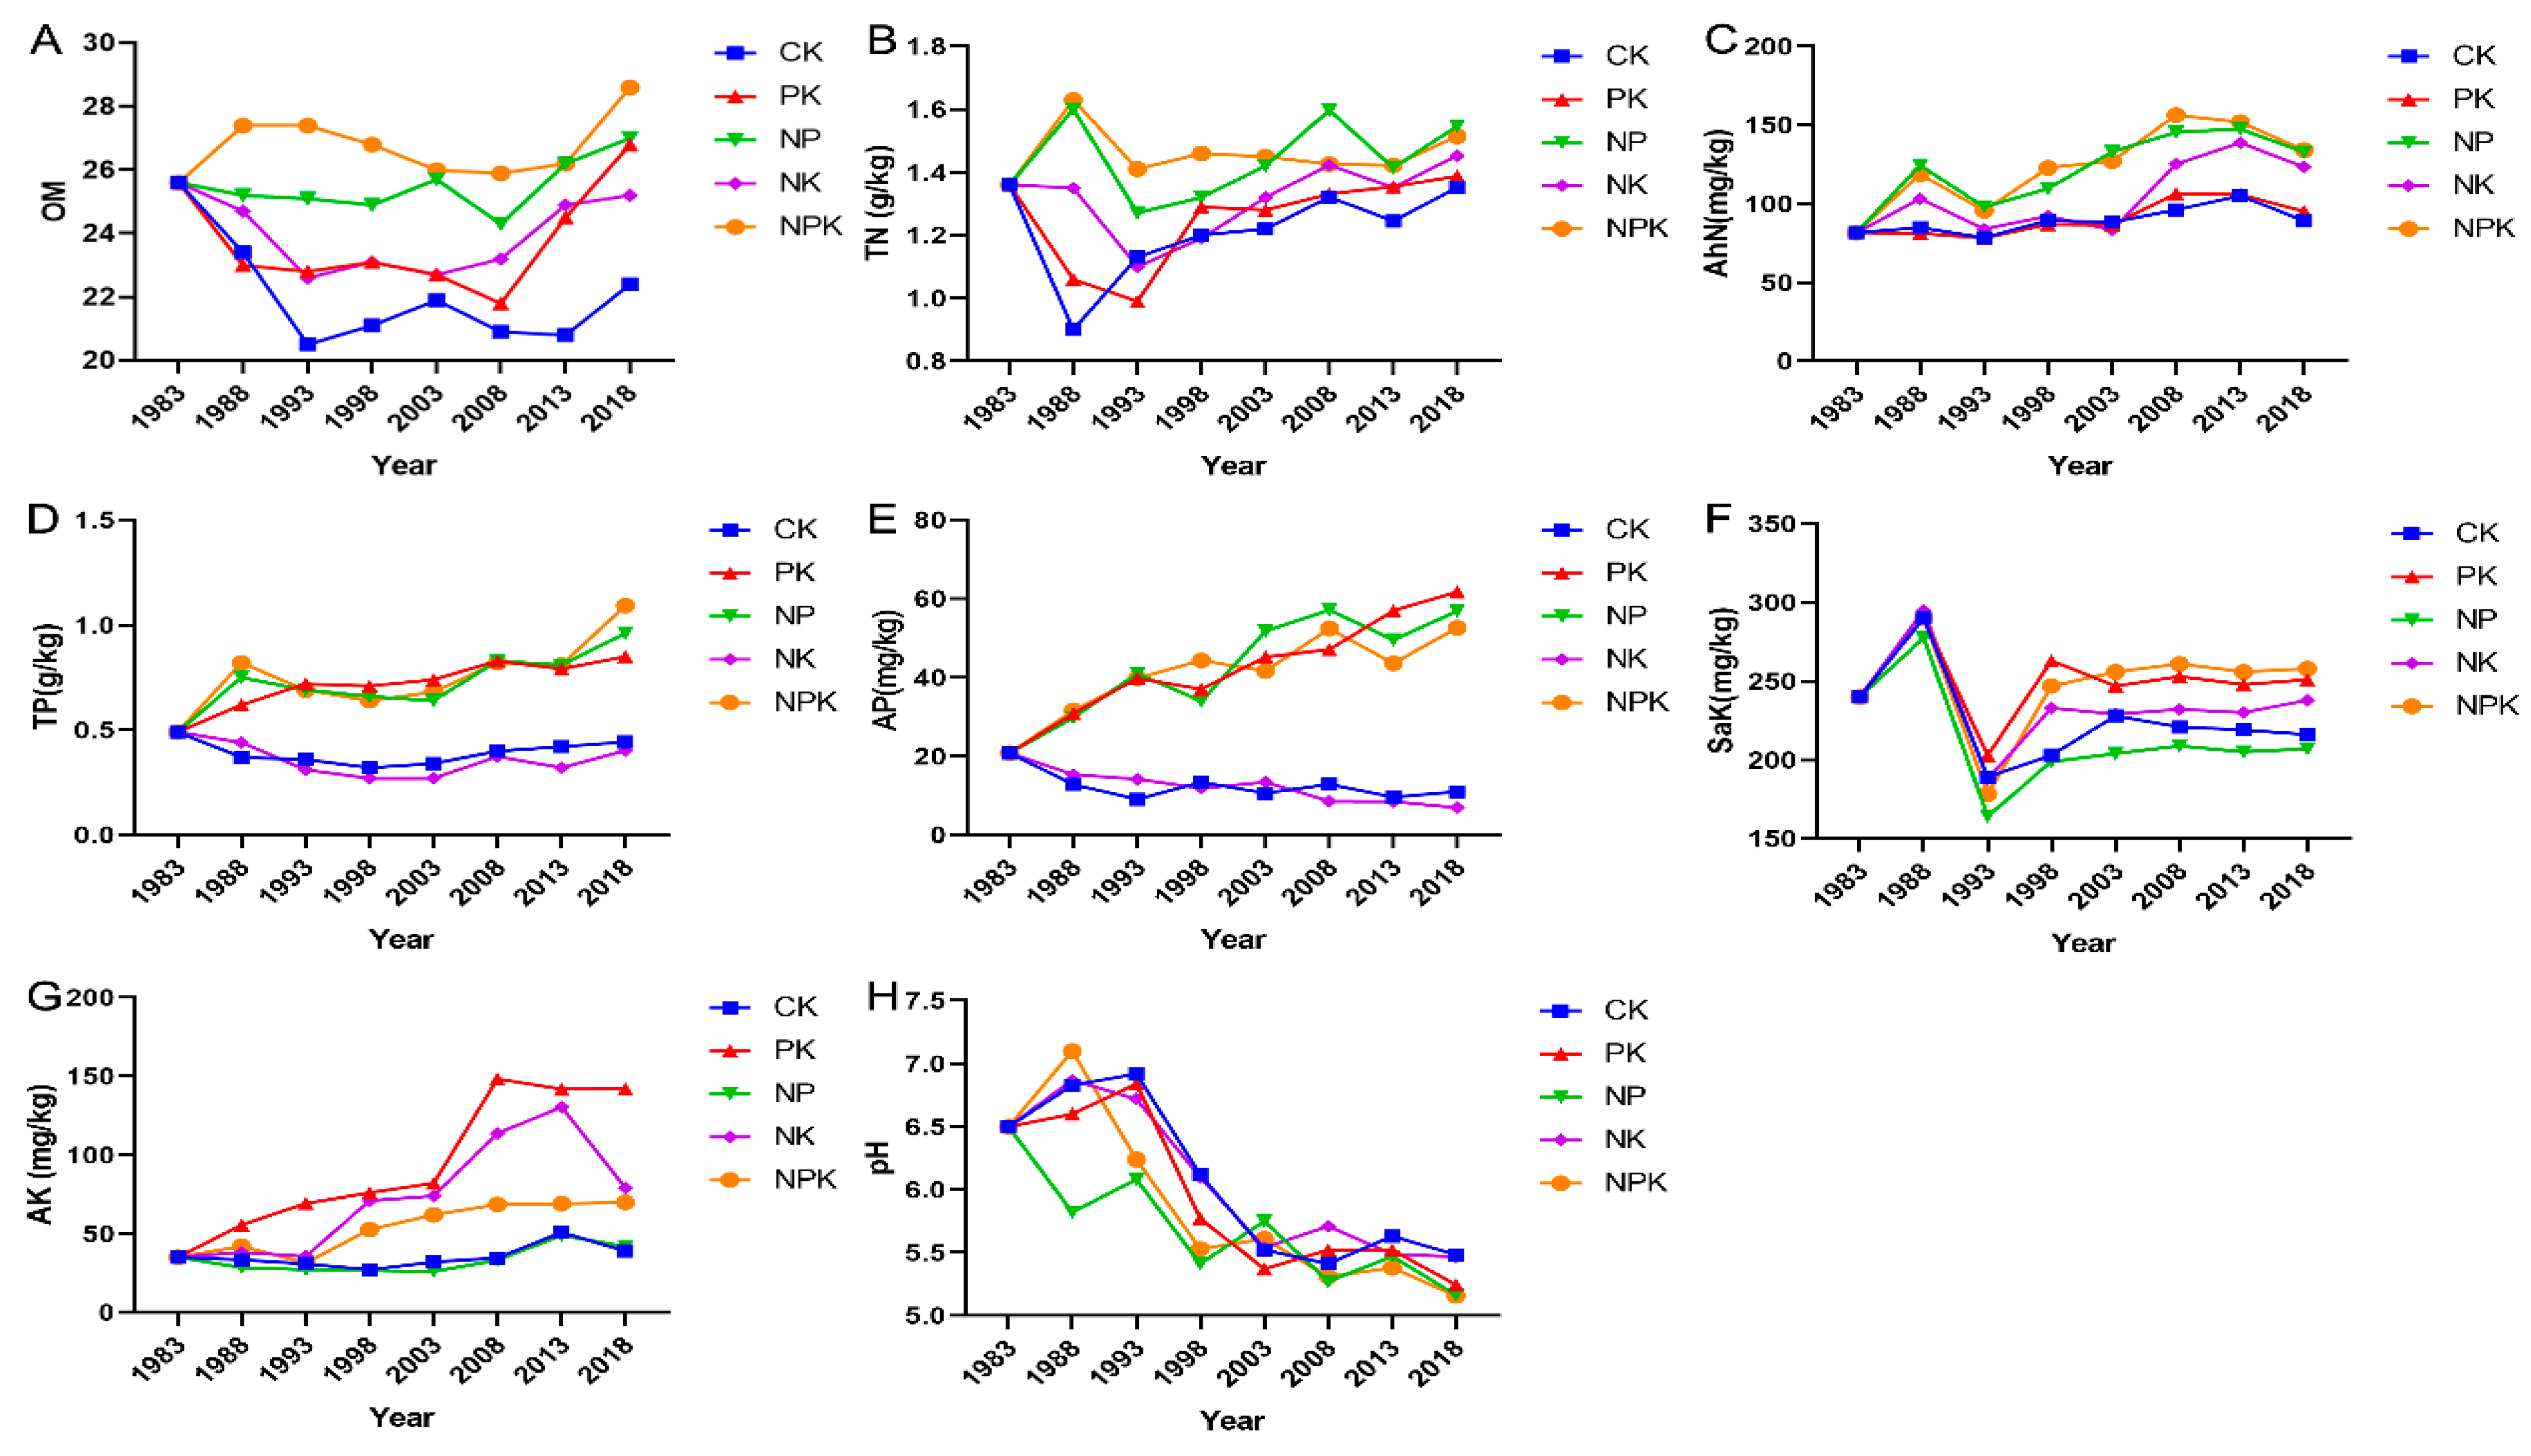
3.1. Soil Physical and Chemical Properties

The results indicated that chemical fertilizers significantly changed the soil properties. The soil organic matter (SOM) of CK decreased from 25.6 g kg−1 (1983) to 22.25 g kg−1 (2018) (p > 0.05). Further long-term NPK application showed a non-significant change in SOM (Figure 1B). The TN content of nitrogen fertilizer treatment fluctuated slightly with the prolongation of planting time but showed an increasing trend, and the NP group significantly increased TN in all nitrogen fertilizer treatments. AhN in CK and PK did not increase or decrease significantly during the entire experimental period, while for NP and NPK, AhN content increased by 62.78% and 64.46%, respectively. The TP and AP results showed that long-term P-free fertilizer resulted in serious phosphorus depletion in soil. Compared with the pre-planting year (1983), the TP increased by 73.47–122.90%, and the AP increased by 153.14–196.84% in P-contained groups (Figure 1 D,E). The content of SaK content stabilized after 1998. The K-contained groups had higher Sak levels than those of K-free groups (Figure 1F). The content of AK increased in PK, NK, and NPK, and decreased in the K-free groups (CK and NP) (Figure 1G). Additionally, we found that the soil pH value decreased substantially from 1983 to 2018 in all treatments (Figure 1H).

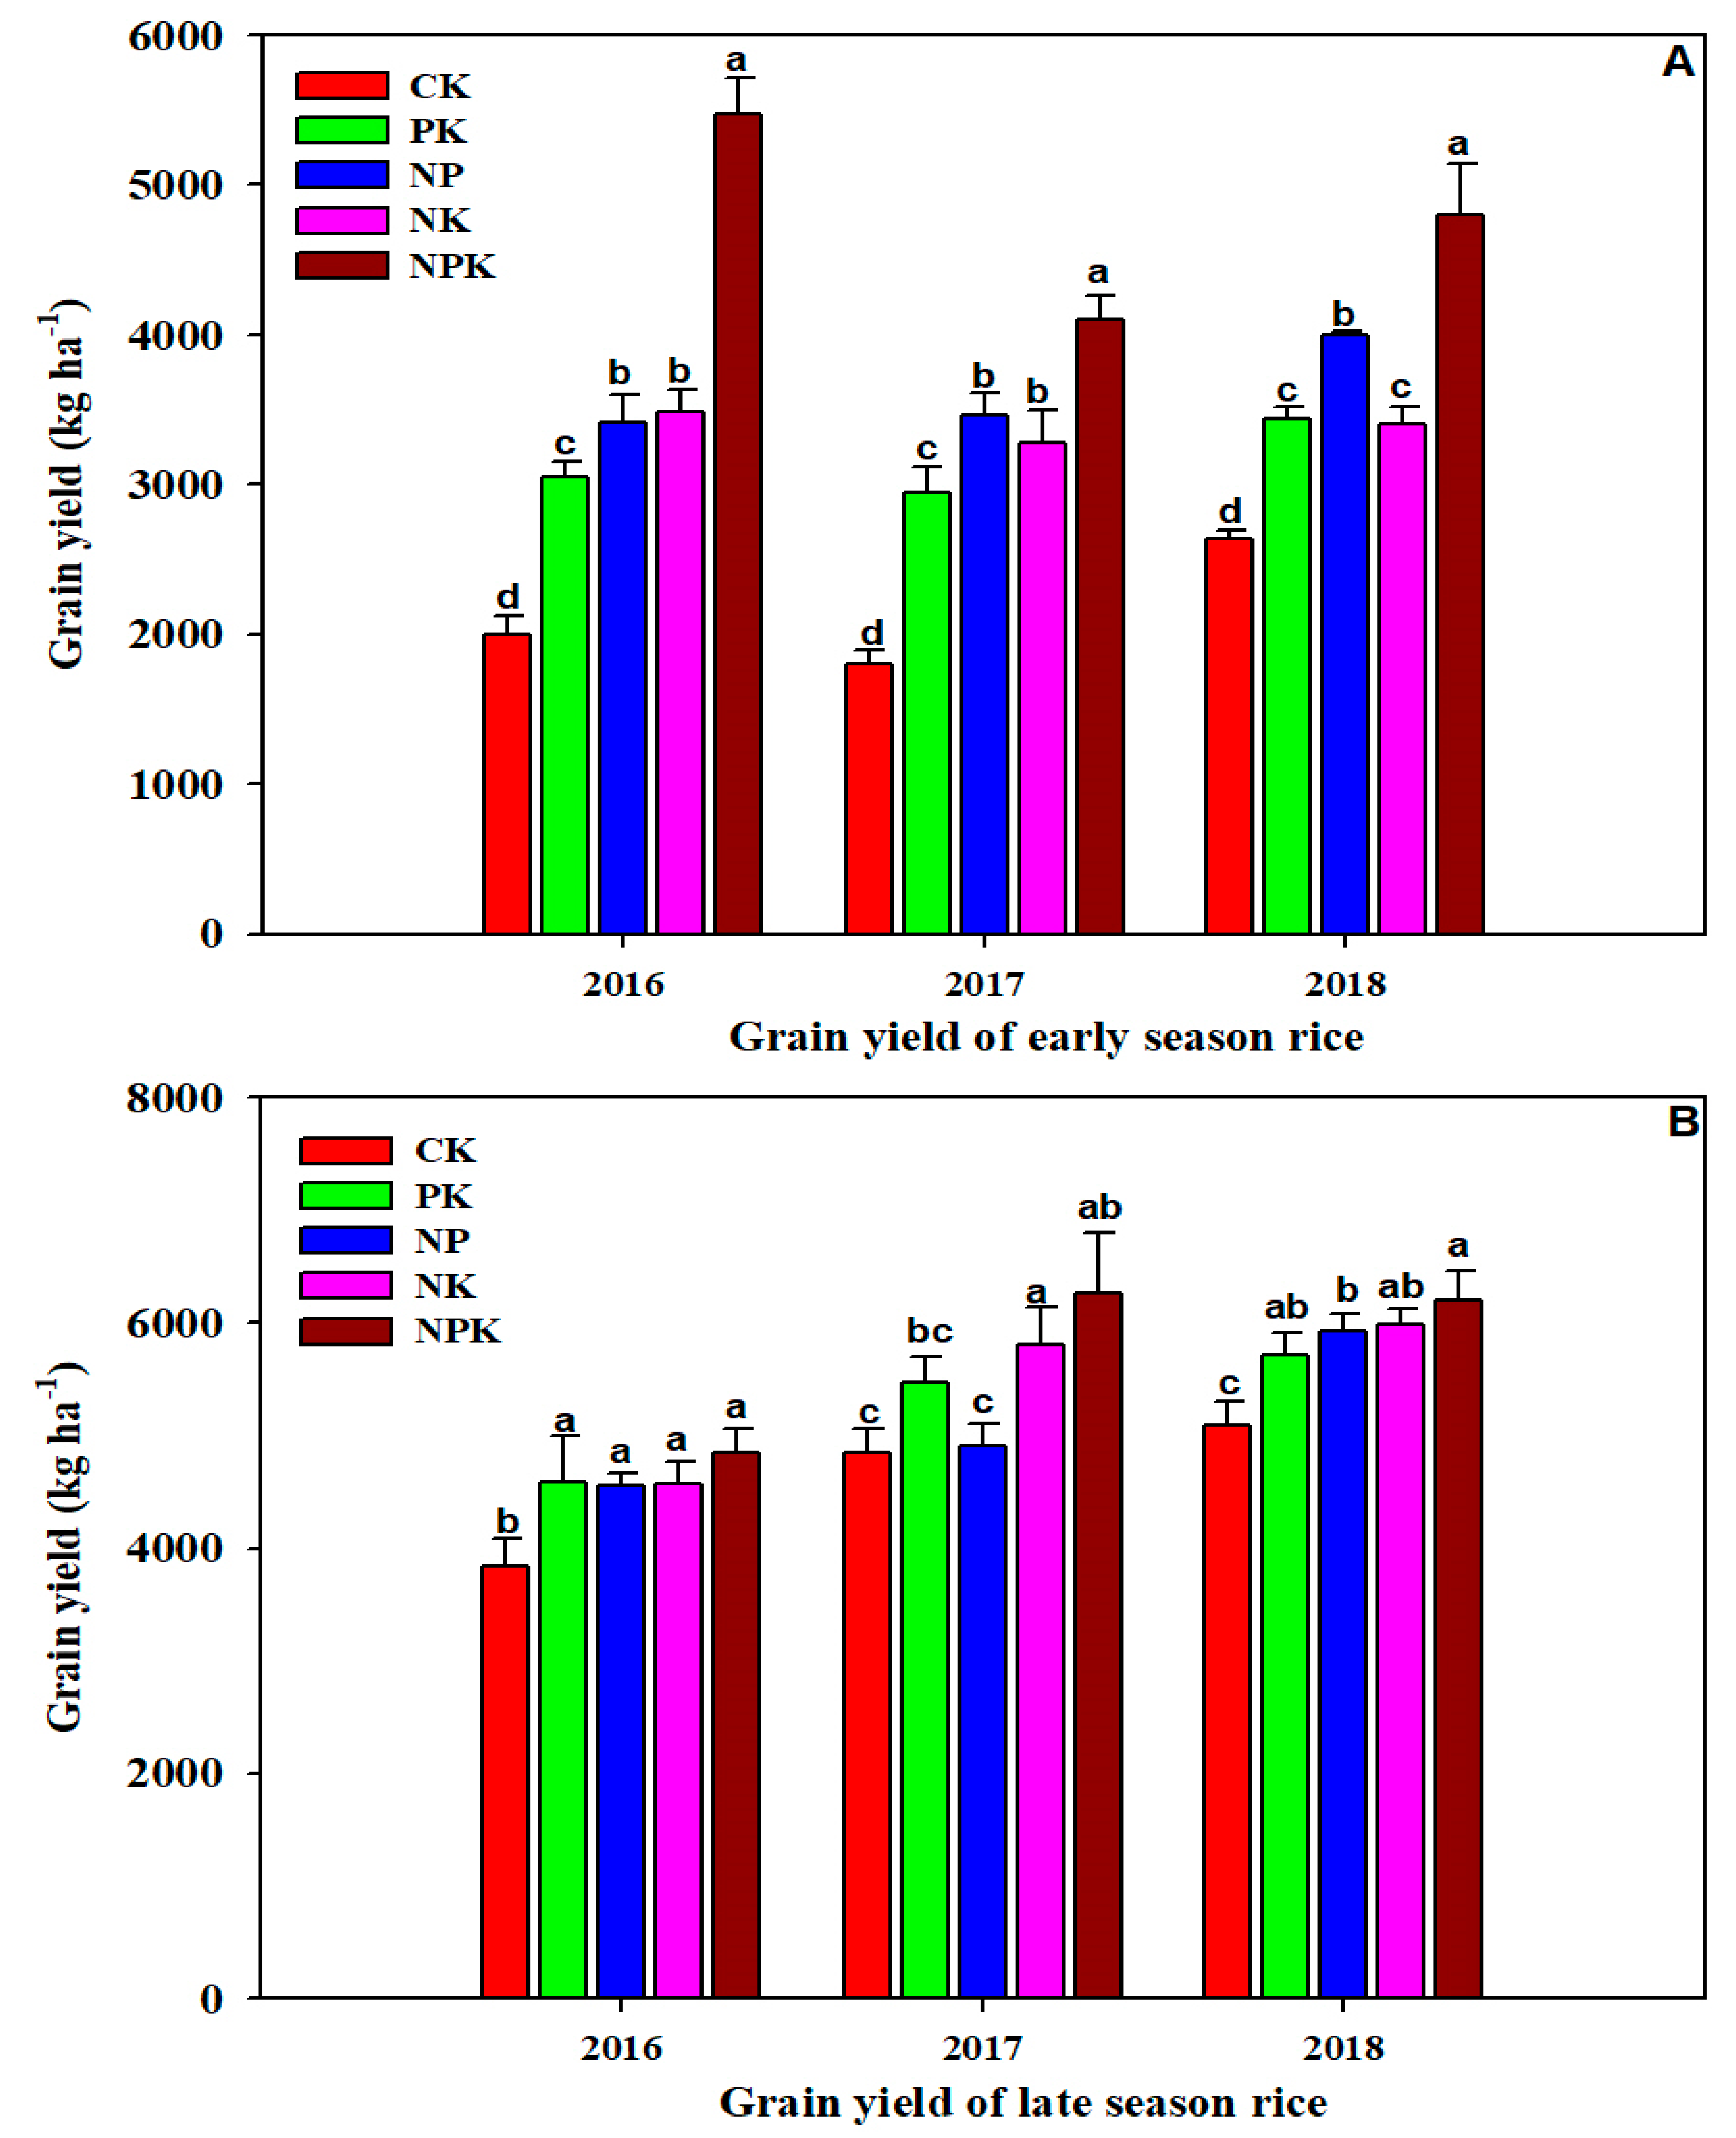
3.2. Rice Yield in Recent Three Years

The rice grain yields significantly (p < 0.05) higher with fertilizers application than in CK (Figure 2A). NP treatment had higher yields than NK and PK in 2017 and 2018. In 2016, the early-season rice grain yield in NP was close to NK but still higher than PK. As for late-season rice, NPK had the highest yield and CK had the lowest grain yield (Figure 2B).

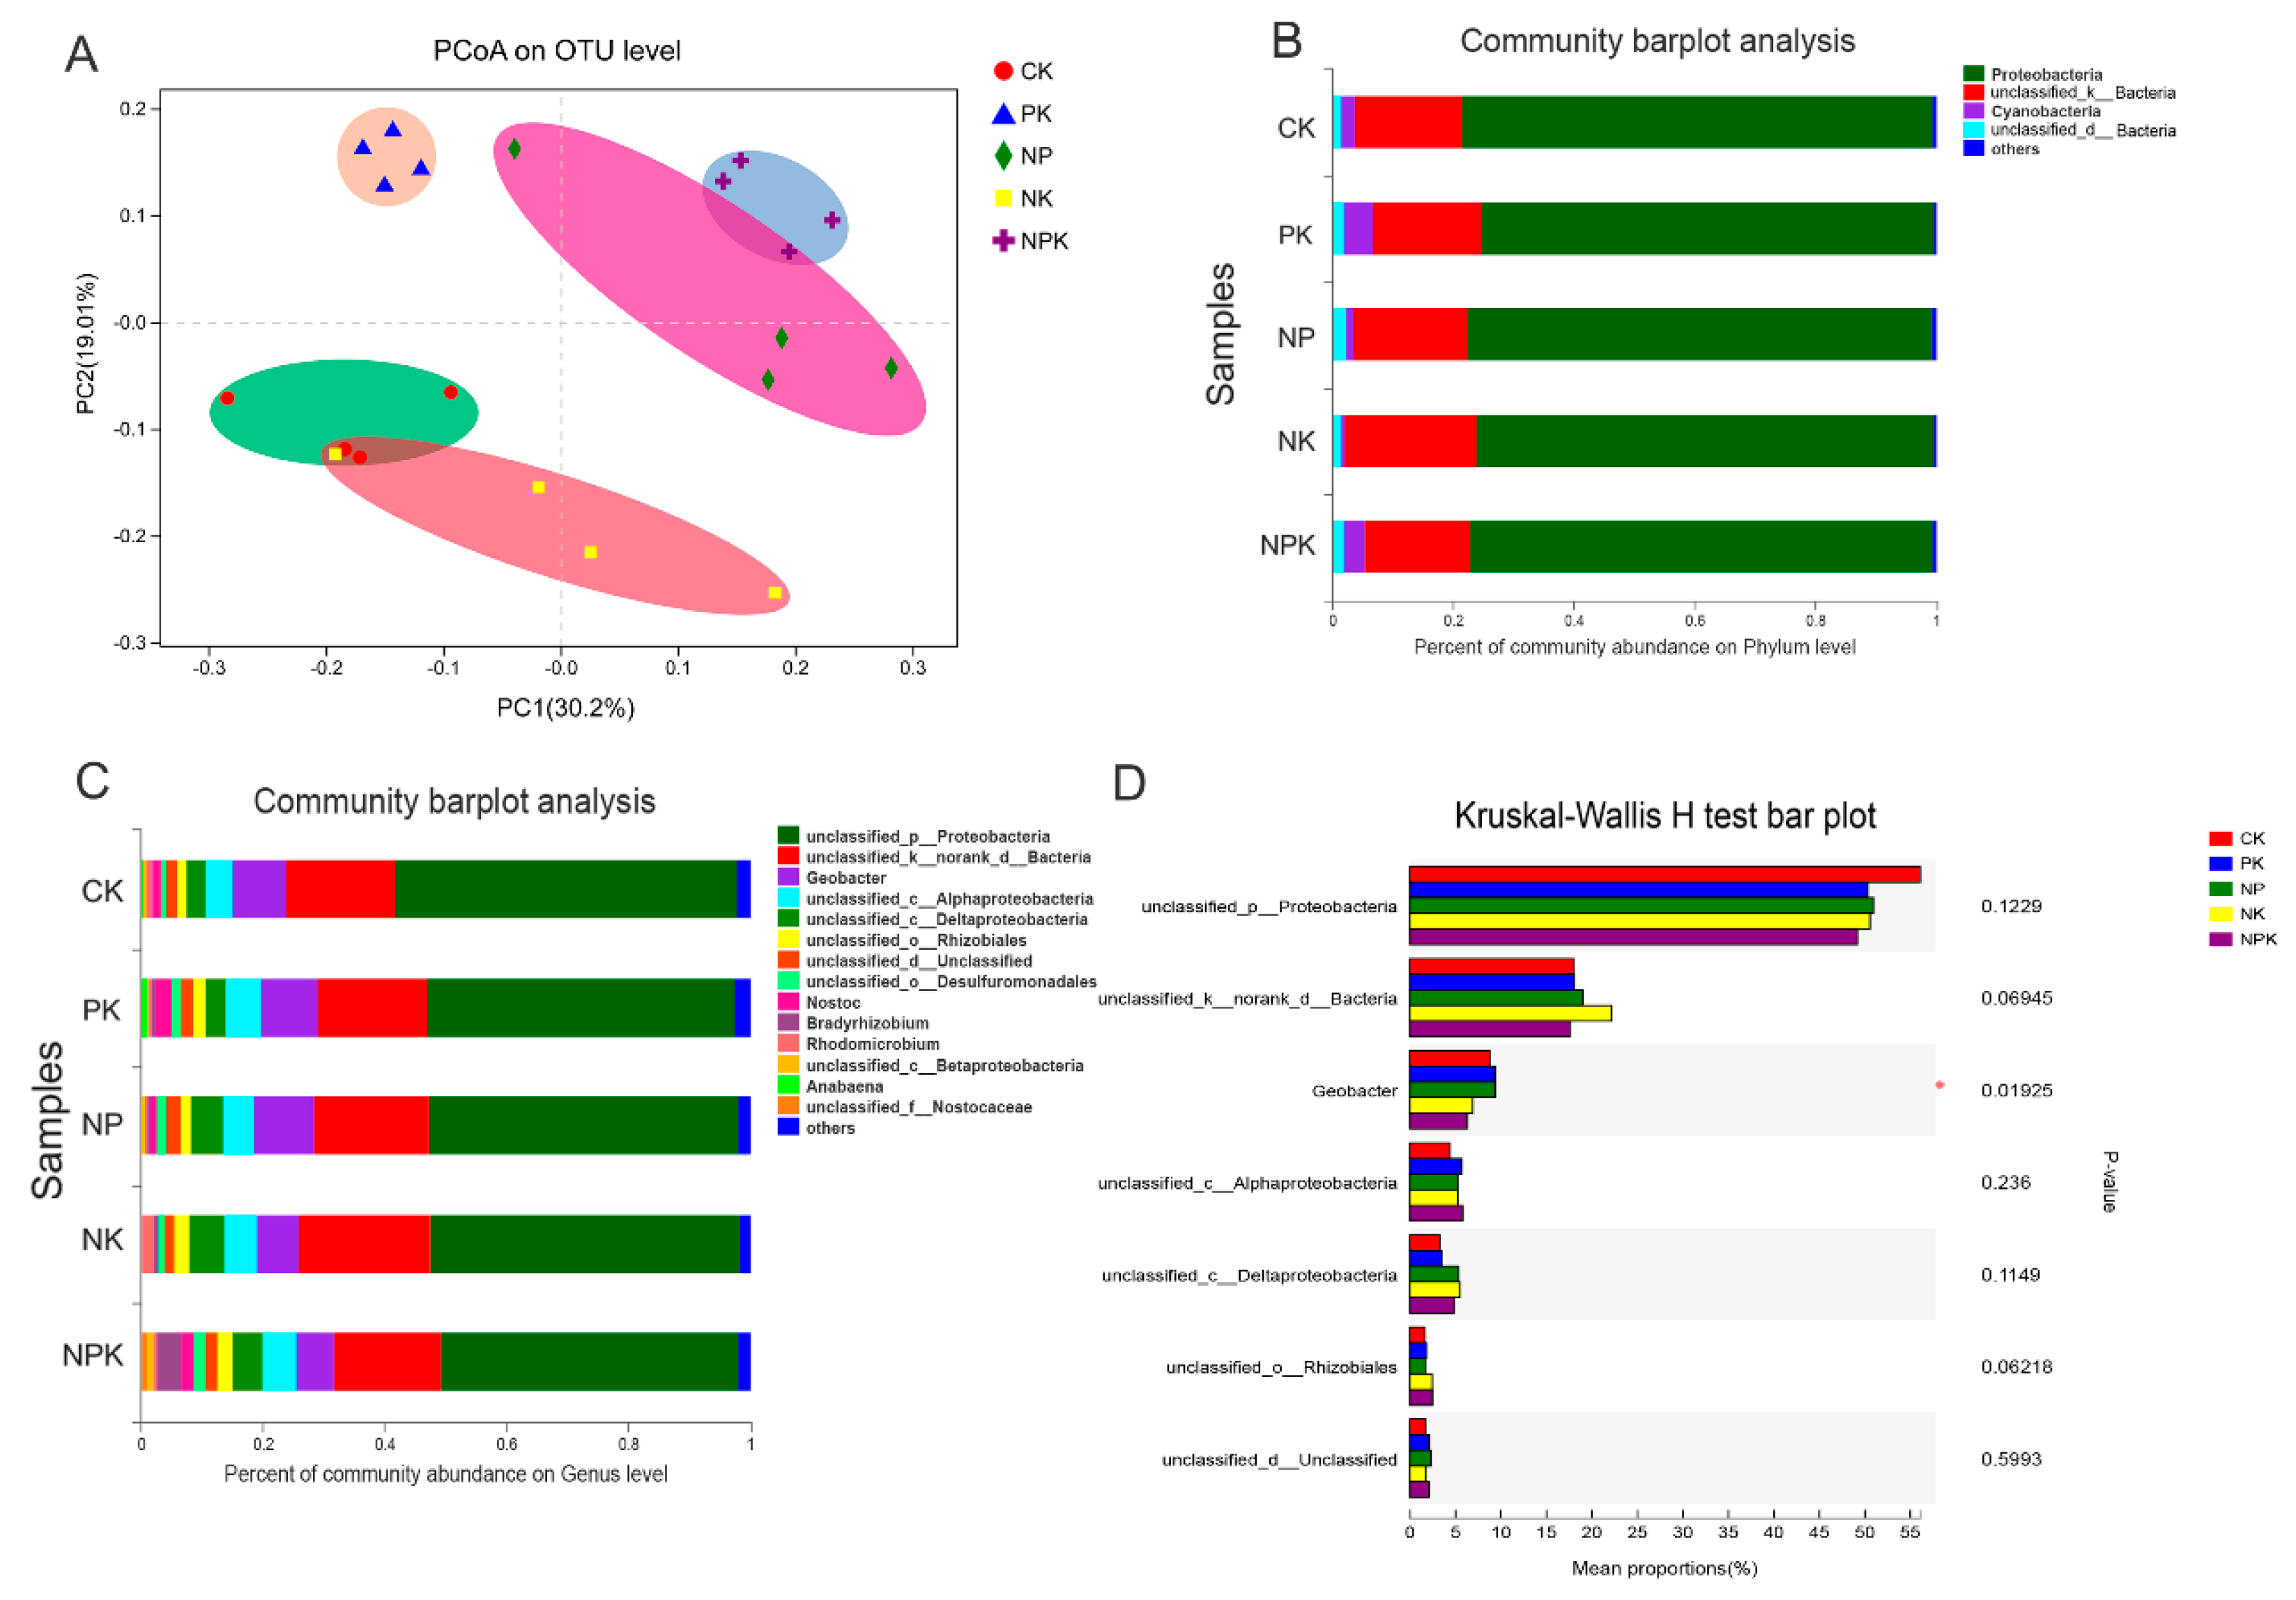
3.3. Effects of Different Fertilization Strategies on Bacterial Diversity

At the phylum level, proteobacteria, chloroflexi, acidobacteria, nitrospirase, and actinobacteria were the top 5 abundant bacteria in all groups. The total abundance of these five bacteria was >80% in each group (Figure 3A). As for genus level, Nitrospira, norank_f_Anaerolineaceae, norank_c_Acidobacteria, norank_c_SBR2076, norank_f_Acidobacteriaceae_Subgroup_1_ and norank_f_Xanthobacteraceae were the genera in each group (Figure 3B). We also found that the abundance of norank_f_Acidobacteriaceae_Subgroup_1, norank_f_Xanthobacteraceae, norank_f_Nitrosomonadaceae and Geobacterwere was significantly different in NPK vs. CK (Figure 3C). In addition, norank_c_SBR2076, norank_f_Acidobacteriaceae_Subgroup_1, and norank_o_SC-I-84 showed significantly different abundance between PK and NK, of which norank_f_Acidobacteriaceae_Subgroup_1_ in PK was significantly lower than that in NPK (Figure 3C,D). Geobacter in NP showed a higher abundance compared with NK and NPK (Figure 3C). Similarly, Nitrospira and norank_f_Xanthobacteraceae in NK had a higher abundance than that in NPK (Figure 3D). There were no significant differences in bacteria found in abundance between the other pairwise comparisons.

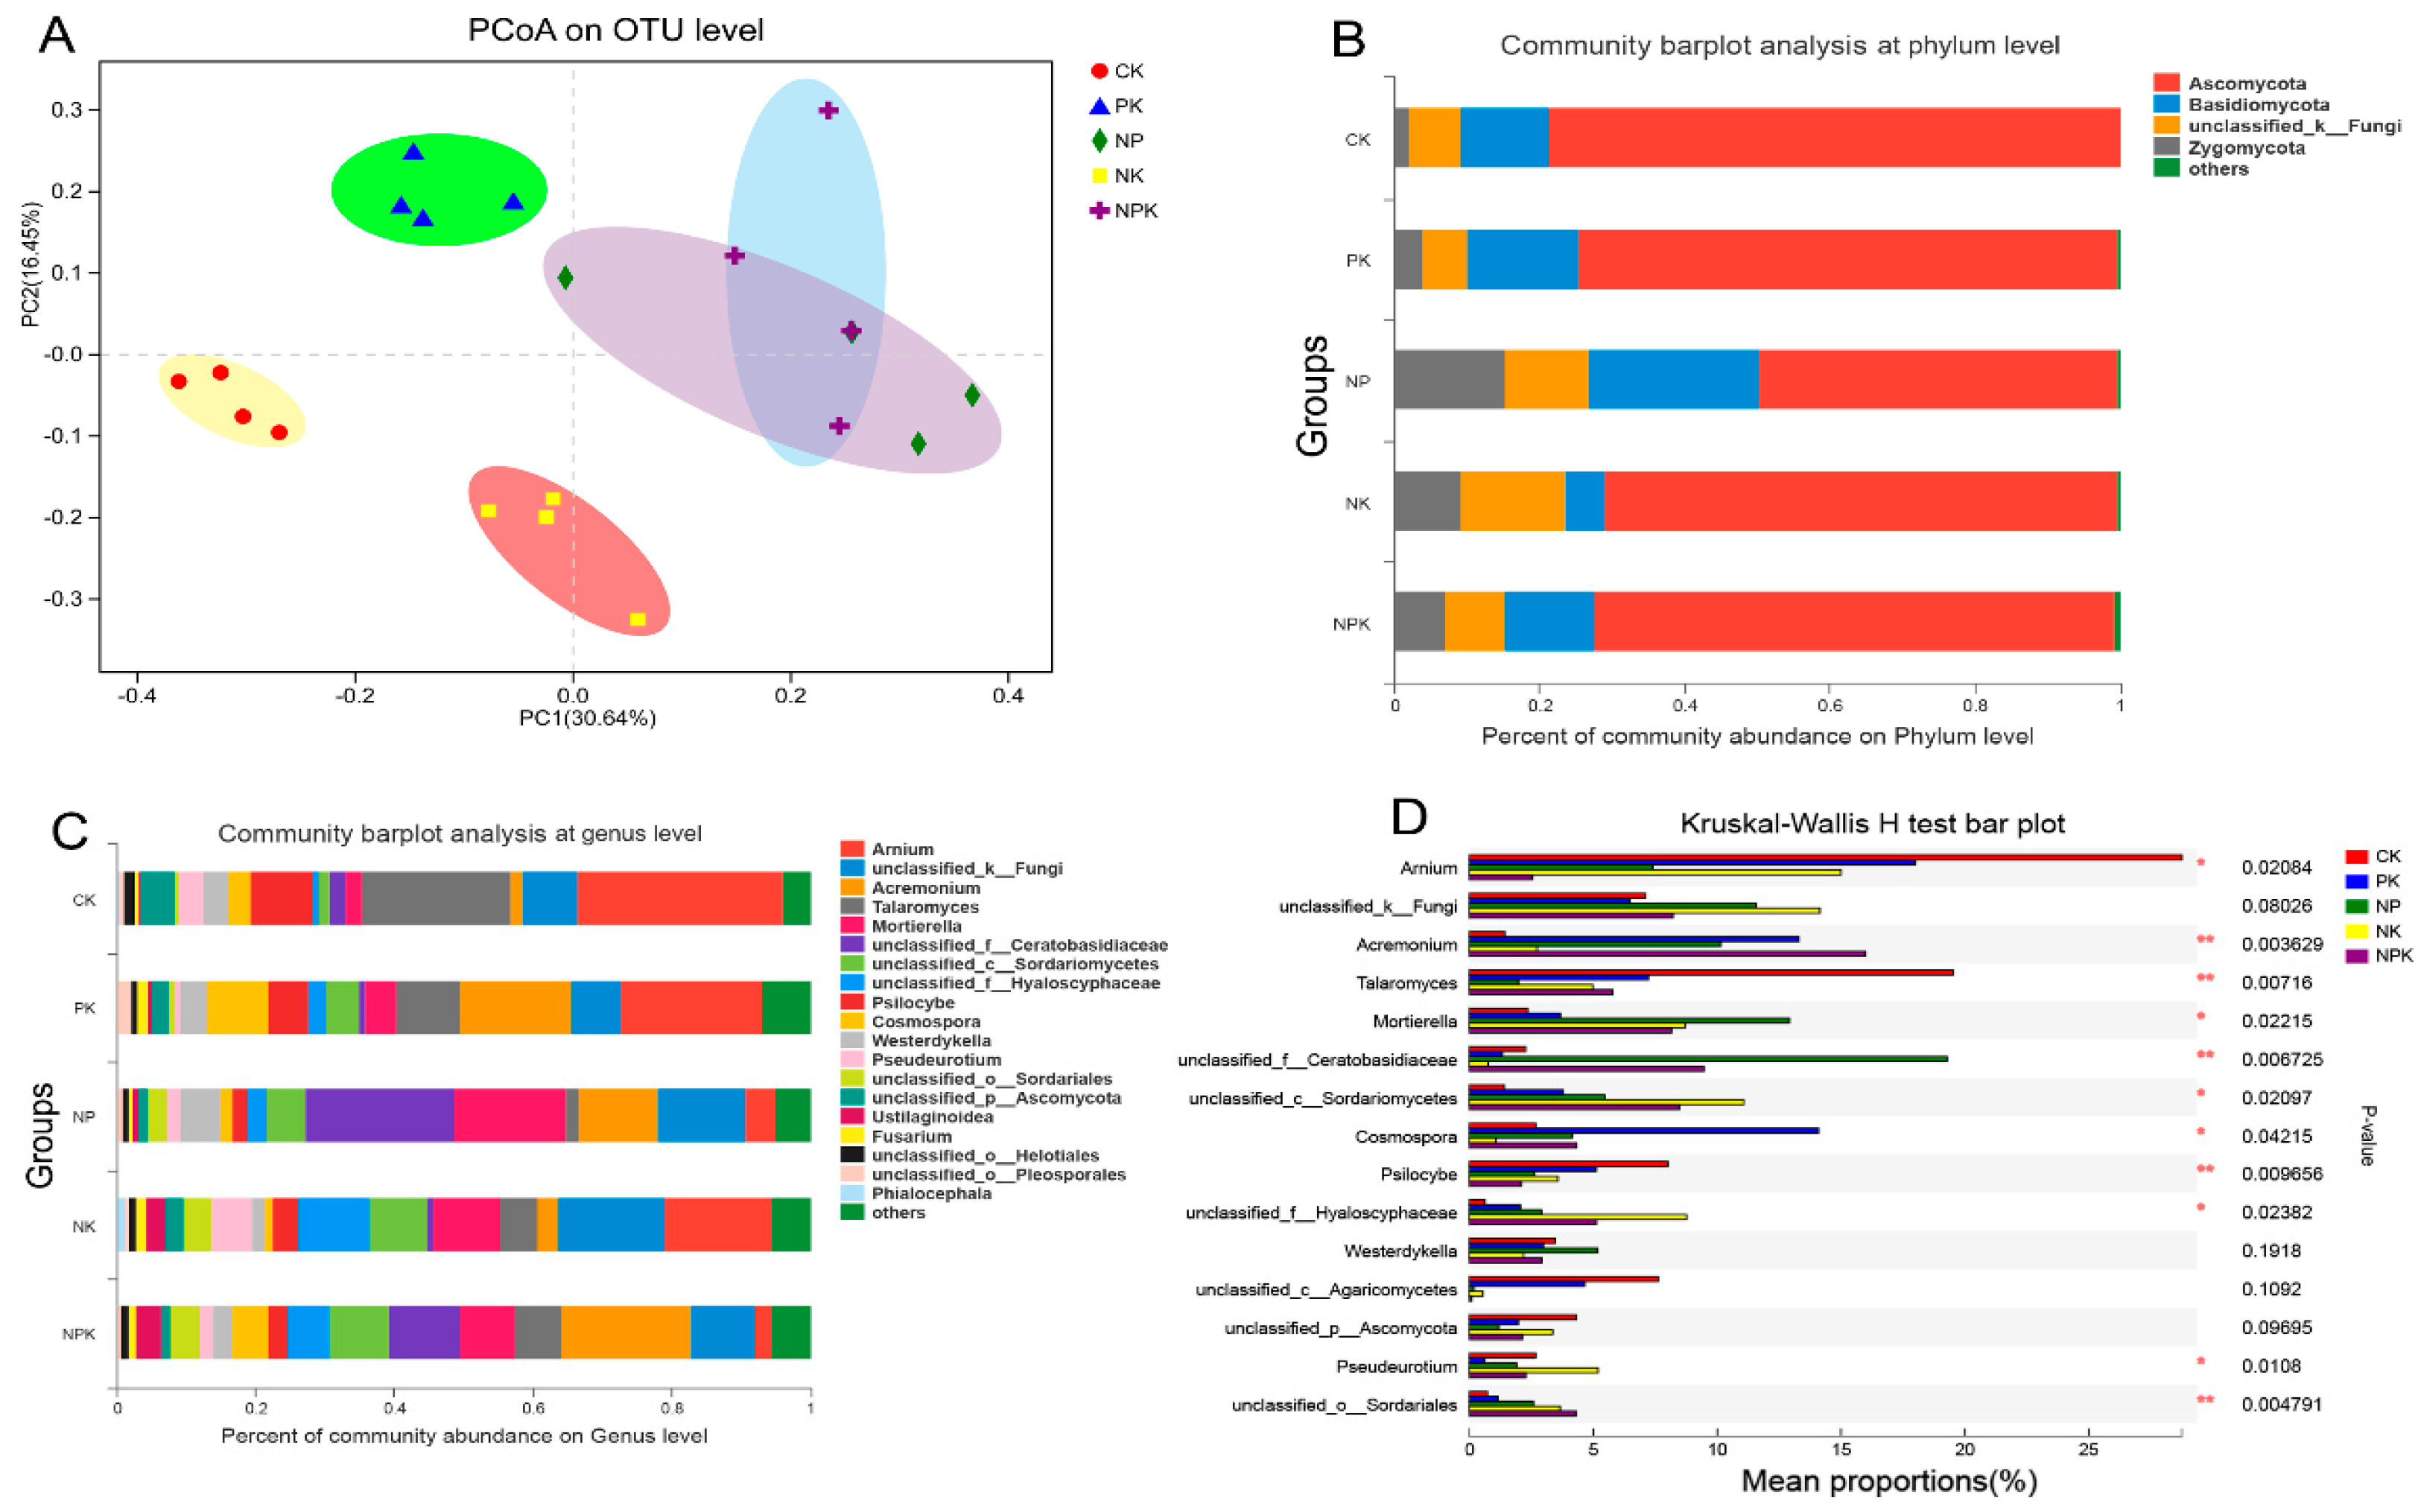
3.4. Effects of Different Fertilization Strategies on Fungal Diversity

The results indicate Shannon, Simpson, Ace, and Chao were significantly different among different groups (Table 3). PK, NK, and NPK had more fungal diversity than CK based on the Shannon index. Simpson in CK was significantly higher than NK and NPK. Ace was higher in PK was higher than CK, NP, and NK, and Chao in PK was significantly higher than NP. All the α-diversity indexes indicated that the fungal diversity in CK was lower than in other groups. The effect of different NPK fertilization strategies on the β-diversity of the total soil fungal diversity was also determined. PCoA showed a clear separation of different groups along PC1 (30.64%) and PC2 (16.45%) of the variance observed (Figure 4A). Ascomycota, Basidiomycota, and Zygomycota were the abundant classified phyla. At the genus level, Arnium, Acremonium, Talaromyces, Mrotierella, unclassified_f_Ceratobasidiaceae, unclassified_c_Sordariomycetes, unclassified_f_Hyaloscyphaceae and Psiloocybe were the dominant fungal and showed great differences between pairwise groups (Figure 4C). The abundance of Arnium showed a negative correlation with the balanced fertilization of N and P. Acremonium and Mrotierella showed a positive correlation with P and N fertilizers, respectively. Arnium and Talaromyces had higher relative abundance in CK, but decreased significantly in the fertilizer group.

3.5. Effects of Different Fertilization Strategies on Nitrogen-Fixing Bacteria

As for β-diversity, different groups separated along PC1 (30.2%) and PC2 (19.01%) (Figure 5A). Proteobacteria, Cyanobacteria, and some unclassified bacteria were the most abundant phyla and these phyla comprised most of all detected nitrogen-fixing bacteria (Figure 5B). A significantly higher abundance of Cyanobacteria was found in PK and NPK (Figure 5C) than in other groups. At the genus level, unclassified_p_Proteobacteria, unclassified_k_norank_d_Bacteria, Gerbacter, unclassified_c_Alphaproteobacteria, and unclassified_c_Deltaproteobacteria were the abundant bacteria, which accounted for more than 80% of all genera (Figure 5D).

3.6. Effects of Different Fertilization Strategies on Denitrifying Bacteria

The α-diversity indexes showed that CK had a wider variety of denitrifying bacteria. In contrast, the NP and NPK groups had a lower one (Table 3). The β-diversity results showed a distinct difference among different groups (Figure 6A). Proteobacteria and some unclassified bacteria dominated the denitrifying bacteria diversity in this study (Figure 6B,C). Furthermore, the highest and lowest relative abundance of proteobacteria was observed in PK and NPK, respectively (Figure 6D).

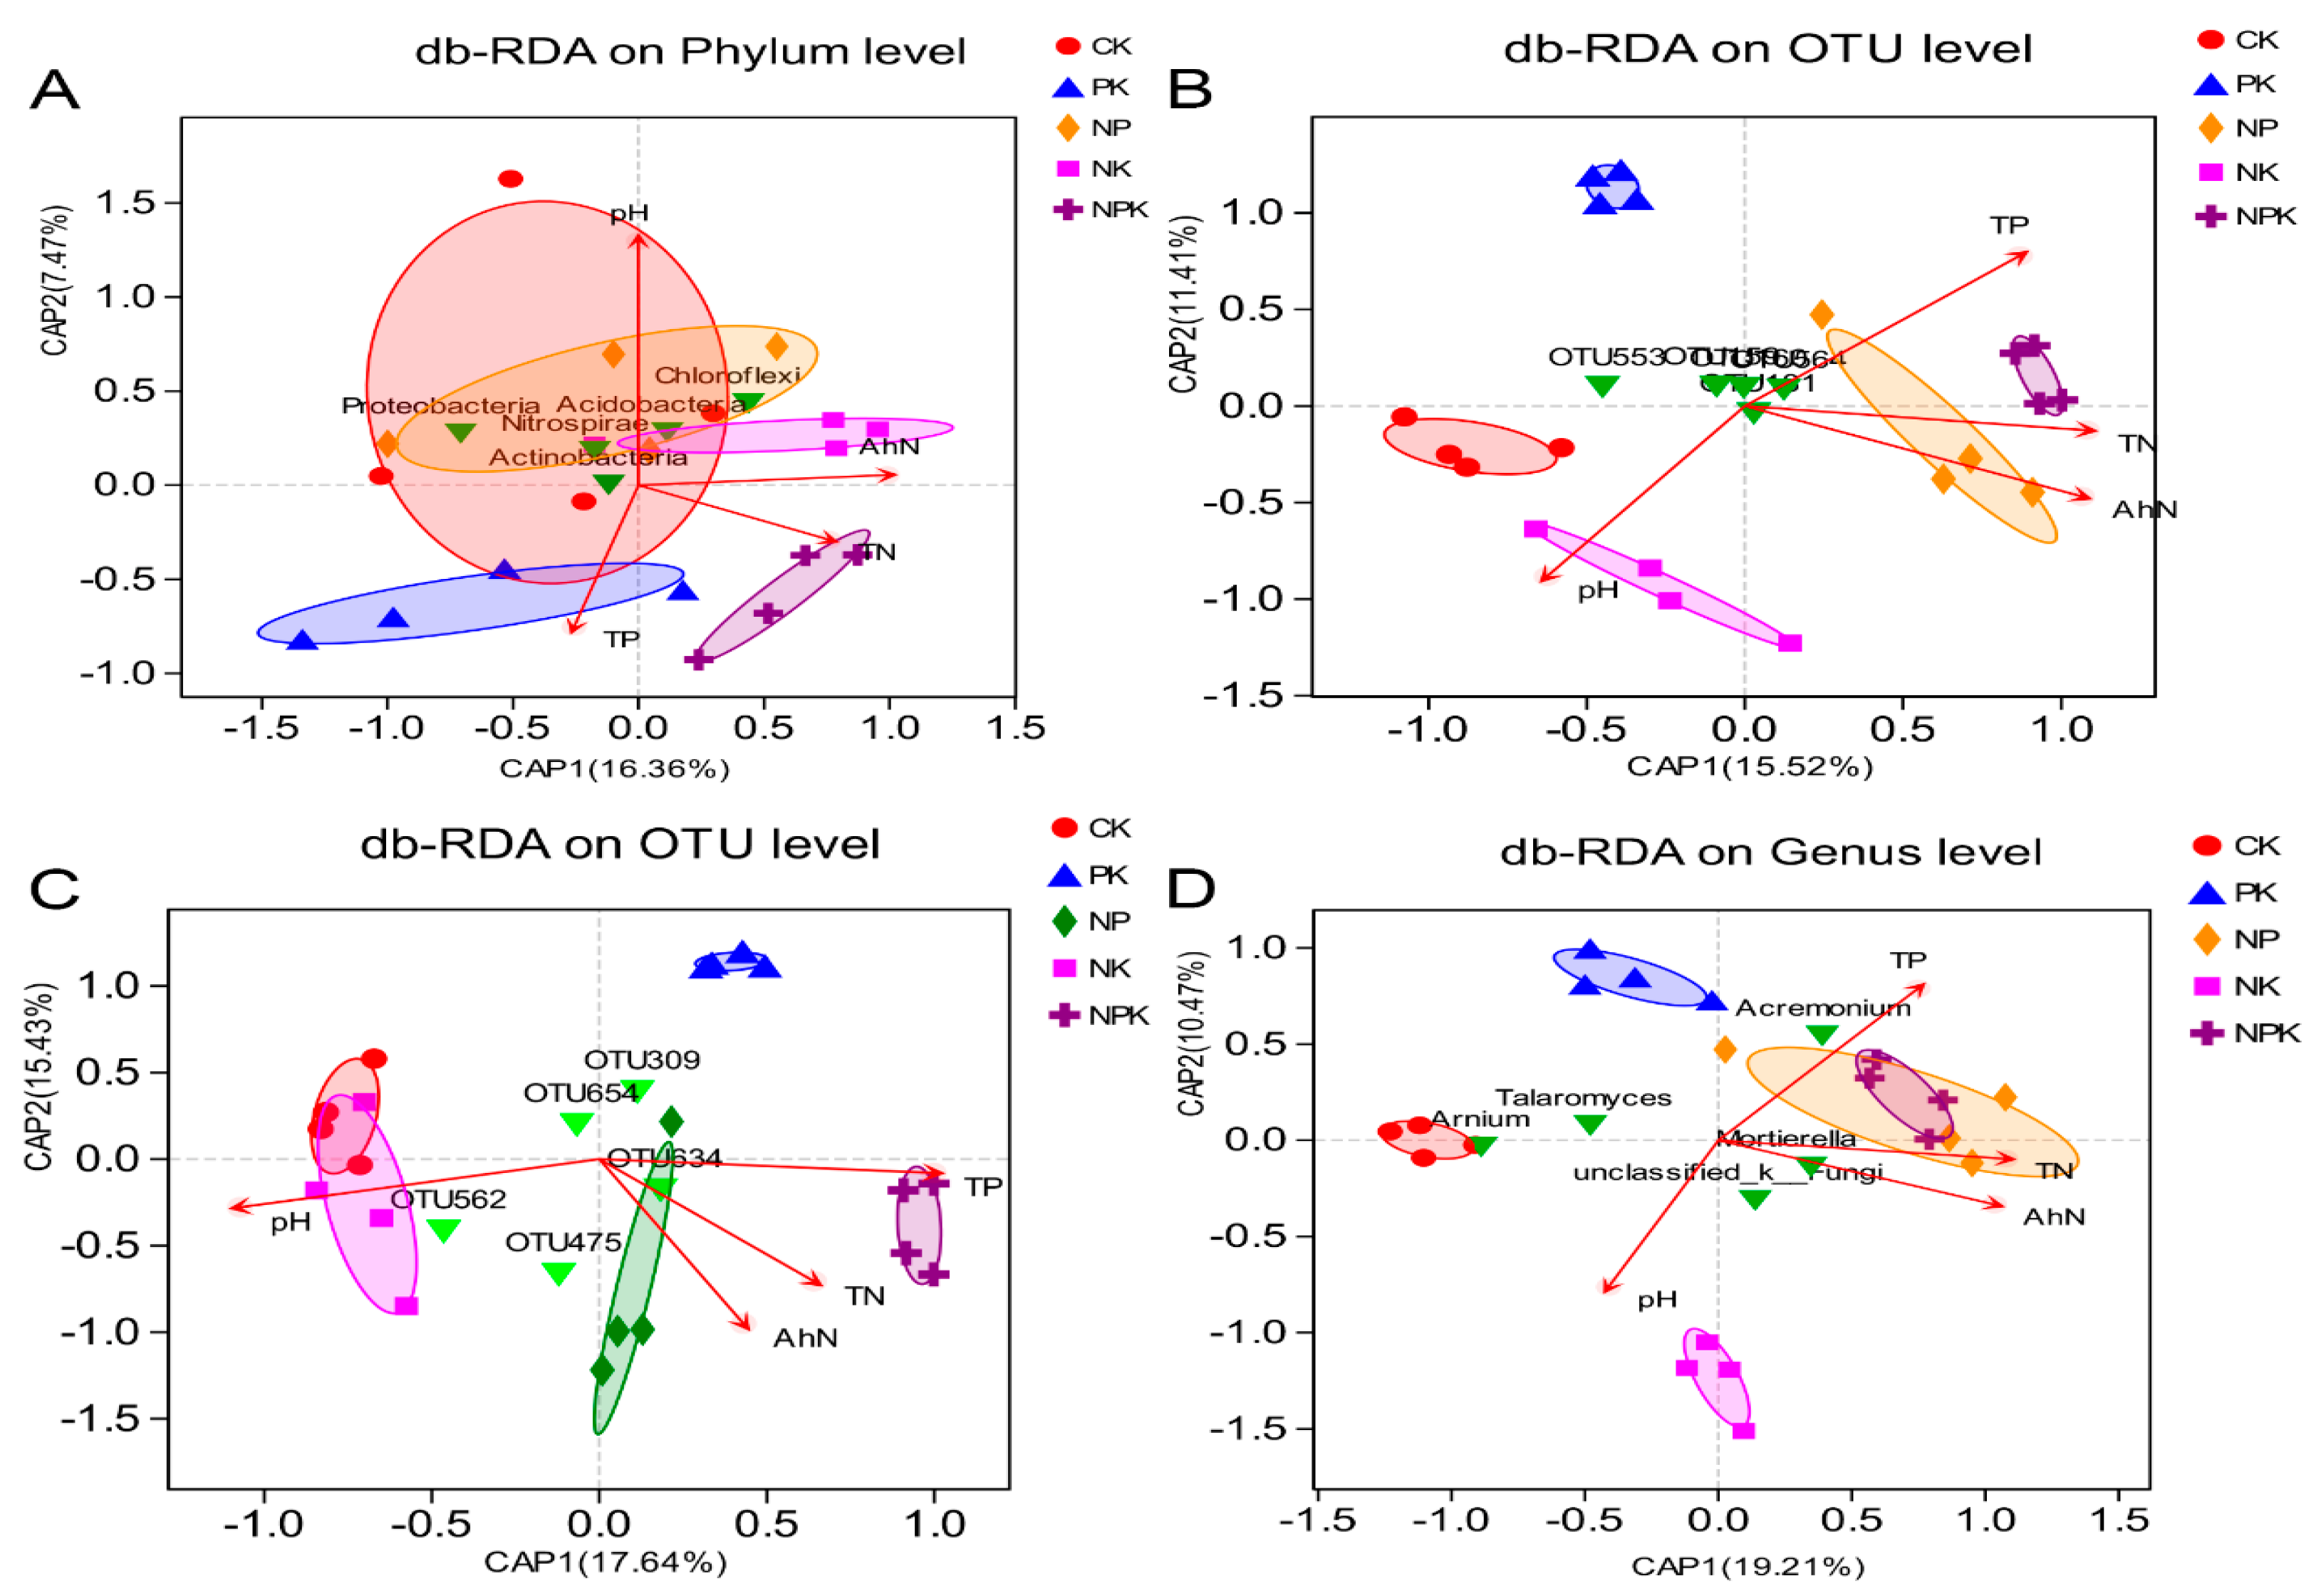
3.7. Potential Drivers of Bacterial Community Compositions

Distance-based redundancy analysis (db-RDA) was performed to evaluate the effects of biotic and abiotic environmental parameters on bacterial community structure in each size fraction. The db-RDA results showed that pH, TN, TP, and AhN were the most influential parameters in all samples. The relative abundance of bacteria was significantly affected by soil properties. The results showed that NK and NPK were positively correlated with AhN and TN. Further, PK and NPK were positively correlated with TP (Figure 7A). For nitrogen-fixing bacteria in NP and NPK, they were positively correlated with TP, TN, and AhN, but negatively correlated with pH (Figure 7B). For denitrifying bacteria, NP and NPK were positively correlated with TP, TN, and AhN. CK and NK were positively correlated with pH values (Figure 7C). In addition, we found that TN and AhN promoted the bacteria in N-contained fertilizer groups. In contrast, the groups without N showed a negative correlation with TN and AhN (Figure 7D). Similarly, the groups with and without P fertilizer showed a positive and negative correlation with TP, respectively. Moreover, the correlation analysis results of bacteria and crop yields showed that some bacteria and fungi are closely related to crop yield (Figure 8). Desulfuromonadales and Betaproteobacteria (nitrogen-fixing bacteria) were positively correlated with yields.

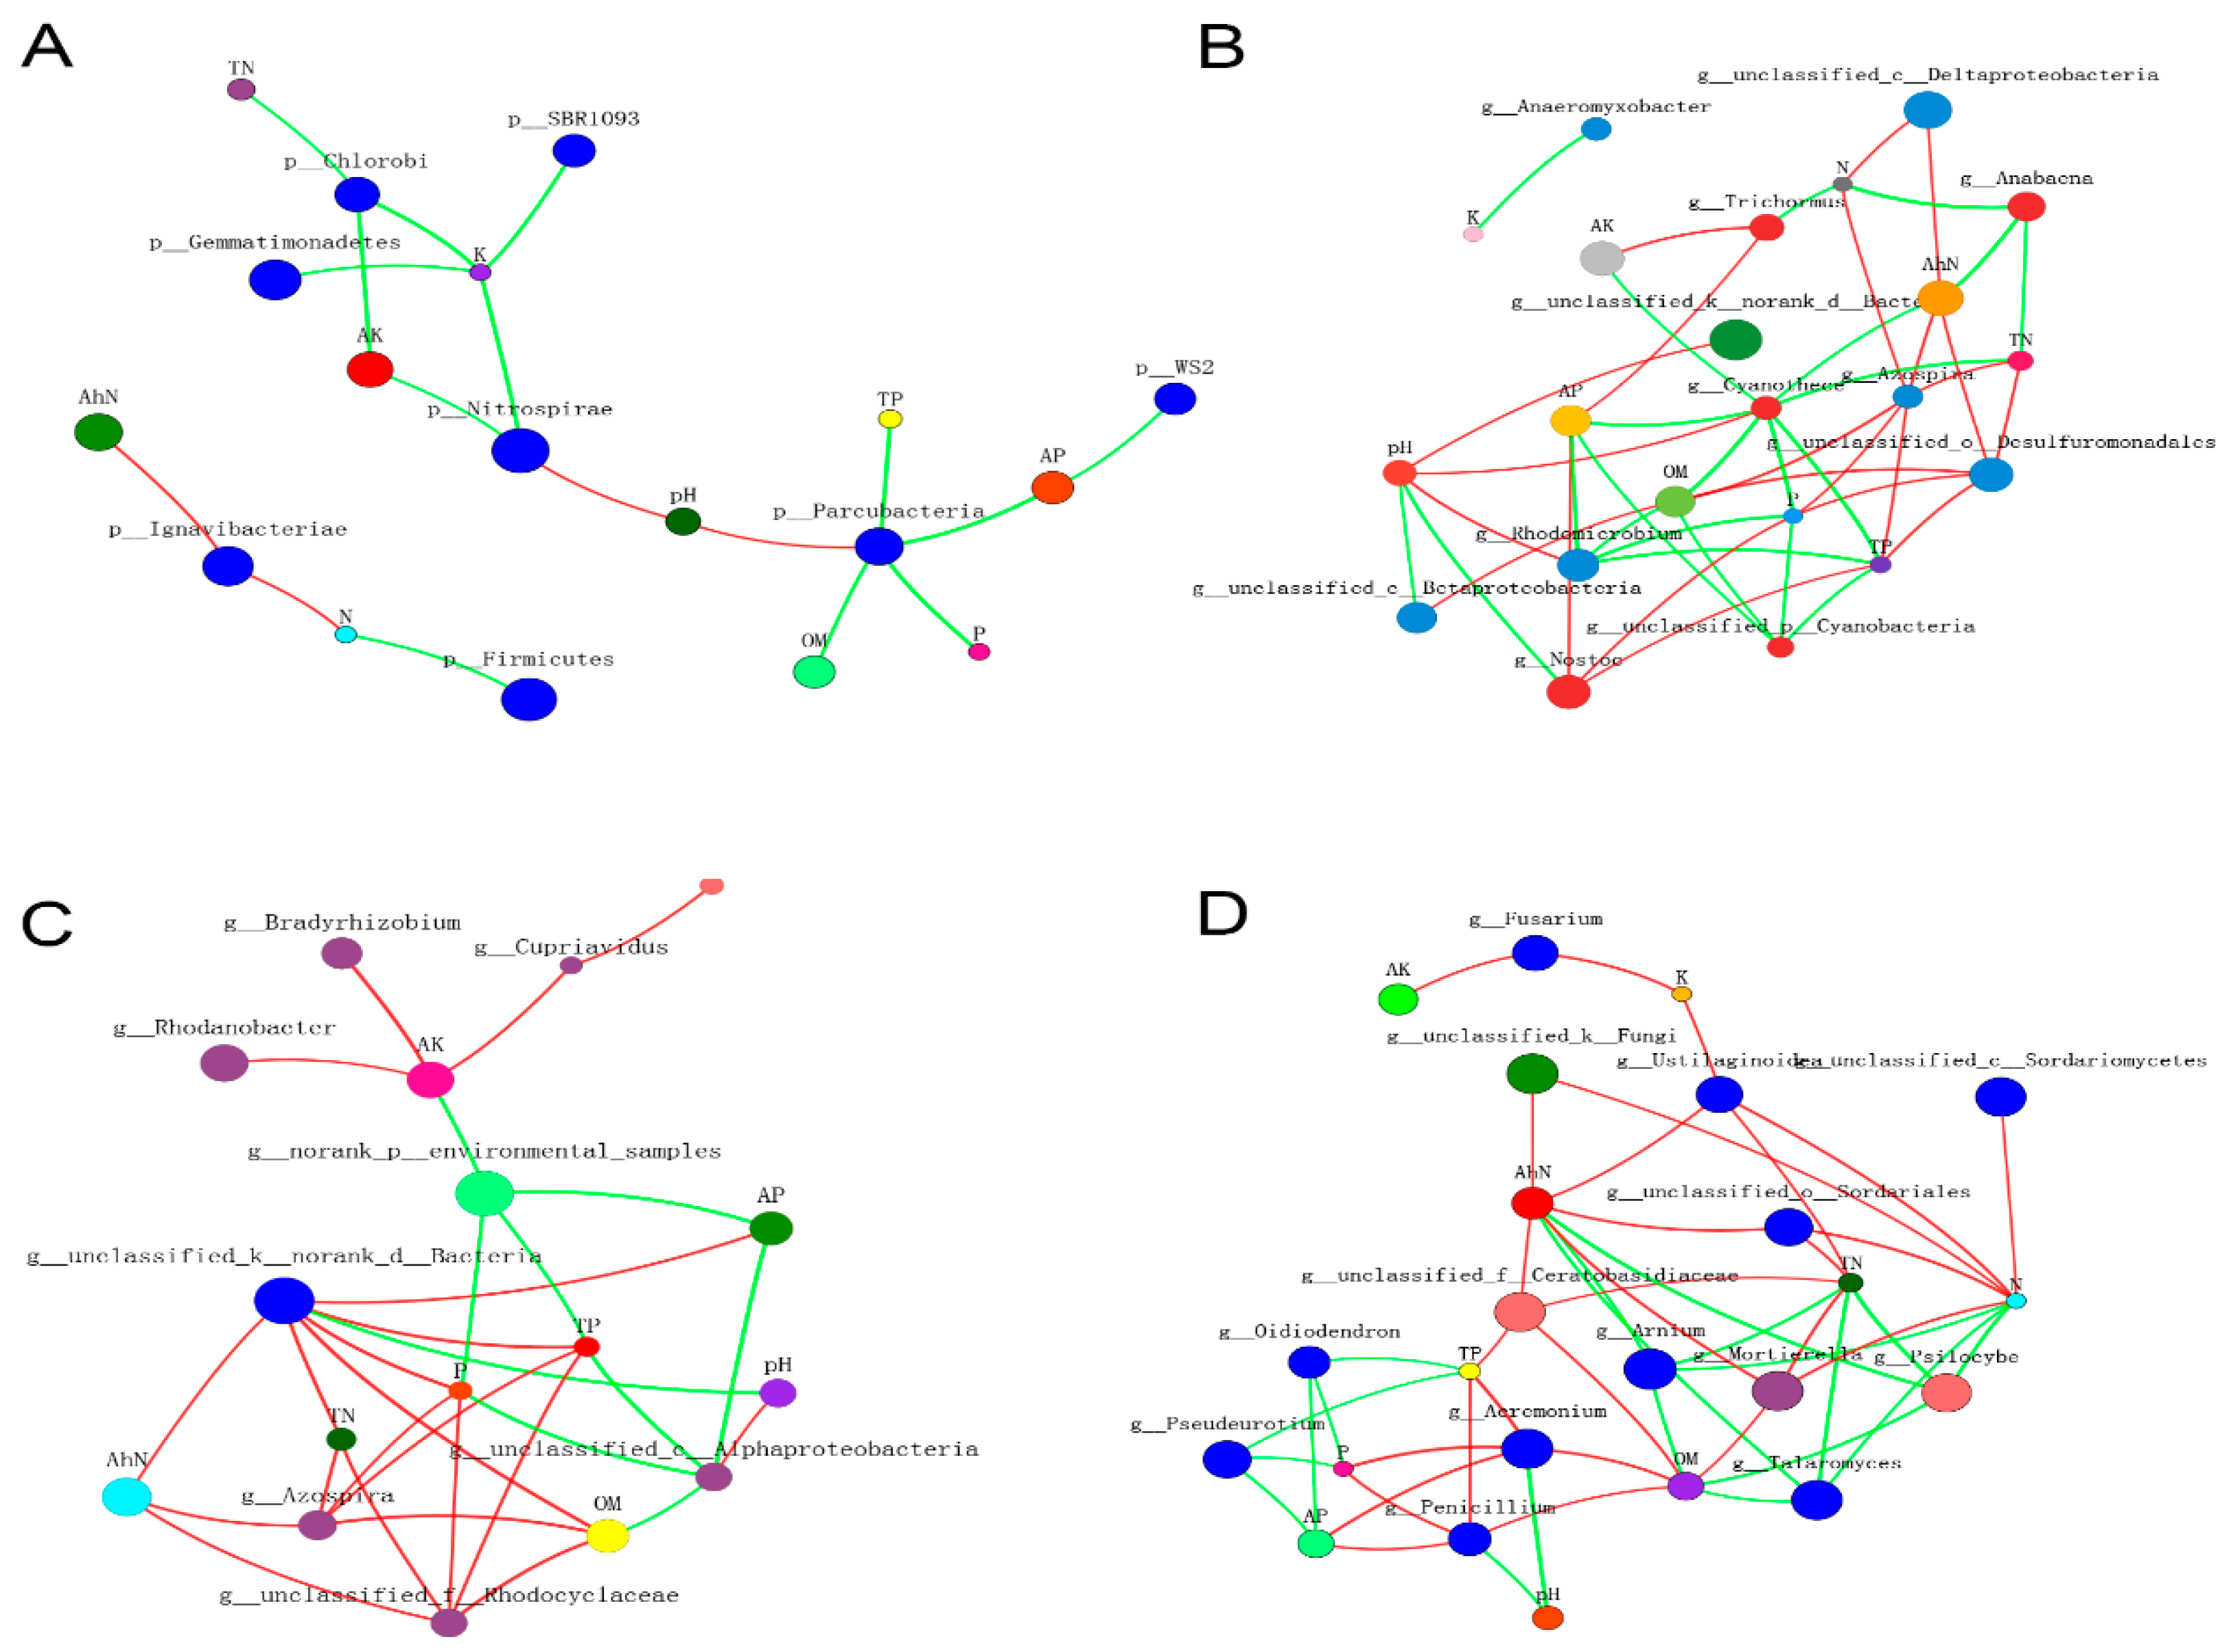
3.8. Two-Way Correlation Network Analysis

The two-way correlation network analysis results showed that Parcubacteria was negatively regulated by TP, AP, P, and OM, but positively regulated by pH (Figure 9A). For nitrogen-fixing bacteria, Cyanothece was negatively correlated by TN, AhN, AK, OM, P, and TP; Rhodomicrobium was negatively regulated by TN, AhN, AK, OM, P, and TP. Nostoc was positively regulated by AP, P, and TP (Figure 9B). For denitrifying bacteria, an unclassified bacteria was positively regulated by AhN, TN, OM, P, TP, and AP, but negatively regulated by pH (Figure 9C). Azospira was positively regulated by AhN, OM, TN, P, and TP (Figure 9C). As for fungi, Arnium and Psilocybe showed a negative correlation with N, TN, AhN, and OM (Figure 9D).

4. Discussion

Organic matter plays an important role in the biogeochemistry of carbon, nitrogen, and phosphorus and the transportation of pollutants [32]. The results indicate K supply capacity of soil in the current cropping period was reduced without potassium fertilizer, indicating potassium application is mandatory to get better yield. The balanced application of NPK fertilizers also increased the supply of NP, which could also be a reason for increased rice productivity. Interestingly, we found that soil acidification occurred in all treatments and the control. The local environmental pollution along with acid rain and use of acidic fertilizers (superphosphate) contributed to soil acidification. The application of NPK fertilizers significantly increased rice yield than the control. This indicates that balanced use of NPK fertilizers improved the soil fertility and increased the abundance of nitrogen-fixing bacteria, favorable bacteria, and fungi which contributed to a significant increase in rice productivity [33,34].
The improvement in soil properties by the application of chemical fertilization could make the soil environment more favorable for microbial growth [35,36]. However, in this study, long-term fertilization NPK fertilizers application showed no significant impacts on bacterial diversity, which aligns with earlier studies [37,38]. Opposite to this, some studies documented the positive impacts of fertilization on soil bacterial diversity [39,40]. Proteobacteria is the most well-distributed and abundant phylum in constructed soils [41]. We also noted that Proteobacteria was the most abundant phylum after NPK application while Acidobacteriaceae was the most abundant genera, and it showed a correlation with nitrogen fertilizer. Acidobacteriaceae contributed to soil nitrification and had the highest membership among nitrification-related genera [42]. However, there was little knowledge about the factors influencing the family Acidobacteriaceae and its role in the environment [43]. This study confirms the association between Acidobacteriaceae and N fertilizer, which might provide new evidence for the relationship between soil nitrification and N fertilizer. Proteobacteria (denitrifying bacteria) phyla showed a significant difference between different treatments [44]. The diversity of denitrifying bacteria in the non-fertilizer group was higher than that in the fertilizer group. Balanced fertilization of N, P, and K had less amount of denitrifying bacteria than unbalanced fertilization. This indicated that the balance of N, P, and K could improve the ability of soil to retain N fertilizer and reduce N loss.
The growth and activities of fungi are flexible to the crop yield and soil chemical, physical, and biological properties [45]. Inorganic nitrogen fertilizer could promote the growth of fungi [46,47]. The relative abundance of Mortierella, Psilocybe, and Talaromyces was significantly affected by N fertilizer. These findings align with Detheridge et al. who also reported Mortierella had a positive correlation with the soil N content [48]. Mortierella can degrade chitin and hemicellulose [49], which might play a role in promoting SOM. Talaromycesis distributed widely in soil, debris, organic matter, and marine invertebrates [50,51], which play a role in rice disease resistance [52]. The relative abundance of Talaromyces was negatively correlated with N fertilizer. It is likely due to the complex interaction between nitrogen and phosphorus in the soil. Acremonium includes about 100 species, which are known to be saprobic on dead plants or soil dwellers [53,54]. Our results showed that the relative abundance of Acremonium was positively correlated with P fertilizer, suggesting that the P fertilizer could promote cellulose degradation ability in paddy soil leading to an increase in Acremonium abundance. Ceratobasidiaceae have important ecological roles as pathogens, saprotrophs, non-mycorrhizal endophytes, orchid mycorrhizal, and ectomycorrhizal symbionts [55]. Ceratobasidiaceae (Unclassified_f) showed a positive correlation with the balanced fertilization of N and P.
The correlation analysis showed that the nitrogen-fixing bacteria were closely related to yield. Betaproteobacteria are a class of gram-negative bacteria, and one of the eight classes of the phylum Proteobacteria [56]. The abundance of N-fixing Desulfuromonadales and Betaproteobacteria contributes greatly to crop yield, which also indicates that the utilization of N fertilizer has an important effect on rice yield. In addition, the abundance of Zygomycota and Rozellomycota fungi was positively correlated with rice yield. Zhu et al. found that different N sources led to differences in the relative abundance of Zygomycota at various stages of maturation [57]. Rozellomycota is a fungus found in soil, freshwater, and marine sediments. Because of the lack of cell walls, Rozellomycota can phagocytose to obtain nutrients and it also secrete enzymes to decompose organic matter extracellularly and then absorb nutrients by diffusion [58]. This might be one of the mechanisms by which Rozellomycota contributed to an increase in rice yield after NPK application.

5. Conclusions

In the present study, the balanced application of NPK fertilizers significantly improved rice productivity. The increase in rice productivity was linked to a substantial increase in N availability following the application of NPK fertilizers. The application of NPK fertilizers also improved the diversity of favorable bacteria and fungi. The abundance of favorable bacteria (Acidobacteriaceae and Proteobacteria), fungi (Mortierella), and nitrogen-fixing bacteria (Betaproteobacteria and Desulfuromonadales) increased with balanced NPK fertilizers, which contributed to an increase in rice yield. Thus, long-term balanced NPK fertilizers can improve rice productivity in Quaternary red soil. The farmers can apply a balanced dose of NPK fertilizers to improve soil fertility and crop productivity. However, more studies are needed under different soil and climate conditions.

Supplementary Materials

The following supporting information can be downloaded at https://www.mdpi.com/article/10.3390/agronomy14102311/s1. Figure S1: Basic statistics of sequencing data.

Author Contributions

Conceptualization, Y.L. and Z.L.; methodology, Y.L.; data curation, Y.L. and Z.L.; writing—original draft preparation, Y.L. and Z.L.; writing—review and editing, H.H., X.L. (Xianjin Lan), J.J., X.L. (Xiumei Liu) and L.C. All authors have read and agreed to the published version of the manuscript.

Funding

The study was supported by the National Key Research and Development Program of China (No. 2023YFD1901100); Jiangxi Province major science and technology research and development project (No. 20213AAF02023); National Science Foundation project (No. 32060725); Young Elite Scientists Sponsorship Program by JXAST (No. 2023QT03); National Natural Science Foundation of China (No. 32160767); the Natural Science Foundation of Jiangxi Province, China (No. 20212BAB205020); Jiangxi Provincial Key Laboratory of Agricultural Non-point Source Pollution Control and Waste Comprehensive Utilization (2024SSY04211).

Data Availability Statement

Raw data supporting the results of this study are available from the corresponding author upon reasonable request.

Conflicts of Interest

The authors declare no conflicts of interest.

References

  1. Khmelevtsova, L.; Konstantinova, E.; Karchava, S.; Klimova, M.; Azhogina, T.; Polienko, E.; Khammami, M.; Sazykin, I.; Sazykina, M. Influence of pesticides and mineral fertilizers on the bacterial community of arable soils under pea and chickpea crops. Agronomy 2023, 13, 750. [Google Scholar] [CrossRef]
  2. Bedano, J.C.; Lavelle, P.; Zou, X. Soil biodiversity for the sustainability of agroecosystems. Acta Oecol. 2021, 110, 103705. [Google Scholar] [CrossRef]
  3. Zhang, J.; Song, Y.; Wang, J. Spatiotemporal patterns of gross ecosystem product across China’s cropland ecosystems over the past two decades. Front. Ecol. Evol. 2022, 10, 959329. [Google Scholar] [CrossRef]
  4. Zhang, Q.; Wang, C.; Sun, Z.; Li, S.; Liang, Y. Research progress on influencing factors of soil microbial biomass and diversity. North Hortic. 2022, 503, 116–121. [Google Scholar]
  5. Jin, C.; Zheng, M.-J.; Pang, D.-W.; Yin, Y.-P.; Han, M.-M.; Li, Y.-X.; Luo, Y.-L.; Xu, X.; Yong, L.; Wang, Z.-L. Straw return and appropriate tillage method improve grain yield and nitrogen efficiency of winter wheat. J. Integr. Agric. 2017, 16, 1708–1719. [Google Scholar]
  6. Li, L.; Feng, J.; Liu, M.; Mei, H.; Kang, Z.; Cai, Q. Effect of crop planting patterns on soil microorganisms and crop pests in farmland. Chin. Agri. Sci. Bull. 2021, 37, 99–106. [Google Scholar]
  7. Liu, J.; Shu, A.; Song, W.; Shi, W.; Li, M.; Zhang, W.; Li, Z.; Liu, G.; Yuan, F.; Zhang, S. Long-term organic fertilizer substitution increases rice yield by improving soil properties and regulating soil bacteria. Geoderma 2021, 404, 115287. [Google Scholar] [CrossRef]
  8. Gao, X.F.; Yan, B.S.; Wu, C.X.; Wang, G. Effects of long term fertilization on soil quality and millet yield on slope farmland in loess hilly areas. Agric. Res. Arid Areas 2021, 39, 76–83. [Google Scholar]
  9. Li, X.; Zhao, B.Q.; Li, X.H.; Li, Y.T.; Sun, R.L.; Zhu, L.S.; Xu, J.; Wang, L.X.; Li, X.P.; Zhang, Z.F. Effects of different fertilization systems on soil microbe and its relation to soil fertility. Zhongguo Nongye Kexue 2005, 38, 1591–1599. [Google Scholar]
  10. Wu, M.; Qin, H.; Chen, Z.; Wu, J.; Wei, W. Effect of long-term fertilization on bacterial composition in rice paddy soil. Biol. Fertil. Soils 2011, 47, 397–405. [Google Scholar] [CrossRef]
  11. Tian, J.; Wang, J.; Dippold, M.; Gao, Y.; Blagodatskaya, E.; Kuzyakov, Y. Biochar affects soil organic matter cycling and microbial functions but does not alter microbial community structure in a paddy soil. Sci. Total Environ. 2016, 556, 89–97. [Google Scholar] [CrossRef] [PubMed]
  12. Kour, D.; Rana, K.L.; Yadav, A.N.; Yadav, N.; Kumar, M.; Kumar, V.; Vyas, P.; Dhaliwal, H.S.; Saxena, A.K. Microbial biofertilizers: Bioresources and eco-friendly technologies for agricultural and environmental sustainability. Biocatal. Agric. Biotechnol. 2020, 23, 101487. [Google Scholar] [CrossRef]
  13. Yu, C.; Li, Y.; Mo, R.; Deng, W.; Zhu, Z.; Liu, D.; Hu, X. Effects of long-term straw retention on soil microorganisms under a rice–wheat cropping system. Arch. Microbiol. 2020, 202, 1915–1927. [Google Scholar] [CrossRef] [PubMed]
  14. Tao, R.; Liang, Y.; Wakelin, S.A.; Chu, G. Supplementing chemical fertilizer with an organic component increases soil biological function and quality. Appl. Soil Ecol. 2015, 96, 42–51. [Google Scholar] [CrossRef]
  15. Kang, G.; Beri, V.; Sidhu, B.; Rupela, O. A new index to assess soil quality and sustainability of wheat-based cropping systems. Biol. Fertil. Soils 2005, 41, 389–398. [Google Scholar] [CrossRef]
  16. Nakhro, N.; Dkhar, M. Populations and biomass carbon in paddy field soil. Agron. J. 2010, 9, 102–110. [Google Scholar] [CrossRef]
  17. Castellano-Hinojosa, A.; Strauss, S.L.; González-López, J.; Bedmar, E.J. Changes in the diversity and predicted functional composition of the bulk and rhizosphere soil bacterial microbiomes of tomato and common bean after inorganic N-fertilization. Rhizosphere 2021, 18, 100362. [Google Scholar] [CrossRef]
  18. Semenov, M.V.; Krasnov, G.S.; Semenov, V.M.; van Bruggen, A.H. Long-term fertilization rather than plant species shapes rhizosphere and bulk soil prokaryotic communities in agroecosystems. Appl. Soil Ecol. 2020, 154, 103641. [Google Scholar] [CrossRef]
  19. Mei, N.; Zhang, X.; Wang, X.; Peng, C.; Gao, H.; Zhu, P.; Gu, Y. Effects of 40 years applications of inorganic and organic fertilization on soil bacterial community in a maize agroecosystem in northeast China. Eur. J. Agron. 2021, 130, 126332. [Google Scholar] [CrossRef]
  20. Su, P.; Lou, J.; Brookes, P.C.; Luo, Y.; He, Y.; Xu, J. Taxon-specific responses of soil microbial communities to different soil priming effects induced by addition of plant residues and their biochars. J. Soils Sediments 2017, 17, 674–684. [Google Scholar] [CrossRef]
  21. Lu, Z.; Deng, Y.; Van Nostrand, J.D.; He, Z.; Voordeckers, J.; Zhou, A.; Lee, Y.-J.; Mason, O.U.; Dubinsky, E.A.; Chavarria, K.L. Microbial gene functions enriched in the deep-water horizon deep-sea oil plume. ISME J. 2012, 6, 451–460. [Google Scholar] [CrossRef] [PubMed]
  22. Dwevedi, A.; Kumar, P.; Kumar, P.; Kumar, Y.; Sharma, Y.K.; Kayastha, A.M. Soil sensors: Detailed insight into research updates, significance, and future prospects. In New Pesticides and Soil Sensors; Elsevier: Amsterdam, The Netherlands, 2017; pp. 561–594. [Google Scholar]
  23. Feng, Z.F.Z.; Wang, P.W.P.; Liu, X.L.X.; Chen, X.C.X.; Ji, J.J.J.; Hou, H.H.H.; Liu, Y.L.Y.; Xia, W.X.W.; Lv, Z.L.Z.; Liu, G.L.G. Research progress and perspective of red soil improvement and utilization technologies in China. Acta Agric. Jiangxi 2017, 29, 57–61. [Google Scholar]
  24. Cao, C.; Jiang, S.; Ying, Z.; Zhang, F.; Han, X. Spatial variability of soil nutrients and microbiological properties after the establishment of leguminous shrub Caragana microphylla Lam. plantation on sand dune in the Horqin Sandy Land of Northeast China. Ecol. Eng. 2011, 37, 1467–1475. [Google Scholar] [CrossRef]
  25. Campbell, B.J.; Polson, S.W.; Hanson, T.E.; Mack, M.C.; Schuur, E.A. The effect of nutrient deposition on bacterial communities in Arctic tundra soil. Environ. Microbiol. 2010, 12, 1842–1854. [Google Scholar] [CrossRef]
  26. Wessén, E.; Hallin, S.; Philippot, L. Differential responses of bacterial and archaeal groups at high taxonomical ranks to soil management. Soil Biol. Biochem. 2010, 42, 1759–1765. [Google Scholar] [CrossRef]
  27. Gorfer, M.; Blumhoff, M.; Klaubauf, S.; Urban, A.; Inselsbacher, E.; Bandian, D.; Mitter, B.; Sessitsch, A.; Wanek, W.; Strauss, J. Community profiling and gene expression of fungal assimilatory nitrate reductases in agricultural soil. ISME J. 2011, 5, 1771–1783. [Google Scholar] [CrossRef]
  28. Tan, H.; Barret, M.; Mooij, M.J.; Rice, O.; Morrissey, J.P.; Dobson, A.; Griffiths, B.; O’Gara, F. Long-term phosphorus fertilisation increased the diversity of the total bacterial community and the phoD phosphorus mineraliser group in pasture soils. Biol. Fertil. Soils 2013, 49, 661–672. [Google Scholar] [CrossRef]
  29. Teotia, P.; Kumar, V.; Kumar, M.; Shrivastava, N.; Varma, A. Rhizosphere microbes: Potassium solubilization and crop productivity–present and future aspects. In Potassium Solubilizing Microorganisms for Sustainable Agriculture; Springer: Berlin/Heidelberg, Germany, 2016; pp. 315–325. [Google Scholar]
  30. Youssef, M.; Eissa, M. Biofertilizers and their role in management of plant parasitic nematodes. A review. J. Biotechnol. Pharma Res. 2014, 5, 1–6. [Google Scholar]
  31. Homer, D.C.; Pratt, P.F. Methods of Analysis for Soils, Plants and Waters; University of California: Davis, CA, USA, 1961; pp. 1–99. [Google Scholar]
  32. Celi, L.; Said-Pullicino, D.; Bol, R.; Lang, F.; Luster, J. Interconnecting soil organic matter with nitrogen and phosphorus cycling. Multi-Scale Biogeochemical Processes in Soil Ecosystems: Critical Reactions and Resilience to Climate Changes; Wiley & Sons: Hoboken, NJ, USA, 2022; pp. 51–77. [Google Scholar]
  33. Wang, J.L.; Liu, K.L.; Zhao, X.Q.; Zhang, H.Q.; Li, D.; Li, J.J.; Shen, R.F. Balanced fertilization over four decades has sustained soil microbial communities and improved soil fertility and rice productivity in red paddy soil. Sci. Total Environ. 2021, 793, 148664. [Google Scholar] [CrossRef]
  34. Peng, G.; Zhang, T.; Lei, X.-Y.; Cui, X.-W.; Lu, Y.-X.; Fan, P.-F.; Long, S.-P.; Huang, J.; Gao, J.-S.; Zhang, Z.-H. Improvement of soil fertility and rice yield after long-term application of cow manure combined with inorganic fertilizers. J. Integr. Agric. 2023, 22, 2221–2232. [Google Scholar]
  35. Iovieno, P.; Morra, L.; Leone, A.; Pagano, L.; Alfani, A. Effect of organic and mineral fertilizers on soil respiration and enzyme activities of two Mediterranean horticultural soils. Biol. Fertil. Soils 2009, 45, 555–561. [Google Scholar] [CrossRef]
  36. Bai, Y.-C.; Chang, Y.-Y.; Hussain, M.; Lu, B.; Zhang, J.-P.; Song, X.-B.; Lei, X.-S.; Pei, D. Soil chemical and microbiological properties are changed by long-term chemical fertilizers that limit ecosystem functioning. Microorganisms 2020, 8, 694. [Google Scholar] [CrossRef] [PubMed]
  37. Su, J.Q.; Ding, L.J.; Xue, K.; Yao, H.Y.; Quensen, J.; Bai, S.J.; Wei, W.X.; Wu, J.S.; Zhou, J.; Tiedje, J.M. Long-term balanced fertilization increases the soil microbial functional diversity in a phosphorus-limited paddy soil. Mol. Ecol. 2015, 24, 136–150. [Google Scholar] [CrossRef] [PubMed]
  38. Eo, J.; Park, K.-C. Long-term effects of imbalanced fertilization on the composition and diversity of soil bacterial community. Agric. Ecosyst. Environ. 2016, 231, 176–182. [Google Scholar] [CrossRef]
  39. Coolon, J.D.; Jones, K.L.; Todd, T.C.; Blair, J.M.; Herman, M.A. Long-term nitrogen amendment alters the diversity and assemblage of soil bacterial communities in tallgrass prairie. PLoS ONE 2013, 8, e67884. [Google Scholar] [CrossRef] [PubMed]
  40. Zhou, J.; Jiang, X.; Wei, D.; Zhao, B.; Ma, M.; Chen, S.; Cao, F.; Shen, D.; Guan, D.; Li, J. Consistent effects of nitrogen fertilization on soil bacterial communities in black soils for two crop seasons in China. Sci. Rep. 2017, 7, 3267. [Google Scholar] [CrossRef]
  41. de Quadros, P.D.; Zhalnina, K.; Davis-Richardson, A.G.; Drew, J.C.; Menezes, F.B.; Camargo, F.A.d.O.; Triplett, E.W. Coal mining practices reduce the microbial biomass, richness and diversity of soil. Appl. Soil Ecol. 2016, 98, 195–203. [Google Scholar] [CrossRef]
  42. Cheng, J.; Chen, Y.; He, T.; Liao, R.; Liu, R.; Yi, M.; Huang, L.; Yang, Z.; Fu, T.; Li, X. Soil nitrogen leaching decreases as biogas slurry DOC/N ratio increases. Appl. Soil Ecol. 2017, 111, 105–113. [Google Scholar] [CrossRef]
  43. Rosenberg, E.; DeLong, E.F.; Lory, S.; Stackebrandt, E.; Thompson, F. The Prokaryotes: Other Major Lineages of Bacteria and the Archaea; Springer: Berlin/Heidelberg, Germany, 2014. [Google Scholar]
  44. Qasim, W.; Zhao, Y.; Wan, L.; Lv, H.; Lin, S.; Gettel, G.M.; Butterbach-Bahl, K. The potential importance of soil denitrification as a major N loss pathway in intensive greenhouse vegetable production systems. Plant Soil 2022, 471, 157–174. [Google Scholar] [CrossRef]
  45. Wang, J.W.J.; Song-Yang, S.Y.; Ma, M.M.T.; Raza, W.; Li Jing, L.J.; Howland, J.; Huang, Q.H.Q.; Shen, Q.S.Q. Impacts of inorganic and organic fertilization treatments on bacterial and fungal communities in a paddy soil. Appl. Soil Ecol. 2017, 112, 42–50. [Google Scholar] [CrossRef]
  46. Ai, C.; Liang, G.; Sun, J.; Wang, X.; Zhou, W. Responses of extracellular enzyme activities and microbial community in both the rhizosphere and bulk soil to long-term fertilization practices in a fluvo-aquic soil. Geoderma 2012, 173, 330–338. [Google Scholar] [CrossRef]
  47. Semenov, M.V.; Krasnov, G.S.; Semenov, V.M.; van Bruggen, A. Mineral and organic fertilizers distinctly affect fungal communities in the crop rhizosphere. J. Fungi 2022, 8, 251. [Google Scholar] [CrossRef] [PubMed]
  48. Detheridge, A.P.; Brand, G.; Fychan, R.; Crotty, F.V.; Sanderson, R.; Griffith, G.W.; Marley, C.L. The legacy effect of cover crops on soil fungal populations in a cereal rotation. Agric. Ecosyst. Environ. 2016, 228, 49–61. [Google Scholar] [CrossRef]
  49. Ozimek, E.; Hanaka, A. Mortierella species as the plant growth-promoting fungi present in the agricultural soils. Agriculture 2020, 11, 7. [Google Scholar] [CrossRef]
  50. Kumla, D.; Dethoup, T.; Buttachon, S.; Singburaudom, N.; Silva, A.M.; Kijjoa, A. Spiculisporic acid E, a new spiculisporic acid derivative and ergosterol derivatives from the marine-sponge associated fungus Talaromyces trachyspermus (KUFA 0021). Nat. Prod. Commun. 2014, 9, 1147–1150. [Google Scholar] [CrossRef]
  51. Yilmaz, N.; Visagie, C.M.; Houbraken, J.; Frisvad, J.C.; Samson, R.A. Polyphasic taxonomy of the genus Talaromyces. Stud. Mycol. 2014, 78, 175–341. [Google Scholar] [CrossRef]
  52. Dethoup, T.; Kaewsalong, N.; Songkumorn, P.; Jantasorn, A. Potential application of a marine-derived fungus, Talaromyces tratensis KUFA 0091 against rice diseases. Biol. Control 2018, 119, 1–6. [Google Scholar] [CrossRef]
  53. Park, S.W.; Nguyen, T.T.; Lee, H.B. Characterization of two species of Acremonium (unrecorded in Korea) from soil samples: A. variecolor and A. persicinum. Mycobiology 2017, 45, 353–361. [Google Scholar] [CrossRef]
  54. Nicoletti, R.; Vinale, F. Bioactive compounds from marine-derived Aspergillus, Penicillium, Talaromyces and Trichoderma species. Mar. Drugs 2018, 16, 408. [Google Scholar] [CrossRef]
  55. Veldre, V.; Abarenkov, K.; Bahram, M.; Martos, F.; Selosse, M.-A.; Tamm, H.; Kõljalg, U.; Tedersoo, L. Evolution of nutritional modes of Ceratobasidiaceae (Cantharellales, Basidiomycota) as revealed from publicly available ITS sequences. Fungal Ecol. 2013, 6, 256–268. [Google Scholar] [CrossRef]
  56. Jenkins, B.D.; Spinette, R.; Jones, A.; Puggioni, G.; Ehrlich, A.; Brown, S.M. Nitrogen fixation by anaerobes is stimulated by low oxygen and insensitive to combined nitrogen in coastal sediments. In Proceedings of the American Geophysical Union, Ocean Sciences Meeting, New Orleans, LA, USA, 21–26 February 2016; p. B34B-0366. [Google Scholar]
  57. Zhu, L.; Zeng, C.; Gao, F.; Shi, A.; Mao, H.; Wei, W. Characteristic analysis of microbial diversity in crud fertilizer from compost of rice straw. Trans. Chin. Soc. Agric. Mach. 2018, 49, 228–234. [Google Scholar]
  58. Turner, M. The evolutionary tree of fungi grows a new branch. Nat. News 2011, 11. [Google Scholar] [CrossRef]
Figure 1. Soil physical and chemical properties in different years. Abbreviations: SOM, Soil organic matter (A); TN, Total nitrogen (B); AhN, alkaline hydrolyzed nitrogen (C); TP, total phosphorus (D); AP, available phosphorus (E); SaK, slow-acting potassium (F); AK, available potassium (G); soil pH, (H). Here, SaK refers to soil K being bound to soil particles or organic matter and released gradually over time. The available P and K refer to the forms of P and K that were readily available to plants for uptake. Moreover, total P and K were the sum of both organic and inorganic forms of P and K, respectively.
Agronomy 14 02311 g001
Figure 2. Rice yield in 2016 2017, and 2018. (A) and (B) indicate yields of early- and late-season rice, respectively. The different letters on bars indicate the significance at p < 0.05 level.
Agronomy 14 02311 g002
Figure 3. Distribution of bacteria community in different groups. (A) shows the PCoA results on the OTU level. (B,C) note the bacteria community at the phylum and genus levels, respectively. (D) notes the Kruskal–Wallis test results among all the groups. * indicates the significance at p < 0.01 level.
Agronomy 14 02311 g003
Figure 4. Distribution of fungal community in different groups. (A) shows the PCoA results on the OTU level. (B,C) note the fungi community at the phylum and genus levels. (D) shows the Kruskal–Wallis test results among all the groups. * and ** indicates the significance at p < 0.01 and p < 0.05 levels.
Agronomy 14 02311 g004
Figure 5. Distribution of nitrogen-fixing bacteria in different groups. (A) shows the PCoA results on the OTU level. (B,C) note the bacteria community at the phylum and genus levels. (D) shows the Kruskal–Wallis test results among all the groups. * indicates the significance at p < 0.01 level.
Agronomy 14 02311 g005
Figure 6. Distribution of denitrifying bacteria in different groups. (A) shows the PCoA results on the OTU level. (B,C) note the bacteria community. (D) shows the Kruskal–Wallis test results among all the groups. * indicates the significance at p < 0.01 level.
Agronomy 14 02311 g006
Figure 7. Distance-based redundancy analysis (db-RDA) results. (AD) note the db-RDA results of bacteria, nitrogen-fixing bacteria, denitrifying bacteria, and fungi, respectively.
Agronomy 14 02311 g007
Figure 8. Correlation between soil microorganisms and yield. (AD) note the db-RDA results of bacteria, nitrogen-fixing bacteria, denitrifying bacteria, and fungi, respectively. * notes p < 0.05, and ** notes p < 0.01.
Agronomy 14 02311 g008
Figure 9. Two-way correlation network analysis. (AD) note the two-way correlation network analysis results of bacteria, nitrogen-fixing bacteria, denitrifying bacteria, and fungi, respectively. The red and green lines represent positive and negative correlations, respectively.
Agronomy 14 02311 g009
Table 1. Basic properties of red soil before the experiment.
OM
g kg−1
TN
g kg−1
TP
g kg−1
Sap
mg kg−1
AhN
mg kg−1
AP
mg kg−1
AK
mg kg−1
Cec
Cmol kg−1
pH
25.61.360.4924081.620.835.07.546.50
Abbreviations: OM, organic matter; TN, total nitrogen; TP, total phosphorus; AhN, alkaline hydrolyzed nitrogen; AP, available phosphorus; AK, available potassium; Cec, Cation exchange capacity.
Table 2. The specific fertilization strategies in different groups (kg ha−1).
GroupsPlantBasic FertilizerTillering StagePanicle Differentiation Stage
P2O5NNK2ONK2O
CKEarly000000
Late000000
PKEarly60.00075.0075.0
Late60.00075.0075.0
NPEarly60.074.937.4037.40
Late60.089.844.9044.90
NKEarly074.937.475.037.475
Late089.844.975.044.975
NPKEarly60.074.937.475.037.475
Late60.089.844.975.044.975
Table 3. Alpha diversity estimators.
ShannonSimpsonAceChao
BacteriaCK6.97 a0.0027 b3967.33987.6 a
PK6.93 a0.0029 b3907.13924.4 b
NP6.96 a0.0026 b3842.73829.1 c
NK6.89 a0.0025 b3707.23720.0 d
NPK6.79 a0.0033 a3689.33697.9 e
FungiCK2.95 c0.1271 a602.7 c609.8 c
PK3.36 b0.0939 b745.8 a736.5 a
NP3.88 a0.0492 c607.4 cade609.8 c
NK3.47 a0.0673 b678.3 b657.9 b
NPK3.33 b0.0884 b563.7 dc554.1 d
Nitrogen-fixing bacteriaCK5.69 a0.0070 b963.7 a955.7 a
PK5.68 a0.0071 b918.0 b920.6 c
NP5.76 a0.0058 b905.2 c899.8 d
NK5.64 a 0.0093 a922.5 b939.9 b
NPK5.67 a0.0067 b868.9 d851.8 e
Denitrifying bacteriaCK4.40 a0.0264 a555.9 a524.7 a
PK4.31 ac0.0272 ac483.6 bc481.6 b
NP4.41 b0.0315 b505.1 b494.2 b
NK4.08 ab0.0346 b422.0 c414.8 d
NPK4.01 b0.0452 b438.8 bc441.7 c
The different letters indicate significant differences at p < 0.05 level.
Disclaimer/Publisher’s Note: The statements, opinions and data contained in all publications are solely those of the individual author(s) and contributor(s) and not of MDPI and/or the editor(s). MDPI and/or the editor(s) disclaim responsibility for any injury to people or property resulting from any ideas, methods, instructions or products referred to in the content.

