Article

Characterization and Evaluation of an Electrostatic Knapsack Sprayer Prototype for Agricultural Crops

by
Alba Vigo-Morancho
1,*,
María Videgain
1,2,
Antonio Boné
1,
Mariano Vidal
1 and
Francisco Javier García-Ramos
1,2
1
Escuela Politécnica Superior (EPS), Universidad de Zaragoza, Carretera Cuarte s/n, 22071 Huesca, Spain
2
Instituto Agroalimentario de Aragón—IA2 (CITA), EPS, Universidad de Zaragoza, Carretera de Cuarte s/n, 22071 Huesca, Spain
*
Author to whom correspondence should be addressed.
Agronomy 2024, 14(10), 2343; https://doi.org/10.3390/agronomy14102343
Submission received: 20 September 2024 / Revised: 7 October 2024 / Accepted: 10 October 2024 / Published: 11 October 2024
(This article belongs to the Section Precision and Digital Agriculture)

Abstract

:
Pesticide application development has grown exponentially in recent decades thanks to the implementation of new technologies and improved quality of spray input application. Electrostatic technology for increasing deposition has proven to be a suitable tool under specific study conditions, such as when working with very small droplet sizes, with air assistance, or typically in greenhouse environments. However, its effectiveness in hydraulic spraying, as well as its application from a commercial point of view in agriculture, is still challenging. The aim of this study was to evaluate the performance of this technology by implementing a modified lance on a small commercial knapsack sprayer, equipped with a hydraulic nozzle providing a range of droplet size values (Dv50) from 136 μm to 386 μm in the pressure range between 2 and 6 bar. This setup allowed operation under normal conditions (disconnected electrostatic system: NES) or with the connected electrostatic system (ES), with both configurations being tested in this study. Liquid distribution profiling as well as qualitative and quantitative evaluation of deposition were carried out both under laboratory conditions and in tomato crops under greenhouse conditions. The results showed no differences between the ES and NES in terms of flow rate (L min−1) characterization or in the total accumulated volume collected with the vertical bench. The impact of the electrostatic system connection was clearly observed in laboratory trials, with total deposition increases of up to 66%. In field trials, this effect decreased in unexposed areas and in denser sections of the crop. However, the overall increase in deposition, mainly associated with the exposed side, continued to be significant.

1. Introduction

Modern agriculture heavily relies on the application of pesticides and other agricultural chemicals to enhance crop health and productivity. However, conventional spraying methods often suffer from issues such as poor spray deposition, drift, and environmental pollution [1,2,3,4]. Electrostatic spraying technology offers a promising solution to these challenges by employing the principle of electrostatic charge to improve spray deposition and reduce wastage. This technique involves the application of a certain voltage to charge the droplets, resulting in increased affinity towards grounded targets and enabling effective deposition. This technology operates on the basis of Coulomb’s law, which states that opposite charges attract each other [5]. The droplets acquire a positive or negative charge by passing through an electric field commonly created by an electrode. It has been observed that these charged particles tend to exhibit a wraparound effect, whereby they deposit on surfaces not directly facing the spray source. Consequently, it enables the charged droplets to reach hidden areas and the underside of the target [6].
The approach to investigating electrostatic technology in agricultural spraying has evolved over the years. Initially, the focus was on assessing the effectiveness of applying an electrical charge to the spray flow, usually at high voltages on handheld spinning disc sprayers [7,8,9]. More recent studies have shifted towards a comprehensive analysis of all factors influencing the performance of electrostatic technology. This includes enhancements in crop penetration due to air assistance, as well as investigations into nozzle design and methodologies for quantifying droplet charging efficiency. In this sense, one of the concepts referenced in the study of spray performance or efficiency when discussing this technology is the charge-to-mass ratio (CMR), associated with the charge generated on the droplets at the nozzle outlet and being calculated by measuring electric charge flow and liquid mass flow per second [10]. Higher values indicate a greater charge on the droplets, which can enhance their attraction to grounded targets and improve the wraparound effect, enabling effective coverage even in inaccessible areas. This parameter, expressed in mC kg−1, has been shown to vary according to several factors, including droplet size [11]; application distance [12,13]; intrinsic characteristics of the electrode, such as its geometry [14,15] or material [16]; applied voltage [17,18]; and even the viscosity or composition of the sprayed product [19].
Specific CMR values at which efficient spraying using electrostatic technology can be conducted have been observed by some authors. According to Maski and Durairaj [19], it was concluded that increasing the charge-to-mass ratio from 0 mC kg−1 to 5.5 mC kg−1 resulted in an increase in spray deposition on the abaxial leaf surfaces. Similarly, studies carried out by Lyons et al. [20] and Pascuzzi and Cerruto [11] on pneumatic spraying found that CMR values of 10 mC kg−1 resulted in significantly higher coverage for small droplets. Zhao et al. [13], who were among the few researchers to apply numerical simulation techniques to model the trajectories of charged droplets, achieved CMR values of 30 mC kg−1 while working with very small droplets (5 μm to 30 μm). However, increased drift losses were also observed in this case.
The evaluation of electrostatic technology implemented on different types of sprayers has shown promising results in specific working conditions in terms of deposition efficiency. The study conducted by Mishra et al. [21] concluded that the use of electrostatic spray technology resulted in significantly higher droplet density and total spray deposition on both the upper and underside of leaves compared to conventional spray application in a pear orchard. In a separate study by Salcedo et al. [22], which focused on vineyards, it was found that electrostatic sprayers could reduce the volume of spray applied by 68% while achieving better deposition and higher spray retention on the leaf surface. Pascuzzi and Cerruto [11] obtained an increase in the mean foliar spray deposition by 44% when connecting the electrostatic system also in vineyard spraying. Those studies are some examples of the effectiveness of this technology; however, it is crucial to highlight the role of air presence in droplet formation in those cases, confirming the inverse relation between droplet size and charge acquired described by several authors [11,12,13].
As far as the authors know, few studies have been conducted on the evaluation of this technology in equipment with hydraulic nozzles without involving air assistance, very small droplet sizes, or the application of high voltages. Furthermore, regarding Pesticide Application Equipment (PAE), it should not be dismissed that the utilization of small knapsack sprayers and handheld applications remains high overall in many countries in greenhouse applications [23,24]. Consequently, this branch of research should be approached in the same manner as in the case of large-scale intensive farming.
In this context, the present work aims to conduct a preliminary analysis of an electrostatic knapsack sprayer equipped with a hydraulic nozzle, with the objective of evaluating the impact of incorporating this technology in terms of coverage and deposition, both in laboratory conditions and field conditions, a previous characterization of the equipment for optimal selection of application parameters having previously been carried out.

2. Materials and Methods

2.1. Knapsack Sprayer

The knapsack sprayer was a commercial electric unit from the manufacturer Royal Condor (Producciones Generales SA, Soacha, Colombia), equipped with a 12 V diaphragm pump, a 15 L tank and a pressure regulator that allowed adjustment of the flow rate between 2 bar and 6 bar of pressure (Figure 1). The modified lance, incorporating electrostatic technology, was developed and is owned by EURO DENKER S.L under its commercial brand Tecnostatic (Tecnostatic, Zaragoza, Spain) and was implemented in the commercial device. It integrated a charge induction system in the nozzle that operated at a voltage of 1 kV, featuring two concentric copper electrodes which was controlled by a switch located next to the pressure regulator.

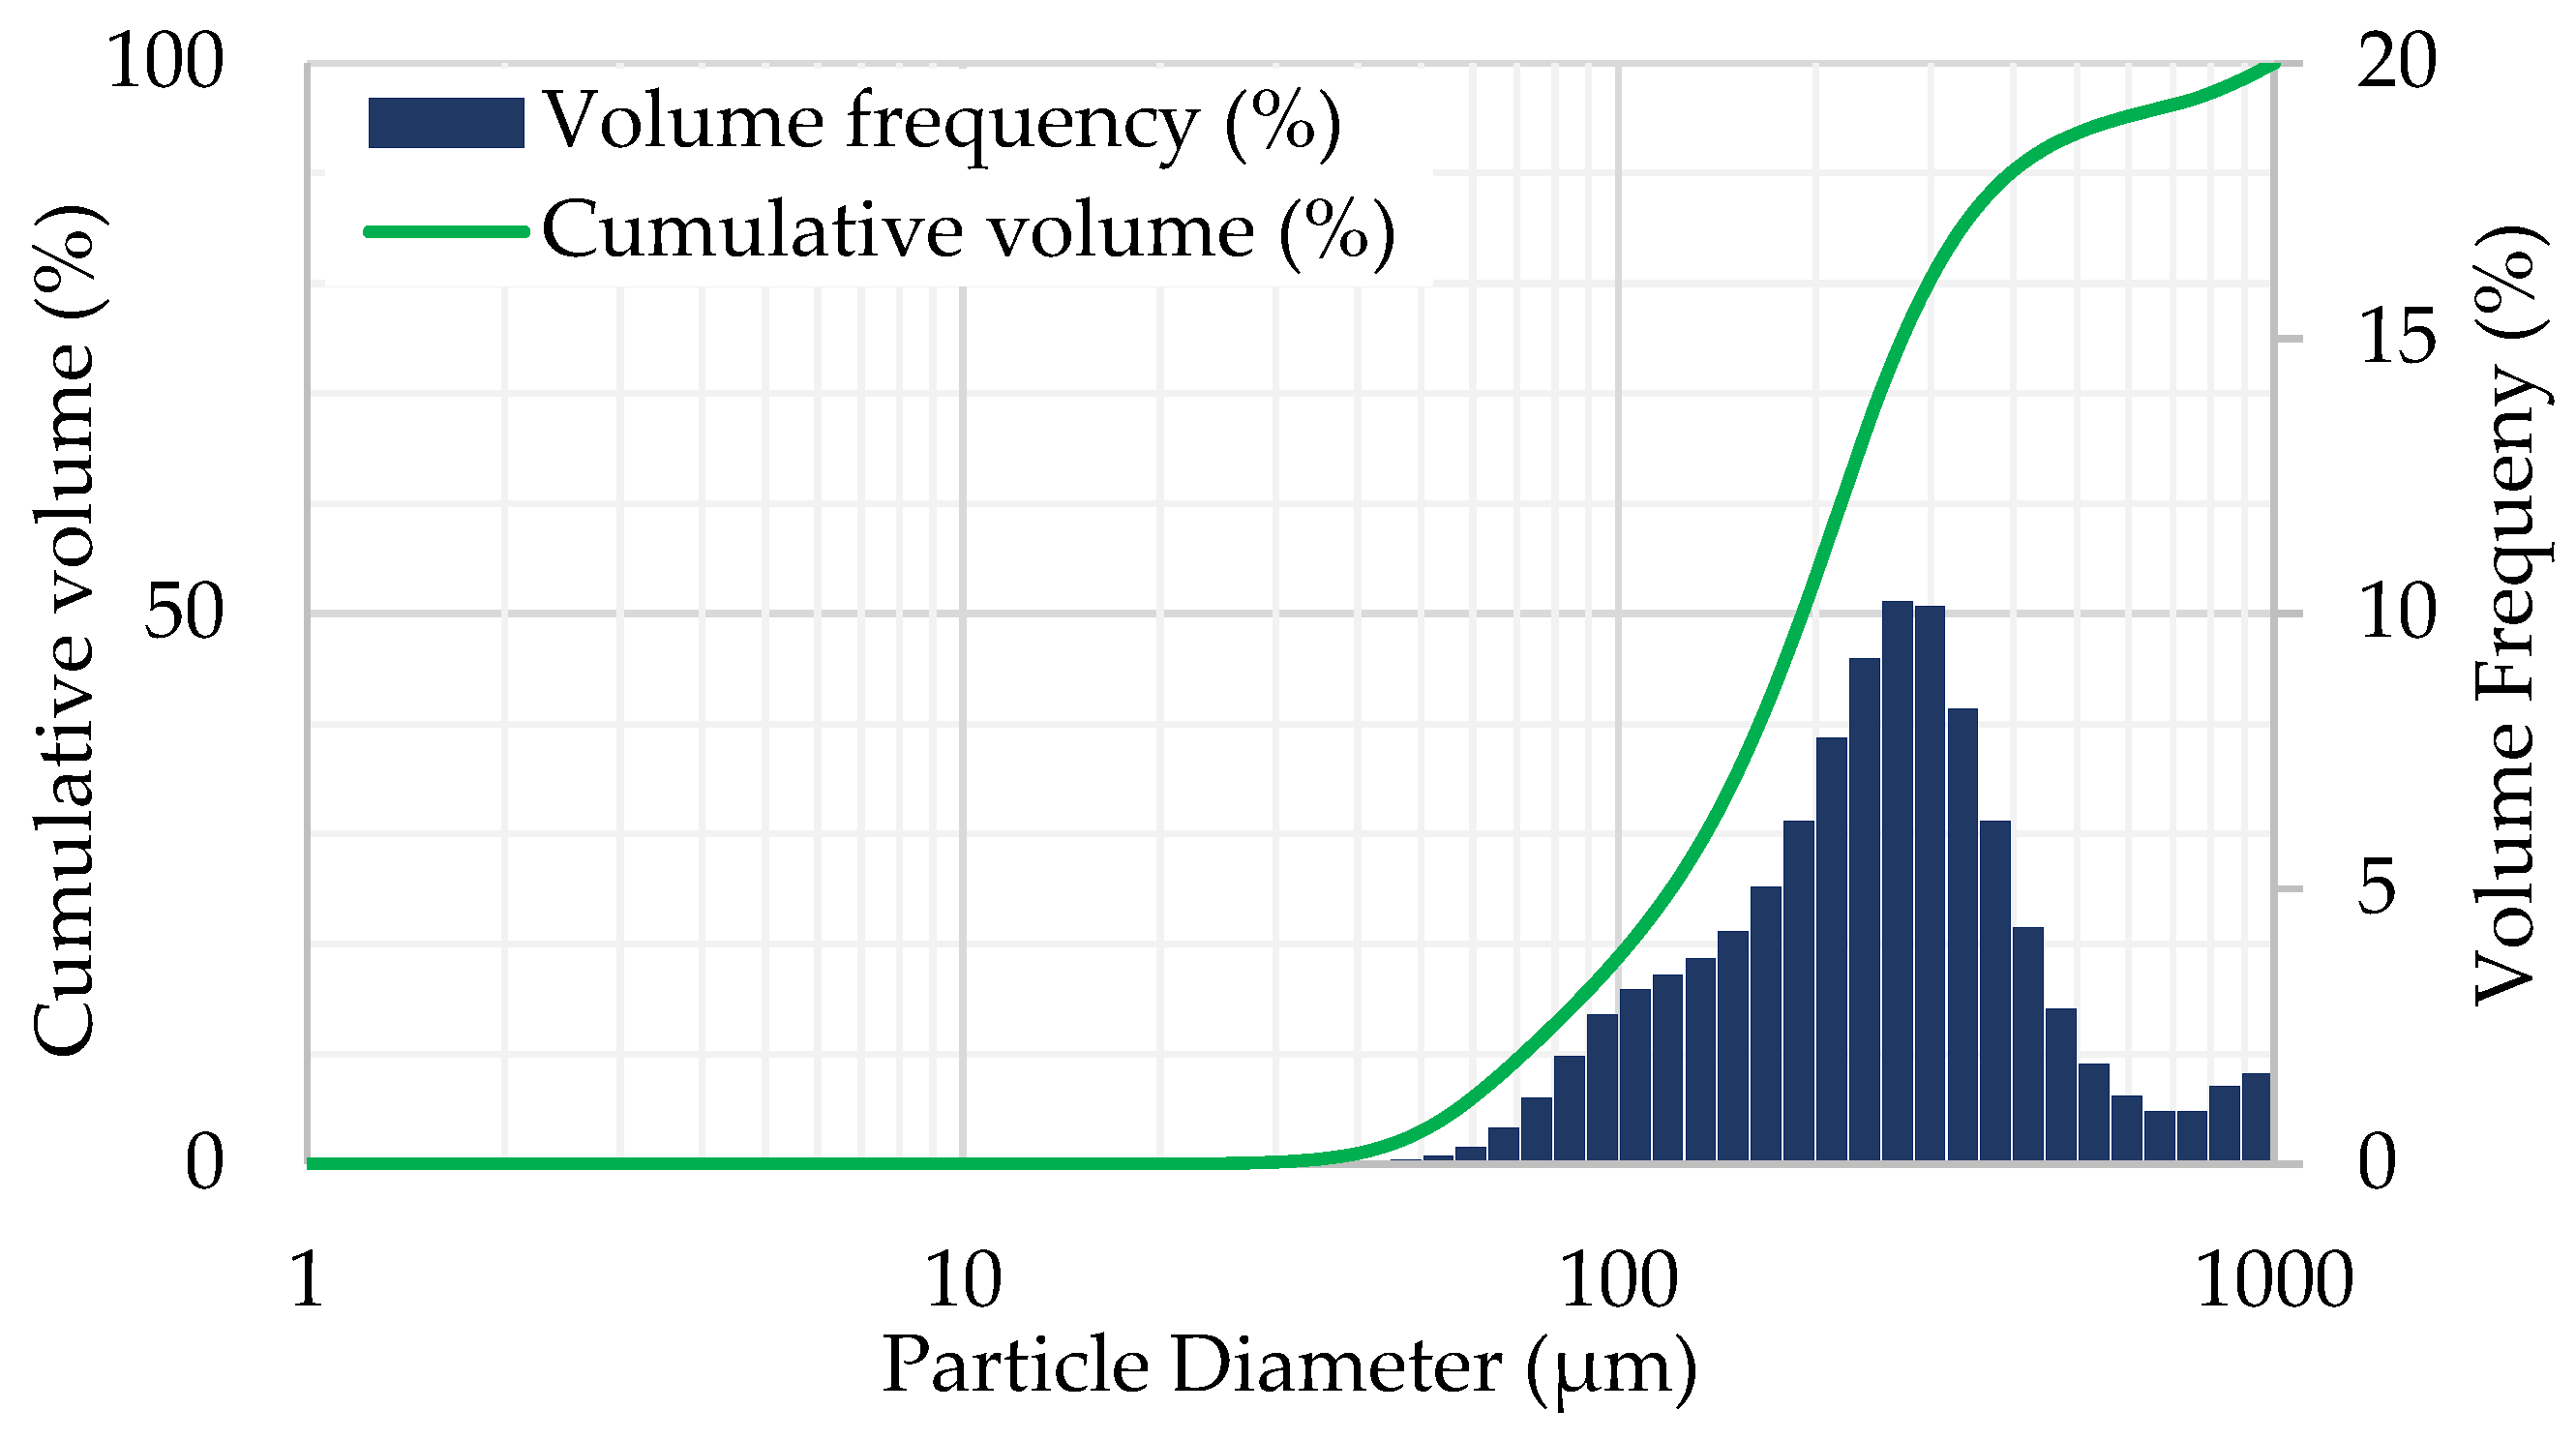
2.2. Spray Droplet Size, Flow Rate, and Charge Quantification

The droplet size distribution was obtained for each combination of pressure (2 bar, 4 bar, and 6 bar) and electrostatic system configuration ES-NES (ES = electrostatic system ON; NES = disconnected electrostatic system), using the Insitec® T laser diffraction system (Malvern Panalytical, Malvern, UK). As illustrated in Figure 2, the spray passes through a laser beam, allowing for real-time droplet characterization, resulting in a distribution similar to that shown in Figure 3, where blue histogram bars (right Y-axis) show the percentage of the atomized liquid volume contained in droplets of a given size class (volume-based droplet diameter frequency), and the green curve (left Y-axis) indicates the percentage of atomized liquid in droplets with a diameter smaller than a certain value (cumulative volume function).
From the cumulative volume function, the percentiles Dv10, Dv50, and Dv90, commonly used for droplet size characterization, were obtained for each sprayer configuration. The Dv50, also described as the VMD (Volume Mean Diameter) by some authors [9,25,26], represents the median drop size, indicating that 50% of the atomized liquid is contained in drops smaller than Dv50. On the other hand, Dv10 and Dv90 provide a measure of the width of the distribution of the droplet volume [27]. The relative width or span value, given by Equation (1), was also calculated.
S p a n = D v 90 D v 10 D v 50
The nozzle flow rate was determined for all pressure settings (2 bar, 3 bar, 4 bar, 5 bar, and 6 bar) following the methodology described in ISO 5682-2:1997 [28].
The charge-to-mass ratio (CMR) has been traditionally measured using a Faraday cage system [6,27,29]. In this case, high flow rates and droplet size lead to small current values that do not allow the charge to be measured at a great distance from the outlet. For this reason, CMR was quantified employing a metal conical device that encompassed the entire nozzle outlet flow, using a similar methodology to that described by Marchant and Green [30]. Considering the flow rate data in L min−1 and amperage in C s−1, as a result of measuring the current values (μA) with a digital multimeter, accurate CMR values (mC kg−1) were calculated for all configurations.

2.3. Spray Distribution Profile

The product distribution patterns, both horizontal and vertical planes, were obtained by carrying out tests under indoor conditions at the facilities of the Technological College of Huesca (42°07′03″ N 0°26′47″ W), in the absence of wind, with 30% relative humidity and 23 °C temperature.
For vertical distribution, the knapsack sprayer lance was placed in static conditions, with the nozzle facing a 3.7 m vertical patternator (AAMS, Maldegem, Belgium) equipped with 20 cm × 20 cm flat PVC plates (Figure 4A). The structure moved at a constant speed of 0.20 m s−1 and collected the product for each combination of factors shown in Table 1. Three repetitions for each combination of factors were carried out.
Horizontal distribution was evaluated similar to Patel et al. [12] or Gupta and Duc [8] procedures, positioning the nozzle at a height of 50 cm above a self-made horizontal patternator (Figure 4B), which collected the liquid through gutters every 5 cm to be finally quantified in measuring glasses. Three repetitions were carried out, and the fluid was collected for 5 min for each combination of the following factors: 2 electrostatic spraying configurations (ES-NES) and 5 fluid pressures (2 bar, 3 bar, 4 bar, 5 bar, and 6 bar). Spray pattern uniformity was assessed based on the coefficient of variation (CV) of the amount of liquid collected per segment throughout repetitions.

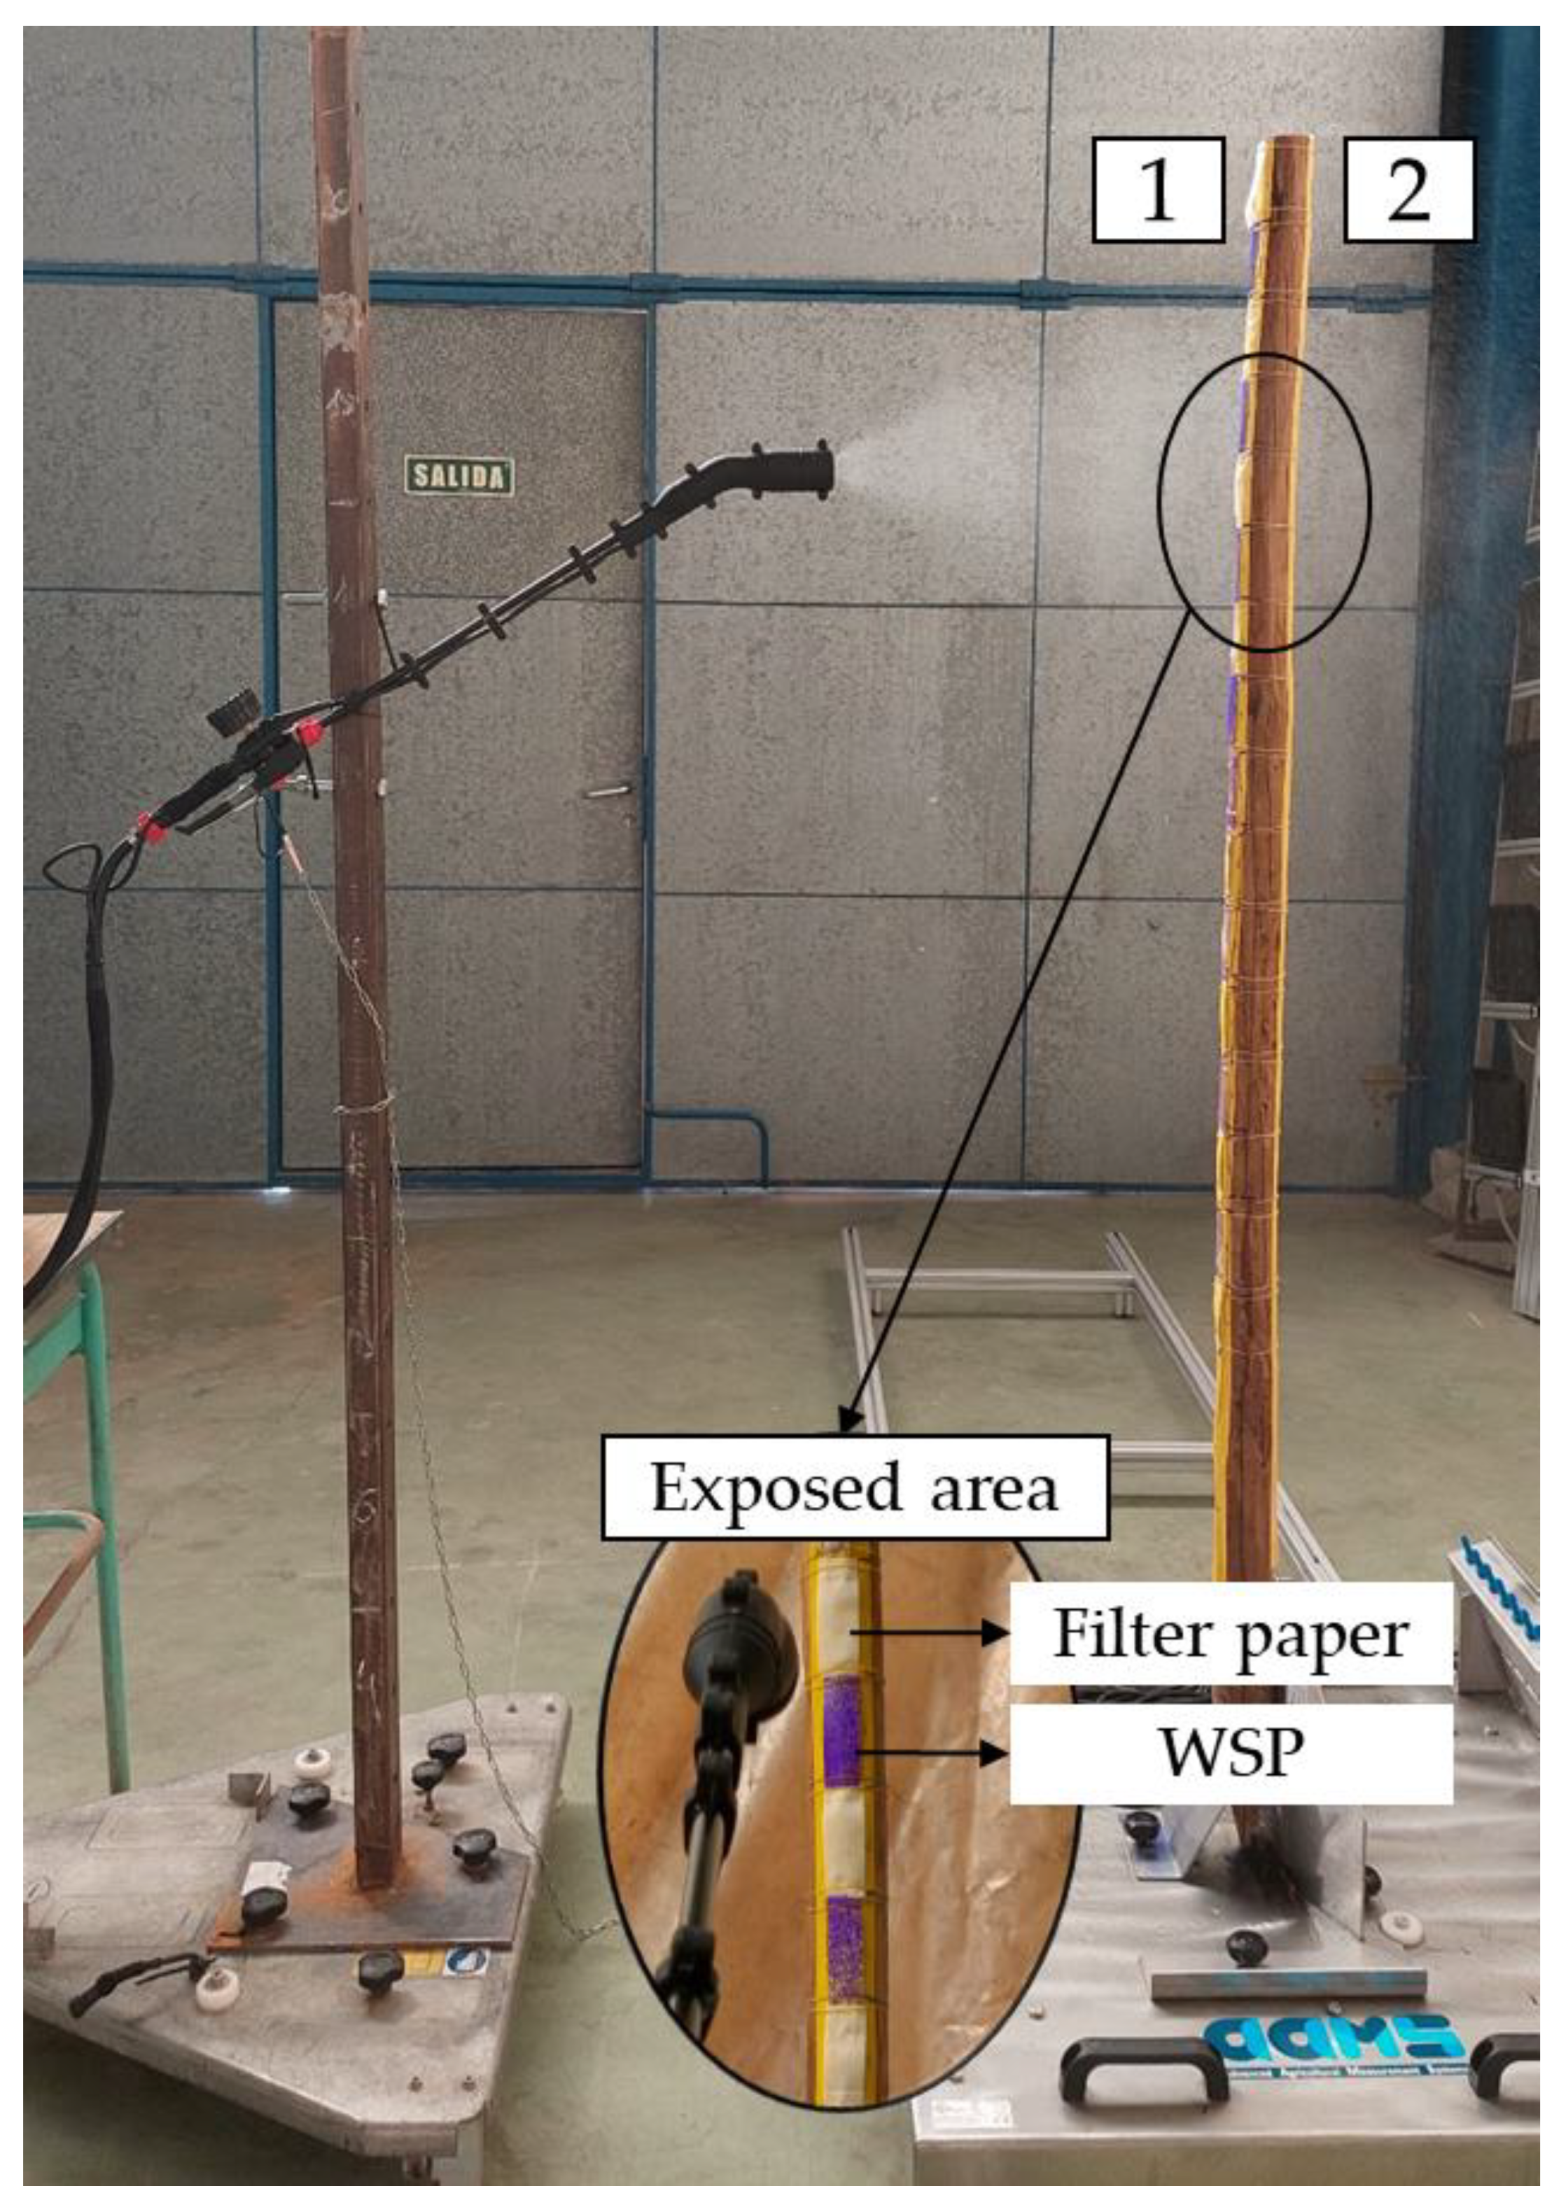
2.4. Coverage and Deposition Evaluation in Laboratory Conditions

To evaluate the effectiveness of the electrostatic system, coverage and deposition analyses in laboratory conditions were carried out by locating a vertical grounded wooden post on the mobile platform from the test bench, whose collectors were disassembled. Water-sensitive papers (WSP, 26 mm × 76 mm) and filter papers (30 mm × 80 mm) were located on both the front and rear sides of the post (exposed or unexposed, respectively) as shown in Figure 5, and the product was sprayed simulating a real application by moving the platform (at 0.2 m s−1). The following combinations of equipment operating conditions were evaluated: 2 configurations of the electrostatic system (ES and NES), 3 fluid pressures (2 bar, 4 bar, and 6 bar) and 3 nozzle-to-post distances (20 cm, 35 cm, and 50 cm). Similar to previous assays, 3 repetitions for each configuration were conducted. Given that 18 WSPs and 18 filters were used for each repetition (9 on the exposed side and 9 on the unexposed side), a total of 972 units of each type were analyzed. Heights corresponding to each type of paper are presented in Table 2.
It is important to note that using metal structures as artificial targets without regulated resistance values may affect deposition results, potentially leading to over-attraction of droplets that, under real conditions, might not reach the target. In this regard, the use of a grounded wooden post in the present study should be highlighted with the aim of maximizing the similarities to a real application, accounting for the absence of environmental variables.
WSPs were analyzed using Image J software (v.1.52a, National Institutes of Health, Bethesda, MD, USA), which allowed the percentage of coverage of each sample to be determined. Filter papers were analyzed following the methodology described by Garcia-Ramos et al. [31], who used manganese chelate as a tracer. This product is commercialized in liquid form at a concentration of 6.77% Mn by weight, corresponding to 90 g of Mn per liter of product. Trials were performed using 1.5 mL of product per liter of water, resulting in a Mn concentration of 135 mg L−1. During the trials, filter papers were placed in Falcon tubes for later extraction. Once in the laboratory, samples were washed in a 0.05 N nitric acid solution, and the manganese concentration (mg L−1) was quantified using an atomic absorption spectrometer (model SpectrAA 110, Varian Inc., Palo Alto, Santa Clara, CA, USA). Considering the surface of the filters, the amount of Mn in each one (μg cm−2) was calculated. In order to compare results between configurations associated with different volume rates (L ha−1), normalized deposition (dn, μg cm−2filter/μg cm−2ground) was calculated as described by some authors [3,32,33].

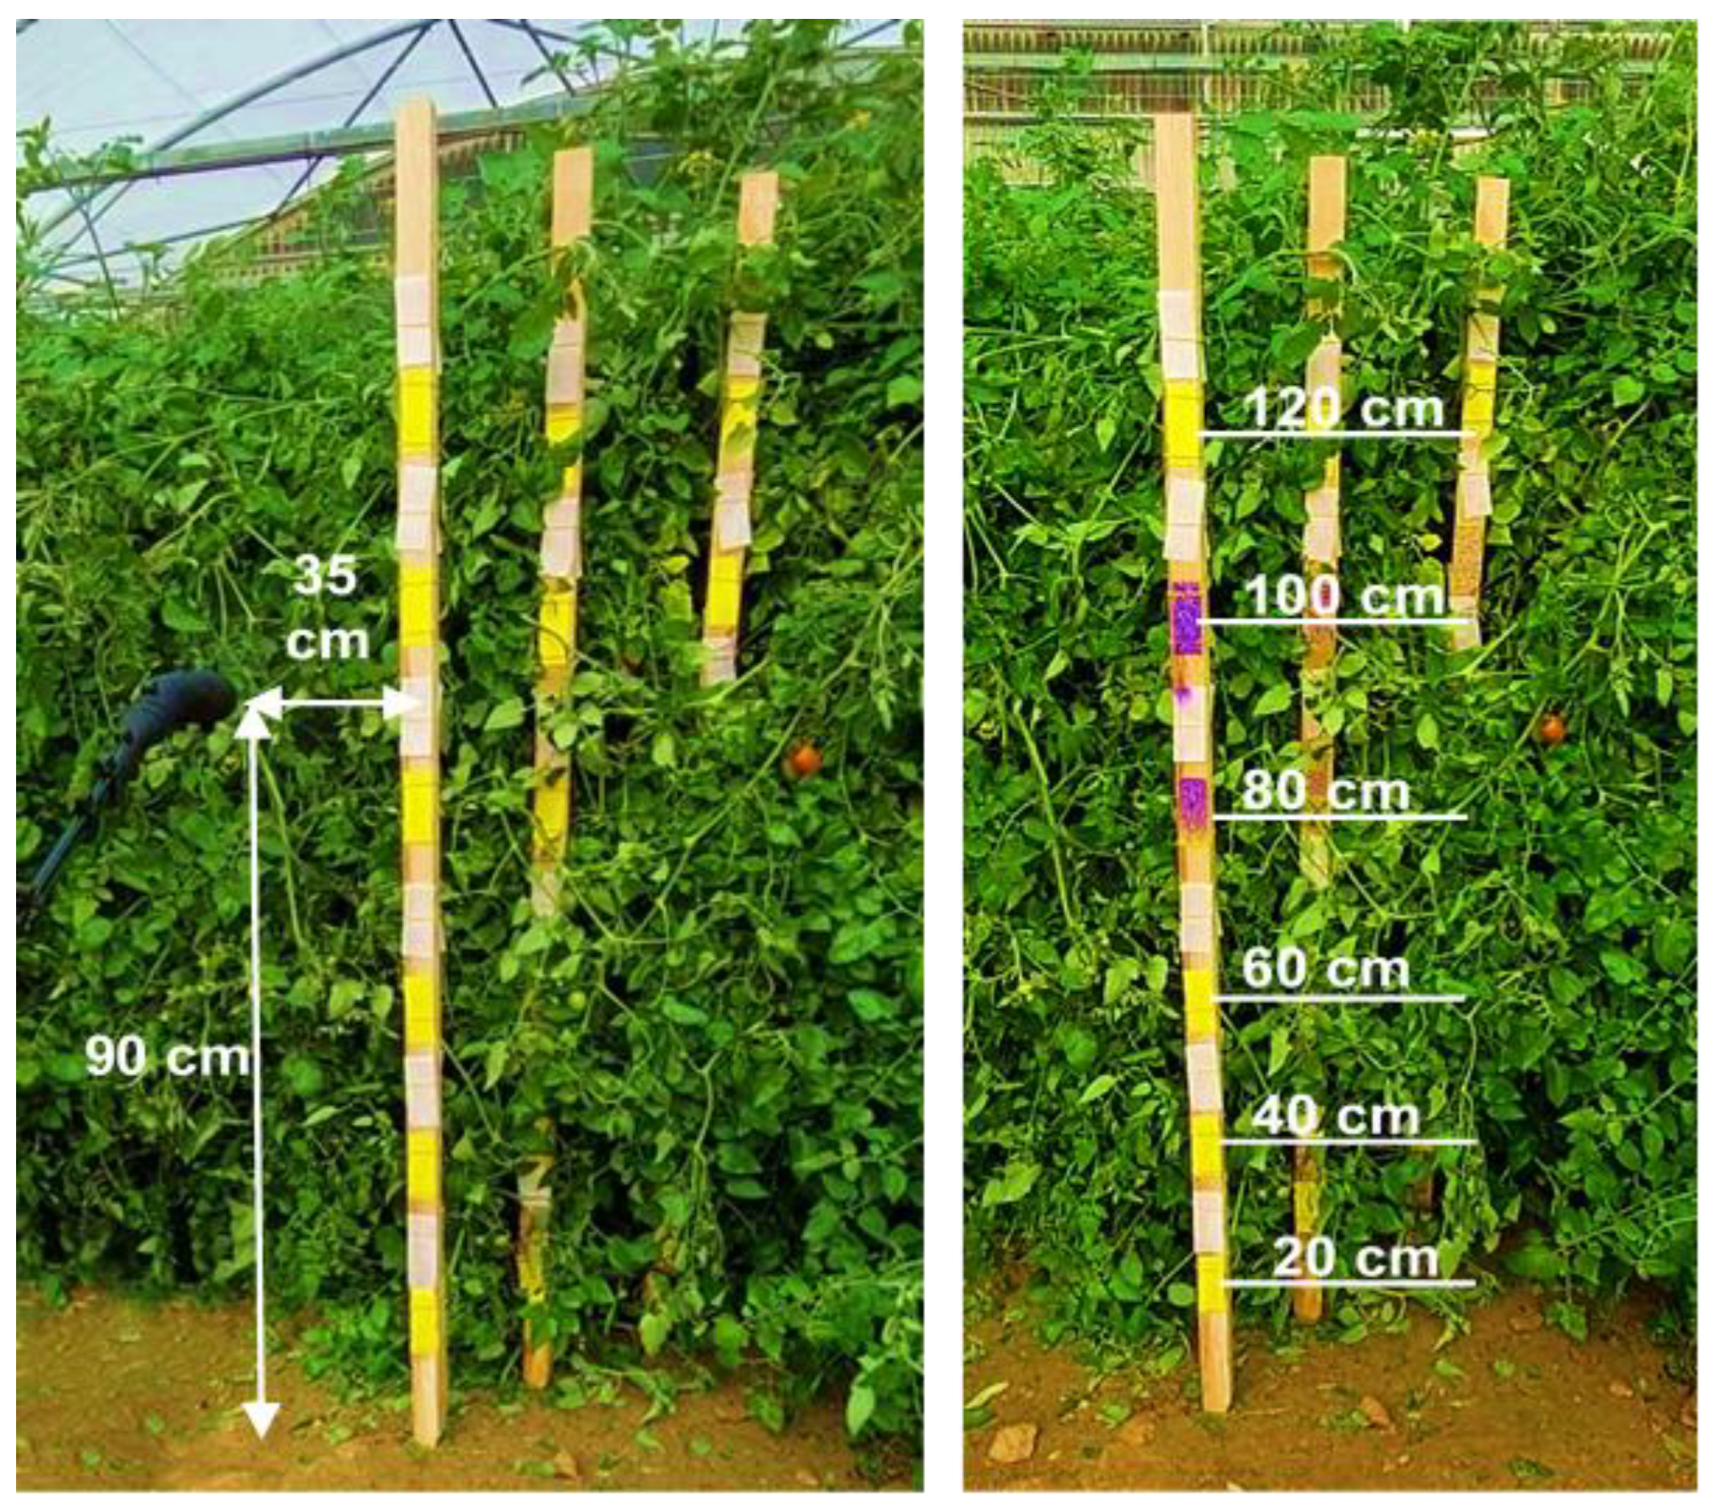
2.5. Coverage and Deposition Evaluation in Crop Conditions

Tests were carried out on tomato crop (Solanum lycopersicum L.) in the greenhouse located at the same facilities described in Section 2.3. In this case, the knapsack sprayer was mounted on the mobile platform used in Section 2.3 and Section 2.4, which was located parallel to the canopy. This setting (Figure 6) allowed the repetitiveness between configurations to be maximized since the lance location between repetitions and configurations did not vary. For this reason, the external row was selected for the trials.
Three sections (S1, S2 and S3) with increasing vegetation densities were established in order to evaluate the penetration capability of the product depending on the ES and NES configurations. In each section, three vertical posts associated with each studied depth level (D1: external; D2: intermediate; and D3: internal) were located, with a relative distance of 20 cm between them, as shown in Figure 6. Each post contained 12 WSPs and 12 filter papers vertically distributed on both sides (6 heights on each side of the post, ranging from 20 cm to 120 cm), similar to laboratory assays. The lance was positioned 90 cm above the ground and at a distance of 35 cm from D1. In this case, a 6 bar configuration was selected. Considering 2 electrostatic system configurations, 3 sections, 3 depths per section, 2 sides per depth, and 6 papers per side, a total of 216 WSPs and 216 filter papers were analyzed from crop trials following the same methodology described in Section 2.4. Normalization of deposition results was not considered in this case since one single flow rate was established.
Temperature and relative humidity were measured inside the greenhouse during the test, resulting in an average of 22.2 °C and 64.6%, respectively.
The Leaf Area Index (LAI) was determined by collecting the leaves from a specific volume of vegetation in each section and correlating the total area of the leaves, quantified with Image J software, with the planting layout of the crop. Sections 1, 2, and 3 resulted in LAI values of 2.13, 2.70, and 3.38, respectively.

2.6. Statistical Analysis of Results

Final data were statistically analyzed using IBM SPSS Statistics v.26 software package (IBM Corp., Armonk, NY, USA), to establish differences associated with application parameters on dependent variables. The Kolmogorov–Smirnov test was performed to assess the normality of data distribution, followed by Levene’s test to evaluate equality of variances. One-way ANOVA with Tukey’s test for mean comparisons was used to analyze the effect of electrostatic configuration on the total accumulated volume in relation to product distribution evaluation.
The dataset did not meet the normality assumption in some cases; therefore, the non-parametric Kruskal–Wallis test was used to determine significant differences in dependent variables, such as the spray uniformity (through the CV), percentage of coverage, and deposition under both laboratory and crop conditions. Independent variables were defined by application parameters: the electrostatic system configuration, distance, pressure, or side of measurement in deposition trials. A 95% confidence level was maintained in all cases.

3. Results and Discussion

3.1. Spray Droplet Size, Flow Rate, and Charge-to-Mass Ratio

The laser measurement ranges between 0.29 μm and 1000 μm resulted in inaccurate droplet size measurements at 2 bar pressure as a considerable percentage of liquid was composed of droplets larger than 1000 μm. However, this truncation disappeared at higher pressures. Percentiles and span results are shown in Figure 7.
As expected for the natural behavior of a hydraulic nozzle, droplet size decreased with the increase in pressure, with no significant effect associated with the connection or disconnection of the electrostatic system on percentiles or span. In this context, the VMD values of droplets in the ES configuration at 2 bar, 4 bar, and 6 bar pressures were 386 μm, 173 μm, and 136 μm, respectively. These results are consistent with previous studies, which have shown that the differences between droplet sizes due to the electrostatic effect are minimal. Brentjes et al. [34], in laboratory tests, found no apparent difference between the VMD of droplets generated with electrostatic charge and without charges working with an air-assisted electrostatic sprayer considering four flow rates. Patel et al. [12], working with an air-assisted electrostatic nozzle, found that the VMD at three locations within the plant canopy and two leaf orientations was lower for the ES (95.0 μm) than the NES (104.5 μm).
When considering droplet behavior, if electrostatic forces exceed those generated by surface tension, the initial droplet may break up into smaller ones. However, with electrostatic nozzles, only a small fraction of droplets reaches this limit [6]. Conversely, the opposite phenomenon can also occur and has been reported by some authors. Kihm et al. [35]; Latheef et al. [36] and more recently Martin et al. [37] evaluated electrostatic technology in aerial applications and found significantly higher VMD values for electrostatically charged applications. This increase in VMD is due to the aggregation of smaller droplets into larger ones.
A linear relationship was observed between pressure and nominal flow rate (L min−1) during flow rate characterization, with identical values for both the ES and NES configurations at a given pressure. Specifically, nominal flow rate of the nozzle ranged from 0.32 L min−1 at the lowest pressure (2 bar) to 0.50 L min−1 at the highest pressure (6 bar).
Also, the relationship between CMR and pressure is particularly important in electrostatic spraying, as higher pressure typically generates smaller droplets, which in turn increases the CMR. However, after a certain point, observed here at 4 bar pressure (Figure 8), the efficiency of charge induction appears to stabilize, and further reductions in droplet size do not significantly increase the CMR. Similar behavior has been documented by several authors who assessed the impact of application parameters, such as applied voltage, application distance, and droplet size on the CMR [4,11,12,13]. Understanding this relationship is crucial, as the deposition of the product is closely tied to CMR, which will be discussed in the Deposition Evaluation section.
It is important to note, however, the difference in CMR magnitude between the present study and those involving pneumatic equipment and small droplet size. While the previous mentioned studies reported CMR values around 10 mC kg−1, related to an effective electrostatic deposition in pneumatic sprayers with VMDs below 70 μm, the maximum CMR values observed in this study, achieved at 4 bar pressure, were approximately 0.38 mC kg−1. A similar study was carried out by Mamidi et al. [14], who evaluated the effect of spray properties, electrode position, and applied voltage on the CMR values using a knapsack sprayer with a nominal flow rate of 0.34 L min−1, equipped with an induction system to charge the droplets. They recorded a maximum CMR value of 0.42 mC kg−1 with an applied voltage of 3.25 kV, which is significantly higher than the 1 kV used in the present study.

3.2. Spray Distribution Profile

Regarding the vertical distribution profile, volume values were maximum at the height associated with the lance location (167 cm above the ground at all working configurations (Figure 9)). The total accumulated volume was higher in the NES configuration compared to the ES configuration across all setups. However, this difference was not significant (p > 0.05) and decreased with the increase in application distances. Focusing on the liquid distribution within the nozzles’ working width (approximately 140 cm to 190 cm), it was observed that, at 50 cm and 60 cm distances, switching off the electrostatic system caused droplets to settle at lower heights of the patternator, losing the Gaussian distribution obtained with the ES configuration, highlighting the role of attraction forces on charged droplets.
The spray pattern in the horizontal plane did not show differences in terms of total accumulated volume due to the electrostatic sprayer system connection (p > 0.05). Regarding the pattern of the curve drawn by the accumulated volume in each segment (Figure 10), it was observed that at lower pressures the peak was found on the central axis of the spray plane, while higher pressures resulted in a flattening of the curve due to the dispersion of the droplets, as described by some authors [7,8]. The Kruskal–Wallis test showed no significant effect of pressure or electrostatic system connection on CV, whose values were rarely greater than 15%.

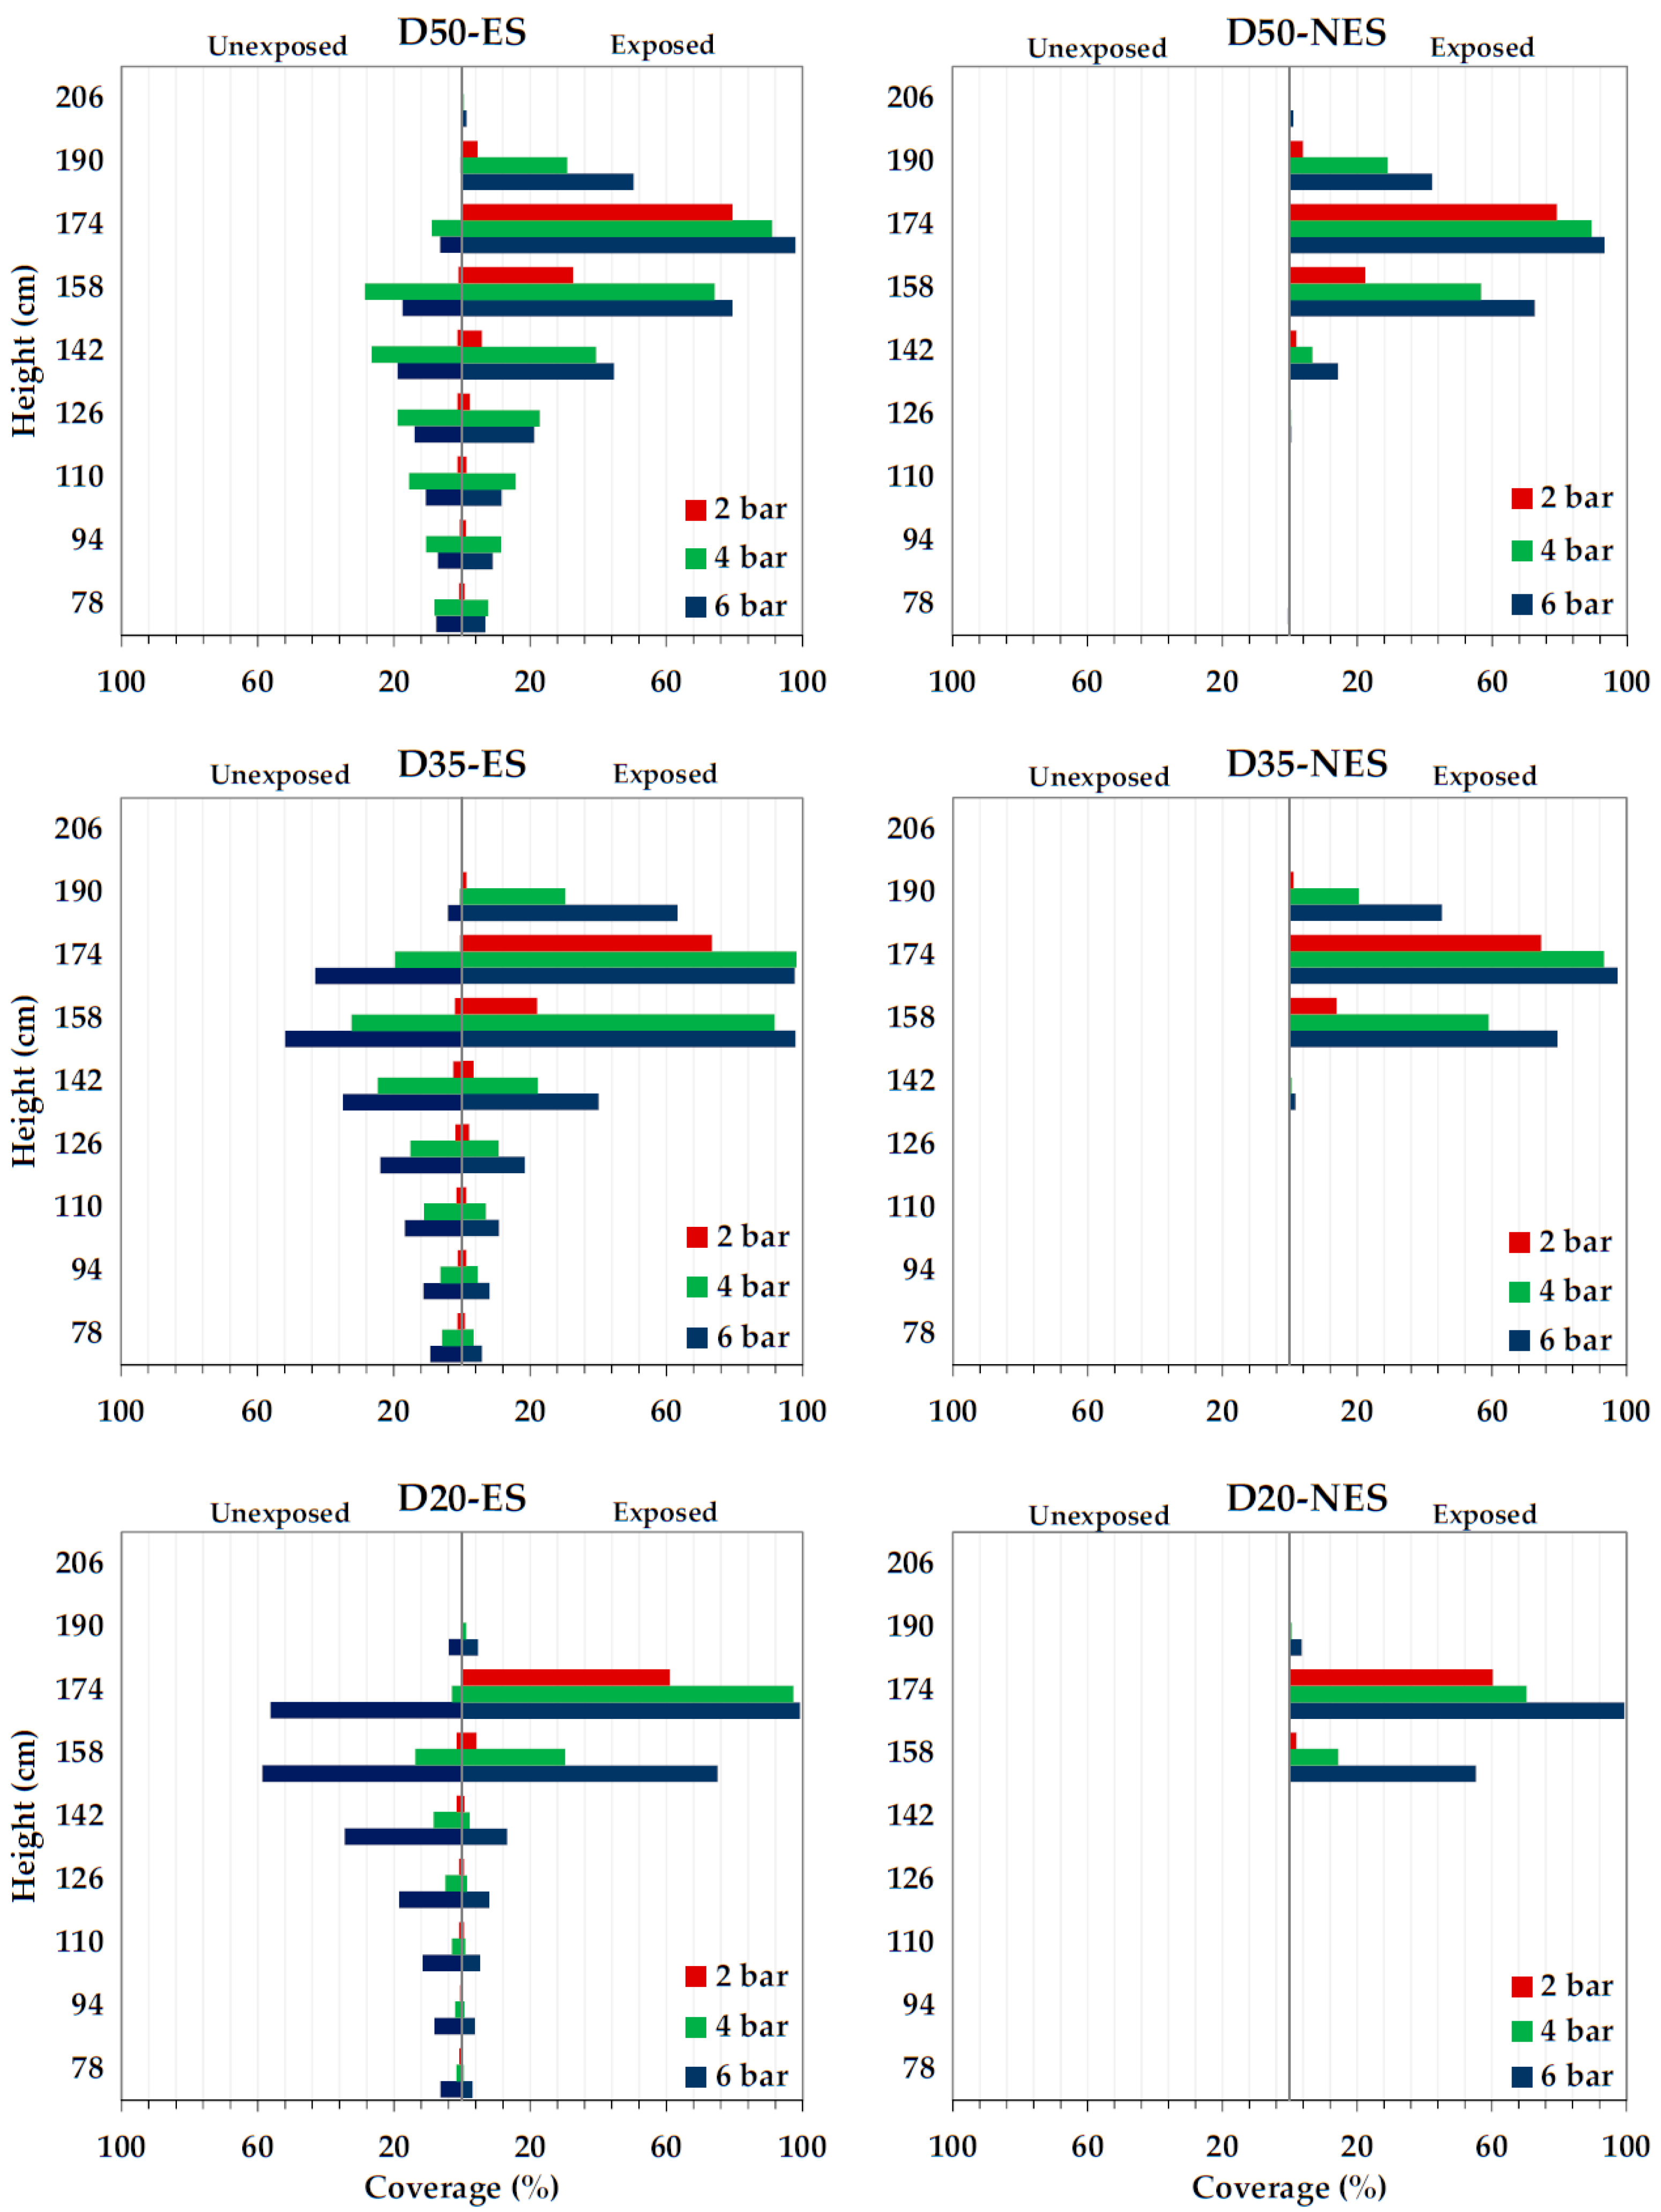
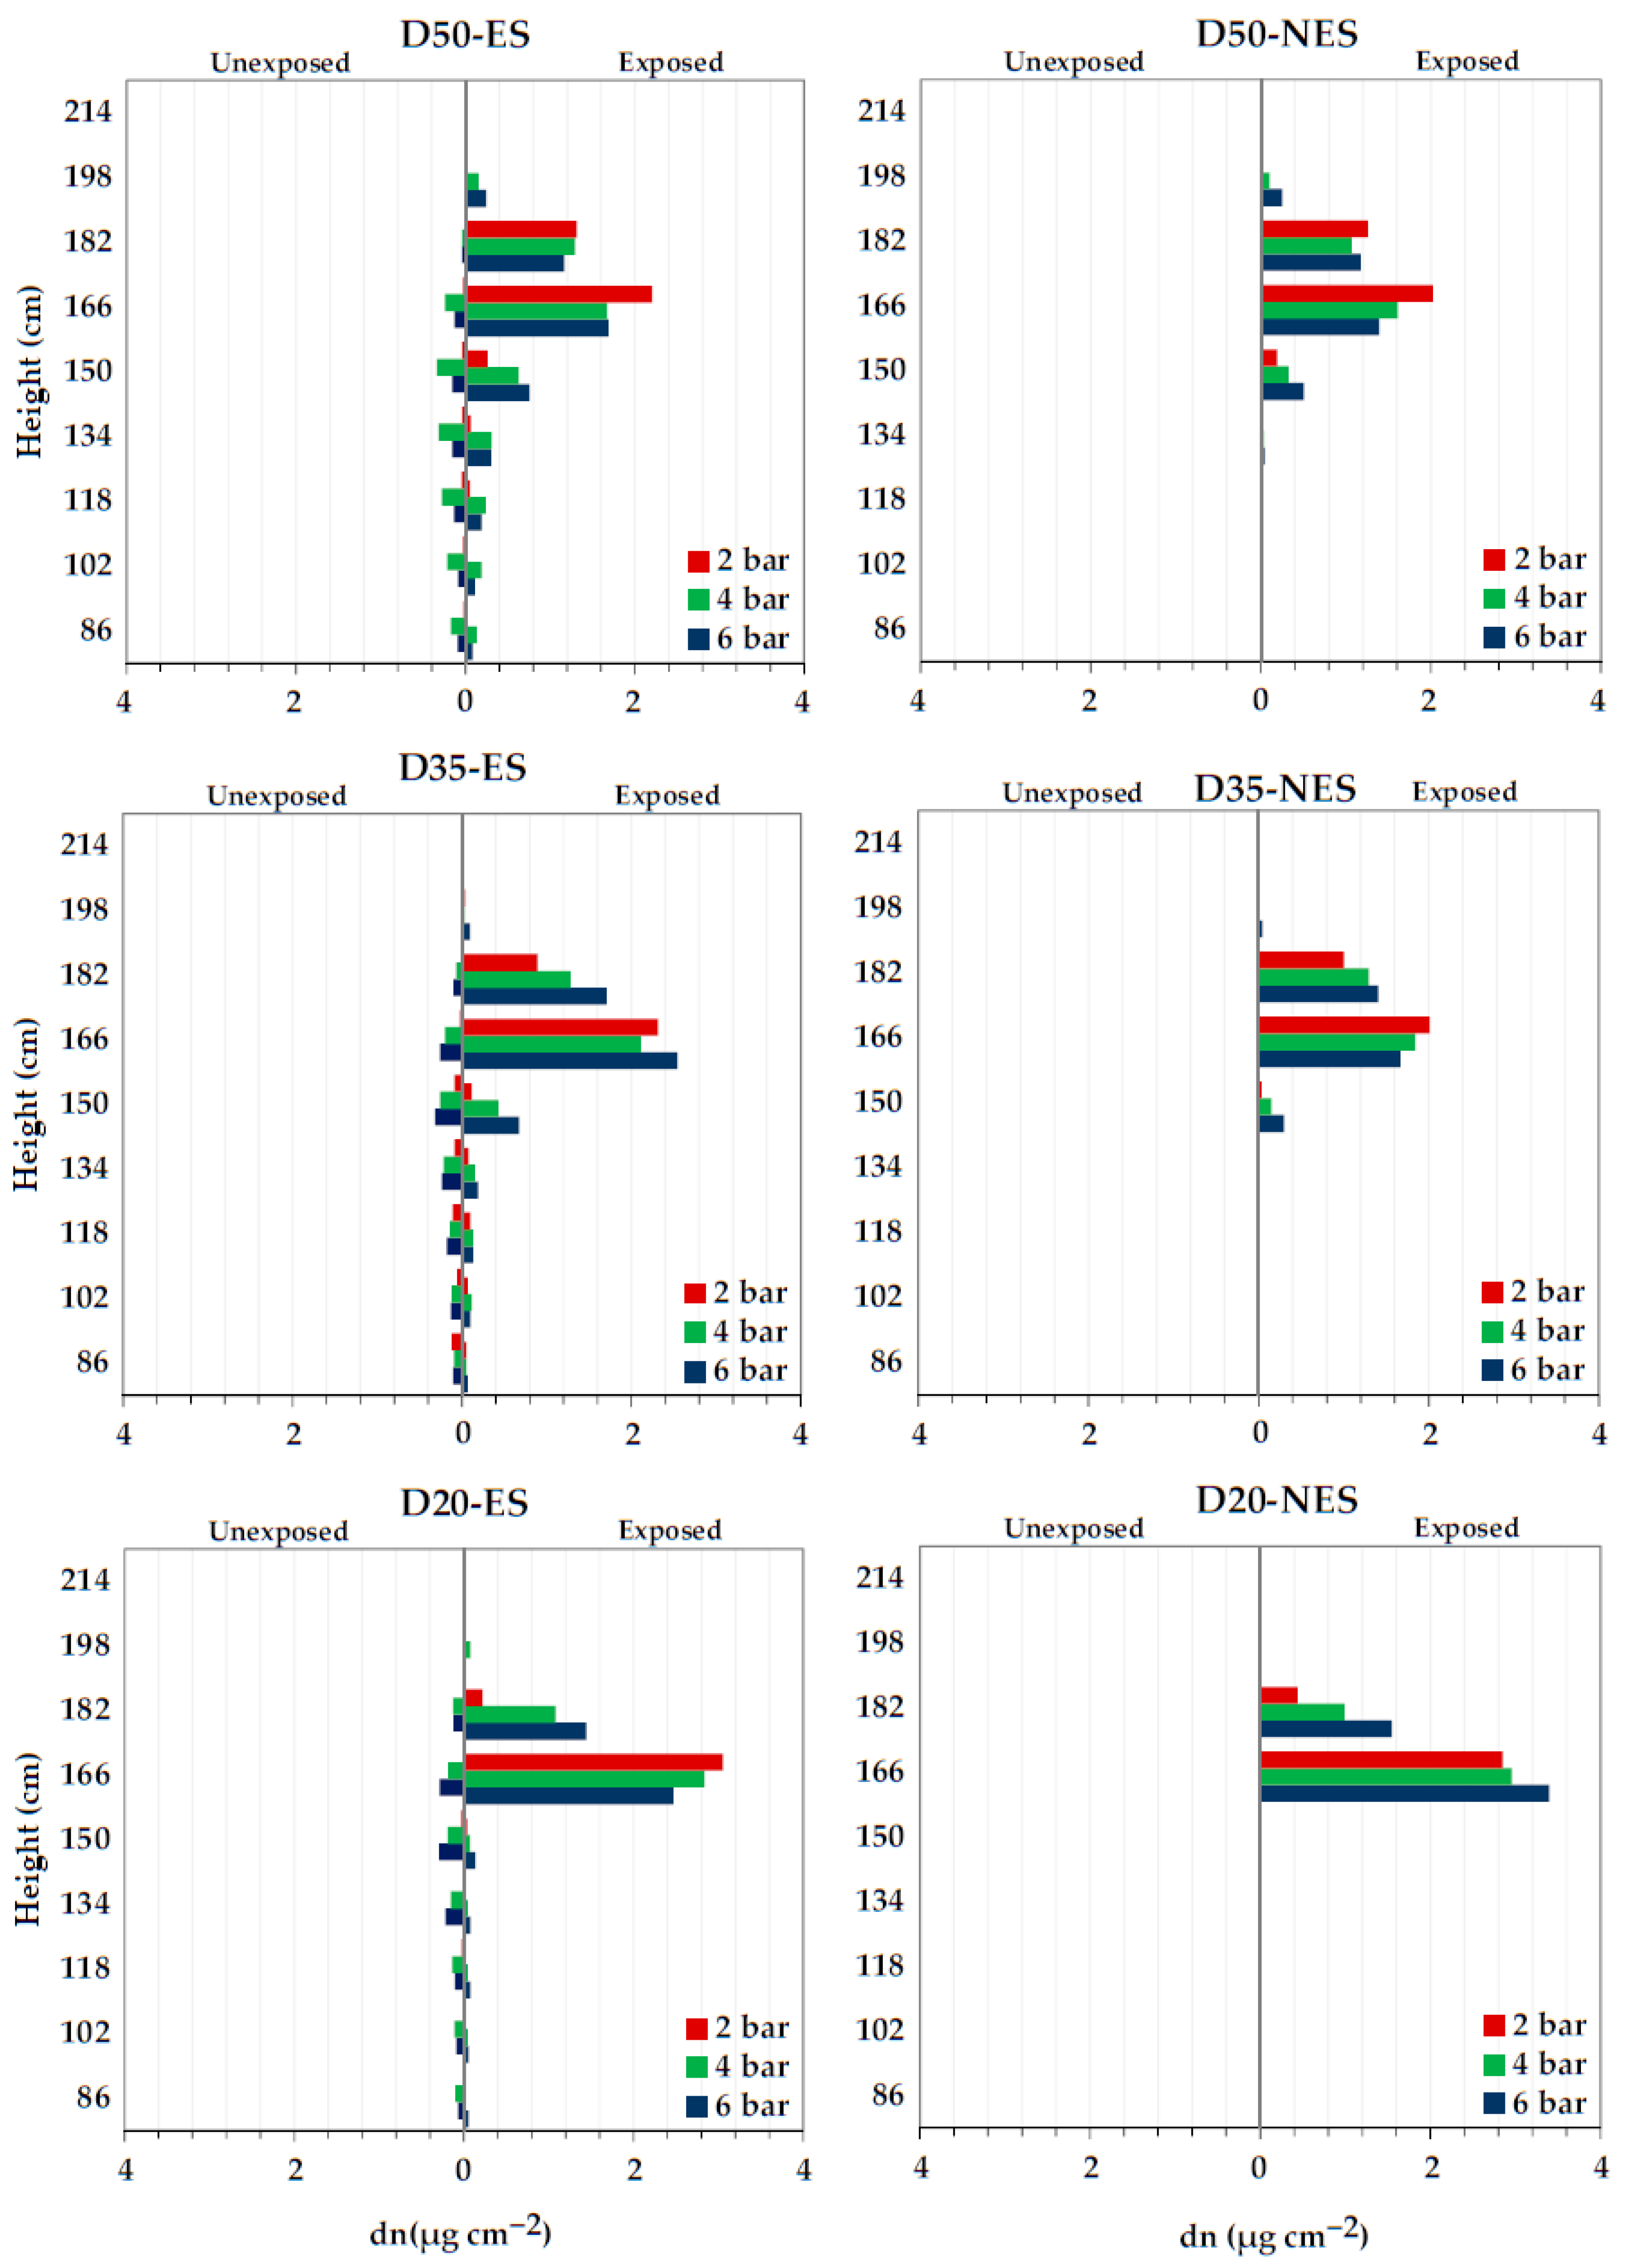
3.3. Laboratory Coverage/Deposition Tests

Coverage results of WSP for each configuration, pressure, distance, and height are shown in Figure 11. A clear effect of the electrostatic system connection on the covered surface was observed. At closer distances (20 cm and 35 cm), the coverage percentage of the WSPs on the unexposed side reached 60% for those positioned at heights near the lance (placed at 167 cm from the ground). Table 3 shows the average coverage percentage values, considering the actual working conditions of the nozzle (between 142 cm and 190 cm height), associated with the spray angle, as determined in the previous horizontal distribution evaluation.
The percentage of coverage was higher in all cases for the ES configuration at the exposed side. For the NES, however, there was no covered WSP on the unexposed side of the post. Regarding the effect of fluid pressure on the coverage percentage, little effectiveness of the electrostatic system was observed for the lowest pressure (2 bar). For this pressure, on average, the percentage of covered area increased by only 1% when the electrostatic system was connected (Table 3). However, as pressure increased, coverage significantly increased, reaching a maximum increase (26%) at a distance of 35 cm and a pressure of 6 bar using the ES configuration, for which an average of 33% was obtained on the unexposed side.
Figure 12 shows mean normalized deposition results (μg cm−2) for all configurations at each height. Again, no product was quantified for the NES configuration on the unexposed side of the post. Similar to the coverage results, the ES led to an increase in product deposition (Table 4), with a maximum total increase at 35 cm and 6 bar (46.43% in exposed side). Under these conditions, 66% of the total increased deposition was achieved by connecting the electrostatic system due to a combination of factors also observed in crop trials. Furthermore, deposition values also reached their maximum on the unexposed side, with a value of 0.22 μg cm−2.
Deposition results on the exposed side were similar at all pressures (p > 0.05) considering normalized results and homogeneous flow rates. However, the lack of effect of the electrostatic system connection on the unexposed side at 2 bar was also noted, showing the reduced effectiveness of this technology with the increase in droplet size.
Although the literature often describes previous laboratory equipment calibration followed by deposition efficiency evaluation in field conditions, some studies have similarly used laboratory characterization in terms of deposition before conducting those field trials. Marchant and Green [30] used 75 mm diameter × 700 mm long aluminum tubes as targets, placing strips of paper on them for analysis via chromatography. They observed deposition increases by factors of 1.6 to 2.8 with the ES configuration, operating at 6 kV voltage. Similar increases were observed in the study carried out by Dante and Gupta [7], who evaluated a spinning disc electrostatic sprayer on artificial soybean aluminum targets in laboratory tests, and by Maski and Durairaj [19], who also tested on aluminum targets, with air assistance, the effectiveness of an electrostatic spraying system operating between 0 and 4 kV and with a VDM ranging from 101 to 171 μm. In this case, they achieved deposition increases from 0.78 to 1.79 μg cm−2 on adaxial surfaces and from 0.66 to 1.33 μg cm−2 on abaxial surfaces. Gan-Mor et al. [25] tested an electrostatic sprayer prototype in laboratory conditions using a grounded metal cylinder with water-sensitive paper on both sides, moving at 0.8 m s−1 through the static spray stream. In their tests, 480 droplets cm−2 were deposited on the front and 23 droplets cm−2 on the rear with the NES configuration, while ES spraying resulted in 370 droplets cm−2 on the rear.

3.4. Coverage and Deposition in Crop Conditions

Table 5 presents the average results of coverage percentage and deposition obtained in the field tests, depending on the section, depth, side of the post, and the selected electrostatic system configuration. Although the tests were conducted at different heights close to the ground to assess the effect of the electrostatic system on the amount of product lost before reaching the crop, the results in Table 4 focus on those heights associated with the nozzle’s working width. Since it was located at 90 cm above the ground, a height range of 80 cm to 120 cm was considered for the analysis of water-sensitive papers, and a range of 70 cm to 110 cm for the analysis of filter papers.
Coverage and deposition results were highly correlated in all cases, leading to consistent conclusions regarding the performance of this prototype on tomato crops with varying vegetation densities. However, some differences compared to laboratory assays were observed. In this case, the effect of the electrostatic system connection was evident on the side exposed to the spraying, regardless of the section and depth studied, in comparison to NES configuration results. Conversely, although high coverage and deposition values were achieved on the unexposed side under laboratory conditions, field results indicated a low adherence capacity in hidden areas of the crop for all configurations studied. Specifically, the average coverage on the unexposed side was only 18%, considering Section 1, which had a lower density (LAI = 2.13) and depth 1 (D1), the closest position to the spray. In this sense, high values of vegetation density in all sections must be considered.
Figure 13 shows the total amount of manganese (μg) calculated for each depth, considering all filter papers along each post (twelve units, one per described height, with two sides of the post) and their area (24 cm2). The comparison between the ES and NES configurations is presented for each depth and section separately. Although the most significant differences were mainly observed on the exposed side, as previously highlighted by average values, an overall increase in deposition was clear across all depths in sections S1 and S2, with global increments of 60.87 μg and 82.4 μg, respectively, when working with charged droplets. However, for the highest density, this difference was not appreciable in deeper areas (D2 and D3). The absence of wind and the lack of excessive humidity levels in both environments suggest that atmospheric factors were not responsible for the reduction in the electrostatic system’s ability to cover unexposed areas of the crop. Instead, vegetation density emerged as the primary influencing factor. High values of vegetation density in all sections likely interfered with the electrostatic field, limiting the movement of charged droplets towards target areas, such as the undersides of leaves. The dense foliage may have caused charged droplets to disperse into adjacent zones rather than adhere effectively to the intended target areas, particularly in less exposed regions of the crop. This dispersion, combined with the inherent challenges of penetrating dense canopies, could explain the observed reduction in coverage effectiveness in those hidden sections of the crop.
In contrast to laboratory deposition assays, several studies have been conducted to evaluate electrostatics in agricultural spraying under field conditions by combining different configurations of application parameters depending on the typology of the studied equipment.
Few studies have been found that address the application of this technology in handheld equipment with hydraulic nozzles without incorporating air assistance. Some, such as the study conducted by Laryea and No [18] evaluated the performance of a sprayer equipped with a pressure swirl nozzle, operating at 4 kV, with droplet sizes of 116 μm and a CMR of 0.27 mC kg−1, achieving an increase in deposition droplet by 1.3- to 2.3-fold. Mamidi, Ghanshyam [14] similarly evaluated this type of nozzle on a knapsack sprayer, operating at voltages of 3.25 kV and CMR values of 0.4 mC kg−1, achieving increases of the same order as the previous authors, as well as a significant improvement in terms of both quantity and uniformity. More recently, Gan-Mor, Ronen [25] worked with higher voltages (10 kV) for similar droplet sizes, obtaining CMR values of 2.5 mC kg−1. In tests conducted on a vineyard crop, they achieved increases in droplet deposition of 200% on the undersides of the leaves and 500% on the rear of the grape clusters.
This work presents similar results to many studies that have shown the NES configuration to be ineffective on the undersides of leaves. However, there are some studies that have observed greater penetration capability with the NES configuration in deeper parts of the crop. For instance, Gupta and Duc [8] evaluated an air-assisted disc sprayer with both the ES and NES configurations without air configurations, demonstrating enhanced penetration with the NES configuration, working at 30 cm distance above the plants.
Focusing on electrostatic equipment evaluation at lower voltages and its impact on deposition performance, those studies which involve pneumatic spraying, smaller droplet sizes (around 30 μm to 60 μm), and CMR values around 10 mC kg−1 must be mentioned. In this sense, promising results have been obtained for different crop conditions. Mishra et al. [21] found that the droplet density on both the front and underside of leaves significantly increased with the ES configuration compared to the NES (57.53% vs. 59.60%, respectively). Pascuzzi and Cerruto [11] observed a 44% increase in total deposition with the ES configuration in a tendone vineyard by applying the product in an upward direction at a distance of approximately 0.5 m from the crop. However, this increase was only associated with the lower layer since no significant differences in deposition were found in the upper layer (from 0.016 μL cm−2 to 0.018 μL cm−2, p > 0.05). Identical nozzles, mounted on a sprayer designed for a trellised vineyard, were evaluated by Salcedo et al. [22] and compared with a conventional sprayer (VMD = 150 μm), reducing about 68% the applied volume compared to conventional sprayer, which also showed a lower capability of penetration than the electrostatic sprayer. In contrast, some years later, Salcedo et al. [38] carried out a comprehensive evaluation of three electrostatic devices in an apple orchard, comparing ES vs. NES configurations for each one and finally concluding that none of the observed differences in deposition values were associated with the effect of the electrostatic system connection but were rather due to the equipment itself.
Another study worth mentioning is the one carried out by Sánchez-Hermosilla et al. [24] on a greenhouse pepper crop. ES vs. NES configurations from a handheld electrostatic sprayer, as well as a conventional application, were evaluated. In this case, and locating the lance of the equipment similarly to the present work, higher deposition values were observed with the ES configuration, followed by the conventional sprayer, and lastly the NES configuration (0.86 μL cm−2, 0.58 μL cm−2, and 0.54 μL cm−2, respectively). This trend was replicated on the underside of the leaves as well. In terms of soil losses, the lowest values were those related to the ES configuration (2.12 μL cm−2), followed by the NES configuration (2.62 μL cm−2), and the highest values were obtained for conventional application (3.28 μL cm−2, p < 0.05 with respect to the ES and NES).
More recently, and also in tomato crops, Guo et al. [39] evaluated the influence of charging voltage polarity, spray direction, and the effect of air assistance on the application of electrostatic technology in terms of deposition, working with voltage ranges from 0 to ±10 kV and higher distances (from 1 m to 5 m). In this case, consistent with the present study, they observed higher deposition with the use of the technology. Furthermore, maximum deposition values were obtained in downward applications with air assistance. This air-assisted effect was also confirmed by Zhou et al. [40] in the evaluation of an electrostatic pneumatic nozzle on grapevine plants under laboratory conditions, working in this case at 0.2 m, 0.6 m, and 1 m distance and maximum values of CMR of 1.97 mC kg−1, obtained at 4 kV.

4. Conclusions

A comprehensive characterization and performance evaluation of an electrostatic knapsack prototype, equipped with a hydraulic nozzle and operating at low voltage, were conducted under both laboratory and field conditions.
Results revealed heterogeneous droplet size values when operating at 2 bar pressure. This variability disappeared at higher pressures (4 bar and 6 bar), where droplet size decreased significantly while the charge-to-mass ratio values increased exponentially, reaching a maximum of 0.38 mC kg−1. In this context, activating the electrostatic system did not cause variations in droplet size.
No effect was observed on the horizontal distribution profile due to charged droplets; however, the vertical distribution of the product was affected. The non-electrostatic system (NES) configuration led to droplets falling before reaching the vertical patternator, resulting in higher water volumes in collectors located closer to the ground. Therefore, although no significant differences were observed in the total accumulated volume between configurations, the connection of the electrostatic system provided better distribution across the working width of the nozzle.
Under laboratory conditions, the effect of the electrostatic connection was clear, with a 66% increase in total deposition achieved using the electrostatic system (ES). Maximum coverage values of approximately 60% were observed on the unexposed side of the artificial target at closer application distances (20 and 35 cm), compared to 0% with the NES configuration.
Results from tomato crop trials continued to show greater product adherence with the ES configuration overall on the surface layer of the crop and the side exposed to the spraying. However, as the crop density increased, the penetration capability of the product decreased, resulting in negligible deposition values for both electrostatic configurations (ES and NES) in the deepest areas of the crop at high densities.
Overall, results suggest that this technology could be a feasible option for enhancing treatment efficacy and integration into this type of equipment. However, the fact that in field trials the improvement in deposition was mainly associated with the exposed side of the crop highlights the need for additional trials. These should focus on evaluating the increase in coverage on the hidden side of the leaves based on vegetation density and also assess the performance of the prototype across different crop species and a wider range of scenarios.

Author Contributions

Conceptualization: F.J.G.-R. and M.V. (Mariano Vidal); Methodology: A.V.-M., M.V. (María Videgain), A.B., M.V. (Mariano Vidal) and F.J.G.-R.; Software: A.V.-M., M.V. (María Videgain) and F.J.G.-R.; Validation: A.V.-M., M.V. (María Videgain) and F.J.G.-R.; Formal Analysis: A.V.-M., M.V. (María Videgain) and F.J.G.-R.; Investigation: A.V.-M., M.V. (María Videgain), A.B., M.V. (Mariano Vidal) and F.J.G.-R.; Resources: A.V.-M.; Data curation: A.V.-M., M.V. (María Videgain) and F.J.G.-R.; Writing—original draft preparation: A.V.-M.; Writing—review and editing: A.V.-M., M.V. (María Videgain) and F.J.G.-R.; Visualization: A.V.-M.; Supervision: M.V. (María Videgain), A.B., M.V. (Mariano Vidal) and F.J.G.-R.; Project administration: F.J.G.-R.; Funding acquisition: F.J.G.-R. All authors have read and agreed to the published version of the manuscript.

Funding

This research was co-financed by the Government of Aragon and the European Agricultural Fund for Rural Development as part of the cooperation actions of agricultural sector agents under the Rural Development Program for Aragon 2014–2020, for the year 2022 (Order AGM/59/2022).

Data Availability Statement

The original contributions presented in the study are included in the article; further inquiries can be directed to the corresponding author.

Acknowledgments

The authors wish to thank the company Euro Denker S.L. (Tecnostatic) for its collaboration in the technological development of this research.

Conflicts of Interest

The authors declare no conflicts of interest.

References

  1. Doruchowski, G.; Balsari, P.; Van de Zande, J. Development of a crop adapted spray application system for sustainable plant protection in fruit growing. Int. Symp. Appl. Precis. Agric. Fruits Veg. 2009, 824, 251–260. [Google Scholar] [CrossRef]
  2. Gil, E.; Escolà, A.; Rosell, J.; Planas, S.; Val, L. Variable rate application of plant protection products in vineyard using ultrasonic sensors. Crop. Prot. 2007, 26, 1287–1297. [Google Scholar] [CrossRef]
  3. Llorens, J.; Gil, E.; Llop, J.; Escolà, A. Variable rate dosing in precision viticulture: Use of electronic devices to improve application efficiency. Crop. Prot. 2010, 29, 239–248. [Google Scholar] [CrossRef]
  4. Salcedo, R.; Zhu, H.; Zhang, Z.; Wei, Z.; Chen, L.; Ozkan, E.; Falchieri, D. Foliar deposition and coverage on young apple trees with PWM-controlled spray systems. Comput. Electron. Agric. 2020, 178, 105794. [Google Scholar] [CrossRef]
  5. Law, S.; Thompson, S.; Balachandran, W. Electroclamping forces for controlling bulk particulate flow: Charge relaxation effects. J. Electrost. 1996, 37, 79–93. [Google Scholar] [CrossRef]
  6. Patel, M.K.; Khanchi, A.; Chauhan, A.; Kumar, A.; Akkireddi, S.R.K.; Jangra, A.; Kanawade, R.; Manivannan, N.; Mitchell, G.R. Real-time measurement of droplet size and its distribution of an air-induced air-assisted electrostatic nozzle. J. Electrost. 2022, 115, 103665. [Google Scholar] [CrossRef]
  7. Dante, E.T.; Gupta, C. Deposition studies of an electrostatic spinning disc sprayer. Trans. ASAE 1991, 34, 1927–1934. [Google Scholar] [CrossRef]
  8. Gupta, C.P.; Duc, T.X. Deposition studies of a hand-held air-assisted electrostatic sprayer. Trans. ASAE 1996, 39, 1633–1639. [Google Scholar] [CrossRef]
  9. Gupta, C.P.; Singh, G.; Muhaemin, M.; Dante, E.T. Field performance of a hand-held electrostatic spinning-disc sprayer. Trans. ASAE 1992, 35, 1753–1759. [Google Scholar] [CrossRef]
  10. Law, S.E. Electrostatically charged sprays. In Pesticide Application Methods; John Wiley & Sons, Inc.: Hoboken, NJ, USA, 2014; pp. 275–298. [Google Scholar]
  11. Pascuzzi, S.; Cerruto, E. Spray deposition in “tendone” vineyards when using a pneumatic electrostatic sprayer. Crop. Prot. 2015, 68, 1–11. [Google Scholar] [CrossRef]
  12. Patel, M.K.; Praveen, B.; Sahoo, H.K.; Patel, B.; Kumar, A.; Singh, M.; Nayak, M.K.; Rajan, P. An advance air-induced air-assisted electrostatic nozzle with enhanced performance. Comput. Electron. Agric. 2017, 135, 280–288. [Google Scholar] [CrossRef]
  13. Zhao, S.; Castle, G.; Adamiak, K. Factors affecting deposition in electrostatic pesticide spraying. J. Electrost. 2008, 66, 594–601. [Google Scholar] [CrossRef]
  14. Mamidi, V.R.; Ghanshyam, C.; Kumar, P.M.; Kapur, P. Electrostatic hand pressure knapsack spray system with enhanced performance for small scale farms. J. Electrost. 2013, 71, 785–790. [Google Scholar] [CrossRef]
  15. Patel, M.K.; Kundu, M.; Sahoo, H.K.; Nayak, M.K. Enhanced performance of an air-assisted electrostatic nozzle: Role of electrode material and its dimensional considerations in spray charging. Eng. Agric. Environ. Food 2016, 9, 332–338. [Google Scholar] [CrossRef]
  16. Patel, M.K.; Ghanshyam, C.; Kapur, P. Characterization of electrode material for electrostatic spray charging: Theoretical and engineering practices. J. Electrost. 2013, 71, 55–60. [Google Scholar] [CrossRef]
  17. Khatawkar, D.S.; Dhalin, D.; James, P.S.; Subhagan, S.R. Electrostatic induction spray-charging system (embedded electrode) for knapsack mist-blower. Curr. J. Appl. Sci. Technol. 2020, 39, 80–91. [Google Scholar] [CrossRef]
  18. Laryea, G.N.; No, S.-Y. Development of electrostatic pressure-swirl nozzle for agricultural applications. J. Electrost. 2003, 57, 129–142. [Google Scholar] [CrossRef]
  19. Maski, D.; Durairaj, D. Effects of charging voltage, application speed, target height, and orientation upon charged spray deposition on leaf abaxial and adaxial surfaces. Crop. Prot. 2010, 29, 134–141. [Google Scholar] [CrossRef]
  20. Lyons, S.M.; A Harrison, M.; Law, S.E. Electrostatic application of antimicrobial sprays to sanitize food handling and processing surfaces for enhanced food safety. J. Physics Conf. Ser. 2011, 301, 012014. [Google Scholar] [CrossRef]
  21. Mishra, P.; Singh, M.; Sharma, A.; Sharma, K.; Singh, B. Studies on effect of electrostatic spraying in orchards. Agric. Eng. Int. 2014, 16, 60–69. [Google Scholar]
  22. Salcedo, R.; Llop, J.; Campos, J.; Costas, M.; Gallart, M.; Ortega, P.; Gil, E. Evaluation of leaf deposit quality between electrostatic and conventional multi-row sprayers in a trellised vineyard. Crop. Prot. 2020, 127, 104964. [Google Scholar] [CrossRef]
  23. Llop, J. Improvement of spray application process in greenhouse tomato crop: Assessment of adapted spraying technologies and methods for canopy characterization. In Departament d’Enginyeria Agroalimentària i Biotecnologia; Universitat Politècnica de Catalunya: Barcelona, Spain, 2017. [Google Scholar]
  24. Sánchez-Hermosilla, J.; Pérez-Alonso, J.; Martínez-Carricondo, P.; Carvajal-Ramírez, F.; Agüera-Vega, F. Evaluation of Electrostatic Spraying Equipment in a Greenhouse Pepper Crop. Horticulturae 2022, 8, 541. [Google Scholar] [CrossRef]
  25. Gan-Mor, S.; Ronen, B.; Ohaliav, K. The effect of air velocity and proximity on the charging of sprays from conventional hydraulic nozzles. Biosyst. Eng. 2014, 121, 200–208. [Google Scholar] [CrossRef]
  26. García-Ramos, F.J.; Serreta, A.; Boné, A.; Vidal, M. Applicability of a 3D laser scanner for characterizing the spray distribution pattern of an air-assisted sprayer. J. Sensors 2018, 2018, 5231810. [Google Scholar] [CrossRef]
  27. Amaya, K.; Bayat, A. Determining effects of induction electrode geometry on charging efficiency of droplets in pesticide electrostatic spraying applications. Smart Agric. Technol. 2023, 4, 100190. [Google Scholar] [CrossRef]
  28. ISO 5682-2:1997; Equipment for Crop Protection—Spraying Equipment—Part 2: Test Methods for Hydraulic Sprayers. International Organization for Standardization: Geneva, Switzerland, 1997.
  29. Law, S.E.; Cooper, S.C. Induction charging characteristics of conductivity enhanced vegetable-oil sprays. Trans. ASAE 1987, 30, 0075–0079. [Google Scholar] [CrossRef]
  30. Marchant, J.; Green, R. An electrostatic charging system for hydraulic spray nozzles. J. Agric. Eng. Res. 1982, 27, 309–319. [Google Scholar] [CrossRef]
  31. Garcia-Ramos, F.J.; Vidal, M.; Bone, A. Field evaluation of an air-assisted sprayer equipped with two reversed rotation fans. Appl. Eng. Agric. 2009, 25, 481–494. [Google Scholar] [CrossRef]
  32. Cross, J.; Walklate, P.; Murray, R.; Richardson, G. Spray deposits and losses in different sized apple trees from an axial fan orchard sprayer: 1. Effects of spray liquid flow rate. Crop. Prot. 2001, 20, 13–30. [Google Scholar] [CrossRef]
  33. Gil, E.; Salcedo, R.; Soler, A.; Ortega, P.; Llop, J.; Campos, J.; Oliva, J. Relative efficiencies of experimental and conventional foliar sprayers and assessment of optimal LWA spray volumes in trellised wine grapes. Pest Manag. Sci. 2021, 77, 2462–2476. [Google Scholar] [CrossRef]
  34. Brentjes, A.; Jansen, B.; Pozarlik, A.K. Spray characteristics of an air-assisted electrostatic atomiser. J. Electrost. 2022, 115, 103654. [Google Scholar] [CrossRef]
  35. Kihm, K.D.; Kim, B.H.; McFarland, A.R. Atomization, charge, and deposition characteristics of bipolarly charged aircraft sprays. At. Sprays 1992, 2, 463–481. [Google Scholar] [CrossRef]
  36. Latheef, M.A.; Carlton, J.B.; Kirk, I.W.; Hoffmann, W.C. Aerial electrostatic-charged sprays for deposition and efficacy against sweet potato whitefly (Bemisia tabaci) on cotton. Pest Manag. Sci. 2009, 65, 744–752. [Google Scholar] [CrossRef]
  37. Martin, D.E.; Latheef, M.A.; López, J.D. Electrostatically charged aerial application improved spinosad deposition on early season cotton. J. Electrost. 2019, 97, 121–125. [Google Scholar] [CrossRef]
  38. Salcedo, R.; Sánchez, E.; Zhu, H.; Fàbregas, X.; García-Ruiz, F.; Gil, E. Evaluation of an electrostatic spray charge system implemented in three conventional orchard sprayers used on a commercial apple trees plantation. Crop. Prot. 2023, 167, 106212. [Google Scholar] [CrossRef]
  39. Guo, J.; Dong, X.; Qiu, B. Analysis of the Factors Affecting the Deposition Coverage of Air-Assisted Electrostatic Spray on Tomato Leaves. Agronomy 2024, 14, 1108. [Google Scholar] [CrossRef]
  40. Zhou, H.; Ou, M.; Dong, X.; Zhou, W.; Dai, S.; Jia, W. Spraying performance and deposition characteristics of an improved air-assisted nozzle with induction charging. Front. Plant Sci. 2024, 15, 1309088. [Google Scholar] [CrossRef]
Figure 1. Electrostatic sprayer prototype. (A) Electrostatic nozzle; (B) modified lance; (C) pressure gauge; (D) power button for electrostatic spraying and (E) sprayer tank; (F) power button for conventional spraying and pressure regulator (from 2 to 6 bar).
Agronomy 14 02343 g001
Figure 2. Experimental setup of the T laser diffraction system.
Agronomy 14 02343 g002
Figure 3. Droplet size distribution example.
Agronomy 14 02343 g003
Figure 4. Nozzle arrangement with respect to the vertical (A) and horizontal (B) test benches.
Agronomy 14 02343 g004
Figure 5. Arrangement of the sprayer with respect to the vertical post. Water-sensitive papers (WSPs) and filters on the exposed (1) and unexposed (2) side of the post. Nozzle located at 167 cm height.
Agronomy 14 02343 g005
Figure 6. Water-sensitive and filter paper setting in one section in greenhouse trials.
Agronomy 14 02343 g006
Figure 7. Span, Dv10, Dv50, and Dv90 obtained for each electrostatic system configuration (ES/NES) at different working pressures (2, 4, and 6 bar). Dashed lines and bars indicate connected electrostatic system.
Agronomy 14 02343 g007
Figure 8. Dv50 values (in μm, blue line) and CMR (in mC kg−1, red line) as a function of pressure (bar). The dashed lines show the trend lines of both curves.
Agronomy 14 02343 g008
Figure 9. Vertical distribution profile of equipment according to electrostatic system configuration (ES/NES), application distance, and fluid pressure.
Agronomy 14 02343 g009
Figure 10. Accumulated volume (mL) obtained from horizontal patternator assays for each electrostatic system configuration (connected: ES and unconnected: NES) and working pressure (from 2 bar to 6 bar) at 50 cm distance.
Agronomy 14 02343 g010
Figure 11. Percentage coverage for different distances (20 cm, 35 cm, and 50 cm), fluid pressures (2 bar, 4 bar, and 6 bar) and electrostatic system configurations (ES vs. NES).
Agronomy 14 02343 g011
Figure 12. Normalized deposition (dn), expressed by relation between the total Mn on the filter surface and the total amount of Mn per ground unit (μg cm−2filter/μg cm−2ground) obtained for different distances (20 cm, 35 cm, and 50 cm), fluid pressures (2 bar, 4 bar, and 6 bar) and electrostatic system settings (ES vs. NES).
Agronomy 14 02343 g012
Figure 13. Total manganese (μg) calculated for a given section and depth, depending on electrostatic system configuration (ES vs. NES).
Agronomy 14 02343 g013
Table 1. Factorial design adopted in the evaluation of the vertical distribution profile. Nozzle–ground distance: 167 cm. First collector base–ground distance: 110 cm. Distance between centers of collectors: 20 cm.
Sprayer Configuration *Fluid Pressures (Bar)Application Distances (cm)Collector Heights (cm)
ES; NES2; 3; 4; 5 and 635; 50 and 65120; 140; 160 and 180
* ES: Connected electrostatic system and NES: non-electrostatic system.
Table 2. Location heights of water-sensitive papers and filter papers on the front and rear part of the post.
Water-Sensitive Paper (cm)Filter Paper (cm)
7886
94102
110118
126134
142150
158166
174182
190198
206214
Table 3. Mean coverage (%) for all configurations in laboratory conditions considering the interval of heights between 142 cm and 190 cm. The percentage is calculated relative to cm2 of covered surface.
Distance (cm)Pressure (bar)ESNESIncrease (%) on Exposed Side Compared to NES *Total Increase (%) Compared to NES
Exposed SideUnexposed SideExposed SideUnexposed Side
20216.550.8215.570.000.980.90
432.736.2821.300.0011.438.86
648.0138.3339.540.008.4723.40
35225.031.1522.480.002.551.85
460.6019.1843.330.0017.2718.23
674.7333.2955.890.0018.8426.07
50230.550.5526.830.003.722.14
458.9015.9345.480.0013.4214.68
668.0710.6755.580.2012.4911.48
* Coverage increase associated with unexposed side was not calculated since the amount of product detected in all trials was 0.
Table 4. Mean normalized deposition (μg cm−2filter/μg cm−2ground) obtained in laboratory for each configuration considering the interval of heights between 150 cm and 182 cm.
Distance (cm)Pressure (bar)ESNESIncrease (%) on Exposed Side Compared to NES *Total Increase (%) Compared to NES
Exposed SideUnexposed SideExposed SideUnexposed Side
2021.100.021.100.000.001.82
41.330.171.320.000.7613.64
61.350.231.340.000.750.00
3521.110.041.010.009.9013.86
41.270.181.090.0016.5133.03
61.640.221.120.0046.4366.07
5021.260.021.160.008.6210.34
41.200.211.000.0020.0041.00
61.200.111.020.0017.6528.43
* Deposition increase associated with unexposed side was not calculated since the amount of product detected in all trials was 0.
Table 5. Mean coverage (%) and deposition (μg cm−2) obtained in crop trials for each section, depth, and side considering the interval of heights between 80 cm and 120 cm. The percentage is calculated relative to cm2 of covered surface.
SectionDepthCoverage (%)Deposition (μg cm−2)
ESNESESNES
Exposed SideUnexposed SideExposed SideUnexposed SideExposed SideUnexposed SideExposed SideUnexposed Side
S1D157.5918.6047.660.001.080.110.670.00
D256.690.0042.280.000.720.000.470.00
D342.180.0019.990.000.340.000.320.00
S2D156.714.5842.690.001.260.030.650.00
D248.030.0635.270.000.430.040.160.00
D331.370.0020.930.000.370.030.200.00
S3D159.894.9331.660.001.160.370.860.00
D220.340.0013.660.000.120.020.090.00
D33.540.006.920.000.080.000.010.00
Disclaimer/Publisher’s Note: The statements, opinions and data contained in all publications are solely those of the individual author(s) and contributor(s) and not of MDPI and/or the editor(s). MDPI and/or the editor(s) disclaim responsibility for any injury to people or property resulting from any ideas, methods, instructions or products referred to in the content.

