Article

Monitoring of Heracleum sosnowskyi Manden Using UAV Multisensors: Case Study in Moscow Region, Russia

by
Rashid K. Kurbanov
1,
Arkady N. Dalevich
2,
Alexey S. Dorokhov
1,
Natalia I. Zakharova
1,*,
Nazih Y. Rebouh
3,
Dmitry E. Kucher
3,
Maxim A. Litvinov
1 and
Abdelraouf M. Ali
3,4,*
1
Federal Scientific Agroengineering Center VIM, 1st Institutsky Proezd 5, 109428 Moscow, Russia
2
Guild of Digital Economy at the Moscow Chamber of Commerce and Industry, 107031 Moscow, Russia
3
Department of Environmental Management, Institute of Environmental Engineering, People’s Friendship University of Russia (RUDN University), 6 Miklukho-Maklaya St., 117198 Moscow, Russia
4
National Authority for Remote Sensing and Space Sciences (NARSS), Al-Nozha Al-Gedida, Cairo P.O. Box 1564, Egypt
*
Authors to whom correspondence should be addressed.
Agronomy 2024, 14(10), 2451; https://doi.org/10.3390/agronomy14102451
Submission received: 26 August 2024 / Revised: 15 October 2024 / Accepted: 18 October 2024 / Published: 21 October 2024

Abstract

:
Detection and mapping of Sosnowsky’s hogweed (HS) using remote sensing data have proven effective, yet challenges remain in identifying, localizing, and eliminating HS in urban districts and regions. Reliable data on HS growth areas are essential for monitoring, eradication, and control measures. Satellite data alone are insufficient for mapping the dynamics of HS distribution. Unmanned aerial vehicles (UAVs) with high-resolution spatial data offer a promising solution for HS detection and mapping. This study aimed to develop a method for detecting and mapping HS growth areas using a proposed algorithm for thematic processing of multispectral aerial imagery data. Multispectral data were collected using a DJI Matrice 200 v2 UAV (Dajiang Innovation Technology Co., Shenzhen, China) and a MicaSense Altum multispectral camera (MicaSense Inc., Seattle, WA, USA). Between 2020 and 2022, 146 sites in the Moscow region of the Russian Federation, covering 304,631 hectares, were monitored. Digital maps of all sites were created, including 19 digital maps (orthophoto, 5 spectral maps, and 13 vegetation indices) for four experimental sites. The collected samples included 1080 points categorized into HS, grass cover, and trees. Student’s t-test showed significant differences in vegetation indices between HS, grass, and trees. A method was developed to determine and map HS-growing areas using the selected vegetation indices NDVI > 0.3, MCARI > 0.76, user index BS1 > 0.10, and spectral channel green > 0.14. This algorithm detected HS in an area of 146.664 hectares. This method can be used to monitor and map the dynamics of HS distribution in the central region of the Russian Federation and to plan the required volume of pesticides for its eradication.

1. Introduction

Sosnowsky’s hogweed (Heracleum sosnowskyi Manden) is currently a significant problem in Russia, although it was introduced in the 1940s as a cultivated plant [1,2,3,4,5,6]. The height of the perennial plant reaches up to 3 m. In summer, essential oils are actively evaporated from the surface of the plant, while sap is formed in the stems and leaves. The sap, when on the exposed areas of the skin, causes a decrease in its protective functions to ultraviolet light, which leads to chemical burns and inflammation [7].
Currently, HS is most widely distributed in countries located near the Baltic Sea, Eastern Europe, the European part, Central Russia, Siberia, and the Far East [8,9]. One of the most problematic weeds is HS, as it penetrates natural ecosystems and begins to destroy them [10]. This weed has spread not only in fields and forests but also in large cities, parks, and yards. Every year, HS infests new hectares of land, and thousands of people go to hospitals with burns. There are problems in the identification, localization, and elimination of HS-growing and -spreading areas, in particular on the territories of urban districts and regions. Complete and reliable data on the areas of HS growth are needed for monitoring, eradication, and controlling the implementation of these measures.
Early detection and mapping of HS is necessary for planning control strategies [11,12]. The traditional method of mapping by traversing the treated area and performing a visual assessment with sampling requires labor-intensive procedures, is unsafe, and often does not consider the clusters of HS plants in remote or prohibited areas [13]. Methods for detecting HS based on space images take less time and cost less than field surveys. High and medium spatial resolution data from LandSat-8, Sentinel-2A, and RapidEye spacecraft [14] are suitable in terms of frequency and accuracy for HS monitoring and calculating the area occupied by them. The spectral channels of Sentinel-2A (blue (490 nm, bandwidth 65 nm), green (560 nm, bandwidth 35 nm), red (665 nm, bandwidth 30 nm), and near-infrared (842 nm, bandwidth 115 nm) bands) are used to decode space images with invasive plants [15,16,17]. To determine the locations of HS growth using space images, the HSI vegetation index was developed [18]. This method can be successfully applied for the detection of HS and the mapping of its growth areas within the regions of the Russian Federation. However, satellite images are often not available due to high cloud cover. In 2020, researchers were unable to obtain a dataset for the Moscow region. Detection and mapping of HS from satellites can be challenging in difficult conditions, such as among trees, and the low spatial resolution does not allow for sufficiently accurate identification of a single plant [19]. Satellite images provide a better solution for large areas, but for monitoring over the required time period at a low cost, it is more appropriate to use UAVs [20].
In recent years, the decreasing cost of unmanned aerial vehicle technology has expanded the scope of its application, including for mapping tasks [21,22,23]. The use of UAVs for mapping provides rapid data collection with high spatial resolution at a low cost [24]. Due to the high resolution, the contours of individual plants of HS can be seen on digital maps. At the same time, mapping large areas is a labor-intensive and time-consuming process. Algorithms are developed, and neural networks are trained to automate the process [25]. Convolutional neural networks are a good tool for detecting HS [26]. The complexity of this method lies in the limitations of altitude and flight time due to the additional payload on board the UAV, which significantly reduces the flight time of the UAV [27].
For scientific research, particularly in agriculture, multispectral and hyperspectral cameras on board UAVs are widely used. Multispectral aerial photography has been a part of precision farming technology for a long time, and it is the most optimal tool. The analysis of multispectral data provides the opportunity to make effective management decisions in crop monitoring. The potential of UAVs for the detection of weeds is currently being explored in academic research [28,29]. Most studies examining the detection of weeds are conducted in agricultural settings [30]. Orthophoto and vegetation indices, such as the NDVI, are employed for mapping purposes [31]. Recently, there has been an increase in the number of research articles on the identification of weed vegetation using artificial intelligence technologies. Neural networks have been employed to identify weed vegetation species on orthophotos and visible range images [32]. However, the classification of weed vegetation species, shrubs, and trees from multispectral data remains an understudied area. The development of new approaches and algorithms is necessary for the classification of weed vegetation and, in general, the identification of plants from multispectral data [33]. Scientific studies aimed at detecting HS have shown increased efficiency when analyzing multispectral images from UAVs [34,35,36,37]. However, the analysis of UAV images for the detection and mapping of HS needs further research [38,39,40,41].
HS monitoring and mapping tasks should be carried out without human involvement in hazardous areas. The results of the data analysis should contain the exact area occupied by HS and location data for its mapping and eradication. The multitude of remote sensing techniques aimed at detecting HS has considerable potential for understanding the technology of detection, mapping, and eradication of HS hotspots [42,43,44,45]. These problems are not fully addressed and require further research for the development of new algorithms.
Considering the above, this work aimed to develop a method for the identification of HS plants using multispectral UAV imagery data. This work focused on (a) exploring the potential of using multispectral images from UAVs collected during the initial phases of plant development and flowering between May and July; (b) determining the optimal combination of spectral channels and vegetation indices; and (c) validating the developed algorithm. This method could be used to determine the exact area of HS growth and plan the required volume of pesticides for its eradication.

2. Materials and Methods

2.1. Study Area

The survey area of the study territory contained sites affected by HS in the Moscow region, Russia, 55°24′54.4″ N 37°14′2″ E and 56°5′18.7″ N 37°54′48.9″ E (Figure 1). A total of 146 sites with a maximum area of 305 ha were investigated (Table 1). The sites differed in terms of study area and type: near parks, playgrounds, private households, and meadows.
The climate in the study area was temperate continental, influenced by air masses coming from the Atlantic and the Arctic. Prevailing winds were from north-western and south-western directions. The district is located on the southern slopes of the Klin-Dmitrovskaya Ridge of the Russian Plain. Sod-podzolic soils are the most characteristic. The environmental zone was a forest. The subzone was characterized by the presence of broad-leaved and coniferous forests, which exhibit elements of steppe flora.
The following data were filled in for each site: site area, area occupied by HS, and date of aerial photography.
The leaves of HS plants exhibit distinctive shapes and configurations. The stem of HS is almost straight. The average stem thickness at the base varies between 4 and 10 cm. Dark red veins are visible on the trunk and leaf cuttings, the number of which depends on the environmental conditions to which the plants are exposed. The leaf has a pronounced curvature and demonstrates cross-linking. The leaf size is usually larger relative to nearby growing grasses. Within the same population of plants, there are leaves with rounded or pointed ends. The inflorescence of HS is a compound umbrella, up to 60 cm in diameter. The number of flowers produced by a single inflorescence may reach 150. A single plant could bear 70,000 flowers. Although not often, one adult plant forms about 30 thousand seeds. HS is significantly taller than all the grasses that grow around it. If it is a wild field, the umbrella is about 2 m high. If the lawn has been mowed at a time when other grasses typically reach a height of 15–20 cm, the leaves of HS will reach a length of 45–60 cm. Therefore, the detection and eradication of HS plants before inflorescence formation is critical to controlling the spread and expansion of HS. At high orthophoto resolutions of up to 5 cm/pix, HS is visually distinguishable. Once the presence of HS is visually confirmed on the map, the identified location is recorded.
On the studied sites, HS plants were located both on open ground and on sites with complex relief (ravines, bushes, trees, and objects of inanimate nature). The surveys took place from 12 May to 4 July, from 2020 to 2022, during the period of bright green leaves, flowering, and before the yellowing of the leaves of HS.

2.2. UAV Image Acquisition

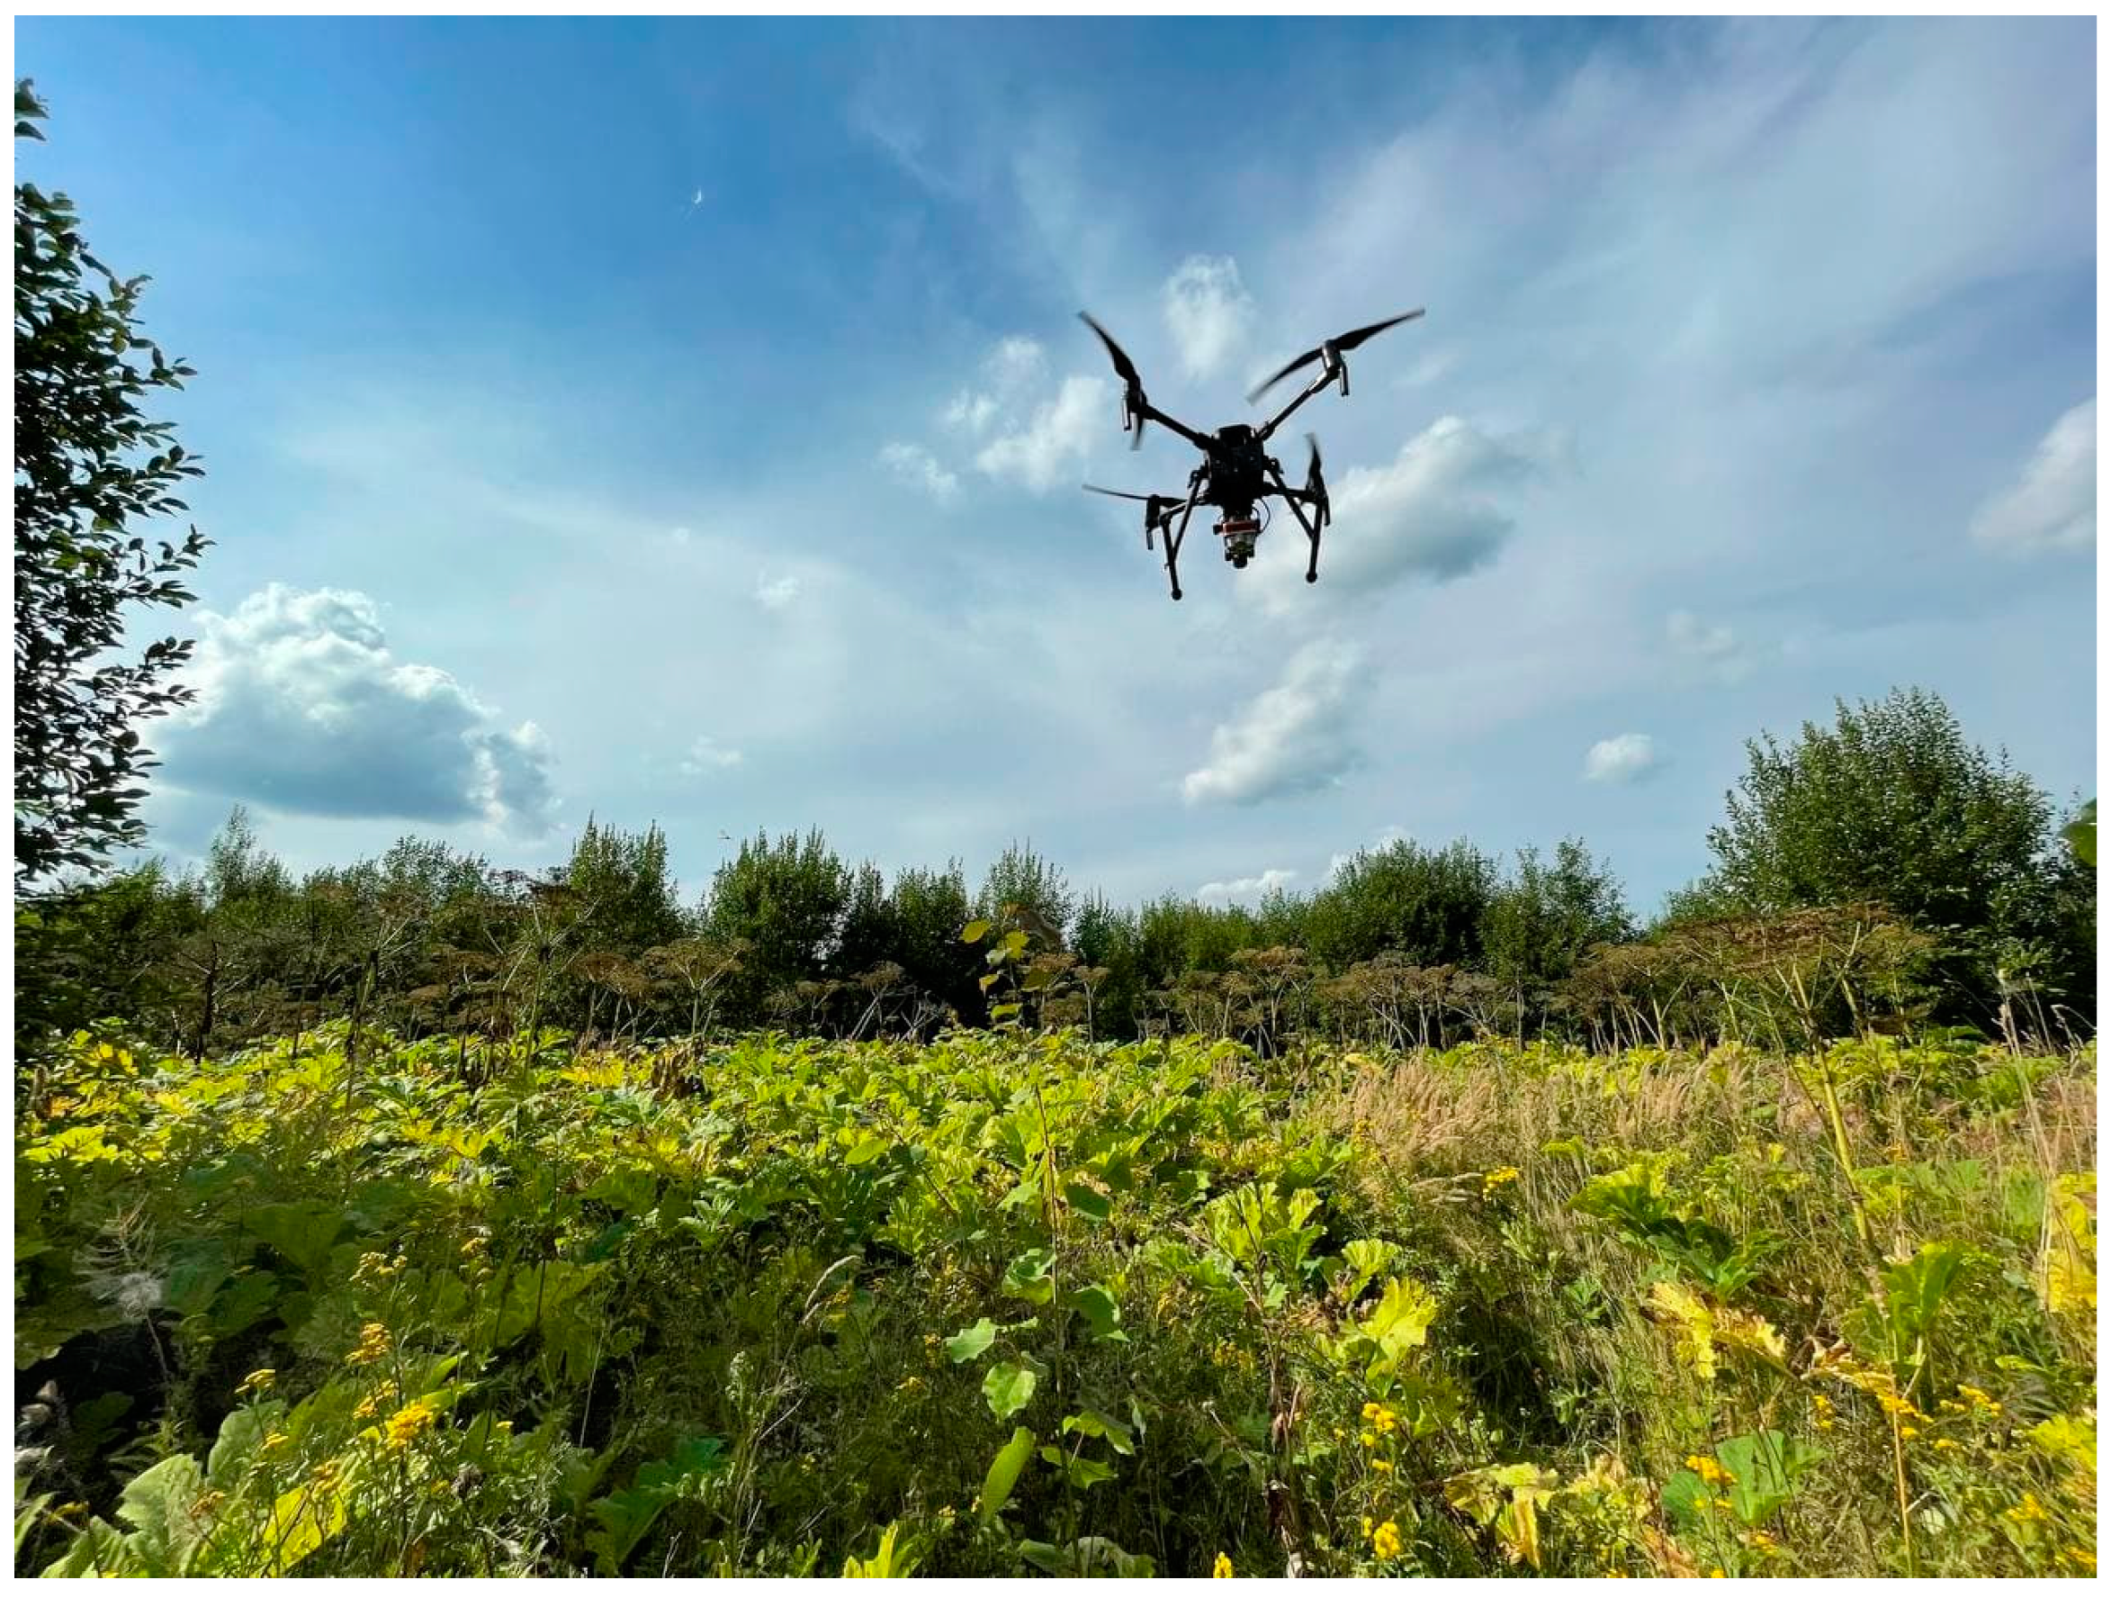
In the study, a serial quadcopter DJI Matrice 200 v2 (Dajiang Innovation Technology Co., Shenzhen, China) with a GNSS receiver Topodrone PPK (Figure 2) was used to collect aerial images. This technical solution was designed for high-precision monitoring with planimetric and altitude accuracy of the acquired data up to 5 cm without the use of ground control points. The drone was equipped with a 20 MP DJI Zenmuze x4s (Dajiang Innovation Technology Co., Shenzhen, China) visible camera. For collecting multispectral data, a MicaSense Altum camera (MicaSense Inc., Seattle, WA, USA) with a DLS 2 sensor was mounted on board the UAV using a special proprietary suspension. The DLS 2 has a built-in GPS receiver. The sensor measured ambient light and the angle of the sun and recorded the coordinates of each image. The multispectral camera produced images from six cameras simultaneously, every 3.2 megapixels (2064 × 1544): blue (B): 475 ± 32 nm; green (G): 560 ± 27 nm; red (R): 668 ± 16 nm; red edge (RE): 717 ± 12 nm; near-infrared (NIR): 842 ± 57 nm; and long-wave infrared (LWIR): 8–14 µm.
Aerial surveys were performed in the DJI Pilot program, where pre-created contours of the studied sites were uploaded as KML files. The air photography was performed with the same settings for all flights. The flight height for flat and open sites was set to 70 m, relative to the highest point on the terrain. For complicated conditions where HS plants grew in bushes and trees, the flight altitude was 50–60 or 70 m, depending on the terrain and other high objects. The speed of the UAV varied depending on the flight altitude: 2.8 m/s, 3.4 m/s, and 3.9 m/s, respectively. To collect reliable data, all flights were conducted according to the pre-flight planning recommendations (https://support.micasense.com/hc/en-us/articles/224893167-Best-practices-Collecting-Data-with-MicaSense-RedEdge-and-Parrot-Sequoia, accessed on 7 April 2020). The longitudinal and transverse overlap of the RGB camera images was 83%, which corresponds to 75% of the multispectral camera overlap. Such parameters of aerial photography were necessary when two cameras were used simultaneously on board the UAV [46]. The settings of the MicaSense Altum multispectral camera were made via a WEB interface, which became available after connecting the camera to a smartphone via Wi-Fi. The trigger altitude at the beginning of aerial photography was set 10 m below the operating altitude of the UAV. The shooting interval between images was set by longitudinal overlap. Before starting the imaging process, the UAV was prepared for flight. In particular, the compass of the UAV and the focal length of the DJI Zenmuze x4s camera were calibrated, and optimal image settings were set to ISO 100–200, aperture 2.8–4, and shutter 1/640. To calibrate the multispectral camera, images of the calibration panel were taken before and after each flight.
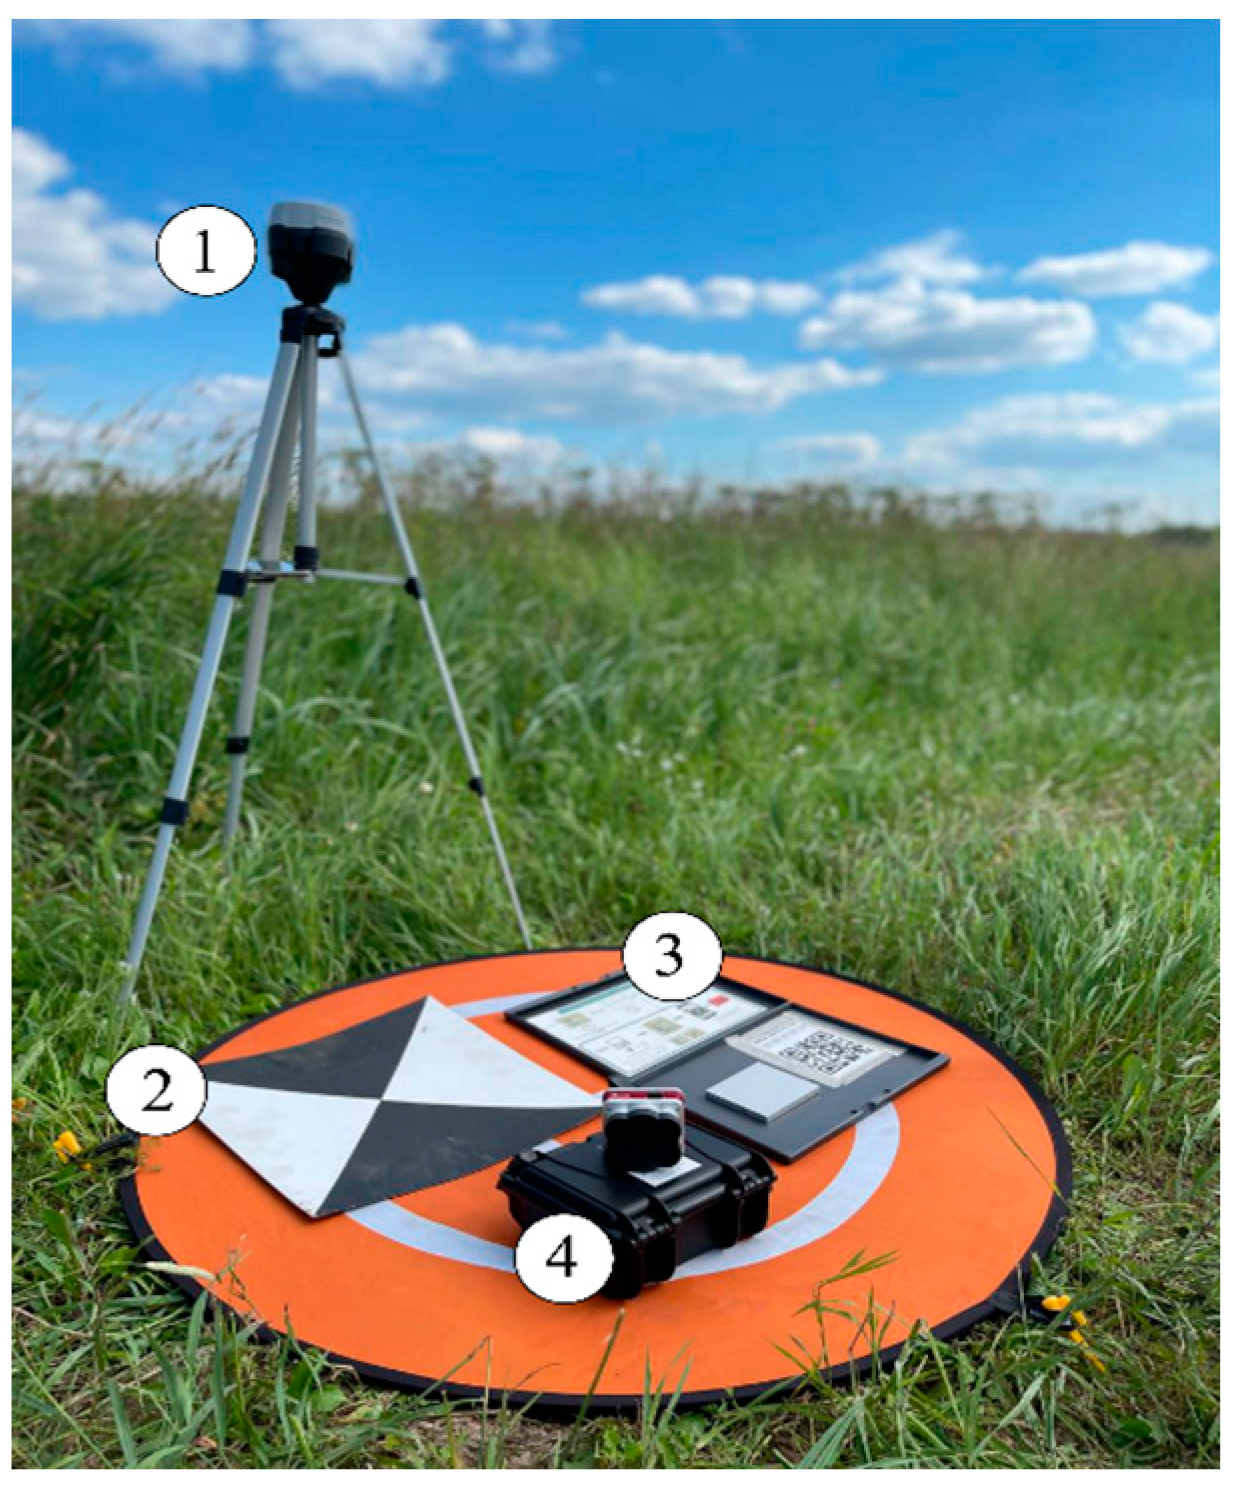
The next step was to place 3 groups of ground control points, each 1600 cm2 in area, made according to Pix4D recommendations (https://www.pix4d.com/blog/GCP-accuracy-drone-maps/, accessed on 10 April 2020), and install the GNSS station. This procedure is time-consuming, but it was necessary to estimate the project error in the photogrammetric software. The coordinate centers of the ground control points were measured using a high-precision GNSS receiver, Emlid Reach RS2 (Emlid Tech Kft., Budapest, Hungary) (Figure 3) [47]. A connection was made to base stations in the Moscow region, located at a distance of less than 20 km.
Over the course of three years, 160 flights were conducted at 146 sites. A total of 500 GB of data were accumulated (Table 2).

2.3. Data Preparation and Processing

After the flights, the aerial imagery data were prepared and converted. This stage consists of post-processing GNSS measurements, checking the used coordinate system, and replacing navigation coordinates in the EXIF tags of images with highly accurate ones. Post-processing ensures a high level of accuracy for digital maps; the project error did not exceed 3–5 cm in plan and height.
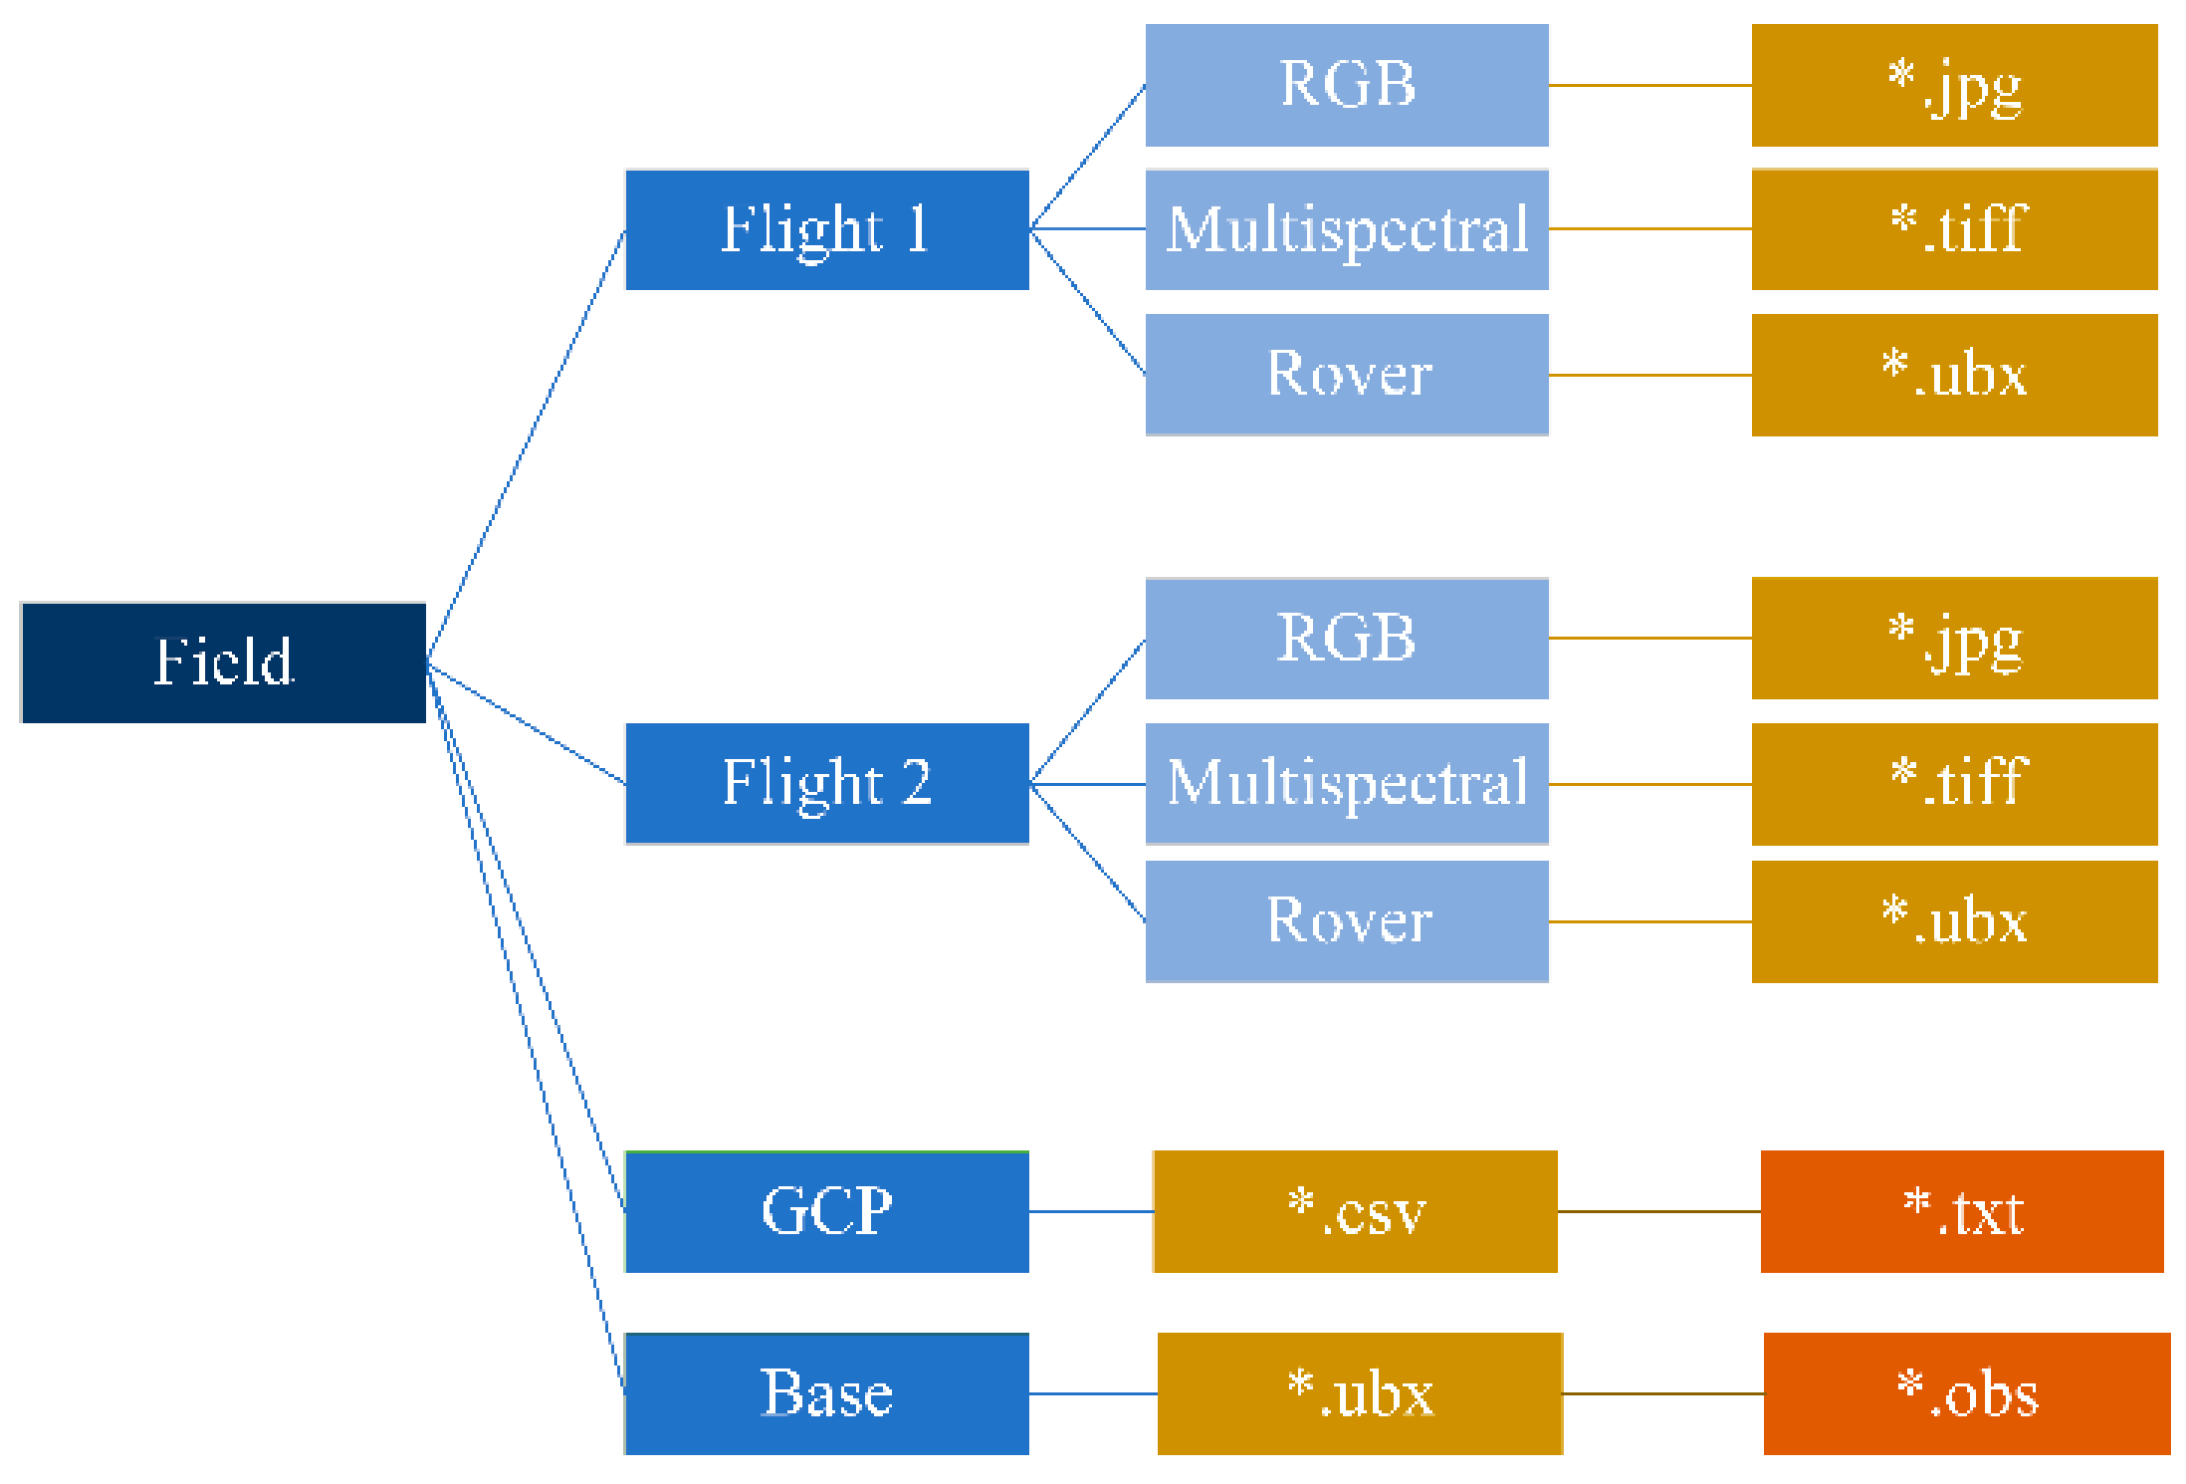
The images were grouped by flight (Figure 4), including UBX files from the UAV rover, static GNSS logs from the base station, and ground control point and base station coordinate files. The base station data were converted to a Rinex format. Ground control point data from the Emlid Reach RS2 GNSS receiver were entered into a text file.
Further, the automatic processing of prepared data from all flights was performed in the Topodrone Post Processing software (version 1.0.3.25). As a result of the processing, the following data were received: a file with high-precision coordinates, photographs with updated EXIF tags, and files of GNSS data post-processing results.
Photogrammetric processing of visible and spectral channel data was performed in the Agisoft Metashape (version 1.8.4) and Pix4DFields (version 1.12.0) programs, respectively. All photos with high-precision coordinates were processed using the Structure for Motion (SfM) method in the Agisoft Metashape and Pix4DFields programs. Pix4DFields also used more sophisticated processing algorithms, which were indirectly mentioned in the technical documents on the support website: https://support.pix4d.com/hc/en-us/articles/360000235026-Advanced-knowledge-Scientific-papers (accessed on 6 April 2020).

2.4. Assessment of Project Accuracy

After identifying and marking the ground control points, the mean square error for each axis was calculated ((X 1), (Y 2), (Z 3)):
R M S E x = t = 1 n ( X O i X G N N S i ) 2 n
R M S E y = t = 1 n ( Y O i Y G N N S i ) 2 n
R M S E z = t = 1 n ( Z O i Z G N N S i ) 2 n
where n is the number of ground control points.
X O i , Y O i , and Z O i are the X, Y, and Z coordinates obtained after initial aerial triangulation.
X G N N S i , Y G N N S i , and Z G N N S i are the X, Y, and Z coordinates measured with a GNSS receiver in the field.
To estimate the error of the whole project, we applied the formula of the root mean square error R M S E p (4):
R M S E p = t = 1 n ( X O i X G N N S i ) 2 + ( Y O i Y G N N S i ) 2 + ( Z O i Z G N N S i ) 2 n
The area of Sosnowsky’s hogweed plants was determined using Global Mapper software (version 22.1.1). For each flight, orthophoto, spectral maps, and vegetation index maps were created using data from RGB and multispectral cameras. The coordinates of ground control points were used for highly accurate determination of the exterior orientation elements of the images [47]. The spatial resolution (GSD) of the orthophoto for the aforementioned altitudes were 1.37, 1.64, and 1.91 cm/pix, respectively. For spectral maps, the GSDs were 2.29, 2.47, and 2.71 cm/pix, respectively.

2.5. UAVs’ Spectral and Derived Vegetation Indices

For each of the four experimental sites, 19 digital maps (orthophoto, 5 spectral maps, and 13 vegetation index maps) were calculated [48]. Vegetative indices estimating the content of phytomass, chlorophyll a and b, and nitrogen in plant leaves were selected, as well as indices whose calculation used the blue spectral channel (Table 3). When the blue channel is available, it is possible to calculate indices that are robust to atmospheric manifestations such as fog, dust, smog, air pollution, and land cover reflections. The blue channel helps to correct the atmospheric aerosol manifestations that the red channel records [49,50]. The main reason why the blue channel is more susceptible to atmospheric manifestations than the red channel is that the wavelength of the blue channel is shorter. As a general rule, if the wavelength is shorter, the scattering would be stronger. The custom BS1 index was derived empirically by analyzing the HSI index used for satellite imagery.

2.6. Collecting Ground Control Point

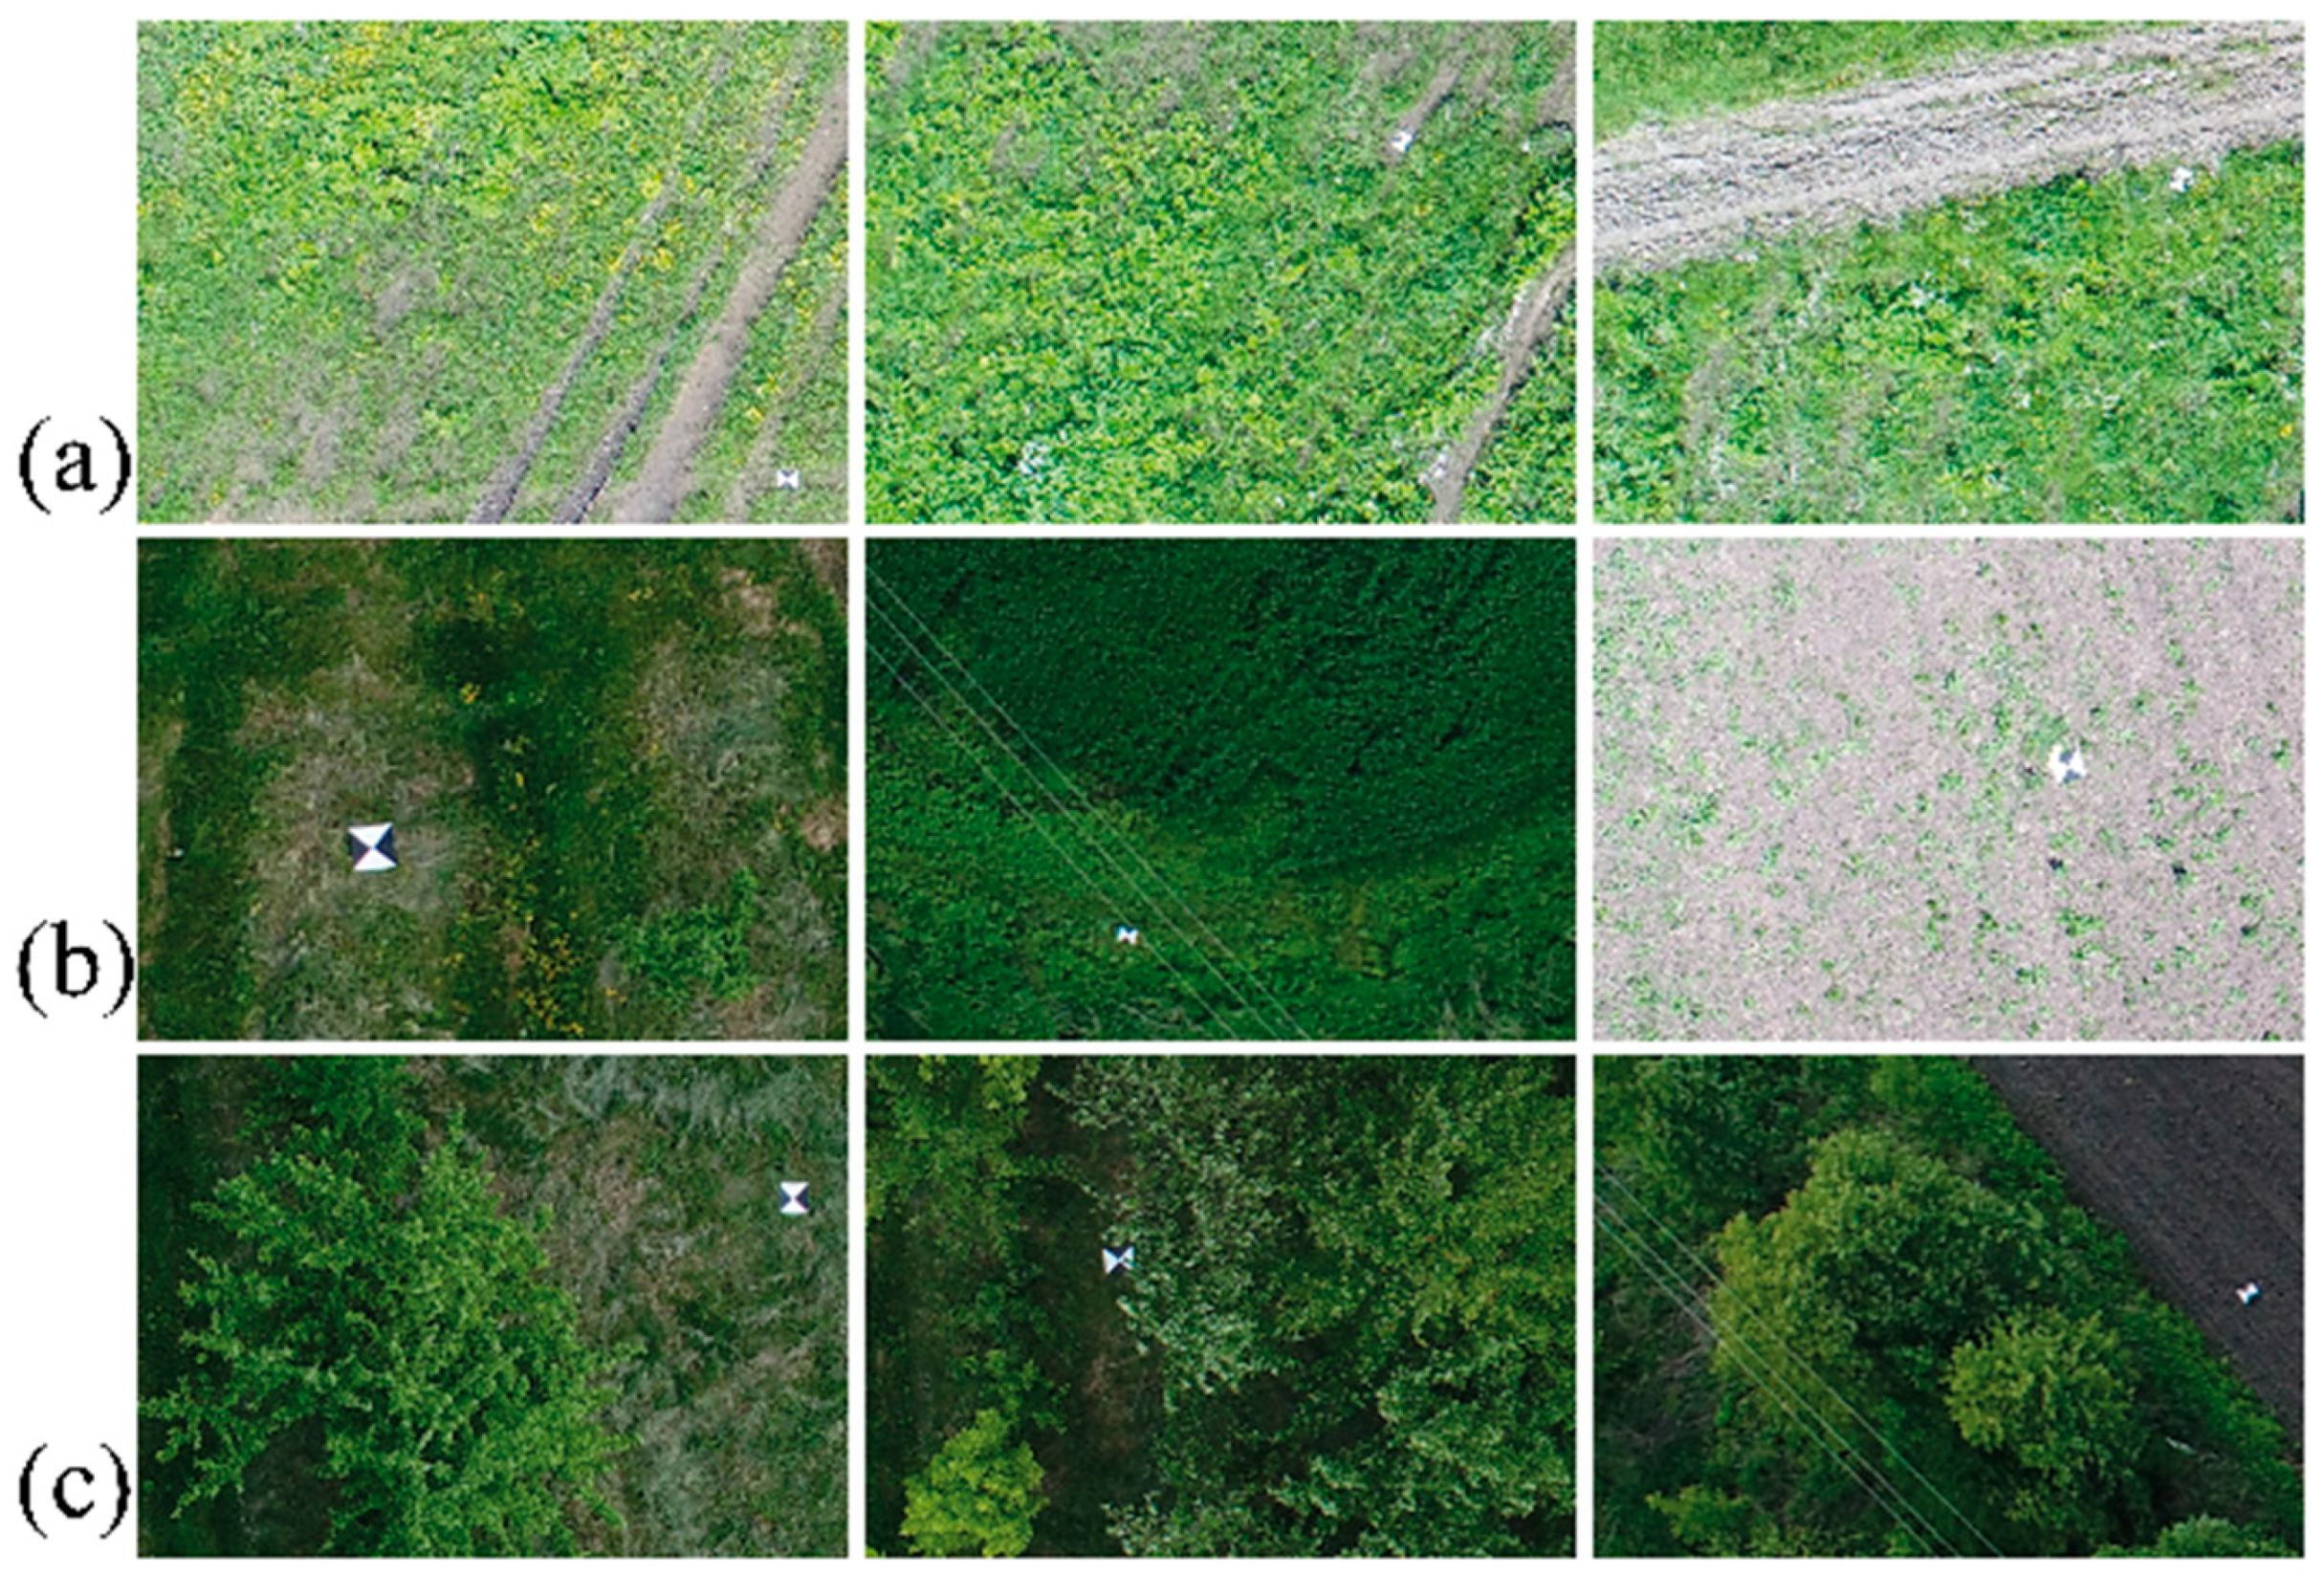
Ground control points were placed on the study sites in three categories: grass, near trees, and HS plants. The sample amounted to 1080 points in three years (2020, 2021, and 2022), 120 points for each category per year, and 360 points for each category overall. To recognize ground control points on the orthophoto, a script was written in Python 3.10.5 (certificate of state registration of the computer program 2024616648, dated March 22, 2024, Russian Federation) using the ResNet50 neural network of the DeepForest project [60,61]. DeepForest provides detection and classification of objects from aerial images or orthophotos. DeepForest is based on the object detection module from the Torchvision package and is designed to simplify the training of object detection models.
The training site and training data layers were created in the Agisoft Metashape program. Based on the selected data, the ResNet50 neural network of the DeepForest project was trained, and a model was created to recognize ground control points. Based on the results of ground control point detection, the program highlights all found objects with white boxes. Each object is checked for false positives. The contours of objects that are not correctly recognized are deleted. A file will be saved in the selected directory with the coordinates of the control points in .geojson or .txt format. The time spent comparing ground and air measurements changes depending on the number of control points. The module’s efficiency rises by up to 25% as the number of ground control points increases.

2.7. Statistical Analysis

The coordinates of the ground control points of HS plants, trees, and grasses were loaded onto digital maps (Figure 5). The mean values (M) of the spectral channels and vegetation indices and the standard deviation (SD), maximum, and minimum values were calculated. Student’s t-test was employed to identify any differences between the samples. The mean values of the vegetation indices of HS were evaluated in terms of grass cover (GR) and trees (TR), as well as in comparison between grass cover and trees. Significant differences were accepted at the ρ ≤ 0.05 level. In the event of overlap between the ranges of the mean index/channel values for HS, grass, and/or trees within the minimum range, the mean index/channel values were selected. In the event that the ranges of mean index/channel values for HS, grass, and/or trees do not overlap, the minimum values within the range of mean values are then selected.

2.8. Developed Algorithm for Identification of Sosnowsky’s Hogweed

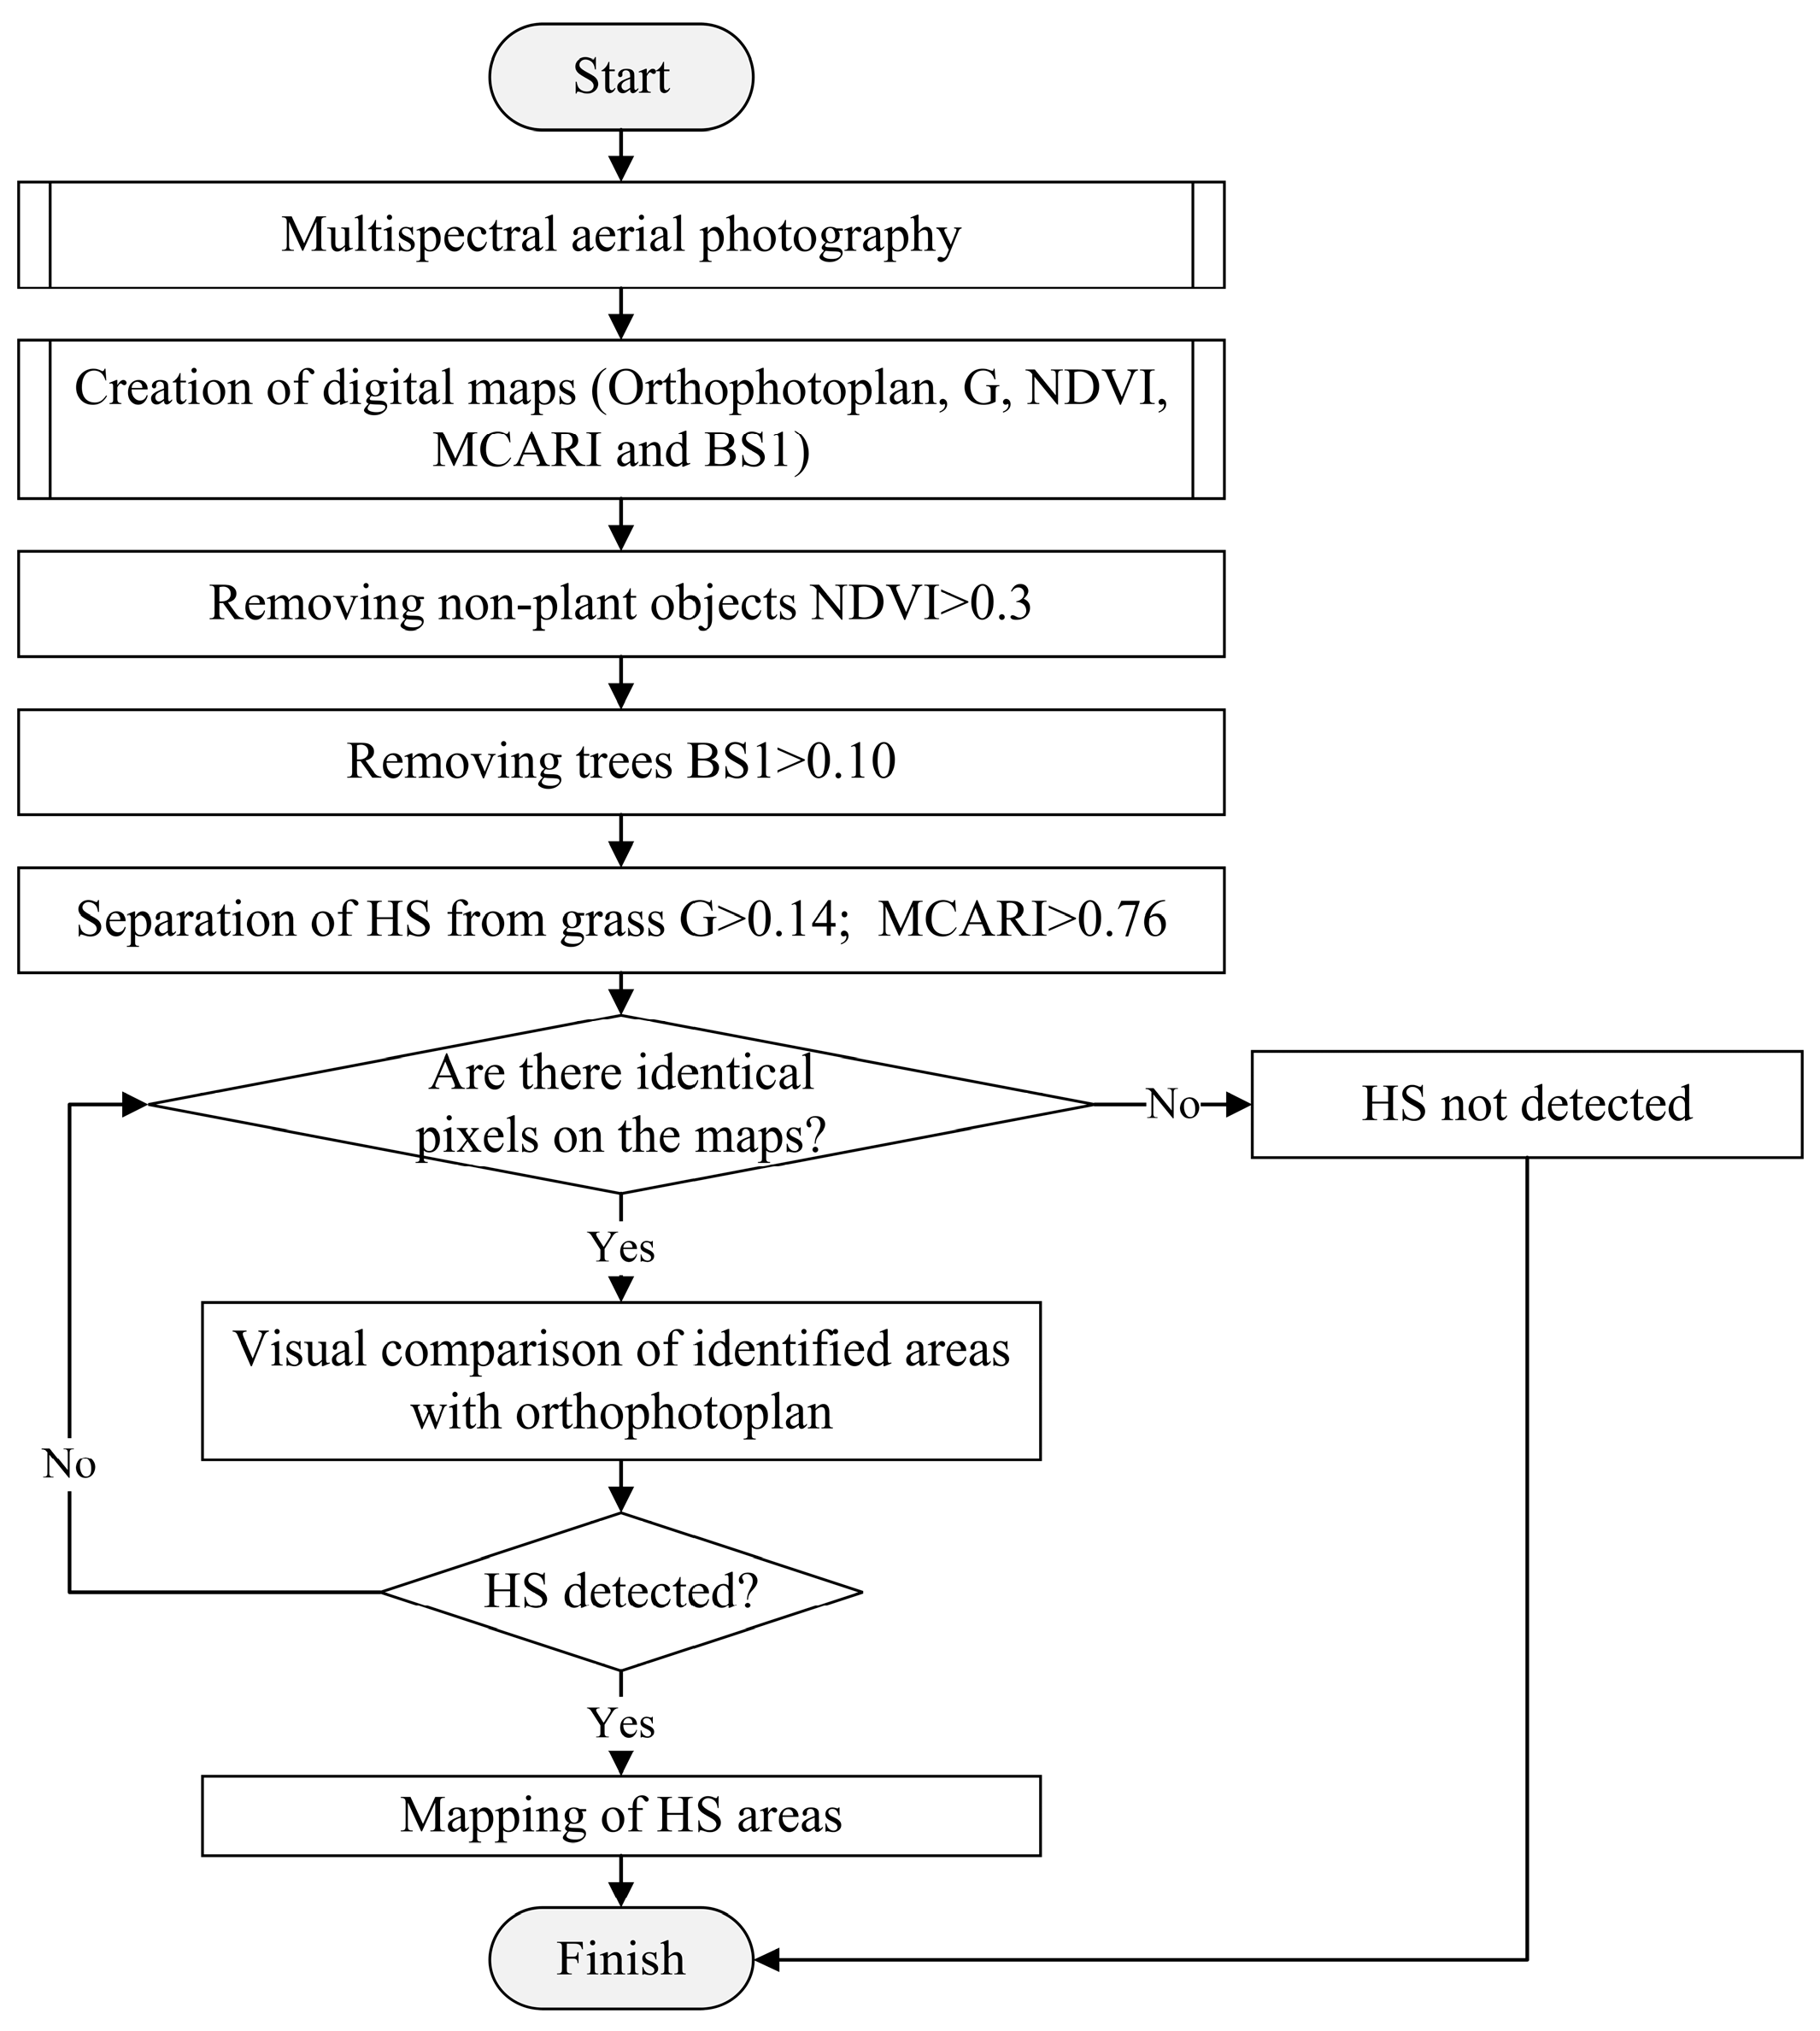
Visual and raster analysis of the calculated maps was used to identify HS plants (Figure 6). In consideration of the acquired data, an algorithm for the identification of HS on digital maps obtained from an unmanned aerial vehicle and a multispectral camera has been developed. The algorithm describes the whole process of HS identification, starting with multispectral aerial photography and ending with the mapping of HS locations. The algorithm can be used with a multispectral camera comprising five spectral channels: blue, green, red, red edge, and near-infrared. In calculating vegetation indices, including NDVI, MCARI, and BS1, all five channels are used. When thematically processing digital maps, it is necessary to remove all objects with values lower than those indicated in the algorithm.
Following the completion of the aerial survey, the next step is to create digital maps. These should include orthophotos, a green channel spectral map, and maps of the NDVI, MCARI, and BS1 indices. The NDVI map should exclude non-vegetation features and any vegetation with an NDVI value below 0.3. This may be accomplished through the utilization of geographic information systems (GISs) and photogrammetric software, such as Global Mapper, Pix4DFields, or analogous applications. The software should facilitate the photogrammetric processing of multispectral data, the creation, analysis, and export of vegetation maps, the selection of common pixels, and the mapping of the study sites. The BS1 index map should be subjected to a process of object removal, whereby any objects with a BS1 index value exceeding 0.10 are eliminated. Trees fall within this range. The objects present on the spectral map of the green channel and MCARI map, which have a value of greater than 0.14 and greater than 0.76, respectively, should therefore be removed. Grass cover falls within these ranges. Subsequently, the digital maps (NDVI, MCARI, BS1, and green) should be overlaid in GIS software, with pixel-by-pixel analyses conducted. The common peak segments in the four maps indicate HS. The identified pixels are then compared with the orthophoto.
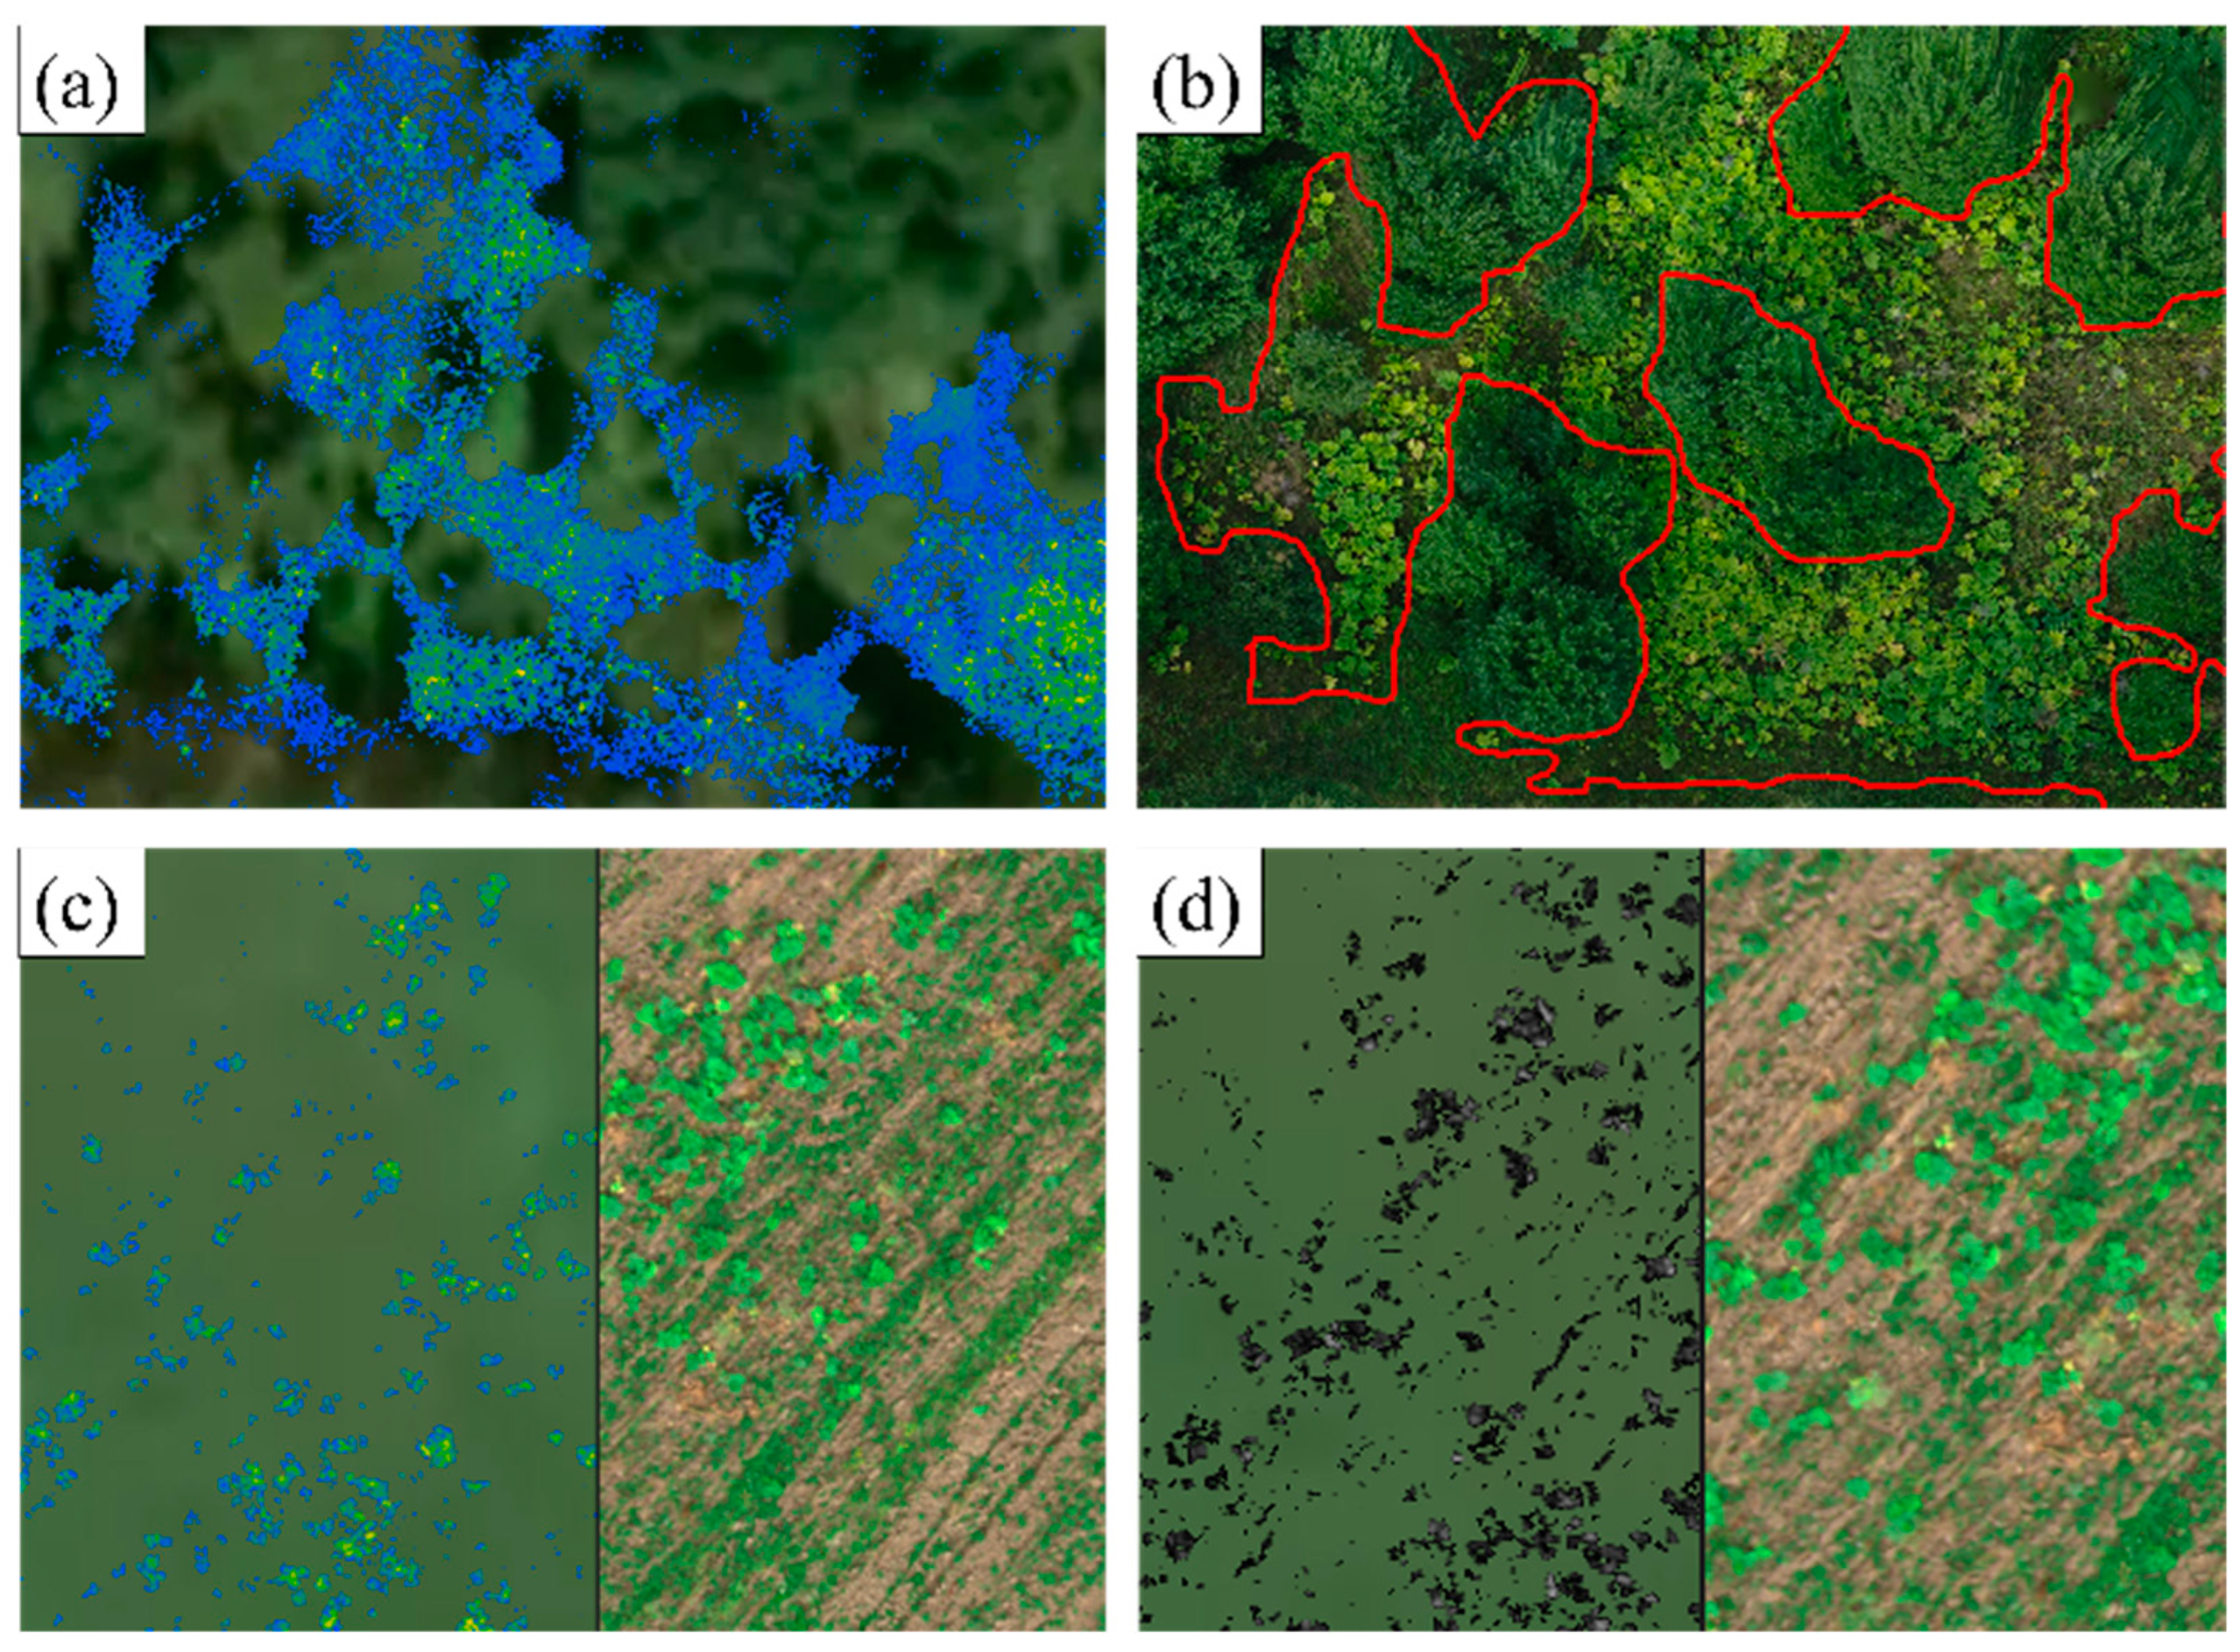
Figure 7a illustrates the functioning of the BS1 index, with HS and grass remaining within the blue zone. Consequently, the PIX4DFields program allows for the removal of trees. Figure 7b illustrates the outline of the areas to be removed on the BS1 index map. Figure 7c depicts the MCARI index in split mode, wherein it is evident that some of the grass vegetation has been removed (as seen on the left side of Figure 7c). Figure 7d exemplifies the operation of the green spectral channel, wherein the left part of Figure 7d depicts the removal of some of the grass vegetation.

3. Results

3.1. Spectral Analysis of Sosnowsky’s Hogweed

The accuracy of projects was calculated for RGB and multispectral data. The RGB data ranged from 2.5 to 5 cm, while that of multispectral data ranged from 3 to 5 cm. The high accuracy obtained by the projects allows for the use of digital maps for mapping HS plants and the subsequent application of contours for their eradication.
The spectral characteristics of HS, trees, and grasses at the studied sites during the period of bright green leaves were constructed into curves (Figure 8). The differences between the spectral characteristics of HS, trees, and grasses can be observed in the green, red edge, and near-infrared channels. The green spectral channel is the optimal channel for identifying areas of HS growth within different vegetative phases. The vegetation indices MCARI, GNDVI, ENDVI, CIG, and BS1 use the green channel in their calculations.

3.2. Statistical Analysis of the Results

The mean values of the vegetation indices were compared using Student’s t-test (Table 4). The vegetation index BWDRVI demonstrated no statistically significant differences across the various groups. It proved more challenging to differentiate between grass and HS than between trees and HS. The NDVI, ENDVI, CI, and BNDVI indices did not reveal any statistically significant differences between grass and HS. The majority of vegetation indices and spectral channels revealed significant differences between HS, grass, and trees. Nevertheless, only the green spectral channel and the vegetation indices CIRE, CIG, and BS1 demonstrated differences between the three groups under consideration.
A comparison of vegetation index value ranges for HS, grass, and trees demonstrated a high degree of overlap between most of these ranges. This was observed for indices such as NDRE, GNDVI, GBNDVI, and CIG. Two indices and a spectral channel exhibited values that were outside the standard deviation range. These were EVI, CIRE, and green, respectively. The ranges of values of vegetation indices MCARI and BS1 are more effective at differentiation between HS, grass cover, and trees (Figure 9). An increase in the index value indicates an elevated concentration of chlorophyll a and b in the plant leaves. It can be concluded that the higher the values of the custom BS1 index, the greater the probability that an object belongs to HS.
Based on the obtained ranges, the minimum values characterizing the HS plants were revealed: G > 0.14; MCARI > 0.76; and BS1 > 0.10. For grass cover, the minimum values were 0.02 < G < 0.13; 0.49 < MCARI < 1.08; and 0.08 < BS1 < 0.18; for trees, the minimum values were 0.06 < G < 0.12; 0.55 < MCARI < 1.05; and 0.06 < BS1 < 0.10. To illustrate these values, the green spectral channel (Figure 9) may be considered. The values of the spectral channel in the range of mean values for HS are as follows: the minimum value is 0.105, the mean value is 0.139, and the maximum value is 0.184. For the grass, the minimum value was 0.049, the mean was 0.062, and the maximum was 0.081. For trees, the minimum value was 0.07, the mean was 0.085, and the maximum was 0.109. It can be observed that the minimum value of HS overlaps with the maximum value of trees, but it is in the minimum range relative to other indices. Therefore, the mean value of 0.139 was chosen, which was rounded to 0.14. The values of the vegetation index NDVI were accepted at the level of 0.3. Values less than 0.3 are indicative of plant and natural objects that are either underdeveloped or in a state of decline, as well as human-made objects.
Using the developed algorithm, 146 sites with a total area of 304.63 ha were mapped over three years. HS was detected in an area of 146.66 ha, which corresponds to 48.14% of the study area. The identified sites were handed over to the relevant organizations for further eradication of the weed before the seeds fell off.

4. Discussion

The use of UAVs for mapping invasive plants offers several advantages [62,63,64]. UAVs can quickly fly over urban districts and regions, collecting high-resolution images. Such images provide higher accuracy for HS identification than traditional ground surveys or satellite data. UAV data help to plan a strategy to control the HS. The proposed method will make it possible to solve problems in identifying and eradicating HS outbreaks, as well as to control the growing areas in the regions of the Russian Federation.
The studied area of the HS was located near roads, and arable land, as well as on the borders of forests and in deep and steeply sloping undrained hollows formed by temporary watercourses. Individual HS plants grow near roads, various buildings, and arable land borders where the area is not well maintained, which allows the plants to disperse. It should be noted that the developed method can also be used to detect isolated HS plants that are located under the crowns of trees, provided that the aerial photography was carried out with proper overlap and the HS plants were captured in the frame.
The use of aerial photography during the period of bright green leaves and flowering of HS, with the installation of cameras operating in both visible and spectral ranges, enabled the creation of highly accurate maps of HS distribution. This, in turn, facilitated the planning of the optimal volume of pesticides for its eradication. The technological process of HS recognition typically comprises four stages: (1) aerial photography; (2) data conversion and preparation; (3) data processing; and (4) delineation of HS plants. It is important to highlight the distinctive characteristics of the operations conducted at each stage.
In the initial stages, the UAV needs to be prepared, and this takes quite a lot of time. The preparation consists of mounting a multispectral camera on the UAV using a special suspension. The UAVs are equipped with two cameras that enable the capture of images in both visible and spectral bands within a single flight. The sensors of the UAV and the multispectral camera are then set up and calibrated. The absence of a specialized software solution for these operations results in the necessity for repeated flights and an increase in the time required for the verification of aerial survey data. In this regard, the use of optimal image settings for cameras and parameter values for flight operations allowed us to significantly reduce the time for pre-flight preparation of the UAV and collect reliable data.
The high-precision GNSS receiver installed on the UAV allowed it to fly without ground control points, reducing the time for pre-flight preparation [65]. Data preparation and post-processing in Topodrone PPK Post Processing software reduced the time required to prepare data for further photogrammetric processing and created highly accurate maps with an accuracy of up to 5 cm in plan and height.
The main task of the HS recognition workflow was to analyze orthophoto, spectral, and vegetation maps, which are created in Agisoft Metashape and Pix4DFields software. We tried to use the maximum capabilities of these programs to avoid using third-party programs and to reduce processing and analysis time. A program was written to automate the entry of ground control point coordinates in Agisoft Metashape and Pix4DFields.
The developed algorithm provided an efficient method for detecting and mapping the growing areas of HS plants. It is noteworthy that the algorithm effectively identified almost all growing areas, even those that occur in small sites that are difficult to detect from RGB data in the form of aerial or satellite images. Methods aimed at detecting HS from RGB data with UAVs consist of dividing RGB into channels and classifying HS plants at the flowering stage. Such approaches are not effective for the detection of individual and small HS plants, as well as for detection at other vegetation stages, and need to be adapted [38].
The use of multispectral data makes it easier to identify the locations of HS based on its spectral characteristics [14], which is more accurate than analyzing only RGB data [38]. Satellite data [18] cannot always be used due to high cloud cover. The analysis of satellite images with a spatial resolution of 1–30 m does not allow for the identification of small plant clusters and single plants in the early stages of vegetation. Real-time HS plant detection [25] is an effective method when working with a weed eradication team but is not optimal for planning and allocating resources on a regional scale. Therefore, the application of the developed method using high-resolution multispectral data from UAVs will facilitate the detection of both HS plant clusters and individual plants.
The developed method uses three vegetation indices (NDVI, MCARI, BS1) and the green channel to detect HS. The NDVI is a method of identifying and removing non-vegetation objects from an image. The NDVI index demonstrated consistent performance in terms of overall efficiency and the ability to remove non-vegetative objects. A similar threshold was used to identify non-vegetation areas in studies [66,67]. In addition, the NDVI index should not be considered a mandatory step in the implementation of the developed algorithm.
The NDVI is employed in locations where grass and a multitude of non-vegetation objects coexist, such as in proximity to playgrounds. In the absence of NDVI data, it is inadvisable to utilize the green channel. The green channel serves to accentuate the degree of reflection exhibited by green objects. In the case of non-plant objects of green color, an error in classification will result.
The BS1 index is an effective tool for accurately identifying sites with trees and tall shrubs on maps with high spatial resolution (GSD < 10 cm/pix). High-resolution digital maps of invasive plant surveys have also been used in research [24,68,69]. Refinement of results at sites with mixed grasses is needed. In areas where HS, low shrubs, Angélica, Angélica archangélica, Arctium lapper, and other herbs with high photosynthetic activity are present, the BS1 index may not accurately identify HS plants. It has been demonstrated that under such conditions, the BS1 index is unable to distinguish between plant objects with similar spectral signatures, leading to the misclassification of HS.
The MCARI index is responsive to changes in chlorophyll a and b concentrations within plant leaves [70,71,72,73]. Consequently, elevated levels of photosynthetic activity are reflected in higher index values. During the period of bright green BS leaves, such photosynthetic activity is difficult to detect on other plant biological objects except trees and tall shrubs. During the flowering period of HS, comparable photosynthetic activity can be observed in certain crops. For instance, winter wheat in central Russia attains its maximum vegetation index values in mid-June. When analyzing sites in the vicinity of agricultural fields, it is important to consider the crops that are present and the specific vegetation phase that they are in. It is necessary to ensure the highest level of accuracy in the detection of HS plants. In light of the aforementioned limitations of the indices and the green channel, it is imperative to utilize them in conjunction with one another, which is contingent upon the specific sites under investigation and the developmental phase of HS plants.
The method has yet to be applied in other regions of HS growth. It seems reasonable to posit that this approach will prove effective in regions exhibiting comparable natural and climatic conditions. It is essential to further define the ranges of the green spectral channel and the vegetation indices. The effectiveness of HS detection may be enhanced by the utilization of artificial intelligence technologies.
The results obtained are significant in that the utilization of RGB and multispectral cameras mounted on UAVs reduces the time required and enhances the precision of identifying the locations of HS plants. This approach allows for the implementation of differentiated methods of pesticide application for the eradication of harmful plants, which reduces the economic costs associated with pesticide acquisition as well as mitigates the issue of littering and environmental contamination with hazardous substances. It is significant to reduce the quantity of used pesticides in urban areas, in proximity to agricultural fields, and in regions where endemic species of plants and animals are present. Regular monitoring facilitates the tracking of HS spread over time, enabling the prompt implementation of preventive measures.

5. Conclusions

The proliferation of HS plants represents a significant threat to the region’s ecological balance and stability. The proliferation of HS has the potential to impoverish the vegetation species composition, which could ultimately threaten the preservation of endangered species of plants and animals. Furthermore, the presence of HS poses a significant risk to the human health and economic well-being of the region. The use of UAVs becomes an active support in the fight against the spread of HS.
The timely detection of HS at the earliest stages of its development is crucial for the effective and rapid eradication of the plant. The utilization of UAV and mounted optical equipment, such as RGB and multispectral cameras, enables the detection of both extensive clusters and individual plants of HS. The developed algorithm is based on the analysis of multispectral data on the development of HS at the initial stages of vegetation in the Moscow region of the Russian Federation between 2020 and 2022. Using the algorithm, it is possible to distinguish HS plants from trees and grass cover.
Using this method, 146 sites with a total area of 304.631 ha were mapped; HS was detected in 48.14% of the study area. The obtained georeferenced contours of HS growth were transferred to the appropriate services for subsequent eradication by differential spraying.
It is advisable to use the algorithm in the central region of the Russian Federation during May-July to map both clusters of HS plants and individual plants.

Author Contributions

Conceptualization, R.K.K., A.S.D. and N.I.Z.; data curation, R.K.K., N.Y.R. and A.M.A.; formal analysis, R.K.K., A.S.D., N.I.Z. and M.A.L.; funding acquisition, N.Y.R. and D.E.K.; investigation, N.Y.R. and D.E.K.; methodology, R.K.K., A.N.D., A.S.D., M.A.L. and A.M.A.; resources, R.K.K.; software, A.N.D., N.I.Z. and M.A.L.; supervision, R.K.K.; validation, A.N.D., N.I.Z., M.A.L. and A.M.A.; visualization, D.E.K.; writing—original draft, A.S.D. and N.I.Z.; writing—review and editing, N.I.Z., D.E.K. and A.M.A. All authors have read and agreed to the published version of the manuscript.

Funding

This research received no external funding.

Data Availability Statement

The original contributions presented in the study are included in the article; further inquiries can be directed to the corresponding author.

Acknowledgments

The authors would like to thank the Federal Scientific Agroengineering Center VIM for funding the field survey and remote sensing work. This research is also supported by the RUDN University Scientific Projects Grant System, project No. <202724-2-000> (Kucher D.E.), the RUDN University Strategic Academic Leadership Program. The authors would like to extend their sincere appreciation to the National Authority of Remote Sensing and Space Science (NARSS), Cairo, Egypt.

Conflicts of Interest

The authors declare no conflicts of interest.

References

  1. Abramova, L.M.; Golovanov, Y.M.; Rogozhnikova, D.R. Sosnowsky’s Hogweed (Heracleum sosnowskyi Manden., Apiaceae) in Bashkortostan. Russ. J. Biol. Invasions 2021, 12, 127–135. [Google Scholar] [CrossRef]
  2. Bogdanov, V.; Osipov, A.; Garmanov, V.; Efimova, G.; Grik, A.; Zavarin, B.; Terleev, V.; Nikonorov, A. Problems and monitoring the spread of the ecologically dangerous plant Heracleum sosnowskyi in urbanized areas and methods to combat it. E3S Web Conf. 2021, 258, 08028. [Google Scholar] [CrossRef]
  3. Lobachevskiy, Y.P.; Beylis, V.M.; Tsench, Y.S. Digitization aspects of the system of technologies and machines. Elektrotekhnologii I Elektrooborud. V APK 2019, N3, 40–45. [Google Scholar]
  4. Mazitov, N.K.; Shogenov, Y.K.; Tsench, Y.S. Agricultural machinery: Solutions and prospects. Vestn. Viesh. 2018, N3, 94–100. [Google Scholar]
  5. Tsench, Y.; Maslov, G.; Trubilin, E. To the history of agricultural machinery development. Vestn. Bsau. 2018, 3, 117–123. [Google Scholar] [CrossRef]
  6. Lobachevskiy, Y.P.; Tsench, Y.S.; Beylis, V.M. Creation and development of systems for machines and technologies for the complex mechanization of technological processes in crop production. Hist. Sci. Eng. 2019, 12, 46–55. [Google Scholar]
  7. Grygus, I.; Lyko, S.; Stasiuk, M.; Zubkovych, I.; Zukow, W. Risks posed by Heracleum sosnowskyi Manden in the Rivne region. Ecol. Quest. 2018, 29, 35–42. [Google Scholar]
  8. Grzedzicka, E. Invasion of the giant hogweed and the Sosnowsky’s Hogweed as a multidisciplinary problem with unknown future—A review. Earth 2022, 3, 287–312. [Google Scholar] [CrossRef]
  9. Chadin, I.; Dalke, I.; Zakhozhiy, I.; Malyshev, R.; Madi, E.; Kuzivanova, O.; Kirillov, D.; Elsakov, V. Distribution of the invasive plant species Heracleum sosnowskyi Manden. in the Komi Republic (Russia). PhytoKeys 2017, 77, 71–80. [Google Scholar] [CrossRef]
  10. Kondrat’ev, M.N.; Budarin, S.N.; Larikova, Y.S. Physiological and ecological mechanisms of invasive penetration of Sosnowskyi hogweed (Heracleum sosnowskyi Manden.) in unexploitable agroecosystems. Izv. Timiryazev Agric. Acad. 2015, 2, 36–49. [Google Scholar]
  11. Sitzia, T.; Campagnaro, T.; Kowarik, I.; Trentanovi, G. Using forest management to control invasive alien species: Helping implement the new European regulation on invasive alien species. Biol. Invasions 2016, 18, 1–7. [Google Scholar] [CrossRef]
  12. Lozano, V.; Marzialetti, F.; Carranza, M.L.; Chapman, D.; Branquart, E.; Dološ, K.; Große-Stoltenberg, A.; Fiori, M.; Capece, P.; Brundu, G. Modelling Acacia saligna invasion in a large Mediterranean island using PAB factors: A tool for implementing the European legislation on invasive species. Ecol. Indic. 2020, 116, 106516. [Google Scholar] [CrossRef]
  13. Chmielewski, J.; Pobereżny, J.; Florek-Łuszczki, M.; Żeber-Dzikowska, I.; Szpringer, M. Sosnowsky’s hogweed—Current environmental problem. Environ. Prot. Nat. Resour. 2017, 28, 40–44. [Google Scholar] [CrossRef]
  14. Ryzhikov, D.M. Heracleum sosnowskyi growth area control by multispectral satellite data. Inf. Control. Syst. 2017, 6, 43–51. [Google Scholar] [CrossRef]
  15. Duncan, P.; Podest, E.; Esler, K.J.; Geerts, S.; Lyons, C. Mapping invasive Herbaceous plant species with Sentinel-2 satellite imagery: Echium plantagineum in a Mediterranean shrubland as a case study. Geomatics 2023, 3, 328–344. [Google Scholar] [CrossRef]
  16. Newete, S.W.; Mayonde, S.; Kekana, T.; Adam, E. A rapid and accurate method of mapping invasive Tamarix genotypes using Sentinel-2 images. PeerJ 2023, 11, e15027. [Google Scholar] [CrossRef] [PubMed]
  17. Duarte, L.; Castro, J.P.; Sousa, J.J.; Pádua, L. GIS application to detect invasive species in aquatic ecosystems. In Proceedings of the IGARSS 2022—2022 IEEE International Geoscience and Remote Sensing Symposium, Kuala Lumpur, Malaysia, 17–22 July 2022; pp. 6013–6018. [Google Scholar] [CrossRef]
  18. Grigoriev, A.N.; Ryzhikov, D.M. General methodology and results of spectroradiometric research of reflective properties of the Heracleum sosnowskyi in the range 320–1100 nm for Earth remote sensing. Mod. Probl. Remote Sens. Space 2018, 15, 43–51. [Google Scholar] [CrossRef]
  19. Lachuga, Y.F.; Izmaylov, A.Y.; Lobachevsky, Y.P.; Shogenov, Y.K. The results of scientific research of agro-engineering scientific organizations on the development of digital systems in agriculture. Mach. Equip. Rural. Area 2022, 4, 2–6. [Google Scholar] [CrossRef]
  20. Alvarez-Taboada, F.; Paredes, C.; Julián-Pelaz, J. Mapping of the invasive Species Hakea sericea using unmanned aerial vehicle (UAV) and WorldView-2 imagery and an object-oriented approach. Remote Sens. 2017, 9, 913. [Google Scholar] [CrossRef]
  21. Wang, X.; Wang, L.; Tian, J.; Shi, C. Object-based spectral-phenological features for mapping invasive Spartina alterniflora. Int. J. Appl. Earth Obs. Geoinf. 2021, 101, 102349. [Google Scholar] [CrossRef]
  22. Nowak, M.M.; Dziób, K.; Bogawski, P. Unmanned aerial vehicles (UAVs) in environmental biology: A review. Eur. J. Ecol. 2018, 4, 56–74. [Google Scholar] [CrossRef]
  23. Michez, A.; Piégay, H.; Jonathan, L.; Claessens, H.; Lejeune, P. Mapping of riparian invasive species with supervised classification of unmanned aerials system (UAS) imagery. Int. J. Appl. Earth Obs. Geoinf. 2016, 44, 88–94. [Google Scholar] [CrossRef]
  24. Müllerová, J.; Brůna, J.; Bartaloš, T.; Dvořák, P.; Vítková, M.; Pyšek, P. Timing is important: Unmanned aircraft vs. satellite imagery in plant invasion monitoring. Front. Plant Sci. 2017, 8, 887. [Google Scholar] [CrossRef]
  25. Menshchikov, A.; Shadrin, D.; Prutyanov, V.; Lopatkin, D.; Sosnin, S.; Tsykunov, E.; Iakovlev, E.; Iakovlev, E.; Somov, A. Real-time detection of hogweed: UAV platform empowered by deep learning. IEEE Trans. Comput. 2021, 70, 1175–1188. [Google Scholar] [CrossRef]
  26. Koshelev, I.; Savinov, M.; Menshchikov, A.; Somov, A. Drone-aided detection of weeds: Transfer learning for embedded image processing. IEEE J. Sel. Top. Appl. Earth Obs. Remote Sens. 2023, 16, 102–111. [Google Scholar] [CrossRef]
  27. Müllerová, J.; Bartaloš, T.; Brůna, J.; Dvořák, P.; Vítková, M. Unmanned aircraft in nature conservation: An example from plant invasions. Int. J. Remote Sens. 2017, 38, 2177–2198. [Google Scholar] [CrossRef]
  28. Imanni, H.S.E.; Harti, A.E.; Bachaoui, E.M.; Mouncif, H.; Eddassouqui, F.; Hasnai, M.A.; Zinelabidine, M.I. Multispectral UAV data for detection of weeds in a citrus farm using machine learning and Google Earth Engine: Case study of Morocco. Remote Sens. Appl. Soc. Environ. 2023, 30, 100941. [Google Scholar] [CrossRef]
  29. Rosle, R.; Sulaiman, N.; Che′Ya, N.N.; Radzi, M.F.M.; Omar, M.H.; Berahim, Z.; Ilahi, W.F.F.; Shah, J.A.; Ismail, M.R. Weed detection in rice fields using UAV and multispectral aerial imagery. Chem. Proc. 2022, 10, 44. [Google Scholar] [CrossRef]
  30. Kawamura, K.; Asai, H.; Yasuda, T.; Soisouvanh, P.; Phongchanmixay, S. Discriminating crops/weeds in an upland rice field from UAV images with the SLIC-RF algorithm. Plant Prod. Sci. 2020, 24, 198–215. [Google Scholar] [CrossRef]
  31. Osorio, K.; Puerto, A.; Pedraza, C.; Jamaica, D.; Rodríguez, L. A deep learning approach for weed detection in lettuce crops using multispectral images. AgriEngineering 2020, 2, 471–488. [Google Scholar] [CrossRef]
  32. Dos Santos Ferreira, A.; Freitas, D.M.; da Silva, G.G.; Pistori, H.; Folhes, M.T. Weed detection in soybean crops using ConvNets. Comput. Electron. Agric. 2017, 143, 314–324. [Google Scholar] [CrossRef]
  33. Su, J.; Yi, D.; Coombes, M.; Liu, C.; Zhai, X.; McDonald-Maier, K.; Chen, W.H. Spectral analysis and mapping of blackgrass weed by leveraging machine learning and UAV multispectral imagery. Comput. Electron. Agric. 2022, 192, 106621. [Google Scholar] [CrossRef]
  34. Oldeland, J.; Große-Stoltenberg, A.; Naftal, L.; Strohbach, B.J. The potential of UAV derived image features for discriminating savannah tree species. In The Roles of Remote Sensing in Nature Conservation; Díaz-Delgado, R., Lucas, R., Hurford, C., Eds.; Springer: Cham, Switzerland, 2017; pp. 183–202. [Google Scholar] [CrossRef]
  35. Lopatin, J.; Dolos, K.; Kattenborn, T.; Fassnacht, F.E. How canopy shadow affects invasive plant species classification in high spatial resolution remote sensing. Remote Sens. Ecol. Conserv. 2019, 5, 302–317. [Google Scholar] [CrossRef]
  36. De Sá, N.C.; Castro, P.; Carvalho, S.; Marchante, E.; López-Núñez, F.A.; Marchante, H. Mapping the flowering of an invasive plant using Unmanned Aerial Vehicles: Is there potential for biocontrol monitoring? Front. Plant Sci. 2018, 9, 1–13. [Google Scholar] [CrossRef]
  37. Kattenborn, T.; Lopatin, J.; Förster, M.; Braun, A.C.; Fassnacht, F.E. UAV data as alternative to field sampling to map woody invasive species based on combined Sentinel-1 and Sentinel-2 data. Remote Sens. Environ. 2019, 227, 61–73. [Google Scholar] [CrossRef]
  38. Savin, I.Y.; Andronov, D.P.; Shishkonakova, E.A.; Vernyuk, Y.I. Detecting Sosnowskyi’s Hogweed (Heracleum sosnowskyi Manden.) using UAV survey data. Russ. Agric. Sci. 2021, 47, S90–S96. [Google Scholar] [CrossRef]
  39. Barbedo, J.G.A. A review on the use of unmanned aerial vehicles and imaging sensors for monitoring and assessing plant stresses. Drones 2019, 3, 40. [Google Scholar] [CrossRef]
  40. Hafeez, A.; Husain, M.A.; Singh, S.; Chauhan, A.; Khan, M.T.; Kumar, N.; Chauhan, A.; Soni, S. Implementation of drone technology for farm monitoring & pesticide spraying: A review. Inf. Process. Agric. 2022, 10, 192–203. [Google Scholar] [CrossRef]
  41. Bzdęga, K.; Zarychta, A.; Urbisz, A.; Szporak-Wasilewska, S.; Ludynia, M.; Fojcik, B.; Tokarska-Guzik, B. Geostatistical models with the use of hyperspectral data and seasonal variation—A new approach for evaluating the risk posed by invasive plants. Ecol. Indic. 2021, 121, 107204. [Google Scholar] [CrossRef]
  42. Vaz, A.S.; Alcaraz-Segura, D.; Campos, J.C.; Vicente, J.R.; Honrado, J.P. Managing plant invasions through the lens of remote sensing: A review of progress and the way forward. Sci. Total Environ. 2018, 642, 1328–1339. [Google Scholar] [CrossRef]
  43. Müllerová, J.; Pergl, J.; Pyšek, P. Remote sensing as a tool for monitoring plant invasions: Testing the effects of data resolution and image classification approach on the detection of a model plant species Heracleum mantegazzianum (giant hogweed). Int. J. Appl. Earth Obs. Geoinf. 2013, 25, 55–65. [Google Scholar] [CrossRef]
  44. Niphadkar, M.; Nagendra, H. Remote sensing of invasive plants: Incorporating functional traits into the picture. Int. J. Remote Sens. 2016, 37, 3074–3085. [Google Scholar] [CrossRef]
  45. Royimani, L.; Mutanga, O.; Odindi, J.; Dube, T.; Matongera, T.N. Advancements in satellite remote sensing for mapping and monitoring of alien invasive plant species (AIPs). Phys. Chem. Earth Parts A/B/C 2019, 112, 237–245. [Google Scholar] [CrossRef]
  46. Kurbanov, R.K.; Zakharova, N.I. Justifying the parameters for an unmanned aircraft flight mission of multispectral aerial photography. Agric. Mach. Technol. 2022, 16, 33–39. [Google Scholar] [CrossRef]
  47. Kurbanov, R.K.; Zakharova, N.I.; Gorshkov, D.M. Improving the accuracy of aerial photography using ground control points. Agric. Mach. Technol. 2021, 15, 42–47. [Google Scholar] [CrossRef]
  48. Ryzhikov, D.M. Control of Sosnowsky’s Hogweed Growth Zones Based on Spectral Characteristics of Reflected Waves Optical Range. Ph.D. Thesis, Saint-Petersburg State University of Aerospace Instrumentation, St. Petersburg, Russia, 2019; 221p. [Google Scholar]
  49. Solymosi, K.; Kövér, G.; Romvári, R. The development of vegetation indices: A short overview. ACTA Agrar. Kaposváriensis 2019, 23, 75–90. [Google Scholar] [CrossRef]
  50. Xue, J.; Su, B. Significant remote sensing vegetation indices: A review of developments and applications. J. Sens. 2017, 2017, 1353691. [Google Scholar] [CrossRef]
  51. Rouse, J.W.; Haas, R.H., Jr.; Schell, J.A.; Deering, D.W. Monitoring vegetation systems in the great plains with ERTS. NASA Spec. Publ. 1974, 351, 309–317. [Google Scholar]
  52. Cammarano, D.; Fitzgerald, G.; Basso, B.; O’Leary, G.; Chen, D.; Grace, P.; Costanza, F. Use of the canopy chlorophyl content index (CCCI) for remote estimation of wheat nitrogen content in rainfed environments. Agron. J. 2011, 103, 1597–1603. [Google Scholar] [CrossRef]
  53. Mulla, D.J. Twenty-five years of remote sensing in precision agriculture: Key advances and remaining knowledge gaps. Biosyst. Eng. Spec. Issue Sens. Technol. Sustain. Agric. 2014, 114, 358–371. [Google Scholar] [CrossRef]
  54. Wang, F.M.; Huang, J.F.; Tang, Y.L.; Wang, X.Z. New vegetation index and its application in estimating leaf area index of rice. Rice Sci. 2007, 14, 195–203. [Google Scholar] [CrossRef]
  55. Strong, C.J.; Burnside, N.G.; Llewellyn, D. The potential of small-unmanned aircraft systems for the rapid detection of threatened unimproved grassland communities using an Enhanced normalized difference vegetation index. PLoS ONE 2017, 12, e0186193. [Google Scholar] [CrossRef]
  56. Kang, Y.; Nam, J.; Kim, Y.; Lee, S.; Seong, D.; Jang, S.; Ryu, C. Assessment of regression models for predicting rice yield and protein content using unmanned aerial vehicle-based multispectral imagery. Remote Sens. 2021, 13, 1508. [Google Scholar] [CrossRef]
  57. Clemente, A.A.; Maciel, G.M.; Siquieroli, A.C.; de Araujo Gallis, R.B.; Pereira, L.M.; Duarte, J.G. High-throughput phenotyping to detect anthocyanins, chlorophylls, and carotenoids in red lettuce germplasm. Int. J. Appl. Earth Obs. Geoinf. 2021, 103, 102533. [Google Scholar] [CrossRef]
  58. Rumora, L.; Majić, I.; Miler, M.; Medak, D. Spatial video remote sensing for urban vegetation mapping using vegetation indices. Urban Ecosyst. 2021, 24, 21–33. [Google Scholar] [CrossRef]
  59. Morales-Gallegos, L.M.; Martínez-Trinidad, T.; Hernández-de la Rosa, P.; Gómez-Guerrero, A.; Alvarado-Rosales, D.; Saavedra-Romero, L.L. Tree health condition in urban green areas assessed through crown indicators and vegetation indices. Forests 2023, 14, 1673. [Google Scholar] [CrossRef]
  60. Weinstein, B.G.; Marconi, S.; Aubry-Kientz, M.; Vincent, G.; Senyondo, H.; White, E.P. DeepForest: A Python package for RGB deep learning tree crown delineation. Methods Ecol. Evol. 2020, 11, 1743–1751. [Google Scholar] [CrossRef]
  61. Weinstein, B.G.; Marconi, S.; Bohlman, S.; Zare, A.; White, E. Individual tree-crown detection in RGB imagery using semi-supervised deep learning neural networks. Remote Sens. 2019, 11, 1309. [Google Scholar] [CrossRef]
  62. Ghassemian, H. A review of remote sensing image fusion methods. Inf. Fusion 2016, 32, 75–89. [Google Scholar] [CrossRef]
  63. Marzialetti, F.; Frate, L.; De Simone, W.; Frattaroli, A.R.; Acosta, A.T.R.; Carranza, M.L. Unmanned aerial vehicle (UAV)-based mapping of Acacia saligna invasion in the Mediterranean coast. Remote Sens. 2021, 13, 3361. [Google Scholar] [CrossRef]
  64. Hill, D.J.; Tarasoff, C.; Whitworth, G.E.; Baron, J.; Bradshaw, J.L.; Church, J.S. Utility of unmanned aerial vehicles for mapping invasive plant species: A case study on yellow flag iris (Iris pseudacorus L.). Int. J. Remote Sens. 2017, 38, 2083–2105. [Google Scholar] [CrossRef]
  65. Türk, T.; Tunalioglu, N.; Erdogan, B.; Ocalan, T.; Gurturk, M. Accuracy assessment of UAV-post-processing kinematic (PPK) and UAV-traditional (with ground control points) georeferencing methods. Environ. Monit. Assess. 2022, 194, 476. [Google Scholar] [CrossRef] [PubMed]
  66. Vinci, A.; Brigante, R.; Traini, C.; Farinelli, D. Geometrical characterization of hazelnut trees in an intensive orchard by an unmanned aerial vehicle (UAV) for precision agriculture applications. Remote Sens. 2023, 15, 541. [Google Scholar] [CrossRef]
  67. Demir, S.; Dursun, I. Determining burned areas using different threshold values of NDVI with Sentinel-2 satellite images on gee platform: A case study of Muğla province. Int. J. Sustain. Eng. Technol. 2023, 2, 117–130. [Google Scholar]
  68. Xing, F.; An, R.; Guo, X.; Shen, X. Mapping invasive noxious weed species in the alpine grassland ecosystems using very high spatial resolution UAV hyperspectral imagery and a novel deep learning model. GIScience Remote Sens. 2023, 61, 2327146. [Google Scholar] [CrossRef]
  69. Wijesingha, J.; Astor, T.; Schulze-Brüninghoff, D.; Wachendorf, M. Mapping invasive Lupinus polyphyllus Lindl. In semi-natural grasslands using object-based image analysis of UAV-borne images. J. Photogramm. Remote Sens. Geoinf. Sci. 2020, 88, 391–406. [Google Scholar] [CrossRef]
  70. Daughtry, C.; Walthall, C.L.; Kim, M.S.; Brown de Colstoun, E.; McMurtrey, J.E., III. Estimating corn leaf chlorophyll concentration from leaf and canopy reflectance. Remote Sens. Environ. 2000, 74, 229–239. [Google Scholar] [CrossRef]
  71. Xu, S.; Xu, X.; Blacker, C.; Gaulton, R.; Zhu, Q.; Yang, M.; Yang, G.; Zhang, J.; Yang, Y.; Yang, M.; et al. Estimation of leaf nitrogen content in rice using vegetation indices and feature variable optimization with information fusion of multiple-sensor images from UAV. Remote Sens. 2023, 15, 854. [Google Scholar] [CrossRef]
  72. Shanmugapriya, P.; Latha, K.R.; Pazhanivelan, S.; Kumaraperumal, R.; Karthikeyan, G.; Sudarmanian, N.S. Cotton yield prediction using drone-derived LAI and chlorophyll content. J. Agrometeorol. 2022, 24, 348–352. [Google Scholar] [CrossRef]
  73. Parida, P.K.; Somasundaram, E.; Krishnan, R.; Radhamani, S.; Sivakumar, U.; Parameswari, E.; Raja, R.; Shri Rangasami, S.R.; Sangeetha, S.P.; Gangai Selvi, R. Unmanned aerial vehicle-measured multispectral vegetation indices for predicting LAI, SPAD chlorophyll, and yield of maize. Agriculture 2024, 14, 1110. [Google Scholar] [CrossRef]
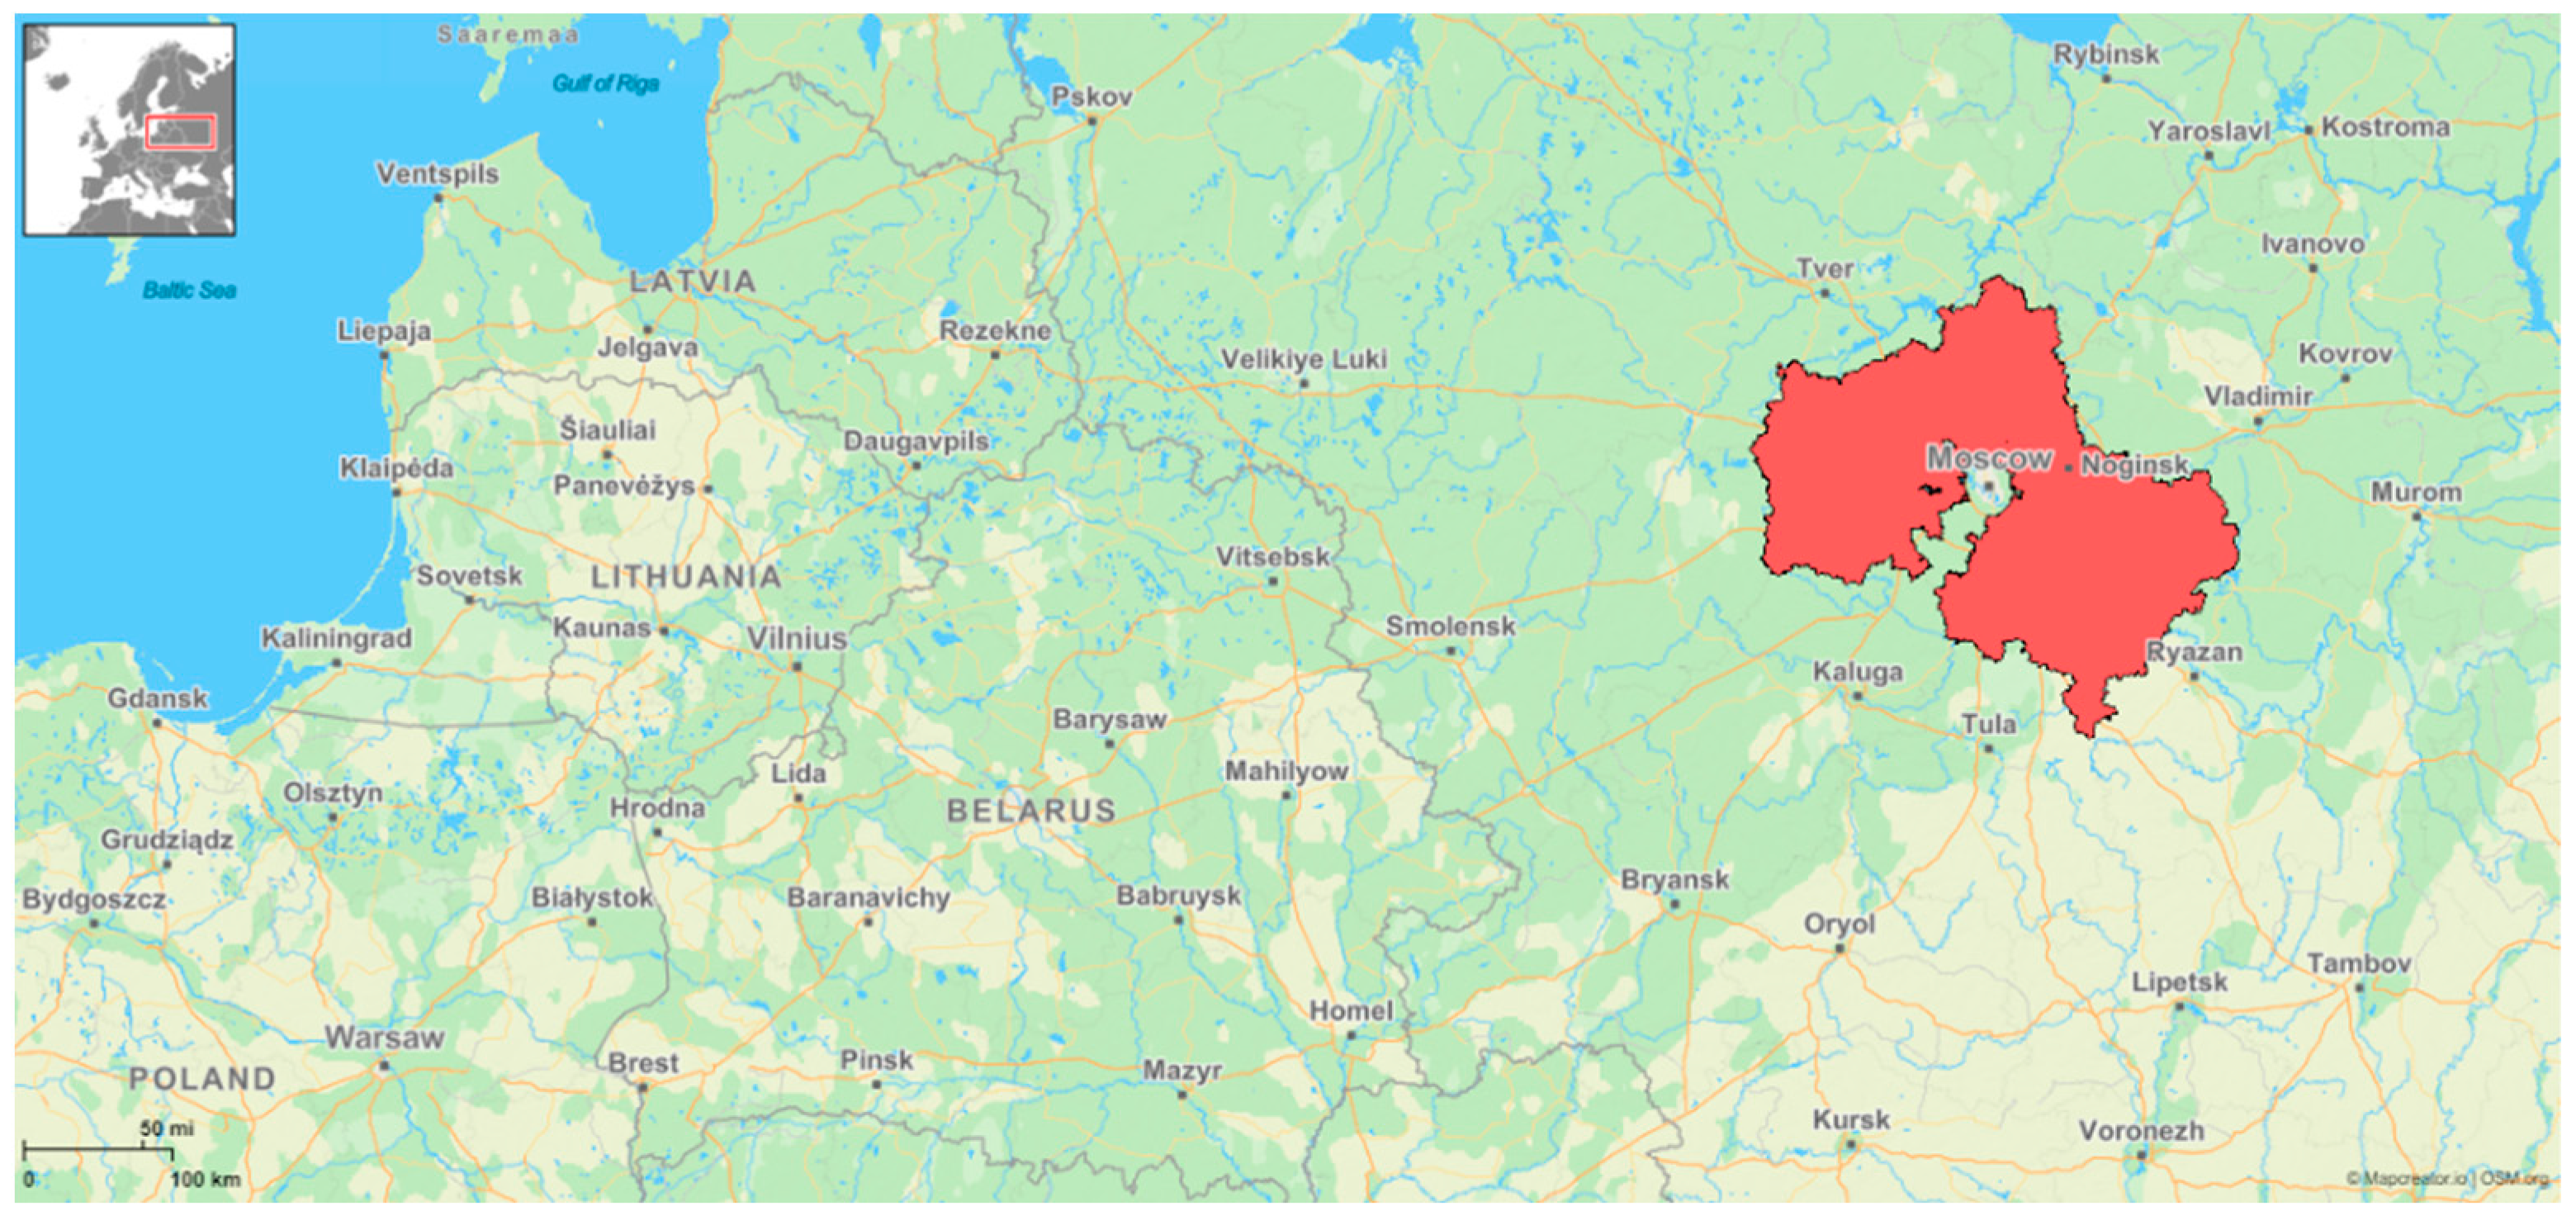
Figure 1. Study area. Moscow region is highlighted in red.
Agronomy 14 02451 g001
Figure 2. UAV DJI Matrice 200 v2 with a GNSS receiver Topodrone PPK.
Agronomy 14 02451 g002
Figure 3. Additional equipment: (1) GNSS Emlid Reach RS2; (2) ground control point; (3) calibration panel for multispectral camera; and (4) MicaSense Altum multispectral camera.
Agronomy 14 02451 g003
Figure 4. File structure of data storage folders.
Agronomy 14 02451 g004
Figure 5. The studied samples: (a) Sosnowsky’s hogweed; (b) grass; (c) trees.
Agronomy 14 02451 g005
Figure 6. Algorithm for identification of HS plants on digital maps with UAVs.
Agronomy 14 02451 g006
Figure 7. Display of HS thickets: (a) a custom BS1 index with values above 0.11; (b) an orthophoto, with HS marked in red; (c) the highlighting of single HS plants by the MCARI index; and (d) the highlighting of single HS plants by the spectral channel green.
Agronomy 14 02451 g007
Figure 8. Spectral characteristics of Sosnowsky’s hogweed, trees, and grass.
Agronomy 14 02451 g008
Figure 9. Comparison of vegetation indices values.
Agronomy 14 02451 g009
Table 1. Characteristics of the sites under study.
Sites Larger Than 10 haSites Larger Than 5 haSites Larger Than 1 haSites Less Than 1 haIn Total
Number of sites, pcs.7830101146
Total area, ha153.8649.9865.9735.19304.63
Table 2. Acquisition dates of UAVs.
Date12 May–12 June 20204 July 202126 June 2022Total
Area, ha207.1745.3552.48305
Number of sites, pcs.14411146
Number of flights, pcs.15055160
RGB data, Gb31.8012.9015.1059.8
Multispectral data, Gb236.1103115.6454.7
Location55°24′54.4″ N 37°14′2″ E 56°5′18.7″ N 37°54′48.9″ E
Table 3. UAV spectral bands and derived vegetation indices.
Vegetation Index/Spectral ChannelRange/FormulaSource
Blue (B)p475 ± 32 nmMicaSense Knowledge Base
https://support.micasense.com/hc/en-us/articles/360010025413-Altum-Integration-Guide (accessed on 2 April 2020)
Green (G)p560 ± 27 nm
Red Ip668 ± 16 nm
Red Edge (RE)p717 ± 12 nm
Near-Infrared (NIR)p842 ± 57 nm
NDVI N I R R N I R + R Rouse et al. (1974) [51]
NDRE N I R R E N I R + R E Cammarano et al. (2011) [52]
MCARI [ R E R 0.2 R E G ] R E R Mulla (2014) [53]
GNDVI N I R G N I R + G Mulla (2014) [53]
GBNDVI N I R ( G + B ) N I R + ( G + B ) Fu-min et al. (2007) [54]
EVI 2.5 ( N I R R ) N I R + 6 R 7.5 B ) + 1 Mulla (2014) [53]
ENDVI N I R + G 2 B N I R + G + 2 B Strong et al. (2017) [55]
CIRedEdge (CIRE) N I R R E 1 Kang et al. (2021) [56]
CIGreen (CIG) N I R G 1 Clemente et al. (2021) [57]
CI R B R Index DataBase
https://www.indexdatabase.de/db/i-single.php?id=11 (accessed on 4 April 2020)
BWDRVI 0.1 N I R B 0.1 N I R + B Rumora et al. (2021) [58]
BNDVI N I R B N I R + B Morales-Gallegos et al. (2023) [59]
BS1 G B N I R Custom Index
Table 4. Student’s t-test values (between Sosnowsky’s hogweed, trees, and grass).
NDVIBGRRENIR
t HS vs. GR1.242.75 **9.76 ***4.59 ***9.98 ***6.53 ***
t HS vs. TR3.98 ***6.90 ***8.69 ***7.49 ***10.91 ***7.43 ***
t GR vs. TR2.11 *1.823.20 **1.440.840.63
NDREMCARIGNDVIGBNDVIEVIENDVI
t HS vs. GR5.72 ***7.93 ***5.75 ***4.37 ***6.07 ***0.28
t HS vs. TR7.06 ***7.95 ***6.10 ***5.71 ***6.05 ***2.66 **
t GR vs. TR1.920.390.871.280.292.41 *
CIRECIGCIBWDRVIBNDVIBS1
t HS vs. GR5.74 ***6.19 ***1.900.320.1011.60 ***
t HS vs. TR6.47 ***5.84 ***2.33 *0.743.08 **2.88 **
t GR vs. TR2.58 *2.32 *1.570.352.42 *7.47 ***
Significance levels: * 0.05; ** 0.01; *** 0.001.
Disclaimer/Publisher’s Note: The statements, opinions and data contained in all publications are solely those of the individual author(s) and contributor(s) and not of MDPI and/or the editor(s). MDPI and/or the editor(s) disclaim responsibility for any injury to people or property resulting from any ideas, methods, instructions or products referred to in the content.