Article

Key Soil Abiotic Factors Driving Soil Sickness in Lycium barbarum L. Under Long-Term Monocropping

Key Laboratory of Cell Activities and Stress Adaptations, Ministry of Education, School of Life Sciences, Lanzhou University, Lanzhou 730000, China
*
Authors to whom correspondence should be addressed.
Agronomy 2024, 14(11), 2525; https://doi.org/10.3390/agronomy14112525
Submission received: 15 September 2024 / Revised: 25 October 2024 / Accepted: 25 October 2024 / Published: 27 October 2024
(This article belongs to the Section Farming Sustainability)

Abstract

:
Sustainable cultivation of Lycium barbarum L. (L. barbarum) in northwest China faces challenges due to soil sickness. While previous studies have explored variations in L. barbarum’s root-associated microbiota, the impact of soil properties on its growth performance and plantsoil feedback remains unclear. This study investigated changes in soil properties across topsoil (0–20 cm) and subsoil (20–40 cm) in primary L. barbarum cultivation regions of northwest China, evaluating seedling growth and plantsoil feedback through pot experiments. Results revealed significantly higher fresh shoot weights in seedlings cultivated in topsoil compared to subsoil, with plantsoil feedback showing an inverse trend. Redundancy analysis indicated positive correlations between both fresh weight and plantsoil feedback with electrical conductivity and dissolved nitrogen content, while negative correlations were observed with soil pH at both depths. Notably, dissolved organic carbon content negatively correlated with fresh weight and plantsoil feedback in topsoil, suggesting a potential relationship between continuous single-species plant litter input and soil sickness under monocropping conditions. These findings indicate that long-term input of a single plant litter type, rather than chemical fertilization, may primarily contribute to L. barbarum soil sickness in northwest China, providing valuable insights for developing sustainable cultivation practices for growing L. barbarum.

1. Introduction

In agricultural ecosystems, plantsoil feedback (PSF) pattern refers to the bidirectional interactions between plants and their growth medium, which significantly impact crop production, soil health, and the sustainability of agricultural ecosystems [1]. Positive PSF enhances crop growth and soil health by improving nutrient availability, soil aeration, and increasing the presence of beneficial soil microbes. Conversely, negative PSF impairs crop growth and productivity by promoting plant pathogens, depleting nutrients, inducing allelopathy, and causing soil degradation [2]. Soil sickness, a typical example of negative PSF, is primarily caused by the repeated cultivation of the same crop or its related species on the same land [3]. Although the exact proportion of fields specifically affected by soil sickness is less frequently quantified, it is known to be a widespread problem that negatively impacts the production of various crops, trees, and shrubs in orchards (such as Malus pumila Mill.), as well as vegetables, leading to substantial economic losses annually worldwide [2]. Therefore, elucidating the mechanisms underlying soil sickness and identifying contributory factors are essential for promoting soil health, ensuring agricultural sustainability, and safeguarding food security.
Rich in micronutrients such as vitamins and polyphenols (e.g., flavonoids), goji berries (fruits of Lycium barbarum L.) have garnered global recognition as a nutritional supplement [4]. This rising popularity has notably boosted L. barbarum cultivation, especially in northwest China [5]. Beyond providing commercial benefits to local farmers and industries, this perennial halophyte also plays critical ecological roles in combating desertification, conserving soil, and sequestering carbon in northwestern China [6]. However, the long-term monocropping of L. barbarum has led to serious ecological challenges, such as soil degradation, loss of biodiversity, and increased incidence of soil-borne phytopathogens [7,8]. Collectively referred to as soil sickness of L. barbarum, these issues have markedly reduced both the yield and quality of goji berries in the primary cultivation area of northwestern China [9]. Nonetheless, the mechanism underlying the soil sickness remains largely unknown. Unraveling this mechanism and identifying the key soil properties that contribute to negative PSF is crucial for developing environmentally friendly and sustainable cultivation practices for this crop.
Previous studies have shown that monocropping of L. barbarum induces a decline in the alpha diversity of fungal communities in the plant’s rhizosphere [7]. This prolonged monoculture practice alters the soil microbial community structure, specifically increasing the relative abundance of plant pathogens such as Fusarium spp. at various soil depths in the fields [8]. Additionally, fields cultivated with L. barbarum for 1 to 9 years exhibit greater node connectivity and network complexity among soil microbial populations compared to those cultivated for 17 to 20 years, suggesting that monocropping diminishes the potential interactions among distinct soil microbial groups [8]. Furthermore, long-term monocropping has been shown to impair the capability of soil microorganisms to utilize organic polymers such as tween 80 [10]. Similarly, the activities of various soil enzymes, including invertase, urease, acid phosphatase, and dehydrogenase, decline with increasing stand age [10]. These findings suggest that long-term monocropping practices alter the compositions and metabolic activities of soil microbial communities in L. barbarum fields.
Alterations in soil microbial composition and functionality are closely related to shifts in the soil abiotic properties of L. barbarum fields [11,12]. For instance, soil pH and available phosphorus concentration are key factors explaining changes in the soil bacterial community composition [13]. Electrical conductivity accounts for approximately 30% of the variance in fungal community structure in the rhizosphere of L. barbarum [14]. Additionally, the activities of urease and β-1,4-N-acetylglucosaminidase in field soils change with shifts in soil ammonium concentration [15]. Our previous study also revealed that the changes in soil abiotic properties decoupled the interactions between host plants and their bacterial communities in the rhizosphere [7]. Considering the biocontrol functions of root-associated bacterial communities [16], this decoupling not only disrupts the bacterial community’s role in nutrient availability but may also directly and indirectly contribute to the enrichment of soil-borne fungal pathogens under monocropping conditions [8].
Additionally, soil depth substantially affects the severity of soil sickness in L. barbarum fields due to differences in soil properties [8] and microbial composition [12]. Soil electrical conductivity has been found to increase with the age of the L. barbarum stand, particularly in the subsoil [8]. This increase in electrical conductivity, indicative of soil salinization, suggests an enhanced secondary salinization and/or elevated levels of salt stress in the deeper soil layers of the field under long-term monocropping. Furthermore, the connectivity and complexity of the microbial co-occurrence network were markedly simplified in the subsoil compared to the topsoil [8]. Combined with the declined capability to utilize organic polymers [10], these findings suggest that the deeper soil layers may be much more sensitive to long-term monocropping practices, exhibiting stronger soil sickness compared to the surface soil layers as the stand age increases. Although previous studies suggest a soil-depth-dependent strength of soil sickness in L. barbarum fields, a comprehensive understanding of the mechanisms underlying the negative plantsoil feedback and the driving factors at different soil depths is still lacking.
To address these questions, we collected a total of 330 samples from both topsoil and subsoil in the primary L. barbarum cultivation regions of northwest China. We also conducted a pot experiment to assess the plant growth performance of L. barbarum seedlings and PSF rates across different soil layers. Simultaneously, we analyzed several soil properties, including the contents of available phosphorus, dissolved nitrogen, dissolved organic carbon, total nitrogen, total organic carbon, total phosphorus, soil pH, and electrical conductivity. We hypothesized that (1) the growth performance of L. barbarum seedlings and PSF rates are higher in topsoil than in subsoil, and (2) distinct soil abiotic properties drive the changes in L. barbarum growth performance and PSF rates between the two soil depths. Our findings offer new insights for developing sustainable strategies to mitigate the soil sickness under monocropping conditions.

2. Materials and Methods

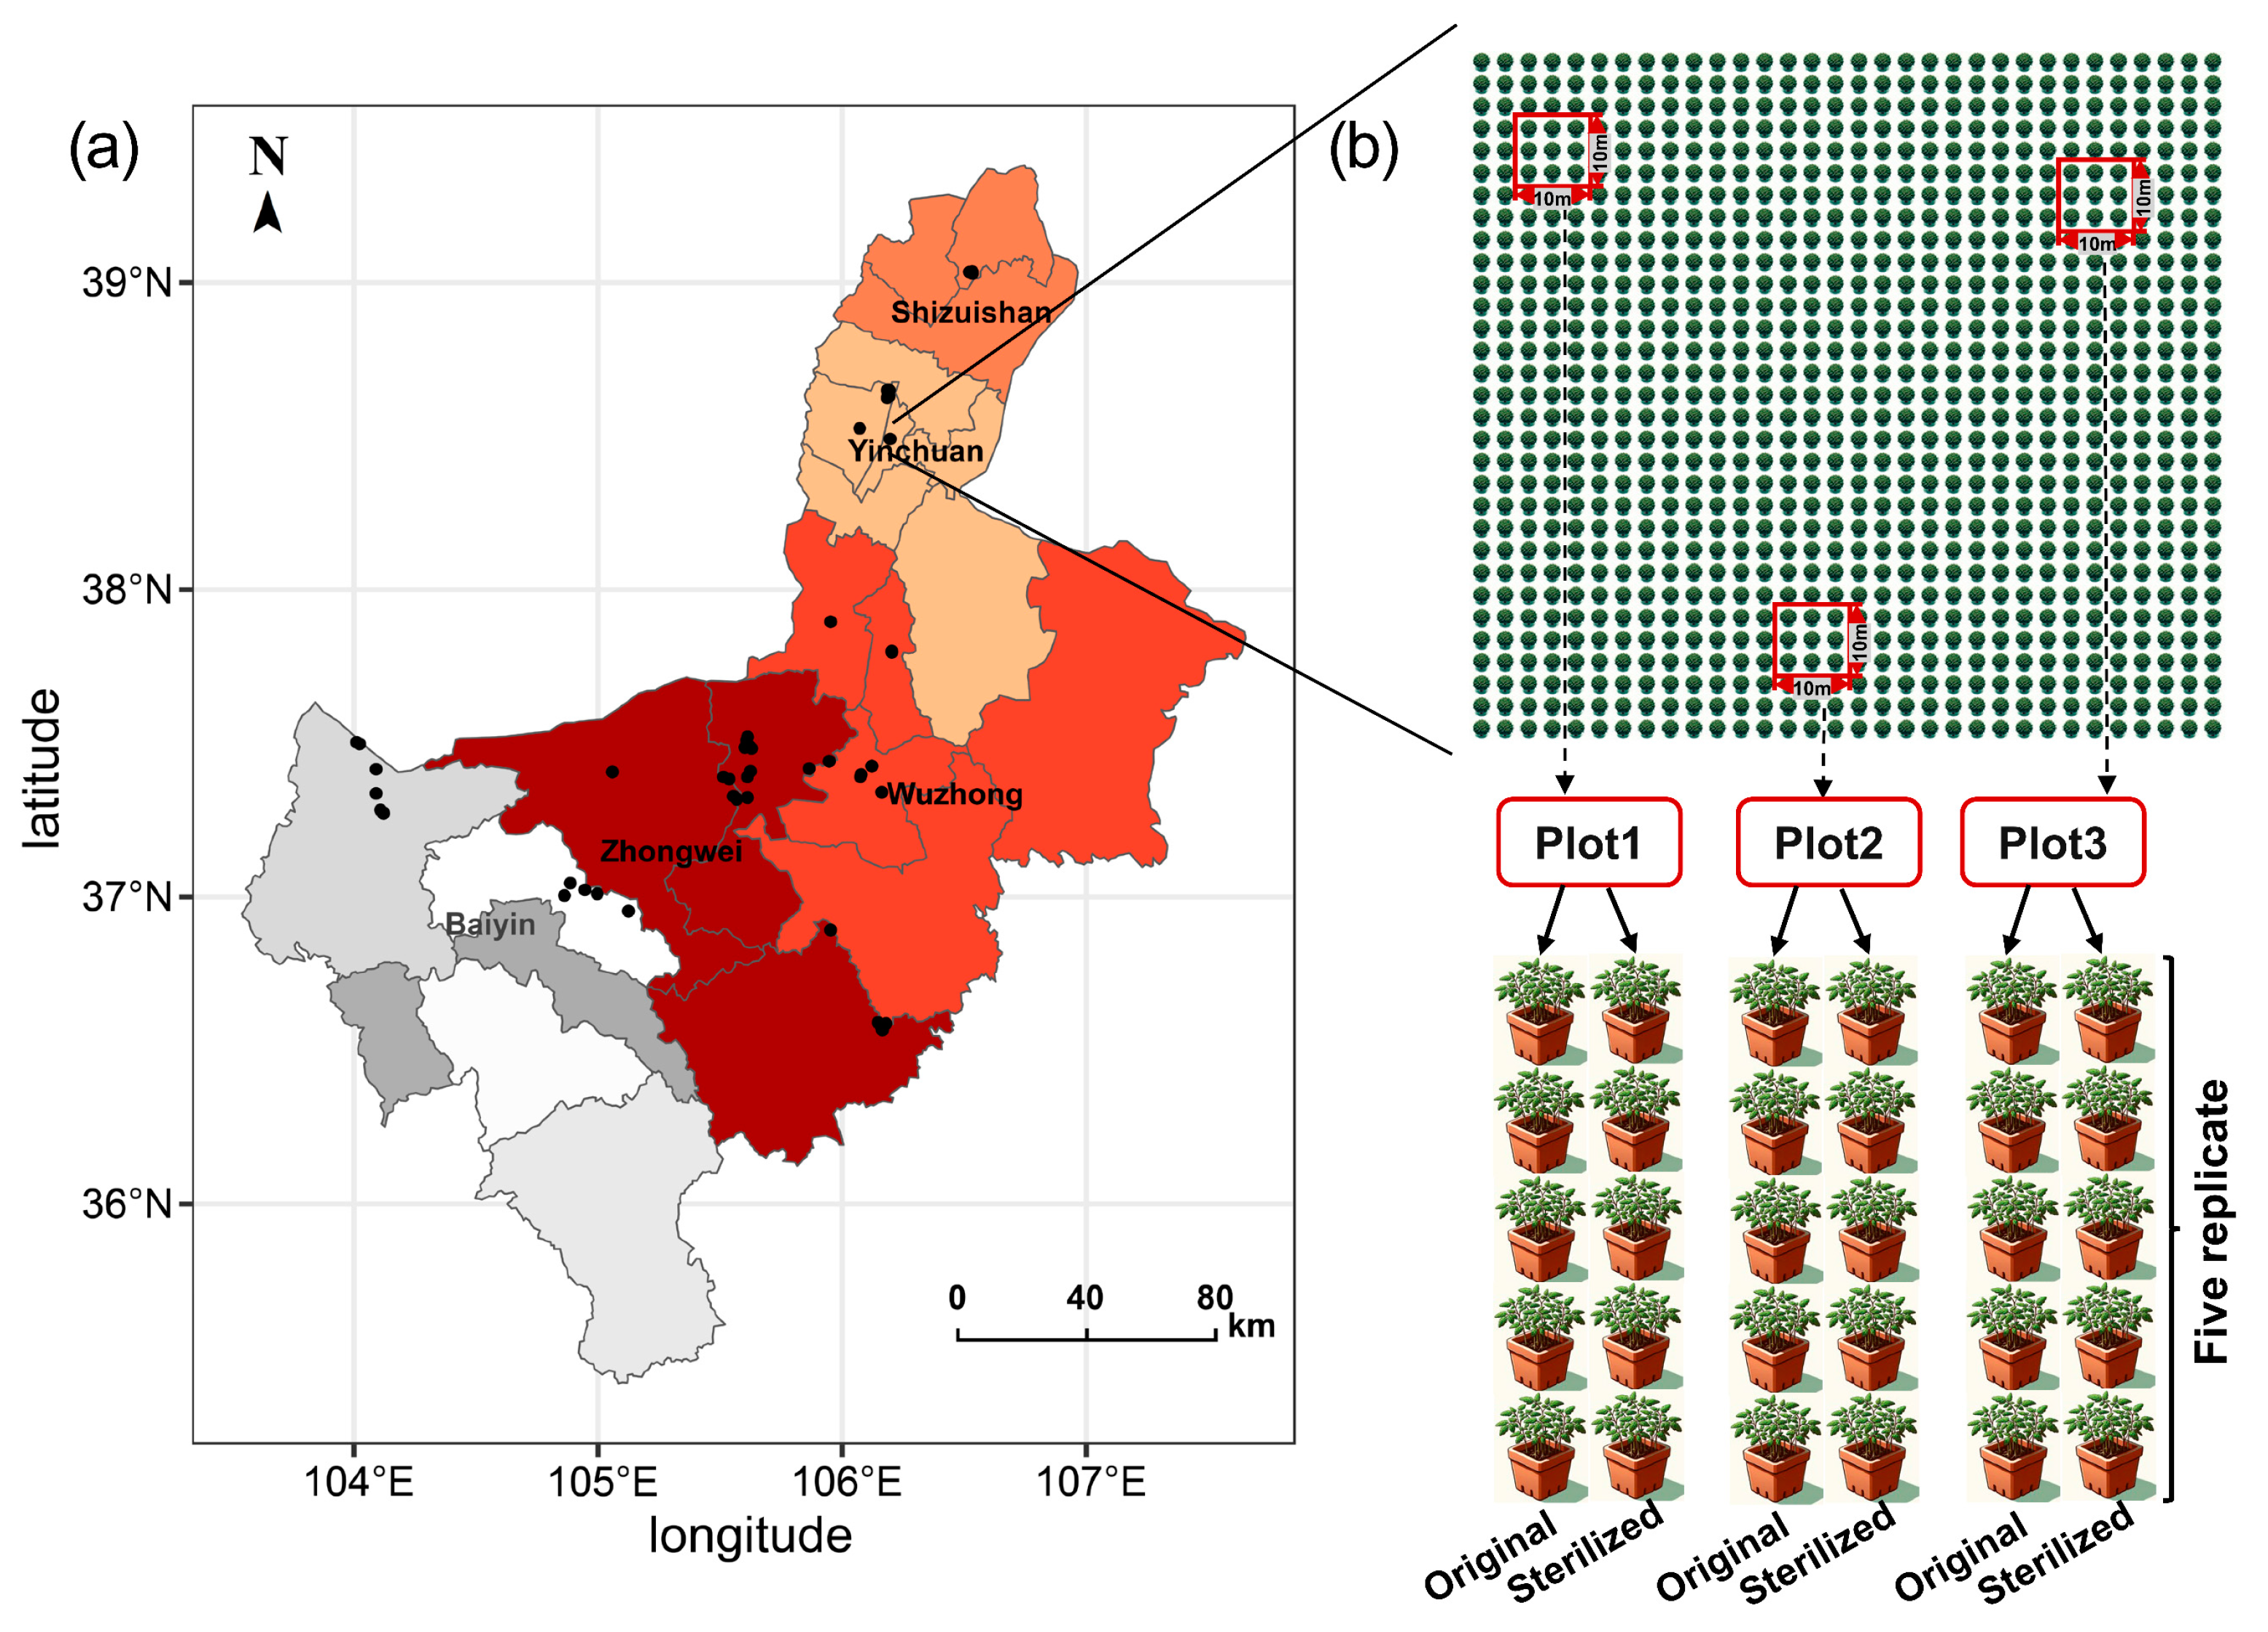
2.1. Study Area and Sampling

Soil sampling for this study was conducted in the primary L. barbarum cultivation areas of northwest China, specifically within the Ningxia Hui Autonomous Region and Gansu province, including Jingyuan and Jingtai counties, in August 2020. The region, covering approximately 62,900 square kilometers (103°33′ E to 107°41′ E, 35°24′ N to 39°30′ N), is situated at elevations ranging from 1090 to 1700 m. It is characterized by a temperate continental climate, with average annual precipitation ranging from 175.0 to 250.0 mm and mean annual temperatures between 8.4 and 9.4 °C. The primary soil type in the cultivation areas is sandy loam, classified under the World Reference Base for Soil Resources (WRB) as Calcic Xerosols [17]. Notably, this region produced over 300,000 tons of goji berries in 2021, representing more than 70% of China’s total annual goji berry production [18,19].
In the designated research area, we randomly selected 55 L. barbarum fields (Figure 1a). The cultivation method across all sampled fields was largely consistent [7,8], involving practices such as fertilization, irrigation, and periodic weeding, with variations primarily occurring in the rate of fertilizer application. Within each field, we established three independent plots (10 × 10 m), with each plot at least 100 m apart from the others. We collected soil samples from both the topsoil (0–20 cm) and subsoil (20–40 cm) layers in each plot using a soil auger (5 cm in diameter, 20 cm in length). In each plot, ten auger samples from each soil depth were randomly collected at a position 1 m apart from the plant stem and then combined to create a composite sample. Additionally, to examine the effects of the field’s cultivation history on the PSF patterns, we measured the stem diameters of L. barbarum saplings 20 cm above the ground in each plot. As a perennial shrub, the stem diameter of L. barbarum reflects information about the duration of monocropping, soil conditions (i.e., nutrient availability), and the general cultivation practices of each field. In total, 165 topsoil and 165 subsoil samples were collected across the study area.

2.2. Pot Experiment

In the laboratory, all soil samples were meticulously mixed to remove rocks and plant debris. The homogenized soil was then divided into three portions. One segment of the soil was air-dried for the analysis of abiotic soil properties. To evaluate the PSF rate, another portion of soil was autoclaved twice at 121 °C for 30 min with a 48 h interval [20]. After sterilization, both the autoclaved and the remaining portion of untreated soils were placed into pots in preparation for planting L. barbarum seedlings (Figure 1b).
In this study, we used the Ningqi-7 cultivar of L. barbarum. The seeds were surface sterilized with 2% NaClO (Tianjin Baishi chemical Co., Ltd., Tianjin, China) for 30 min, followed by rinsing five times with sterile deionized water, and then imbibed at 22 °C under 180 rpm. After four days, the seeds were sown on half-strength Murashige and Skoog (1/2 MS) medium containing 0.7% agar (pH = 5.8). The seedlings were grown in a greenhouse under a 16 h light/8 h dark photoperiod at a light intensity of 100~120 μmol photons m−2 s−1 and a temperature of 22 °C. After an additional five days, uniformly developed sterilized seedlings were transplanted into pots, with nine seedlings per pot and five replicate pots per soil sample. All pots were watered with an equal amount of sterilized water at regular intervals to compensate for evaporation, ensuring uniform soil moisture conditions across treatments. After four weeks of growth under the same conditions, we recorded the fresh shoot weight (FSW) of the seedlings from both the original and sterilized soils. The plantsoil feedback (PSF) rate was calculated using the formula: PSF rate = log2(FSWoriginal/FSWautoclaved), as specified by Wilschut et al. [21].

2.3. Soil Abiotic Property Analysis

After sieving through a 2 mm mesh, the total nitrogen and total organic carbon content were determined using elemental analyzer (vario MAX cube; Elementar, Hesse, Germany), as described by Yan et al. [22]. Total phosphorus content was measured using vanadium molybdate yellow colorimetry, as outlined by Zheng et al. [23]. The available phosphorus contents were extracted with 0.5 mol∙L−1 NaHCO3 (Shanghai Xinfan Biotechnology Co., Ltd., Shanghai, China) solution (pH = 8.5) and estimated using the molybdenumantimony colorimetric method, according to Zhang et al. [24]. The concentrations of dissolved nitrogen and dissolved organic carbon were extracted using 0.5 mol∙L−1 K2SO4 (Shanghai Xinfan Biotechnology Co., Ltd., Shanghai, China) and analyzed with a Total Organic Carbon Analyzer (Elementar, Frankfurt, Germany), following the methodology of Yang et al. [25]. Soil pH and electrical conductivity (EC) were measured using a pH meter (Sartorius PB−10, Goettingen, Germany) and an EC meter (Mettler-Toledo FE38, Zurich, Switzerland), respectively, in a 1:5 (w:v) ratio of soil solution.

2.4. Statistical Analysis

For the comparative analysis of soil abiotic properties, shoot fresh weight, and PSF rate between topsoil and subsoil samples, paired t-tests were conducted using Graphpad Prism (v. 8.2.0). To determine the statistical significance of soil abiotic properties between samples showing negative and positive PSF, Welch’s t-test was applied using Prism (v. 8.2.0). Prior to these analyses, data normality was checked using the Shapiro–Wilk test, and non-normally distributed data were log-transformed. Random forest models, developed using the R (version 4.2.0) package ‘randomForest’ [26], were used to identify key factors influencing shifts in fresh biomass and PSF rates. The ‘rfcv’ function from the same package was utilized to discard less important soil abiotic properties based on 10-fold cross-validation [27]. Linear regression analyses, conducted in Prism (version 8.2.0), was used to examine the relationships between key soil abiotic properties and both shoot fresh weight and PSF rates. Partial correlation analysis was used to elucidate the effects of monocropping on shoot fresh weight or PSF rates, incorporating L. barbarum stem diameter as an explanatory variable and soil abiotic properties as control factors [28] using SPSS (version 22.0). Finally, redundancy analysis (RDA) was conducted with the R ‘vegan’ package to explore the associations between soil abiotic properties and both fresh biomass and PSF rates at different soil depths.

3. Results

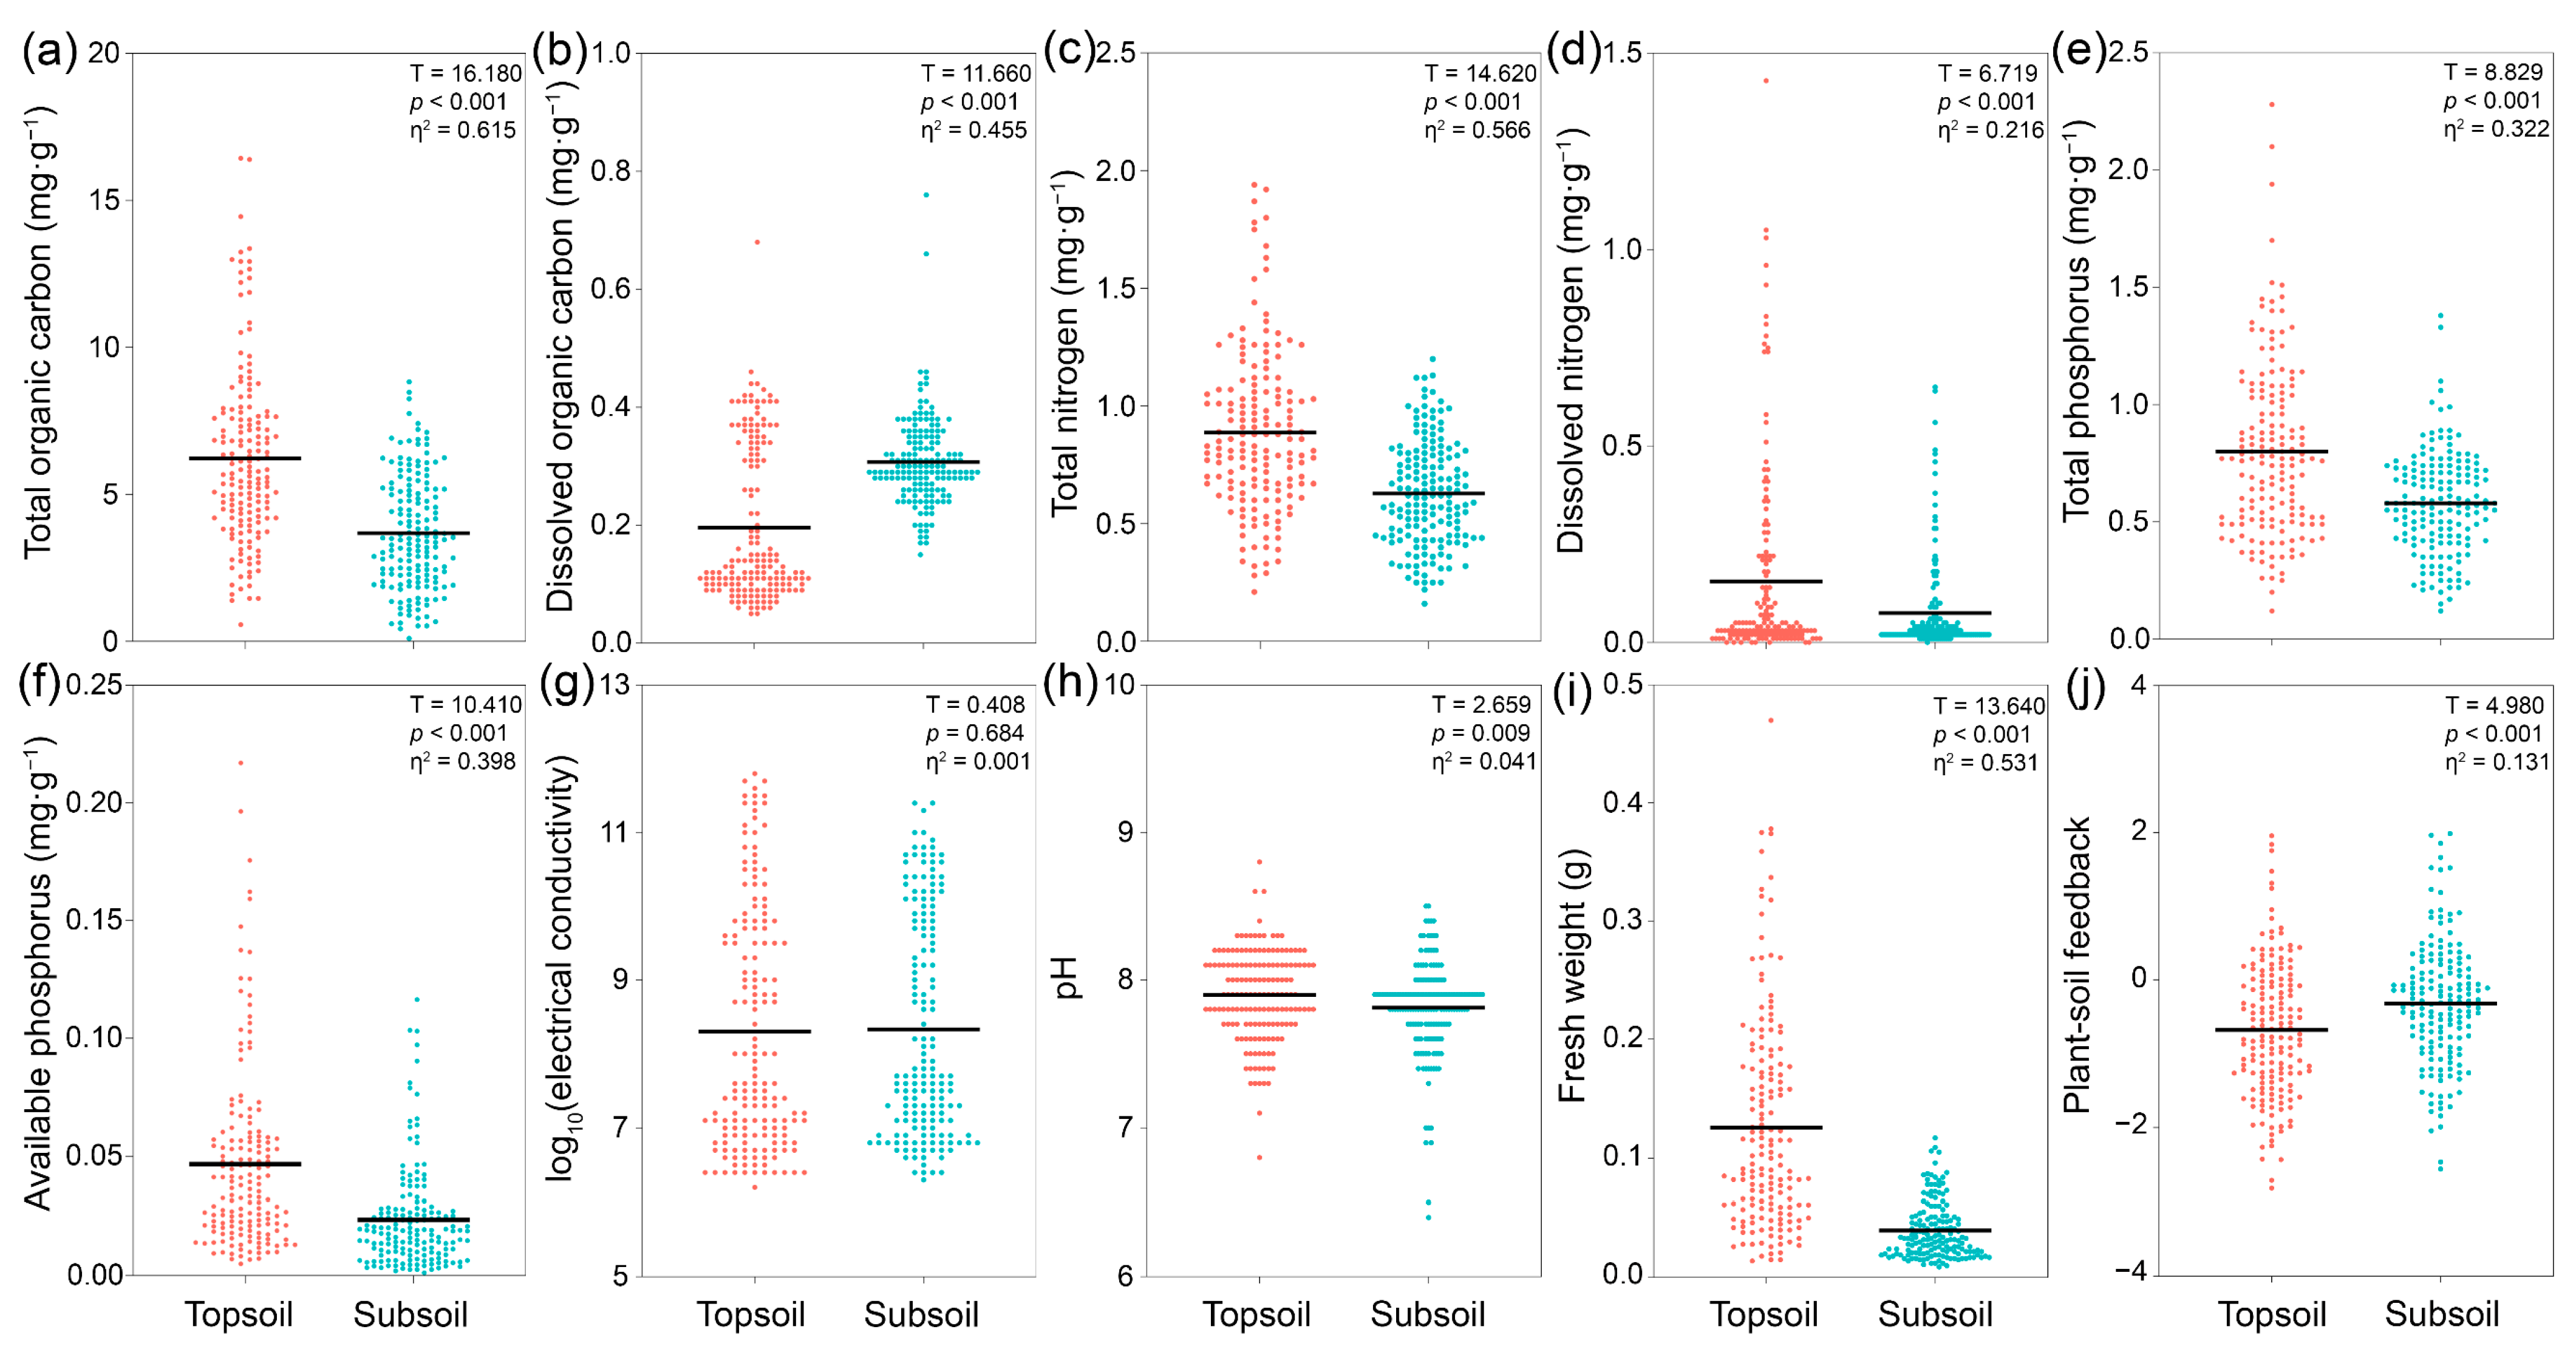
3.1. Differences in Soil Abiotic Properties, Shoot Fresh Weight, and PSF Between Topsoil and Subsoil

Across all samples, total organic carbon content ranged from 0.100 to 16.430 mg∙g−1, and dissolved organic carbon varied between 0.045 and 0.756 mg∙g−1 (Figure 2). The mean total organic carbon content in the topsoil was significantly higher than in the subsoil (Figure 2a), while dissolved organic carbon showed the opposite trend (Figure 2b). Total and dissolved nitrogen contents ranged from 0.165 to 1.941 mg∙g−1 and 0.000 to 0.143 mg∙g−1, respectively, with both total and dissolved nitrogen concentrations being higher in the topsoil than in the subsoil (Figure 2c,d). Total and available phosphorus contents varied from 0.123 to 2.280 mg∙g−1 and 0.001 to 0.217 mg∙g−1, respectively, with topsoil samples containing significantly higher levels than subsoil samples (Figure 2e,f). No significant differences in electrical conductivity were observed between topsoil and subsoil (Figure 2g). However, pH values differed significantly, with topsoil demonstrating higher pH than subsoil (Figure 2h).
On average, the fresh shoot weights of L. barbarum seedlings grown in topsoil were significantly higher than those grown in subsoil (Figure 2i). Conversely, the mean PSF rate for topsoil was significantly lower than for subsoil across the study area (Figure 2j). Additionally, the mean PSF rates for both topsoil and subsoil samples were negative, indicating a predominantly negative plantsoil feedback pattern in the region.

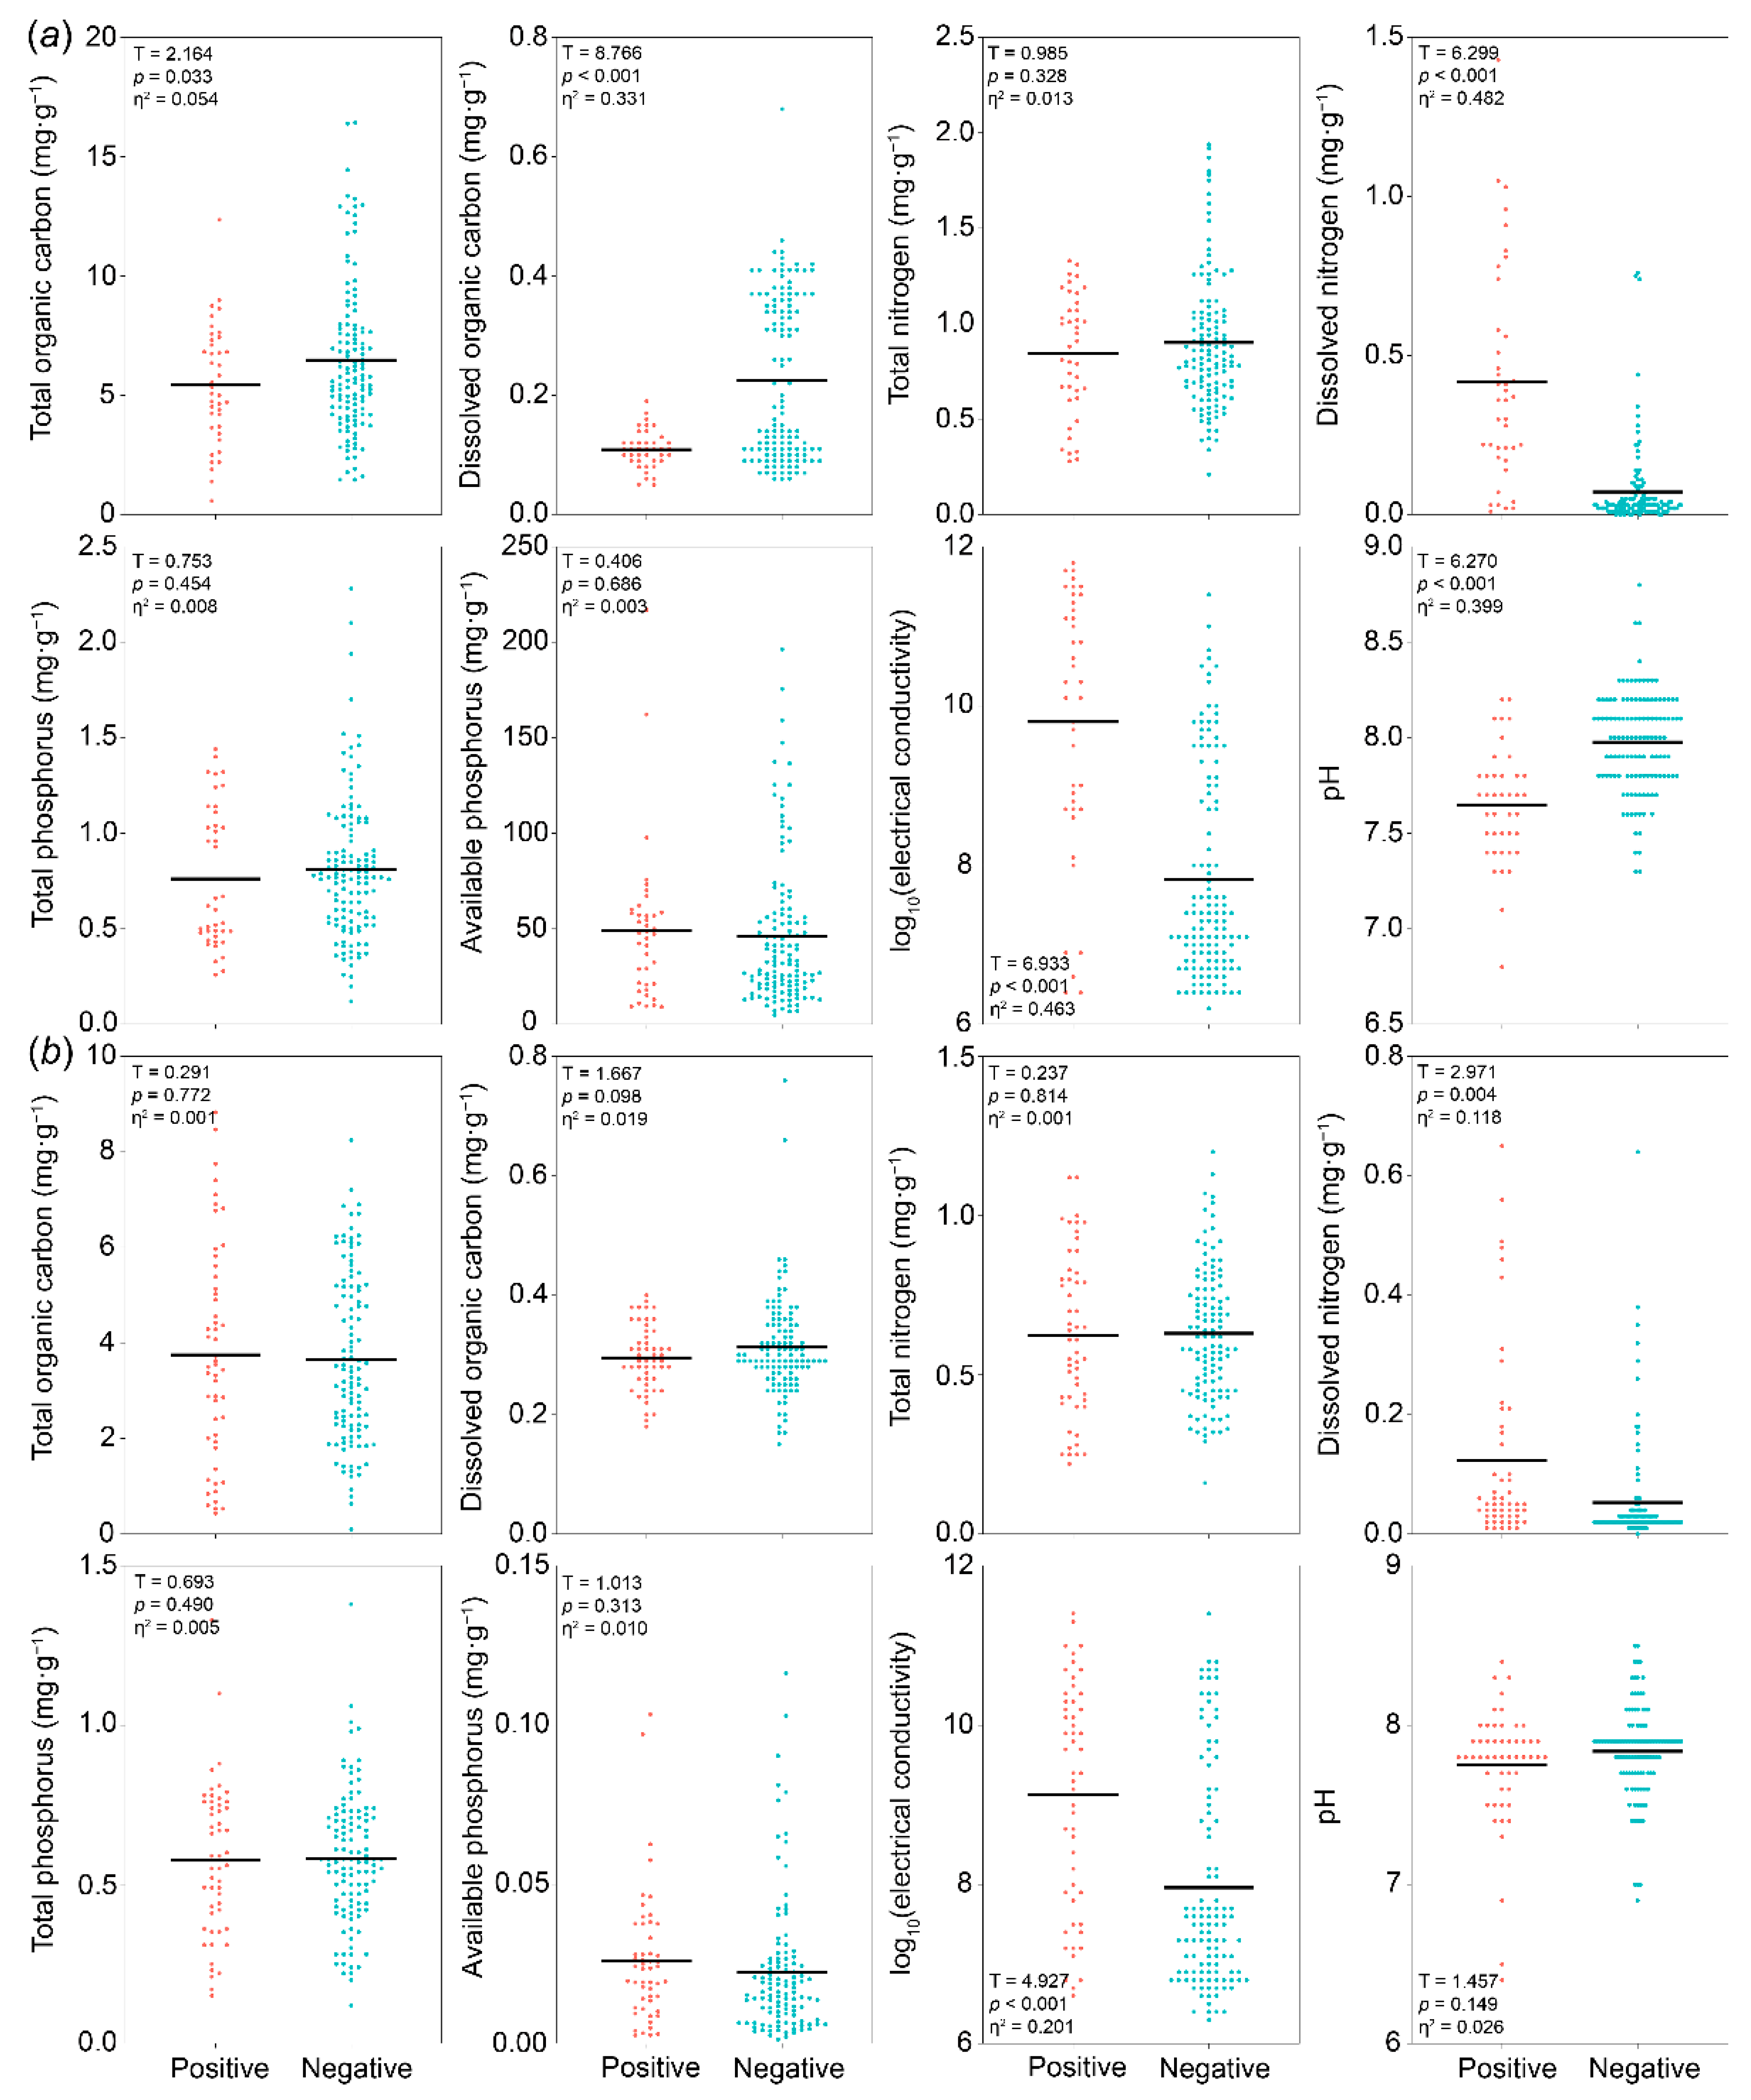
3.2. Differences in Soil Properties Between Positive and Negative PSF Samples

By comparing soil abiotic properties between samples exhibiting positive (PSF > 0) and negative (PSF < 0) PSF patterns, we observed that in the topsoil, samples with positive PSF exhibited higher concentrations of dissolved nitrogen and electrical conductivity (Figure 3a). However, these samples had lower levels of total and dissolved organic carbon, and soil pH compared to the negative PSF samples (Figure 3a). In the subsoil, samples with positive PSF also demonstrated elevated levels of dissolved nitrogen and electrical conductivity compared to negative PSF samples (Figure 3b).

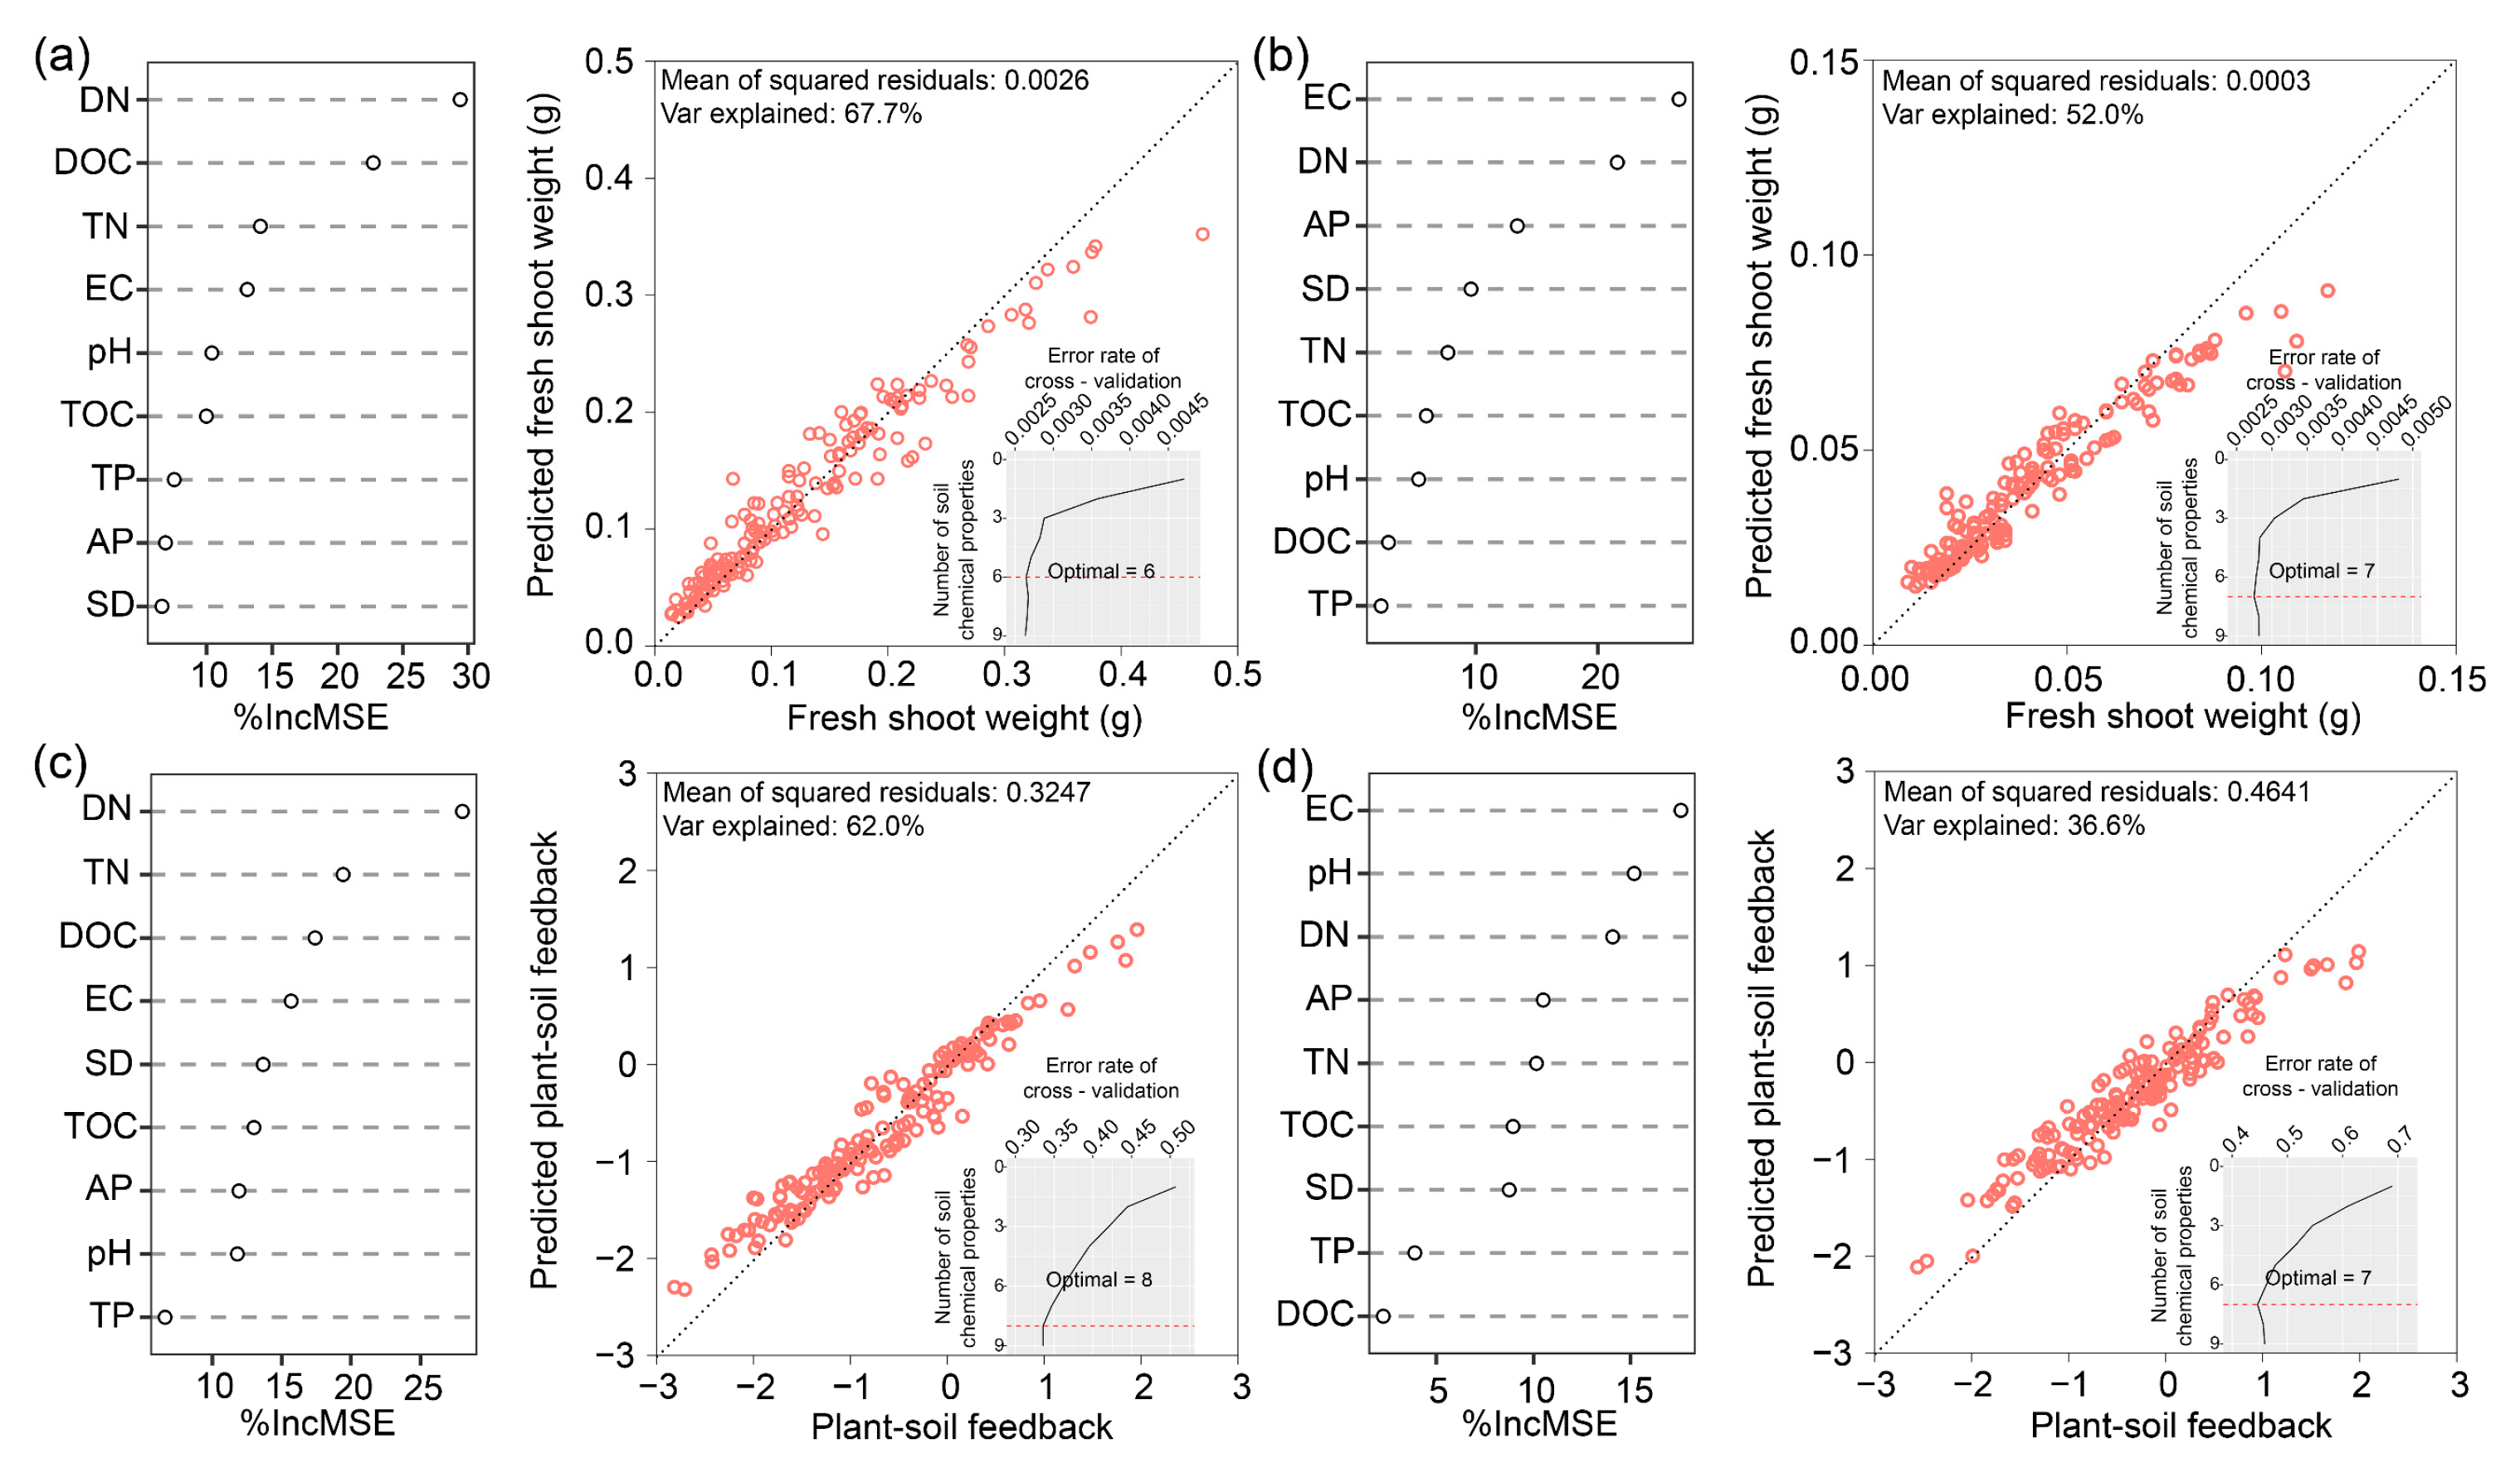
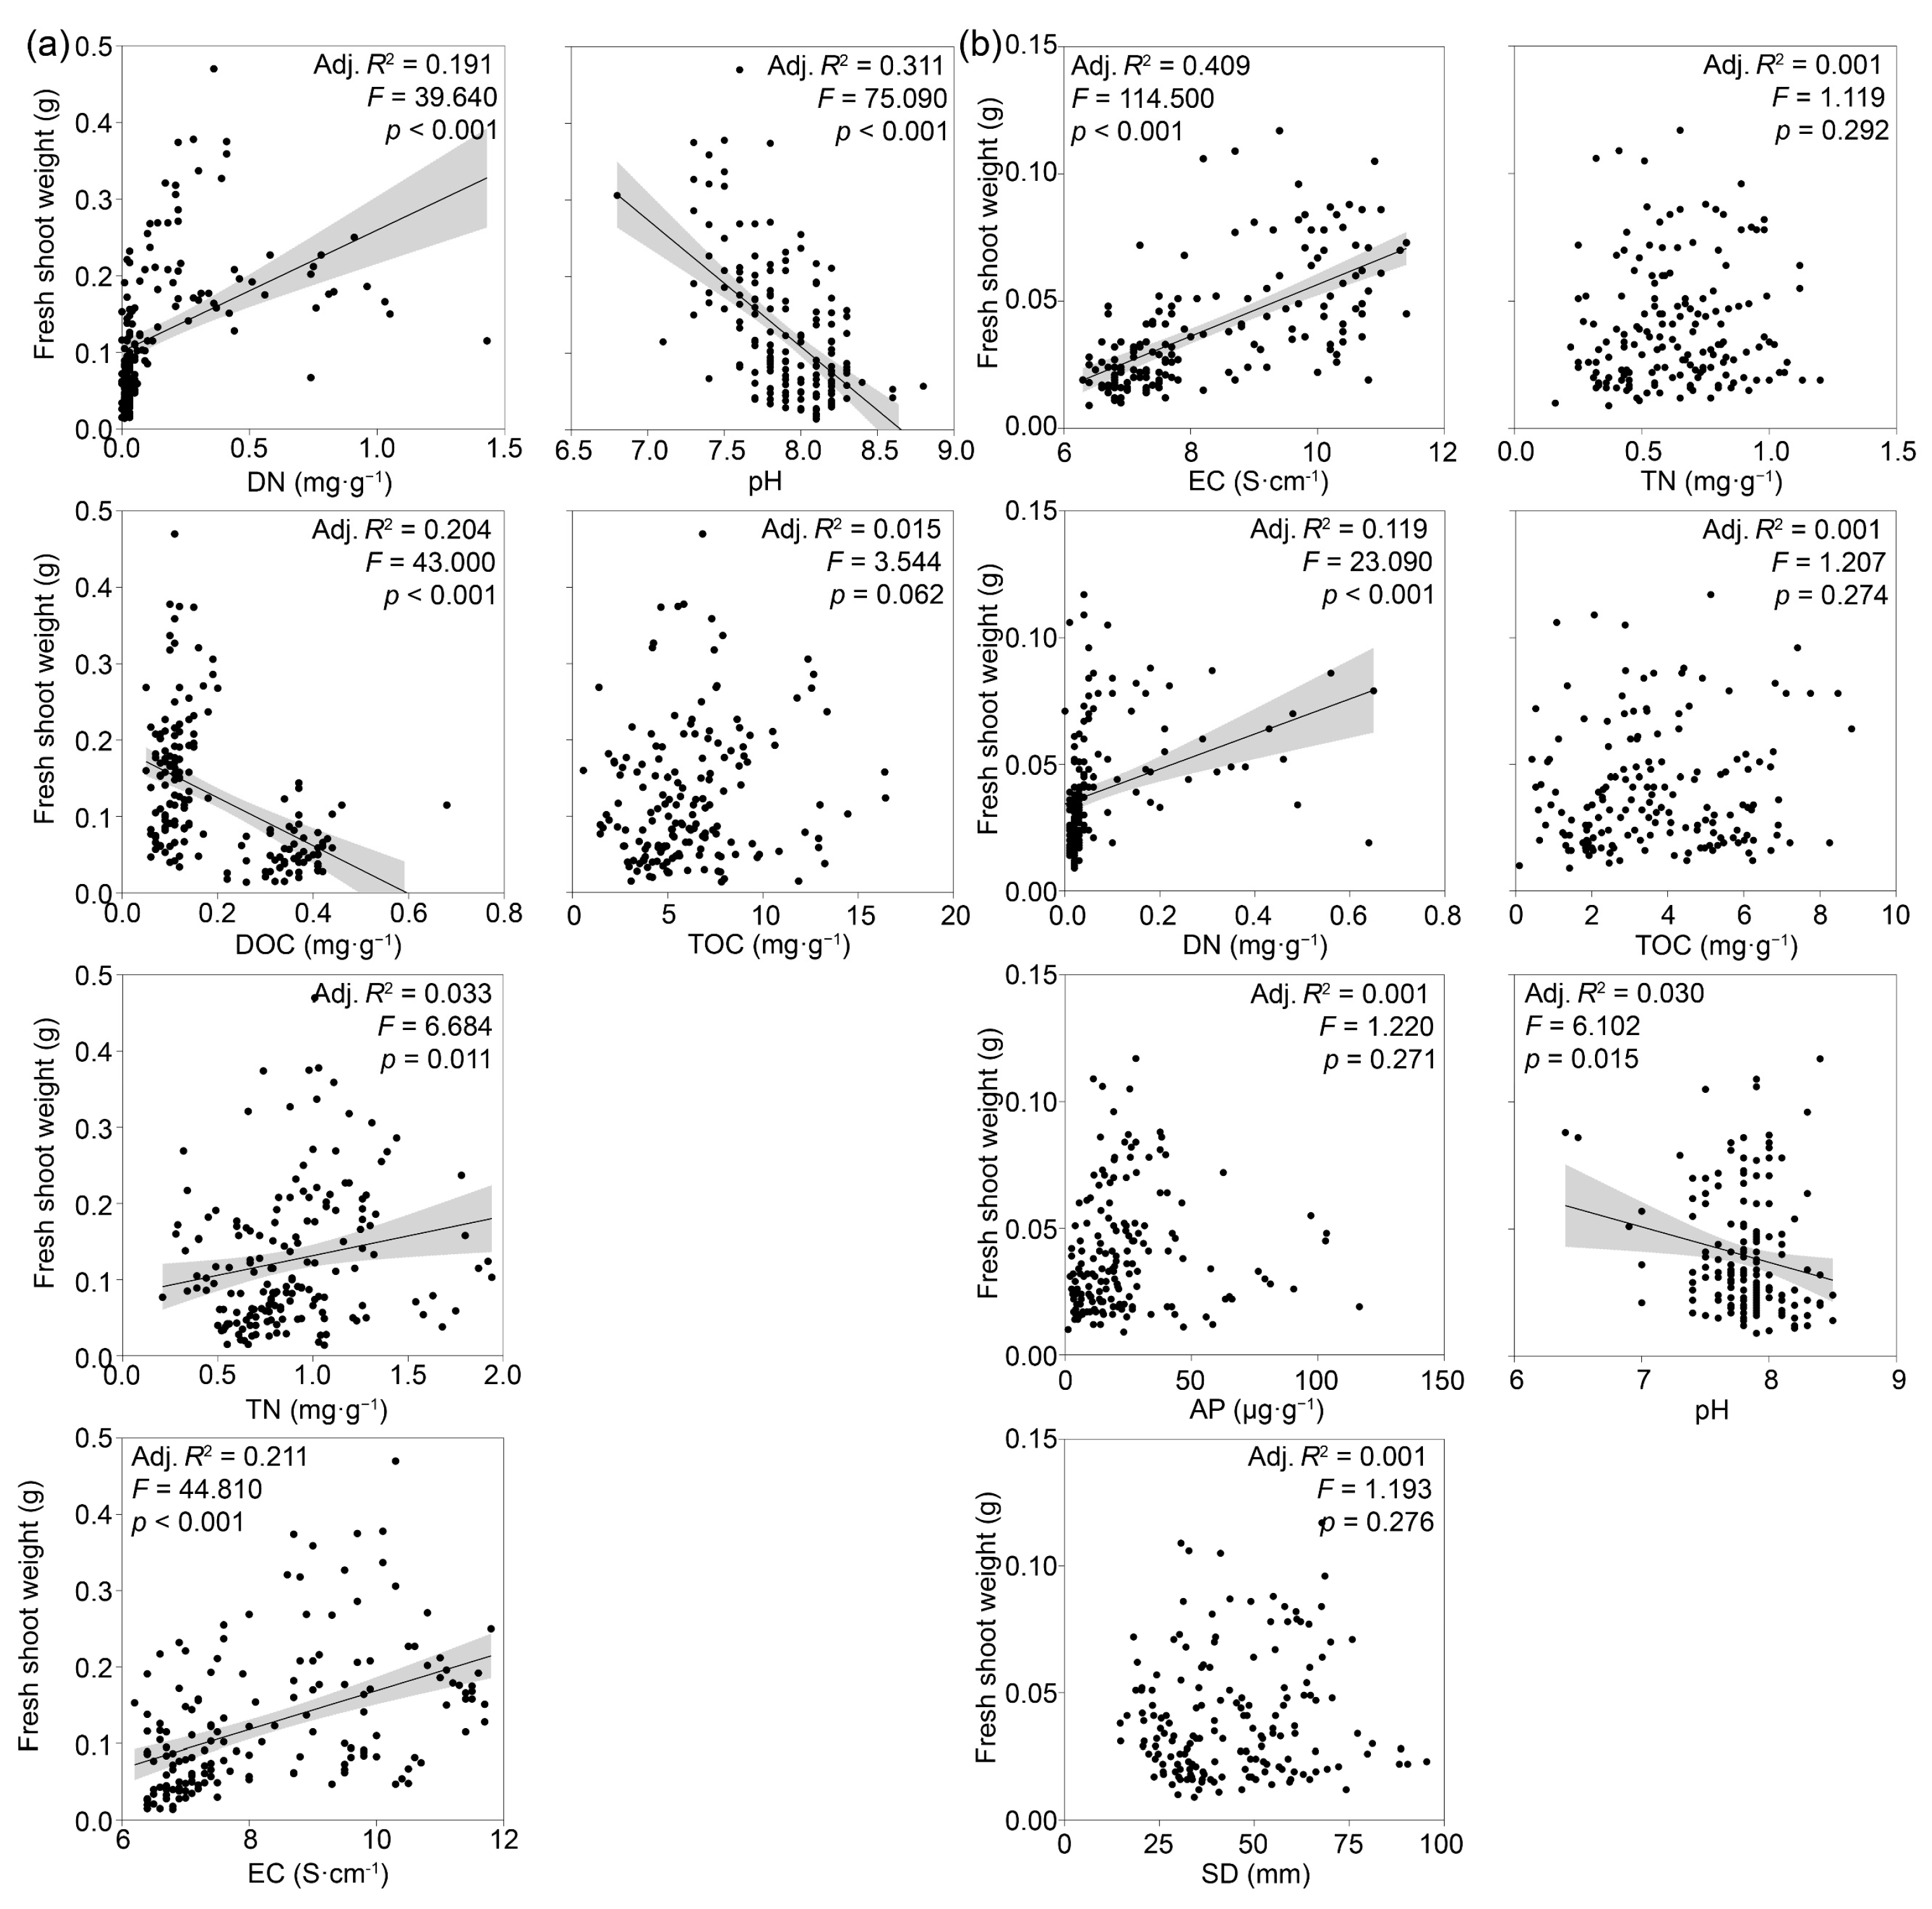
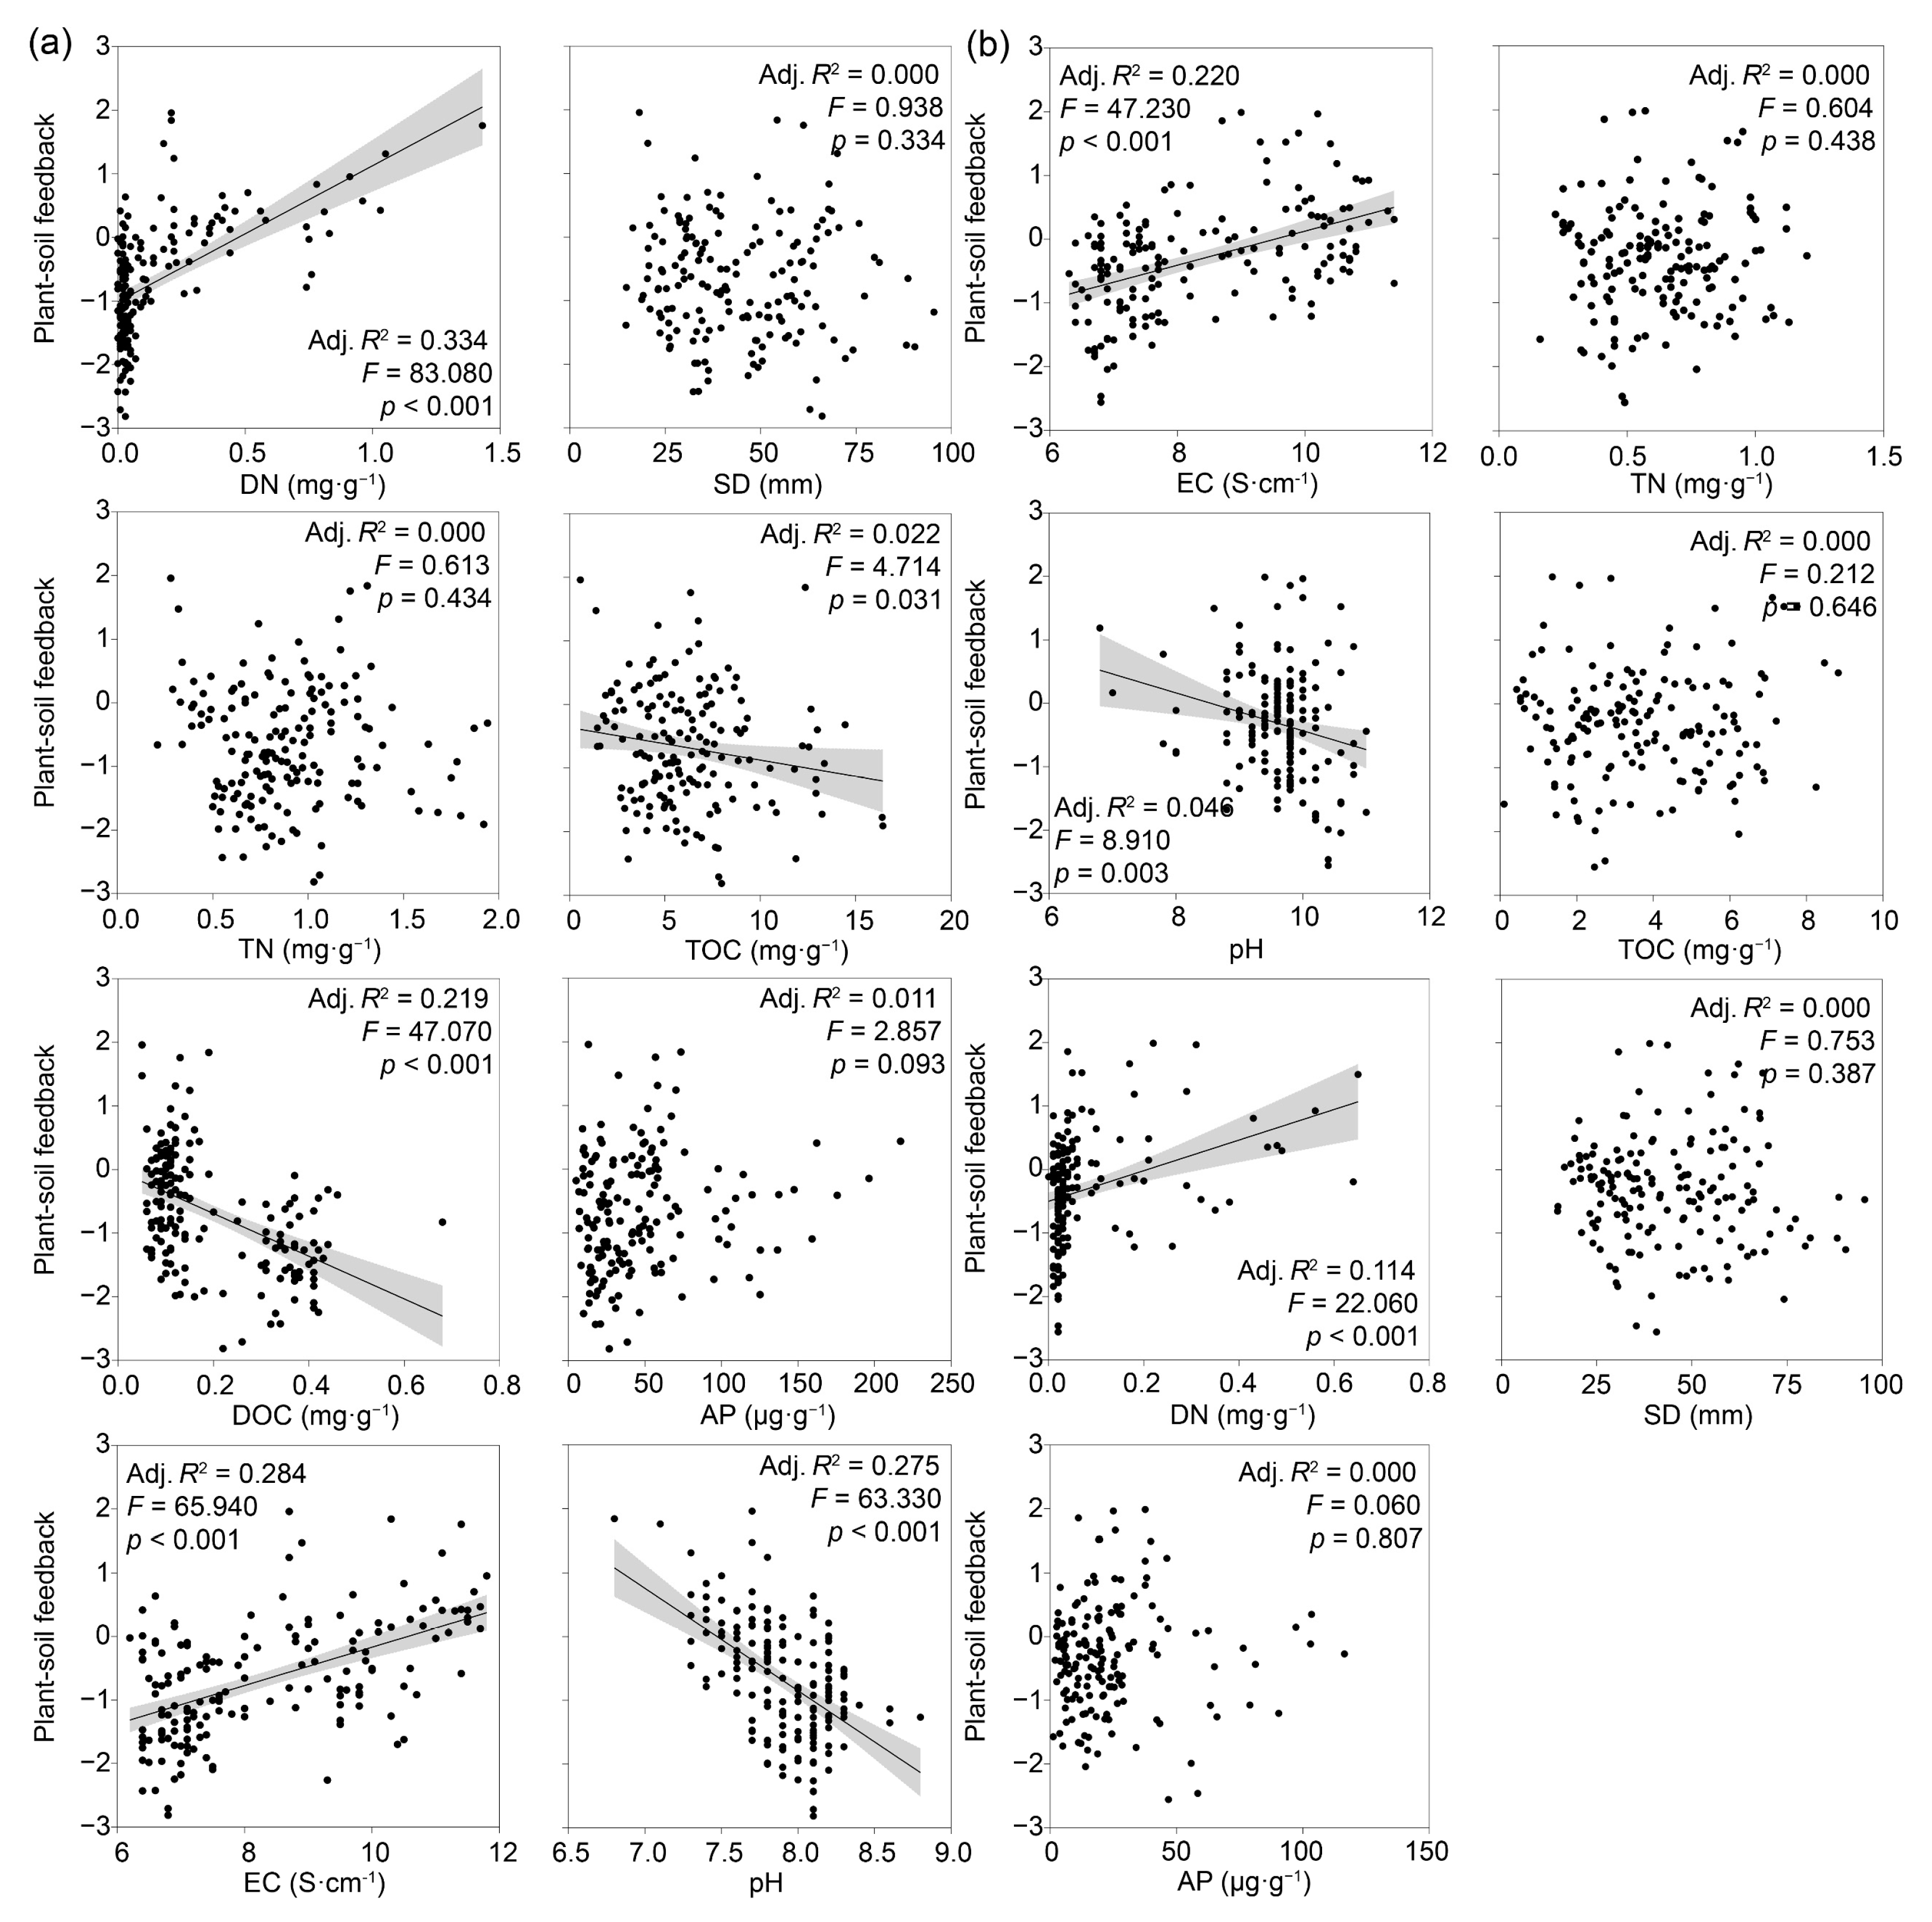
3.3. Factors Driving Shifts in Shoot Fresh Weight and PSF Rates

In the topsoil samples, the final random forest model identified six variables—dissolved nitrogen, dissolved organic carbon, total nitrogen, electrical conductivity, pH, and total organic carbon content—that collectively accounted for 67.7% of the variance in the FSW of L. barbarum seedlings (Figure 4a). Specifically, shoot fresh weight increased with elevated levels of dissolved (adj. R2 = 0.191, p < 0.001) and total nitrogen (adj. R2 = 0.033, p = 0.011), and electrical conductivity (adj. R2 = 0.211, p < 0.001). Conversely, higher concentrations of dissolved organic carbon (adj. R2 = 0.204, p < 0.001) and soil pH (adj. R2 = 0.311, p < 0.001, Figure 5a) were associated with decreased fresh biomass.
In the subsoil, the random forest model revealed that electrical conductivity was the most influential variable, followed by dissolved nitrogen, available phosphorus, stem diameter, total nitrogen, total organic carbon, and pH (Figure 4b). Together, these factors explained 52.0% of the variation in shoot fresh weight of L. barbarum seedlings (Figure 4b). Regression analysis showed that shoot weight positively correlated with electrical conductivity (adj. R2 = 0.409, p < 0.001) and dissolved nitrogen (adj. R2 = 0.119, p < 0.001), but negatively correlated with soil pH (adj. R2 = 0.030, p = 0.015, Figure 5b).
The final random forest model for the topsoil identified dissolved nitrogen concentration as the most crucial predictor of PSF rate, followed by total nitrogen, dissolved organic carbon content, electrical conductivity, stem diameter, total organic carbon content, and soil pH (Figure 4c). These factors collectively explained 62.0% of the variance in the PSF rate (Figure 4c). The PSF rate increased with the increase in dissolved nitrogen content (adj. R2 = 0.334, p < 0.001) and electrical conductivity (adj. R2 = 0.284, p < 0.001). However, it decreased with rising levels of dissolved organic carbon (adj. R2 = 0.219, p < 0.001), total organic carbon (adj. R2 = 0.022, p = 0.031), and pH (adj. R2 = 0.275, p < 0.001, Figure 6a).
In the subsoil, the final model accounted for only 36.6% of the variance in the PSF rate (Figure 4d). Electrical conductivity was the predominant factor, followed by pH, dissolved nitrogen, available phosphorus, total nitrogen, total organic carbon, and stem diameter (Figure 4d). PSF rates increased with the increase in electrical conductivity (adj. R2 = 0.220, p < 0.001) and dissolved nitrogen (adj. R2 = 0.114, p < 0.001) but decreased with increasing soil pH (adj. R2 = 0.046, p = 0.003, Figure 6b).
Redundancy analysis (RDA) showed that in the topsoil, soil abiotic properties accounted for 45.9% of the variability in both shoot fresh weight and PSF rates (adj. R2 = 0.459, F = 18.378, p < 0.001). Both variables were positively correlated with dissolved nitrogen content, electrical conductivity, and available phosphorus concentration, yet negatively correlated with soil pH (Figure 7a). In the subsoil, these properties explained 33.7% of the variance in fresh biomass and PSF rate (adj. R2 = 0.337, F = 11.423, p < 0.001), with positive correlations observed with electrical conductivity and dissolved nitrogen content, and negative correlations with soil pH (Figure 7b). Additionally, partial correlation analysis indicated that the PSF rate decreased with increasing stem diameter when controlling for changes in soil abiotic properties in the topsoil (Spearman correlation coefficient ρ = −0.241, p = 0.002, Table 1), suggesting that long-term monocropping could contribute to negative PSF in the topsoil of the fields.

4. Discussion

In this study, we assessed the soil abiotic properties in L. barbarum fields across the primary cultivation area in northwest China. Comparing our findings with previous research [29], we observed that the mean concentrations of total nitrogen and phosphorus in the field soils surpassed those in croplands across Loess Plateau, indicating an excessive use of nitrogen and phosphorus-based chemical fertilizers in L. barbarum cultivation [30]. Despite the potential excess use of inorganic fertilizers, the growth and fitness of L. barbarum seedlings in the region were not obviously disrupted, as both fresh biomass and the PSF rate exhibited positive correlations with electrical conductivity and negative correlations with soil pH (Figure 5 and Figure 6).
As soil pH of both topsoil and subsoil samples ranges from 6.4 to 8.8 (Figure 2), our results imply that a decrease in soil alkaline may stimulate L. barbarum seedling growth and sustain soil microbial functions crucial for plant fitness. Moreover, the positive relationship between PSF rate and soil electrical conductivity might stem from the increased dissolved nitrogen content, which also positively correlates with the PSF rate across different soil depths (Figure 5 and Figure 6). These results align with previous study indicating that nitrogen is a main driver for plant growth [31]. Enhanced nutrient availability would improve plant growth performance and stress tolerance [32], thereby mitigating negative plantsoil feedback. Notably, these results are inconsistent with our previous deduction that a decline in soil pH and an increase in salinity would enhance the strength of the soil sickness of L. barbarum [8].
In both soil depths, there was a negative correlation between soil pH and electrical conductivity across the study area (Figure 7). This observation may be attributed to the use of chemical fertilizers such as urea, ammonium sulfate, and ammonium chloride. Plants secrete [H+] to the soil for every [NH4+] taken up [33], while the nitrification process generates two [H+] for each reaction [34]. Additionally, fertilization contributes to the accumulation of [SO42−], [Cl], and [NO3], leading to increased salt content in field soils during long-term monocropping [15,35,36]. Considering L. barbarum’s strong adaptation to high-salt-stress conditions [37] and the resilience of the soil microbial community to salinized conditions in this region [38], the positive relationships between soil electrical conductivity and PFW or PSF may result indirectly from pH changes induced by inorganic fertilization. Thus, such positive relationships, particularly in topsoil samples, may be primarily associated with the effects of chemical fertilization through elevating nitrogen availability and decreasing soil pH across the study region (Figure 5 and Figure 6). In the context of salinized soil conditions, our results suggest that inorganic fertilization might not be the primary direct reason leading to soil sickness in L. barbarum fields in the study area.
Additionally, a partial correlation analysis revealed a negative relationship between the stem diameter of L. barbarum saplings and PSF rates in the topsoil (Table 1). As stem diameter increases with stand age, this finding indirectly supports the notion that long-term monocropping jeopardizes the sustainable cultivation of L. barbarum by enhancing the negative PSF specifically in the topsoil. On average, serval soil fertility indicators, such as total organic carbon, nitrogen, and phosphorus, dissolved nitrogen, and available phosphorus, were higher in topsoil than in subsoil (Figure 2), aligning with previous finding [39]. While the soil condition of topsoil contributes to a relatively higher plant biomass, it results in a lower mean PSF rate in the topsoil compared to the subsoil (Figure 2). Since most of the soil samples showed negative PSF (Figure 3), our findings contradict our hypothesis that topsoil exhibits less strength of negative PSF than subsoil across the study area. Given that topsoil samples with negative PSF have higher mean contents of total and dissolved organic carbon (Figure 3) and that the dissolved organic carbon concentration negatively correlates with PSF in the topsoil (Figure 6), our findings suggest that the accumulation and degradation of plant litter in the soil may be involved in the soil sickness of L. barbarum.
It has been suggested that plant litter contributes to negative PSF by enriching the abundance of phytopathogens [40] and inducing autotoxicity [41]. During the cultivation period, plant litter, specifically the L. barbarum leaves, is successively inputted into the topsoil. Given that L. barbarum leaves, as well as the phenolic acid compounds such as benzoic acid, salicylic acid, p-hydroxybenzoic acid, and coumarin contained in the leaves, show significant autotoxic effect on its growth [42], the input of leaves possibly induces growth inhibition in the topsoil of the fields. It has been suggested that phenolic acid compounds such as benzoic acid could stimulate and/or activate the growth and pathogenicity of plant pathogenic fungi, like Fusarium spp. [43]. Therefore, the degradation of L. barbarum leaves in the topsoil may also contribute to the enrichment of Fusarium in the field soils with increasing stand age [7,8]. Considering the negative relationship between dissolved organic carbon concentration and PSF rates (Figure 6), our results infer that long-term single-carbon-source input under monocropping could lead to soil sickness of the plant via inducing autotoxicity and the enrichment of phytopathogenic fungal populations. Further experiments combining in situ degradation, barcode sequencing, and culturomics will be invaluable for testing this hypothesis in the future.

5. Conclusions

In summary, our study reveals that the topsoil of L. barbarum fields supports better plant growth performance but exhibits higher negative PSF rates compared to the subsoil, suggesting much more severe soil sickness in the topsoil across the primary cultivation area. Dissolved organic carbon, total and dissolved nitrogen, and soil electrical conductivity are the key factors driving L. barbarum growth and PSF in the topsoil, while dissolved nitrogen, soil electrical conductivity, available phosphorus, and pH are the crucial variables for the subsoil. Dissolved nitrogen and soil electrical conductivity show positive correlations with shoot fresh weight and PSF, whereas dissolved organic carbon and/or pH exhibit negative correlations with both metrics in topsoil and subsoil. Notably, the accumulation of organic carbon negatively contributes to PSF specifically in the topsoil, indicating potential connections between single-species litter input and soil sickness in the field under long-term monocropping. Given the role of organic carbon in shaping soil microbial communities, our results suggest that increasing the diversity of organic carbon inputs through intercropping with diverse plant species, such as green manure plants, could be a sustainable cultivation strategy for this halophyte in northwest China.

Author Contributions

Methodology, C.Q., Y.S., T.P., K.L., M.P., H.S., X.H. and Z.C.; Validation, M.P., J.L., P.F., X.W. and Y.B.; Formal analysis, Z.L., C.Q., Y.S., T.P., C.Z., H.S. and P.F.; Investigation, Z.L., C.Q., Y.S., T.P., C.Z., K.L., M.P., H.S., J.L., X.H., Z.C., P.F. and X.N.; Resources, X.W.; Data curation, Z.L., X.H. and Z.C.; Writing—original draft, Z.L. and X.N.; Writing—review and editing, X.N.; Visualization, Z.L., C.Z., K.L., J.L. and X.N.; Supervision, Y.B.; Project administration, X.W., Y.B. and X.N. All authors have read and agreed to the published version of the manuscript.

Funding

This work was supported by grants from the National Natural Science Foundation of Gansu (Nos. 22JR5RA461) and the Excellent Doctoral Program of the Natural Science Foundation of Gansu (Nos. 22JR5RA419).

Data Availability Statement

The original contributions presented in the study are included in the article, and further inquiries can be directed to the corresponding author.

Conflicts of Interest

The authors declare no conflicts of interest.

References

  1. Bennett, J.A.; Klironomos, J. Mechanisms of plant-soil feedback: Interactions among biotic and abiotic drivers. New Phytol. 2019, 222, 91–96. [Google Scholar] [CrossRef] [PubMed]
  2. Huang, L.F.; Song, L.X.; Xia, X.J.; Mao, W.H.; Shi, K.; Zhou, Y.H.; Yu, J.Q. Plant-soil feedbacks and soil sickness: From mechanisms to application in agriculture. J. Chem. Ecol. 2013, 39, 232–242. [Google Scholar] [CrossRef] [PubMed]
  3. Cesarano, G.; Zotti, M.; Antignani, V.; Marra, R.; Scala, F.; Bonanomi, G. Soil sickness and negative plant-soil feedback: A reappraisal of hypotheses. J. Plant Pathol. 2017, 99, 545–570. [Google Scholar]
  4. Pires, T.C.S.P.; Dias, M.I.; Calhelha, R.C.; Alves, M.J.; Celestino, S.B.; Ferreira, I.C.F.R. Phenolic compounds profile, nutritional compounds and bioactive properties of Lycium barbarum L.: A comparative study with stems and fruits. Ind. Crops Prod. 2018, 122, 574–581. [Google Scholar] [CrossRef]
  5. Yao, R.; Heinrich, M.; Zou, Y.; Reich, E.; Zhang, X.; Chen, Y.; Weckerle, C.S. Quality variation of goji (fruits of Lycium spp.) in China: A comparative morphological and metabolomic analysis. Front. Pharmacol. 2018, 9, 151. [Google Scholar] [CrossRef]
  6. Zhou, Y.; Gao, X.; Wang, J.; Robinson, B.H.; Zhao, X. Water-use patterns of Chinese wolfberry (Lycium barbarum L.) on the Tibetan Plateau. Agric. Water Manag. 2021, 255, 107010. [Google Scholar] [CrossRef]
  7. Na, X.; Ma, C.; Ma, S.; Ma, X.; Zhu, X.; Xu, P.; Zhu, H.; Cao, X.; Liang, W. Monocropping decouples plant-bacteria interaction and strengthens phytopathogenic fungi colonization in the rhizosphere of a perennial plant species. Plant Soil 2019, 445, 549–564. [Google Scholar] [CrossRef]
  8. Na, X.; Ma, S.; Ma, C.; Liu, Z.; Xu, P.; Zhu, H.; Liang, W.; Kardol, P. Lycium barbarum L. (goji berry) monocropping causes microbial diversity loss and induces Fusarium spp. enrichment at distinct soil layers. Appl. Soil Ecol. 2021, 168, 104107. [Google Scholar]
  9. Wang, F.; Li, W.; Chen, H.; Weil, R.R.; Zhu, L.; Nan, X. Forage radish cover crops improve soil quality and fruit yield of Lycium barbarum L. in an arid area of northwest China. Agronomy 2023, 13, 1634. [Google Scholar] [CrossRef]
  10. Peng, T.; Ma, S.; Ma, C.; Song, Y.; Gao, N.; Li, K.; Zhang, C.; Li, J.; Na, X.; Wang, L. Effects of long-term monocropping on soil microbial metabolic activity and diversity in topsoil and subsoil horizons of Lycium barbarum fields. Acta Pratacult. Sin. 2023, 32, 89–98. [Google Scholar]
  11. Zhang, J.; Li, M.; Zheng, G. Effect of stand age on soil microbial community structure in wolfberry (Lycium barbarum L.) fields. Acta Ecol. Sin. 2017, 37, 10–17. [Google Scholar] [CrossRef]
  12. Zhang, J.; Li, M.; Jia, K.; Zheng, G.; Long, X. Seasonal variation rather than stand age determines bacterial diversity in the rhizosphere of wolfberry (Lycium barbarum L.) associated with soil degradation. J. Soils Sediments 2018, 18, 1518–1529. [Google Scholar] [CrossRef]
  13. Na, X.; Zheng, G.; Xing, Z.; Ma, J.; Li, Z.; Lu, J.; Ma, F. Effects of monocropping on diversity and structure of the bacterial community in rhizosphere of replanted Lycium barbarum L. Acta Pedol. Sin. 2017, 54, 1280–1292. [Google Scholar]
  14. Ma, S.; Ma, C.; Xu, P.; Zheng, G.; Na, X. Effects of long-term monocropping of Lycium barbarum L. on function and composition of fungal community in rhizosphere of replanted Lycium barbarum L. Acta Pedol. Sin. 2019, 56, 1493–1503. [Google Scholar]
  15. Li, Y.; Zou, N.; Liang, X.; Zhou, X.; Guo, S.; Wang, Y.; Qin, X.; Tian, Y.; Lin, J. Effects of nitrogen input on soil bacterial community structure and soil nitrogen cycling in the rhizosphere soil of Lycium barbarum L. Front. Microbiol. 2023, 13, 1070817. [Google Scholar] [CrossRef]
  16. Hou, L.; Liu, Z.; Zhao, J.; Ma, P.; Xu, X. Comprehensive assessment of fertilization spatial variability of soil chemical properties and relationships among nutrients, apple yield and orchard age: A case study in Luochuan County, China. Ecol. Indic. 2021, 122, 107285. [Google Scholar] [CrossRef]
  17. Sánchez, P.A.; Ahamed, S.; Carré, F.; Hartemink, A.E.; Hempel, J.; Huising, J.; Lagacherie, P.; McBratney, A.B.; Mckenzie, N.J.; Mendonça-Santos, M.D.; et al. Digital soil map of the world. Science 2009, 325, 680–681. [Google Scholar] [CrossRef]
  18. Feng, Z.; Xiao, Y.; Li, N.; Gao, Q.; Wang, J.; Chen, S.; Xing, R. Effects of root rot on microbial communities associated with goji berry (Lycium barbarum) in the Qaidam Basin, China. Eur. J. Plant Pathol. 2023, 167, 853–866. [Google Scholar] [CrossRef]
  19. Ma, Y.; Wang, Z.; Li, Y.; Feng, X.; Song, L.; Gao, H.; Cao, B. Fruit morphological and nutritional quality features of goji berry (Lycium barbarum L.) during fruit development. Sci. Hortic. 2023, 308, 111555. [Google Scholar] [CrossRef]
  20. Sokol, N.W.; Bradford, M.A. Microbial formation of stable soil carbon is more efficient from belowground than aboveground input. Nat. Geosci. 2018, 12, 46–53. [Google Scholar] [CrossRef]
  21. Wilschut, R.A.; Van der Putten, W.H.; Garbeva, P.; Harkes, P.; Harkes, K.; Kulkarni, P.; Martens, H.; Geisen, S. Root traits and belowground herbivores relate to plant-soil feedback variation among congeners. Nat. Commun. 2019, 10, 1564. [Google Scholar] [CrossRef]
  22. Yan, Y.; Tian, J.; Fan, M.; Zhang, F.; Li, X.; Christie, P.; Chen, H.; Lee, J.; Kuzyakov, Y.; Six, J. Soil organic carbon and total nitrogen in intensively managed arable soils. Agric. Ecosyst. Environ. 2012, 150, 102–110. [Google Scholar] [CrossRef]
  23. Zheng, S.; Hu, J.; Chen, K.; Yao, J.; Yu, Z.; Lin, X. Soil microbial activity measured by microcalorimetry in response to long-term fertilization regimes and available phosphorous on heat evolution. Soil Biol. Biochem. 2009, 41, 2094–2099. [Google Scholar] [CrossRef]
  24. Zhang, K.; Shi, Y.; Cui, X.; Yue, P.; Li, K.; Liu, X.; Tripathi, B.M.; Chu, H. Salinity is a key determinant for soil microbial communities in a desert ecosystem. mSystems 2019, 4, e00225-18. [Google Scholar] [CrossRef]
  25. Yang, Y.; Shi, G.; Liu, Y.; Ma, L.; Zhang, Z.; Jiang, S.; Pan, J.; Zhang, Q.; Yao, B.; Zhou, H.; et al. Experimental warming has not affected the changes in soil organic carbon during the growing season in an alpine meadow ecosystem on the Qinghai-Tibet Plateau. Front. Plant Sci. 2022, 13, 847680. [Google Scholar] [CrossRef]
  26. Klaus, F.; Tscharntke, T.; Bischoff, G.; Grass, I. Floral resource diversification promotes solitary bee reproduction and may offset insecticide effects: Evidence from a semi-field experiment. Ecol. Lett. 2021, 24, 668–675. [Google Scholar] [CrossRef]
  27. Zhang, J.; Liu, Y.X.; Zhang, N.; Hu, B.; Jin, T.; Xu, H.; Qin, Y.; Yan, P.; Zhang, X.; Guo, X.; et al. NRT1.1B is associated with root microbiota composition and nitrogen use in field-grown rice. Nat. Biotechnol. 2019, 37, 676–684. [Google Scholar] [CrossRef]
  28. Doetterl, S.; Stevens, A.; Six, J.; Merckx, R.; Oost, K.V.; Pinto, M.C.; Casanova-Katny, A.; Muñoz, C.; Boudin, M.; Venegas, E.Z.; et al. Soil carbon storage controlled by interactions between geochemistry and climate. Nat. Geosci. 2015, 8, 780–783. [Google Scholar]
  29. Liu, Z.; Shao, M.; Wang, Y. Spatial patterns of soil total nitrogen and soil total phosphorus across the entire Loess Plateau region of China. Geoderma 2013, 197, 67–78. [Google Scholar] [CrossRef]
  30. Wang, F.; Li, W.; Lin, Y.; Nan, X.; Yuan, J. Soil organic carbon pool and the production of goji berry (Lycium barbarum L.) as affected by different fertilizer combinations under drip fertigation. Front. Environ. Sci. 2022, 10, 933124. [Google Scholar]
  31. Wang, M.; Chen, L.; Li, Y.; Chen, L.; Liu, Z.; Wang, X.; Yan, P.; Qin, S. Responses of soil microbial communities to a short-term application of seaweed fertilizer revealed by deep amplicon sequencing. Appl. Soil Ecol. 2018, 125, 288–296. [Google Scholar] [CrossRef]
  32. Smith-Ramesh, L.M.; Reynolds, H.L. The next frontier of plant-soil feedback research: Unraveling context dependence across biotic and abiotic gradients. J. Veg. Sci. 2017, 28, 484–494. [Google Scholar] [CrossRef]
  33. Di, D.; Wu, J.; Ma, M.; Li, G.; Wang, M.; Kronzucker, H.J.; Shi, W. PIN5 is involved in regulating NH4+ efflux and primary root growth under high-ammonium stress via mediating intracellular auxin transport. Plant Soil 2023, 1–16. [Google Scholar] [CrossRef]
  34. Beeckman, F.; Motte, H.; Beeckman, T. Nitrification in agricultural soils: Impact factors and mitigation. Curr. Opin. Biotechnol. 2018, 50, 166–173. [Google Scholar] [CrossRef]
  35. Han, J.; Shi, J.; Zeng, L.; Xu, J.; Wu, L. Impacts of continuous excessive fertilization on soil potential nitrification activity and nitrifying microbial community dynamics in greenhouse system. J. Soils Sediments. 2017, 17, 471–480. [Google Scholar] [CrossRef]
  36. Zhang, Y.; Hou, K.; Qian, H.; Gao, Y.; Fang, Y.; Xiao, S.; Tang, S.; Zhang, Q.; Qu, W.; Ren, W. Characterization of soil salinization and its driving factors in a typical irrigation area of Northwest China. Sci. Total Environ. 2022, 837, 155808. [Google Scholar] [CrossRef]
  37. Zhao, H.; Li, L.; Fan, G.; Xie, S.; Li, F. Effects of aerated brackish water irrigation on growth of Lycium barbarum seedlings. Sci. Hortic. 2023, 310, 111721. [Google Scholar] [CrossRef]
  38. Qiu, L.; Kong, W.; Zhu, H.; Zhang, Q.; Banerjee, S.; Ishii, S.; Sadowsky, M.J.; Gao, J.; Feng, C.; Wang, J.; et al. Halophytes increase rhizosphere microbial diversity, network complexity, and function in inland saline ecosystem. Sci. Total Environ. 2022, 831, 154944. [Google Scholar] [CrossRef]
  39. Qiao, J.; Zhu, Y.; Jia, X.; Huang, L.; Shao, M. Vertical distribution of soil total nitrogen and soil total phosphorus in the critical zone on the Loess Plateau, China. Catena. 2018, 166, 310–316. [Google Scholar] [CrossRef]
  40. Van der Putten, W.H.; Bardgett, R.D.; Bever, J.D.; Bezemer, T.M.; Casper, B.B.; Fukami, T.; Kardol, P.; Klironomos, J.N.; Kulmatiski, A.; Schweitzer, J.A.; et al. Plant-soil feedbacks: The past, the present and future challenges. J. Ecol. 2013, 101, 265–276. [Google Scholar] [CrossRef]
  41. Mazzoleni, S.; Bonanomi, G.; Incerti, G.; Chiusano, M.L.; Termolino, P.; Mingo, A.; Senatore, M.; Giannino, F.; Cartenì, F.; Rietkerk, M.; et al. Inhibitory and toxic effects of extracellular self-DNA in litter: A mechanism for negative plant-soil feedbacks? New Phytol. 2015, 205, 1195–1210. [Google Scholar] [CrossRef] [PubMed]
  42. Song, Y.; Peng, T.; Ma, S.; Ma, C.; Gao, N.; Li, K.; Zhang, C.; Pu, M.; Na, X. Analyzing the autotoxicity of phenolic acids from Lycium barbarum L. leaves. Jiangsu J. Agric. Sci. 2024, 2, 213–222. [Google Scholar]
  43. Liu, J.; Li, X.; Jia, Z.; Zhang, T.; Wang, X. Effect of benzoic acid on soil microbial communities associated with soilborne peanut diseases. Appl. Soil Ecol. 2017, 110, 34–42. [Google Scholar] [CrossRef]
Figure 1. Sampling sties and pot experiment design of the present study. (a) The locations of the sample sites in Ningxia Hui Autonomous Region and Gansu Province. The black points represent the sites where soil samples were collected. (b) Schematic figure of the pot experimental design.
Agronomy 14 02525 g001
Figure 2. Comparative analysis of soil abiotic properties, shoot fresh weights, and plantsoil feedback rates across distinct soil depths of L. barbarum fields. (a) Differences in total organic carbon, (b) dissolved organic carbon, (c) total nitrogen, (d) dissolved nitrogen, (e) total phosphorus, (f) available phosphorus content, (g) electrical conductivity, and (h) soil pH between topsoil and subsoil samples. (i) Variances in fresh shoot weight and (j) plantsoil feedback ratio between topsoil and subsoil of the fields. The black line indicates the average value of each parameter. Effect size was expressed as η2. Statistical significance was calculated using a paired t-test (n = 165).
Agronomy 14 02525 g002
Figure 3. Differences in soil abiotic properties between samples exhibiting positive and negative plantsoil feedback patterns in the topsoil (a) and subsoil (b) of goji fields. The black line indicates the mean value for each property. Statistical significance was assessed using Welch’s t-test. Effect size is denoted as η2. The number of positive plantsoil feedback samples in topsoil is 40; negative samples in topsoil, 125; positive samples in subsoil, 52; negative samples in subsoil, 113.
Agronomy 14 02525 g003
Figure 4. Random forest model predicting the shift in fresh shoot weight of L. barbarum seedlings cultivated in different soil samples. (a) Importance ranking of the variables used to predict the changes in fresh shoot weight of L. barbarum seedlings cultivated in topsoil and (b) subsoil. (c) Ranking of the variables used to predict plantsoil feedback ratio in the topsoil and (d) subsoil samples. AP represents available phosphorus; DN, dissolved nitrogen; DOC, dissolved organic carbon; EC, electrical conductivity; TN, total nitrogen; TOC, total organic carbon; TP, total phosphorus; SD, stem diameter.
Agronomy 14 02525 g004
Figure 5. Relationships between soil abiotic properties and growth performance of goji seedlings. (a) Liner regression analysis showing the relationships between fresh shoot weight of goji seedlings and the crucial soil abiotic properties detected via random forest model in the topsoil and (b) subsoil samples. The shadow indicates a 95% confidence interval. AP represents available phosphorus; DN, dissolved nitrogen; DOC, dissolved organic carbon; EC, electrical conductivity; TN, total nitrogen; TOC, total organic carbon; TP, total phosphorus; SD, stem diameter.
Agronomy 14 02525 g005
Figure 6. Relationships between soil abiotic properties and plantsoil feedback rates. (a) Liner regression analysis detecting the relationships between plantsoil feedback values and the variables selected by the final random forest model in the topsoil and (b) subsoil samples. The shadows indicate a 95% confidence interval. AP indicates available phosphorus; DN, dissolved nitrogen; DOC, dissolved organic carbon; EC, electrical conductivity; TN, total nitrogen; TOC, total organic carbon; TP, total phosphorus; SD, stem diameter.
Agronomy 14 02525 g006
Figure 7. Two-dimensional ordination diagram showing the results of redundancy analysis (RDA) in different soil depths of L. barbarum fields. (a) RDA of soil abiotic properties on fresh shoot weight and plantsoil feedback in topsoil. (b) RDA of soil abiotic properties on fresh shoot weight and plantsoil feedback in subsoil. AP indicates available phosphorus; DN, dissolved nitrogen; DOC, dissolved organic carbon; EC, electrical conductivity; TN, total nitrogen; TOC, total organic carbon; TP, total phosphorus; FSW, fresh shoot weight; PSF, plantsoil feedback.
Agronomy 14 02525 g007
Table 1. Partial correlation analysis determining the Spearman correlation coefficients between stem diameter of L. barbarum sampling and the fresh shoot weight or plant-soil feedback ratio in different soil depths.
Soil DepthControlling FactorFresh Shoot WeightPlantSoil Feedback Ratio
TopsoilSoil abiotic property−0.156 NS−0.241 **
Subsoil0.117 NS−0.080 NS
Note: NS indicates no significance; **, p < 0.01; n = 165.
Disclaimer/Publisher’s Note: The statements, opinions and data contained in all publications are solely those of the individual author(s) and contributor(s) and not of MDPI and/or the editor(s). MDPI and/or the editor(s) disclaim responsibility for any injury to people or property resulting from any ideas, methods, instructions or products referred to in the content.

