Article

γ-Aminobutyric Acid Alleviates Salinity-Induced Impairments in Rice Plants by Improving Photosynthesis and Upregulating Osmoprotectants and Antioxidants

1
Jiangsu Key Laboratory of Crop Genetics and Physiology/Jiangsu Key Laboratory of Crop Cultivation and Physiology, Agricultural College, Yangzhou University, Yangzhou 225009, China
2
Jiangsu Co-Innovation Center for Modern Production Technology of Grain Crops, Yangzhou University, Yangzhou 225009, China
*
Authors to whom correspondence should be addressed.
Agronomy 2024, 14(11), 2524; https://doi.org/10.3390/agronomy14112524
Submission received: 26 September 2024 / Revised: 22 October 2024 / Accepted: 25 October 2024 / Published: 27 October 2024
(This article belongs to the Section Plant-Crop Biology and Biochemistry)

Abstract

:
Salt stress is a significant abiotic stress that hinders the growth of rice (Oryza sativa L.) and reduces their yield. Previous research has examined the synthesis of γ-aminobutyric acid (GABA) and its role in plant resistance under various abiotic stresses. However, the synthesis of GABA and its ability to mitigate damage caused by salt stress—particularly its effects on osmotic adjustment, antioxidant defense, photosynthesis, and overall plant growth throughout the entire rice lifecycle—remains unclear. Therefore, we conducted two experiments using salt-tolerant rice cultivar Lianjian 5 (J-5) and salt-susceptible cultivar Lianjing 7 (L-7). In Experiment I, RNA-seq (RNA sequencing) was used to analyze the differential expression of the transcriptome between CK and salinity treatments, revealing the key roles of GABA in salt tolerance. In Experiment II, different levels of exogenous GABA were applied to salt-stressed plants to investigate its physiological role in enhancing salt tolerance. Therefore, RNA-seq (RNA sequencing) was used to analyze the differential expression of the transcriptome between CK and salinity treatments, revealing the key roles of GABA in salt tolerance. Subsequently, different levels of exogenous GABA were applied to salt-stressed plants to investigate its physiological role in enhancing salt tolerance. We measured the activities of superoxide dismutase, peroxidase, and catalase, as well as photosynthetic characteristics such as photosynthesis, transpiration, chlorophyll content, stomatal density and size, and leaf anatomical features. The RNA-seq analysis revealed that GABA production is enhanced via the glutamate decarboxylase (GAD) gene (LOC4333932) in the salt-resistant rice cultivar. Exogenous GABA application improves salt-stress tolerance by increasing endogenous ABA and GABA contents, which enhance osmotic adjustment, boost antioxidant defenses, and regulate ion balance. These combined effects help maintain photosynthetic efficiency and support overall plant growth under salt-stressed environments. Additionally, the increased proportion of mesophyll cell periphery covered by chloroplasts (Sc/Sm) indicated enhanced mesophyll conductance. These helped maintain photosynthesis under saline conditions while reducing water consumption.

1. Introduction

Globally, over 800 million hectares of fields are affected by salinity, and the area affected by soil salinization is increasing by 1 to 2 million hectares per year [1]. Asia accounts for around 30% of the world’s saline soils, with China possessing the largest proportion of saline-affected land in the region [2,3]. As the demand for food continues to grow, utilizing saline land presents a viable alternative solution. Rice (Oryza sativa L.) is one of the most important staple foods for the world population [4]. Rice is often used as a pioneer crop for reclaiming salt-affected mudflat soils. The irrigation water helps flush out salts from the soil, decreasing the harmful effects of salinity on plants. This not only enables rice to grow in saline-affected land, but also improves the soil for future crop growth [5,6]. As a result, rice cultivation serves as an effective strategy for rehabilitating saline soils and supporting long-term agricultural sustainability [7].
Rice is sensitive to salinity stress, especially at the early growth stages. Soil salinity levels above the critical threshold (3.0 dS m−1) can result in substantial reductions in plant height, tillering, and grain yield [8,9,10]. Salinity affects lots of physiological processes like water uptake, nutrient balance, and photosynthesis, often resulting in stunted growth and poor crop performance [11,12,13]. To cope with and withstand salt stress, plants have developed a range of physiological and biochemical mechanisms, regulated by interconnected pathways, that help them maintain functionality under adverse conditions. These mechanisms involve ion homeostasis, which controls the balance of toxic and essential ions to prevent damage; osmolyte synthesis, which helps stabilize cellular structures and maintain osmotic pressure; reactive oxygen species (ROS) scavenging, which protects the plant from oxidative damage; and hormonal regulation, which modulates growth and stress responses [9,10]. Together, these pathways form a sophisticated network that enables plants to adapt to salinity and mitigate its harmful effects on growth and productivity [14,15,16]. Recent reports have indicated that the salinity tolerance of plants was improved by regulating the antioxidant capacity of plants through enzymes or genes [14]. For example, Liu et al. (2023) showed that the protein phosphatase PC1 dephosphorylates and deactivates CatC (catalase class III), which negatively regulates H2O2 homeostasis and reduces salt tolerance in rice [14]. Rice’s response to salt stress involves various physiological processes that play key roles in osmoregulation, antioxidation, and ion homeostasis [10]. These components collaborate to enable the plant to cope with salt stress by regulating water balance, neutralizing reactive oxygen species, and maintaining ion equilibrium, all of which are critical for rice survival under saline conditions [17,18,19]. γ-aminobutyric acid (GABA) is ubiquitously found across a diverse range of organisms, including bacteria, yeasts, vertebrates, and plants [20]. In plants, GABA plays a crucial role in stress responses, as its levels increase significantly when the plant is subjected to various environmental challenges such as salinity, hypoxia, and heat shock [21]. This rapid accumulation of GABA is thought to be part of the plant’s adaptive defense mechanism to cope with adverse conditions. However, the exact biological role of GABA in plants under stressed environments is still not fully understood, as with, for example, the role of GABA in the movement of stomata [22].
GABA is synthesized from glutamate through an irreversible decarboxylation reaction catalyzed by glutamate decarboxylase (GAD) in the cytosol [21]. Alternatively, GABA can be produced via the polyamine metabolic pathway [21]. GABA metabolism plays a role in nitrogen recycling and redistribution during leaf senescence triggered by abiotic stress [21]. Furthermore, GABA helps regulate cytosolic pH and serves as an osmoregulatory molecule [23]. Pre-treating citrus seeds with GABA before exposure to high NaCl levels has been shown to enhance seed adaptation to saline conditions, leading to higher germination rates and longer radicle growth [24]. Exogenous GABA affects carbon and nitrogen metabolism by regulating the GABA shunt pathway in maize seedlings under salt stress [25]. Additionally, exogenous GABA alleviates the detrimental effects of salinity stress in mungbean plants [26]. In tomato seedlings, exogenous GABA enhances resistance to salt stress by limiting Na+ uptake and transport and boosting antioxidant metabolism [27]. However, the effects of GABA on rice under salt stress, particularly regarding photosynthesis, remain unclear.
Salt resistance is a complex, multi-gene, multi-physiological pathway regulation process [28]. RNA-seq (RNA sequencing) is a powerful tool for analyzing the transcriptome. It provides insights into gene expression patterns, including on which genes are up-regulated or down-regulated by environmental factors [28,29]. In the context of salinity stress resistance, RNA-seq can be utilized to identify key regulatory genes, pathways, and networks involved in stress adaptation and tolerance, helping to uncover the complex mechanisms that regulate plant responses to salinity [29]. For example, the transcriptomic analysis identified 371 differentially expressed genes (DEGs) in rice, which were associated with the salt tolerance, with ubiquitination-related genes showing the most responsive patterns [30]. We hypothesized that variations in transcriptome expression patterns could help uncover the mechanisms behind the differing salt tolerance between genotypes. Therefore, in this study, we utilized two rice cultivars: the salt-tolerant Lianjian 5 (J-5) and the salt-susceptible Lianjing 7 (L-7). Comparative transcriptomic analysis was conducted to examine their responses to salt stress under control conditions (CK) and salt-stressed environments, revealing that GABA positively influenced salt tolerance in rice. Therefore, we applied GABA exogenously at varying levels and evaluated its effects on yield and yield components, chloroplast and stomatal ultrastructure, antioxidant enzyme activities, chlorophyll content, and other biochemical parameters.

2. Materials and Methods

2.1. Rice (Oryza sativa L.) Cultivation and Experimental Design

Based on our previous studies [6], salt-tolerant rice cultivar J-5 (Lianjian 5 was provided by Lianyungang Academy of Agricultural Sciences) and salt-susceptible cultivar L-7 (Lianjing 7 was purchased from Jiangsu Kingearth Seed Co., Ltd., Yangzhou, China) were selected and used in this study in the growing seasons (May–October) of 2020 and 2021. J-5 was provided by the Lianyungang Academy of Agricultural Sciences, and L-7 was purchased from Jiangsu Kingearth Seed Co., Ltd. Seeds were sown on 12 May on seedbed and transplanted into pots on 12 June, with three hills per pot and two seedlings per hill. Each pot contained 13 kg of soil. Each pot received 2 g of urea and 0.5 g of KH2PO4 as basal fertilizer. To further support plant growth, 1 g of urea was added to each pot 7 days after transplanting, at the jointing stage, and at panicle differentiation, respectively.
In this study, two experiments were conducted. In Experiment I, there were two treatments: a control (CK) and a 0.2% salt stress treatment. Prior to transplanting, sea salt (Blue Starfish Salt Product Co., Ltd., Hangzhou, China) was added to the pots. For the CK and salt stress treatments (0.2%), 0 g and 26 g of salt were applied, respectively. In experiment II, for the salt stress treatment (0.2%), four concentrations of exogenous GABA (0 μM, 50 μM, 100 μM, and 150 μM) were sprayed to assess its effects on plant growth. All the spray solutions contained Tween-20 of a final concentration of 0.02% (v/v) as a surfactant. GABA was applied to both sides of the leaves during the pre-tillering and jointing stages manually. Spraying was carried out every two days for a total of seven days at 18:00. For the salt treatment, a soil salinity meter (TR-6D, Shunkeda, Beijing, China) was used to monitor and maintain stable soil salinity during the plant growth period (Table 1).

2.2. RNA Extraction, RNA-Seq, and Transcriptome Analysis

The two parent cultivars, L-7 and J-5, were grown under 0.2% salt stress and CK treatments, with samples collected at panicle initiation (PI), flowering stage (FS), and maturity (MA). The top fully expanded leaf at PI and the flag leaves at the FS and MA were sampled and immediately frozen in liquid nitrogen. Total RNA was isolated using an RNAsimple kit (DP419, TIANGEN, Beijing, China). The contamination of genomic DNA was treated with DNaseI (Takara, Kusatus, Shiga, Japan). RNA quantity and purity were assessed. The mRNA was purified and then sequencing was conducted on the BGISEQ-500 platform (BGI, Shenzhen, China).
Raw reads were filtered with SOAPnuke v1.5.2, and clean reads were mapped to the reference genome using HISAT, with genome and gene annotations sourced from Kim et al. [31]. Differential gene expression between J-5 and L-7 was analyzed using the Dr. Tom platform (BGI-Shenzhen, China). p < 0.001 was considered significant. KEGG pathway enrichment was conducted, and GO annotation of candidate genes was performed with agriGO.

2.3. Chlorophyll Content, SPAD Value, Relative Growth Rate, and Leaf Photosynthesis

At flowering stage, chlorophyll a (Chl a) and chlorophyll b (Chl b) concentrations of flag leaf were determined following the method of Jin et al. [32]. The portable chlorophyll (Chl) meter SPAD-502 Plus (Konica Minolta Optics, Tokyo, Japan) was used to measure leaf SPAD value. Rice plants were sampled at each stage, dried at 105 °C for 30 min, and then at 75 °C until they had a constant weight. The dry weight was used to calculate the relative growth rate (RGR) using the following equation:
R G R = W 2 W 1 T 2 T 1
where W1 and W2 represent the biomass at times T1 and T2, respectively.
At the MT, PI, FS, and MA stages, the net photosynthetic rate (Pn) and transpiration rate (Tr) of the top fully expanded leaf were measured using a portable photosynthesis system (LI-6400XT, LI-COR Inc., Lincoln, NE, USA) with a red–blue leaf chamber. Measurements were taken between 09:00 and 11:00 on sunny days, with the photosynthetic photon flux density set to 1000 μmol m−2 s−1 and the CO2 concentration regulated at 400 μmol mol−1.

2.4. Stomatal Morphology

Flag leaves were sampled at the flowering stage for stomatal measurements using the silicon rubber impression technique, as described by Jerbi et al. [33]. Stomatal counts and dimensions were measured on the abaxial epidermal surface, from the middle section between the leaf tip and base, avoiding the veins. Stomatal length (SL), width (SW), and pore dimensions were measured on 10 randomly selected stomata using a Zeiss Axio Imager Z1 microscope (Leica Biosystems, Buffalo Grove, IL, USA) and viewed with Aperio Image Scope software 12.4.6 (Leica Biosystems Imaging, Vista, CA, USA). Stomatal area (SA) was calculated as follows:
SA = π × SL × SW 4
Stomatal density (SD) is the number of stomata per area, which was measured by counting stomata over an area of 2500 μm2. Stomatal density and stomatal area were then used to calculate the total stomatal pore area index (SPI) [34] as follows:
SPI = SA × SD

2.5. The Surface Area of Mesophyll Cells Exposed to Intercellular Airspace per Leaf Area (Sm) and the Surface Area of Chloroplasts Exposed to Intercellular Airspace per Leaf Area (Sc)

Flag leaf sections (0.5 to 1 cm) at the flowering stage were fixed in precooled 2.5% glutaraldehyde in phosphate buffer for 6 h, washed, treated overnight with 1% OsO4, processed, embedded in paraffin wax, and observed using an HT7800 transmission electron microscope (Hitachi, Tokyo, Japan).
Transmission electron microscopy (TEM) pictures were used in this analysis, obtaining the total length of the mesophyll cell wall exposed to intercellular airspace (IAS) (lm), and the width of the analyzed leaf cross section (L). The surface area of mesophyll cells exposed to the IAS per leaf area (Sm) was determined using the following formula:
S m = l m L   ×   F
where F is the curvature correction factor, set at 1.42 based on a previous study [35]. The chloroplast surface area exposed to the IAS per leaf area (Sc) was calculated using the following formula:
S c = S m × l c l m
where lc is the total length of the chloroplasts adjacent to IAS on images [36]. Then, the proportion of the mesophyll cell periphery covered by chloroplasts (Sc/Sm) could be calculated.

2.6. The Contents of GABA, ABA, Malondialdehyde, Proline, and Fructose Content

Flag leaves were sampled at MT, PI, FS, and MA to measure the content of GABA and ABA. The GABA content was measured according to the method of Xie et al. [37]. The ABA content was measured following the method of Xu et al. [38].
The flag leaves at FS were used to measure the content of malondialdehyde (MDA), proline (Pro), and fructose (Fru). Leaf MDA content was measured following the method of Li et al. [39]. While Pro and Fru contents were determined using the method of Nayyar et al. [40] and Li et al. [41], respectively.

2.7. The Activities of Superoxide Dismutase, Peroxidase, and Catalase

Flag leaves were sampled at the flowering stage, and 0.5 g of fresh tissue was used to measure the activities of superoxide dismutase (SOD), peroxidase (POD), and catalase (CAT), following the method of Gu et al. [42].

2.8. The Contents of Na+ and K+

Flag leaves were sampled at the flowering stage. An amount of 0.5 g of dry powder sample was mixed with 5 mL of concentrated nitric acid and 0.1 mL of 30% hydrogen peroxide, then digested in a microwave digester (MARS 5, CEM Corporation, Mathews, NC, USA). After heating and cooling, the volume was adjusted to 200 mL, with 2% nitric acid. The concentrations of Na+ and K+ were determined using ICP-OES (IRIS Intrepid II XSP, Thermo, Waltham, MA, USA).

2.9. Statistical Analysis

Analysis of variance (ANOVA) was conducted using SAS (version 9.2, SAS Institute, Cary, NC, USA). Tukey’s test (p < 0.05) was used for multiple comparisons. Correlation analysis of measured physiological traits was also conducted in SAS. Structural equation modeling was conducted using the ‘lavaan’ package in R 4.0.2 (https://cran.r-project.org/web/packages/lavaan/index.html; accessed on 1 September 2024).

3. Results

3.1. Transcriptomic Profiling of Rice Cultivars with Varying Salt Tolerance

The identification of genes with significant DEGs between CK and salt-stressed treatments are presented in Figure 1. The results showed that down-regulated and up-regulated genes were enriched at flowering stage. Compared with CK, 112 genes were down-regulated and 410 genes were up-regulated for J-5, and 677 genes were down-regulated and 1020 genes were up-regulated for L-7 under 0.2% salt stress, respectively (Figure 1A). KEGG analysis showed that these differential genes are distributed in five main KEGG pathways. Genes were enriched mainly in metabolism, including 202 genes in global and overview maps, 67 genes in carbohydrate metabolism, and 55 genes in amino acid metabolism (Figure 1C). GO enrichment analysis revealed that those DEGs of the salt-tolerant rice cultivar J-5 were enriched in elements involved in biological processes, such as in nitrogen metabolism, brassinosteroid biosynthesis, and alanine, aspartate, and glutamate metabolism, while for the salt-susceptible rice cultivar L-7, DEGs were enriched in glutathione metabolism, diterpenoid biosynthesis, and alanine, aspartate and glutamate metabolism (Figure 1D).

3.2. Analysis of Gene Expression of Metabolism of GABA

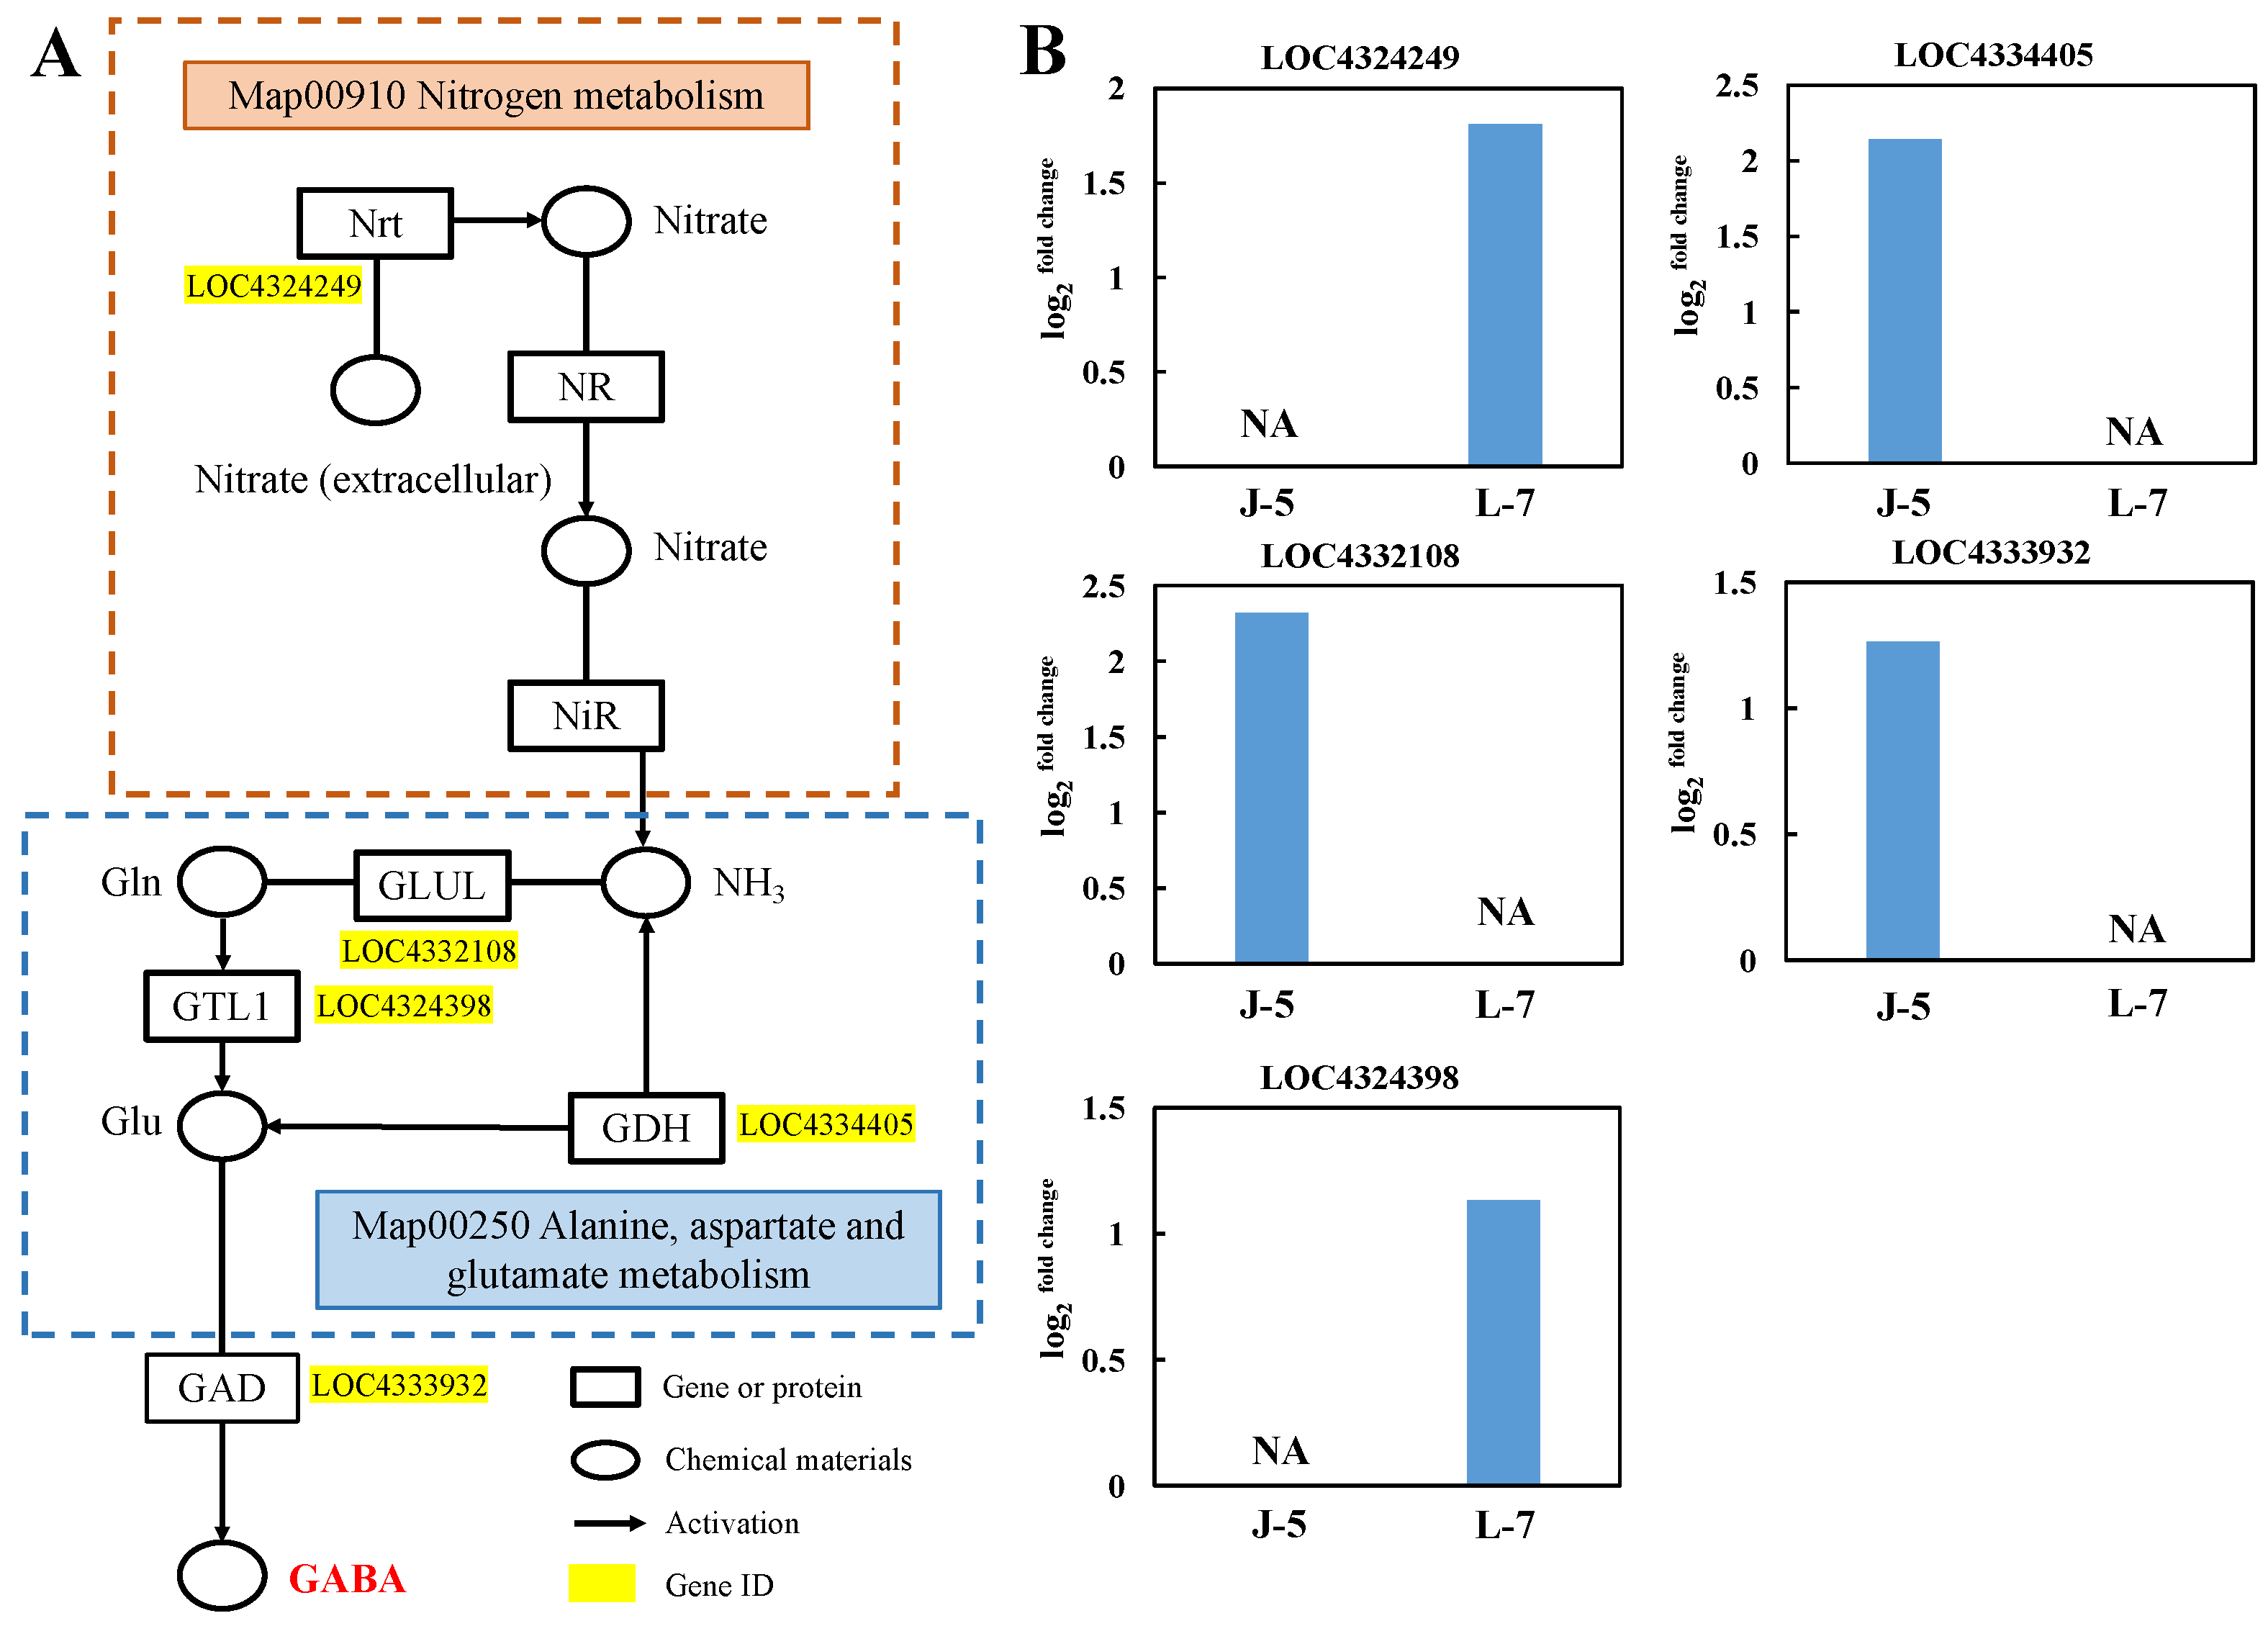
The analysis of nitrogen metabolism (map 00910) and alanine, aspartate, and glutamate metabolism (map 00250) showed that compared with salt-susceptible rice cultivar J-5, the expression of genes related to the GABA synthesis pathway in the salt-tolerant rice cultivar showed a significant increase, particularly for LOC4333932 (Figure 2). The up-regulation of the GABA synthesis gene in salt-tolerant rice cultivar indicated that the improvement in GABA content is of paramount importance for rice salt-stress tolerance.

3.3. Grain Yield

The exogenous application of GABA significantly increased the yields and yield components for both salt-tolerant rice cultivar and salt-susceptible rice cultivar under the 0.2% salinity stress in both years (Table 2). Compared with salt-tolerant rice cultivars, the increase in yield of salt-susceptible rice cultivars was higher under the exogenous application of GABA. Compared to the 0 μM GABA application, the yield of J-5 increased by 31.7%, 71.4%, and 88.7%, while the yield of L-7 increased by 45.8%, 50.1%, and 40.8% under 50 μM, 100 μM, and 150 μM GABA treatments, respectively, based on the two-year average (Table 2). The increases in yield of the salt-tolerant and salt-susceptible rice cultivars were mainly due to the significant increase in yield components. Compared to the 0 μM GABA application, the number of panicles per pot, total number of spikelets per pot, number of spikelets per panicle, filled grain rate, and 1000-grain weight consistently increased under 50 μM, 100 μM, and 150 μM GABA treatments. Meanwhile, the increase in grain yield and yield components of the salt-susceptible rice was significantly higher than that of the salt-tolerant rice with the application of exogenous GABA (Table 2).

3.4. Dry Matter Accumulation and Plant Growth Rate

Compared to the 0 μM GABA application, the dry matter weight of J-5 increased by an average of 21.9%, 40.3%, and 48.1%, while the dry matter weight of L-7 increased by 18.8%, 29.8%, and 37.8% at maturity under the 50 μM, 100 μM, and 150 μM GABA treatments, respectively, over two years (Table 3). Compared to the 0 μM GABA application, for the 50 μM, 100 μM, and 150 μM GABA treatments, the plant growth rate of J-5 increased by an average of 47.3%, 80.1%, and 95.4%, respectively, from the flowering stage to maturity; in L-7, the plant growth rate increased by 25.6%, 40.5%, and 46.9%, respectively, over two years (Table 3). During the panicle initiation to flowering stage, the application of exogenous GABA showed no significant difference in plant growth rate among the various GABA treatments for the salt-tolerant rice cultivar J-5 over the two years. However, for the salt-susceptible cultivar L-7, exogenous GABA application significantly enhanced plant growth during this period in both years (Table 3).

3.5. Transpiration Rate and Photosynthesis

We also measured the photosynthetic parameters under different levels of exogenous application of GABA at the MT, PI, FS, and MA over two years (Figure 3). Compared to the 0 μM GABA application, the photosynthetic rate significantly increased under the 50 μM, 100 μM, and 150 μM GABA treatments at the MT, PI, and FS, while the increase was not significant at the MA over two years (Figure 3A–D). Compared to the 0 μM GABA treatment, the transpiration rate significantly decreased under the 50 μM, 100 μM, and 150 μM GABA treatments during the MT, PI, and FS, but showed no significant difference at the MA over two years (Figure 3E–H).

3.6. Chlorophyll Content and SPAD Value

Compared to the 0 μM GABA treatment, as the concentration of exogenous GABA application increased, the content of Chl a and Chl b showed a continuous rise, though the increase was not significant at higher GABA concentrations (100 μM and 150 μM). Compared to the 0 μM GABA treatment, the exogenous application of GABA had no significant effect on the Chl a/Chl b ratio, and there was no genotypic difference between salt-tolerant and salt-susceptible rice cultivars over the two years (Table 4). Compared with the 0 μM GABA treatment, the SPAD value increased significantly under 50 μM, 100 μM, and 150 μM GABA treatments for both genotypes in two years (Table 4).

3.7. Stomatal Density and Size, and Leaf Anatomical Properties

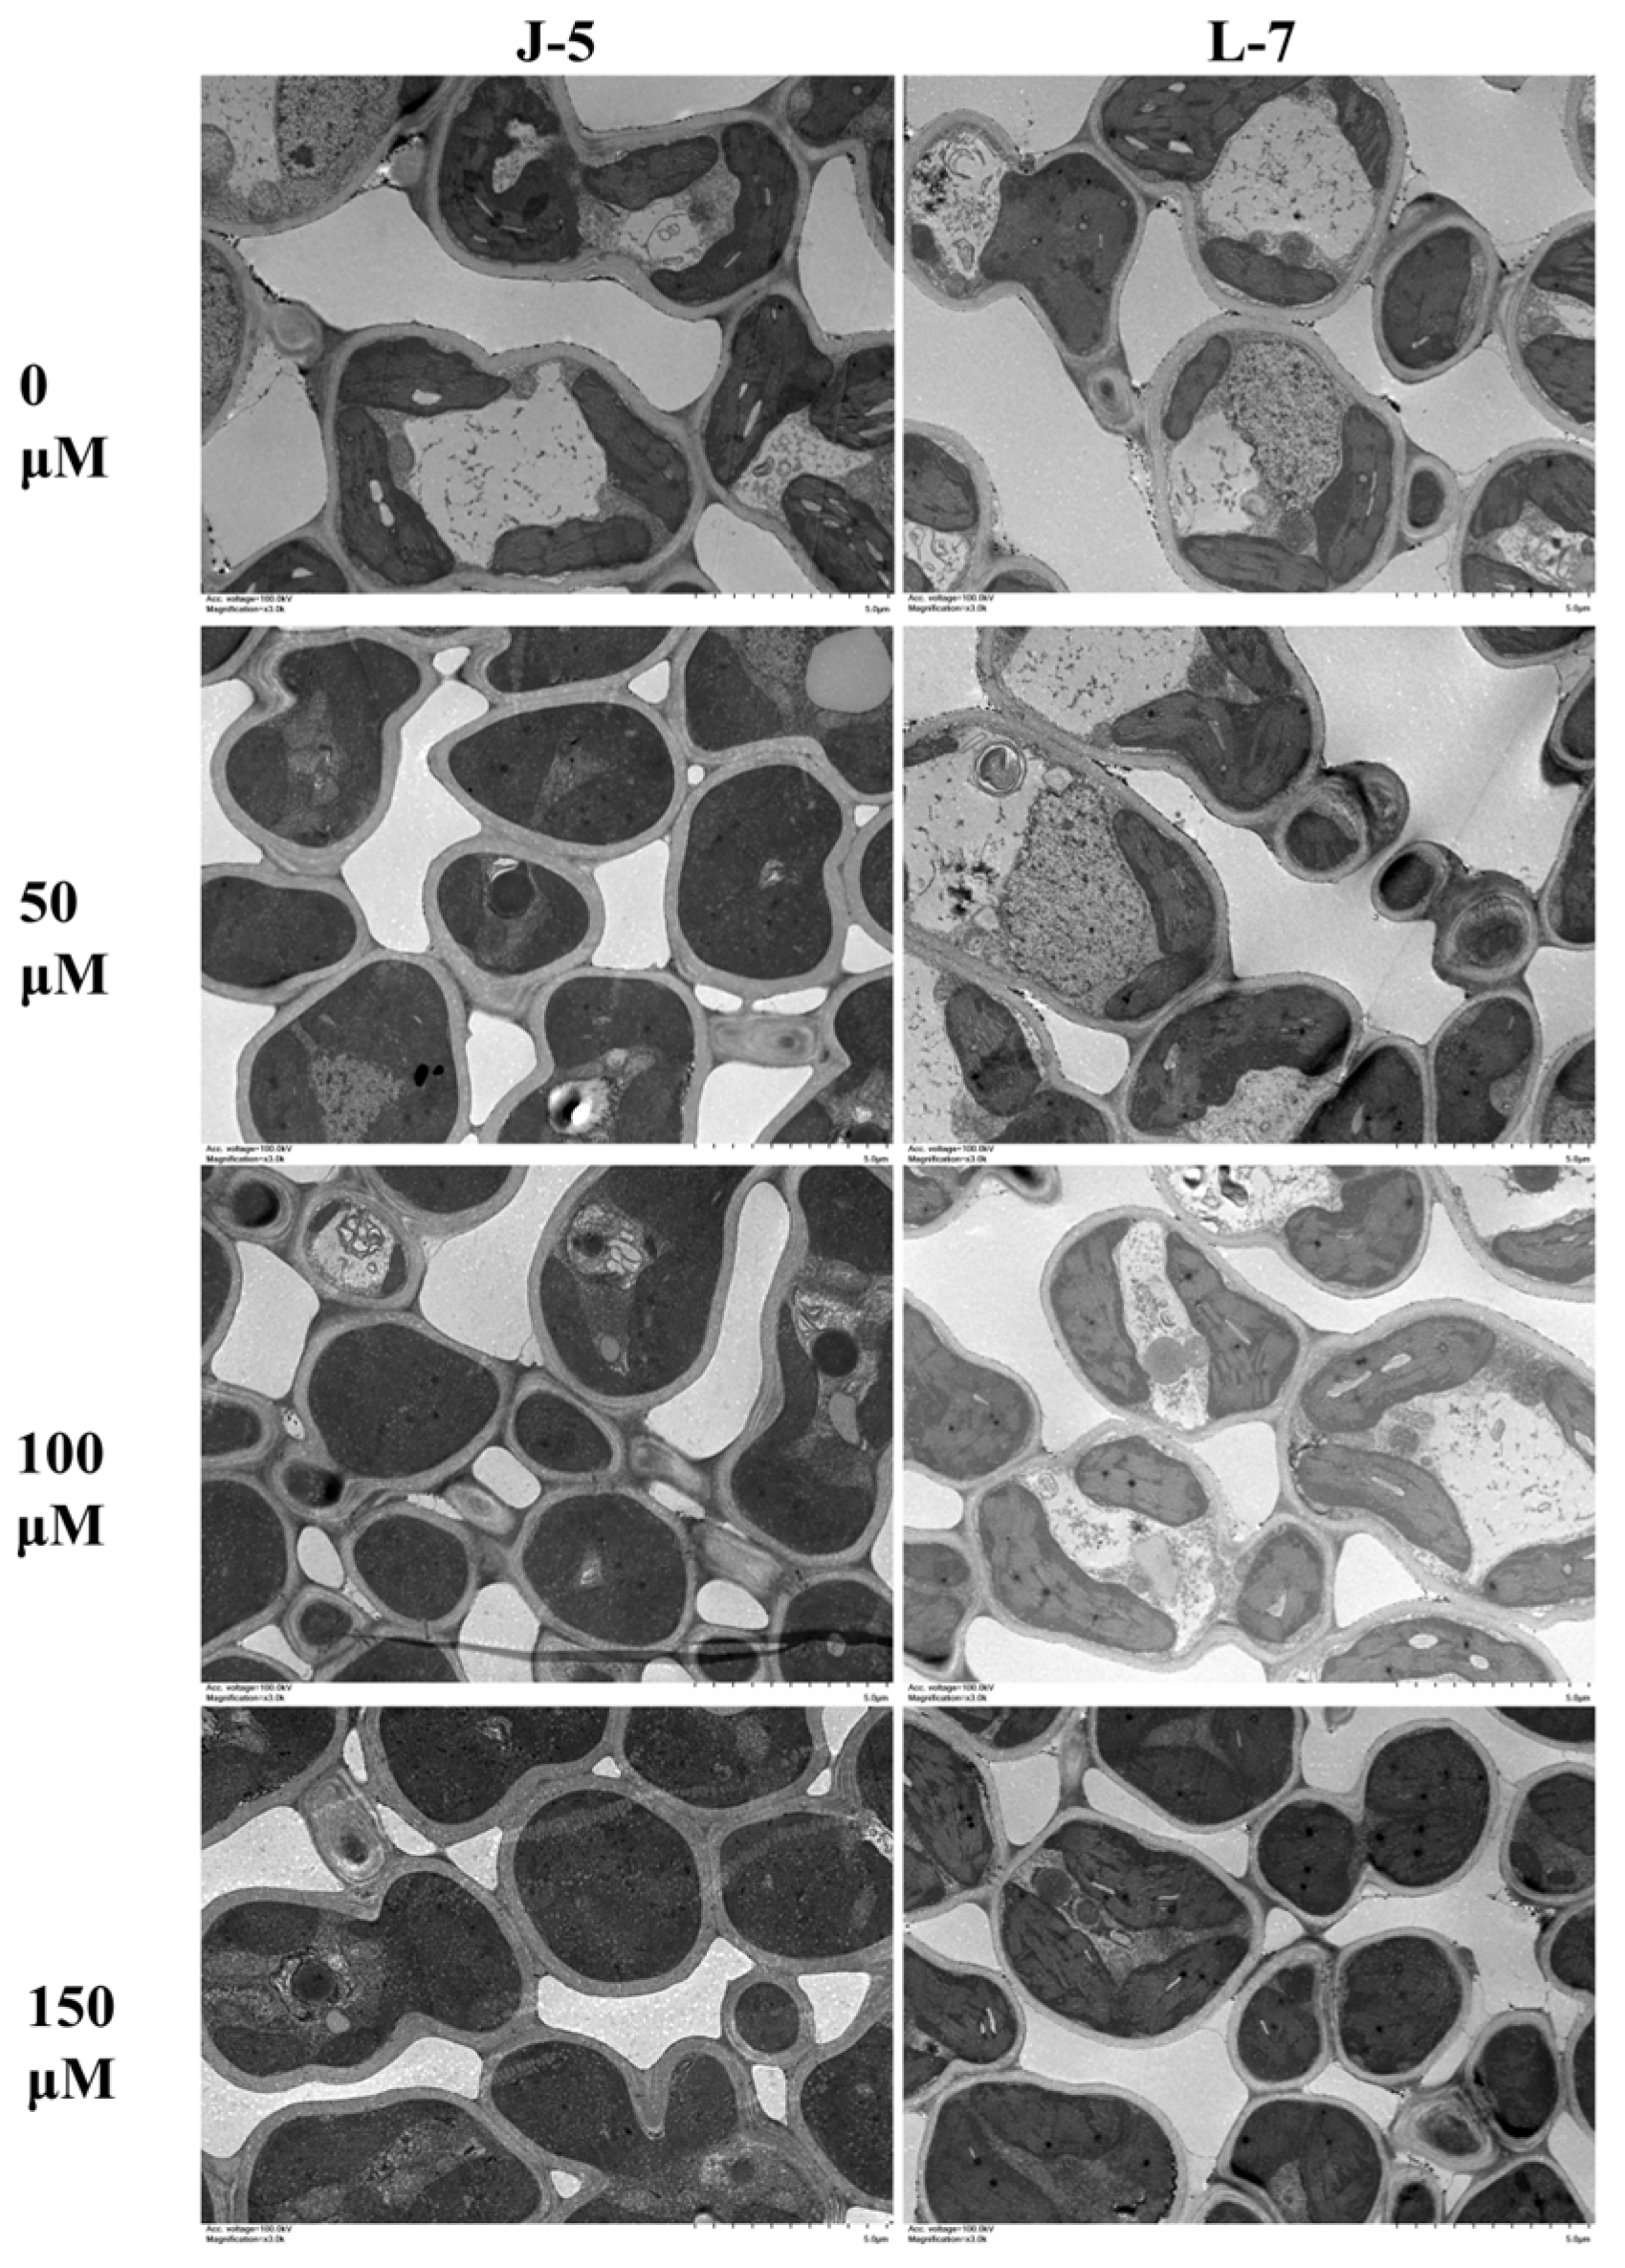
The light microscopy images of rice cultivar leaves under various GABA spray concentrations are presented in Figure 4, while Figure 5 displays the transmission electron microscope (TEM) images. The leaf anatomical traits are detailed in Table 5. Compared with the 0 μM GABA treatment, the stomatal length and width were increased significantly by increasing the levels of GABA. Higher exogenous GABA application significantly increased stomatal area, while the number of stomata per unit area decreased. These changes led to a reduction in SPI at higher GABA levels, aligning with the observed decrease in transpiration under elevated GABA treatments. The SPI was also significantly higher for salt-susceptible rice cultivar L-7, when compared with salt-tolerant rice cultivar J-5 (Table 5). Compared with the 0 μM GABA treatment, the SPI of the salt-tolerant rice cultivar J-5 decreased by 5.8%, 11.0%, and 16.1%, respectively, under the 50 μM, 100 μM, and 150 μM GABA treatments. Compared with the 0 μM GABA, the SPI of salt-susceptible rice cultivar L-7 was decreased by 5.4%, 13.6%, and 20.8%, respectively, under the 50 μM, 100 μM, and 150 μM GABA treatments. Sc, Sm, and Sc/Sm showed significant differences between different rice cultivars. The Sc, Sm, and Sc/Sm of L-7 was lower than for J-5 (Table 5). Compared to the 0 μM GABA treatment, the application of exogenous GABA at 50 μM, 100 μM, and 150 μM significantly increased Sc, Sm, and the value of Sc/Sm.

3.8. Contents of GABA and ABA in Flag Leaf

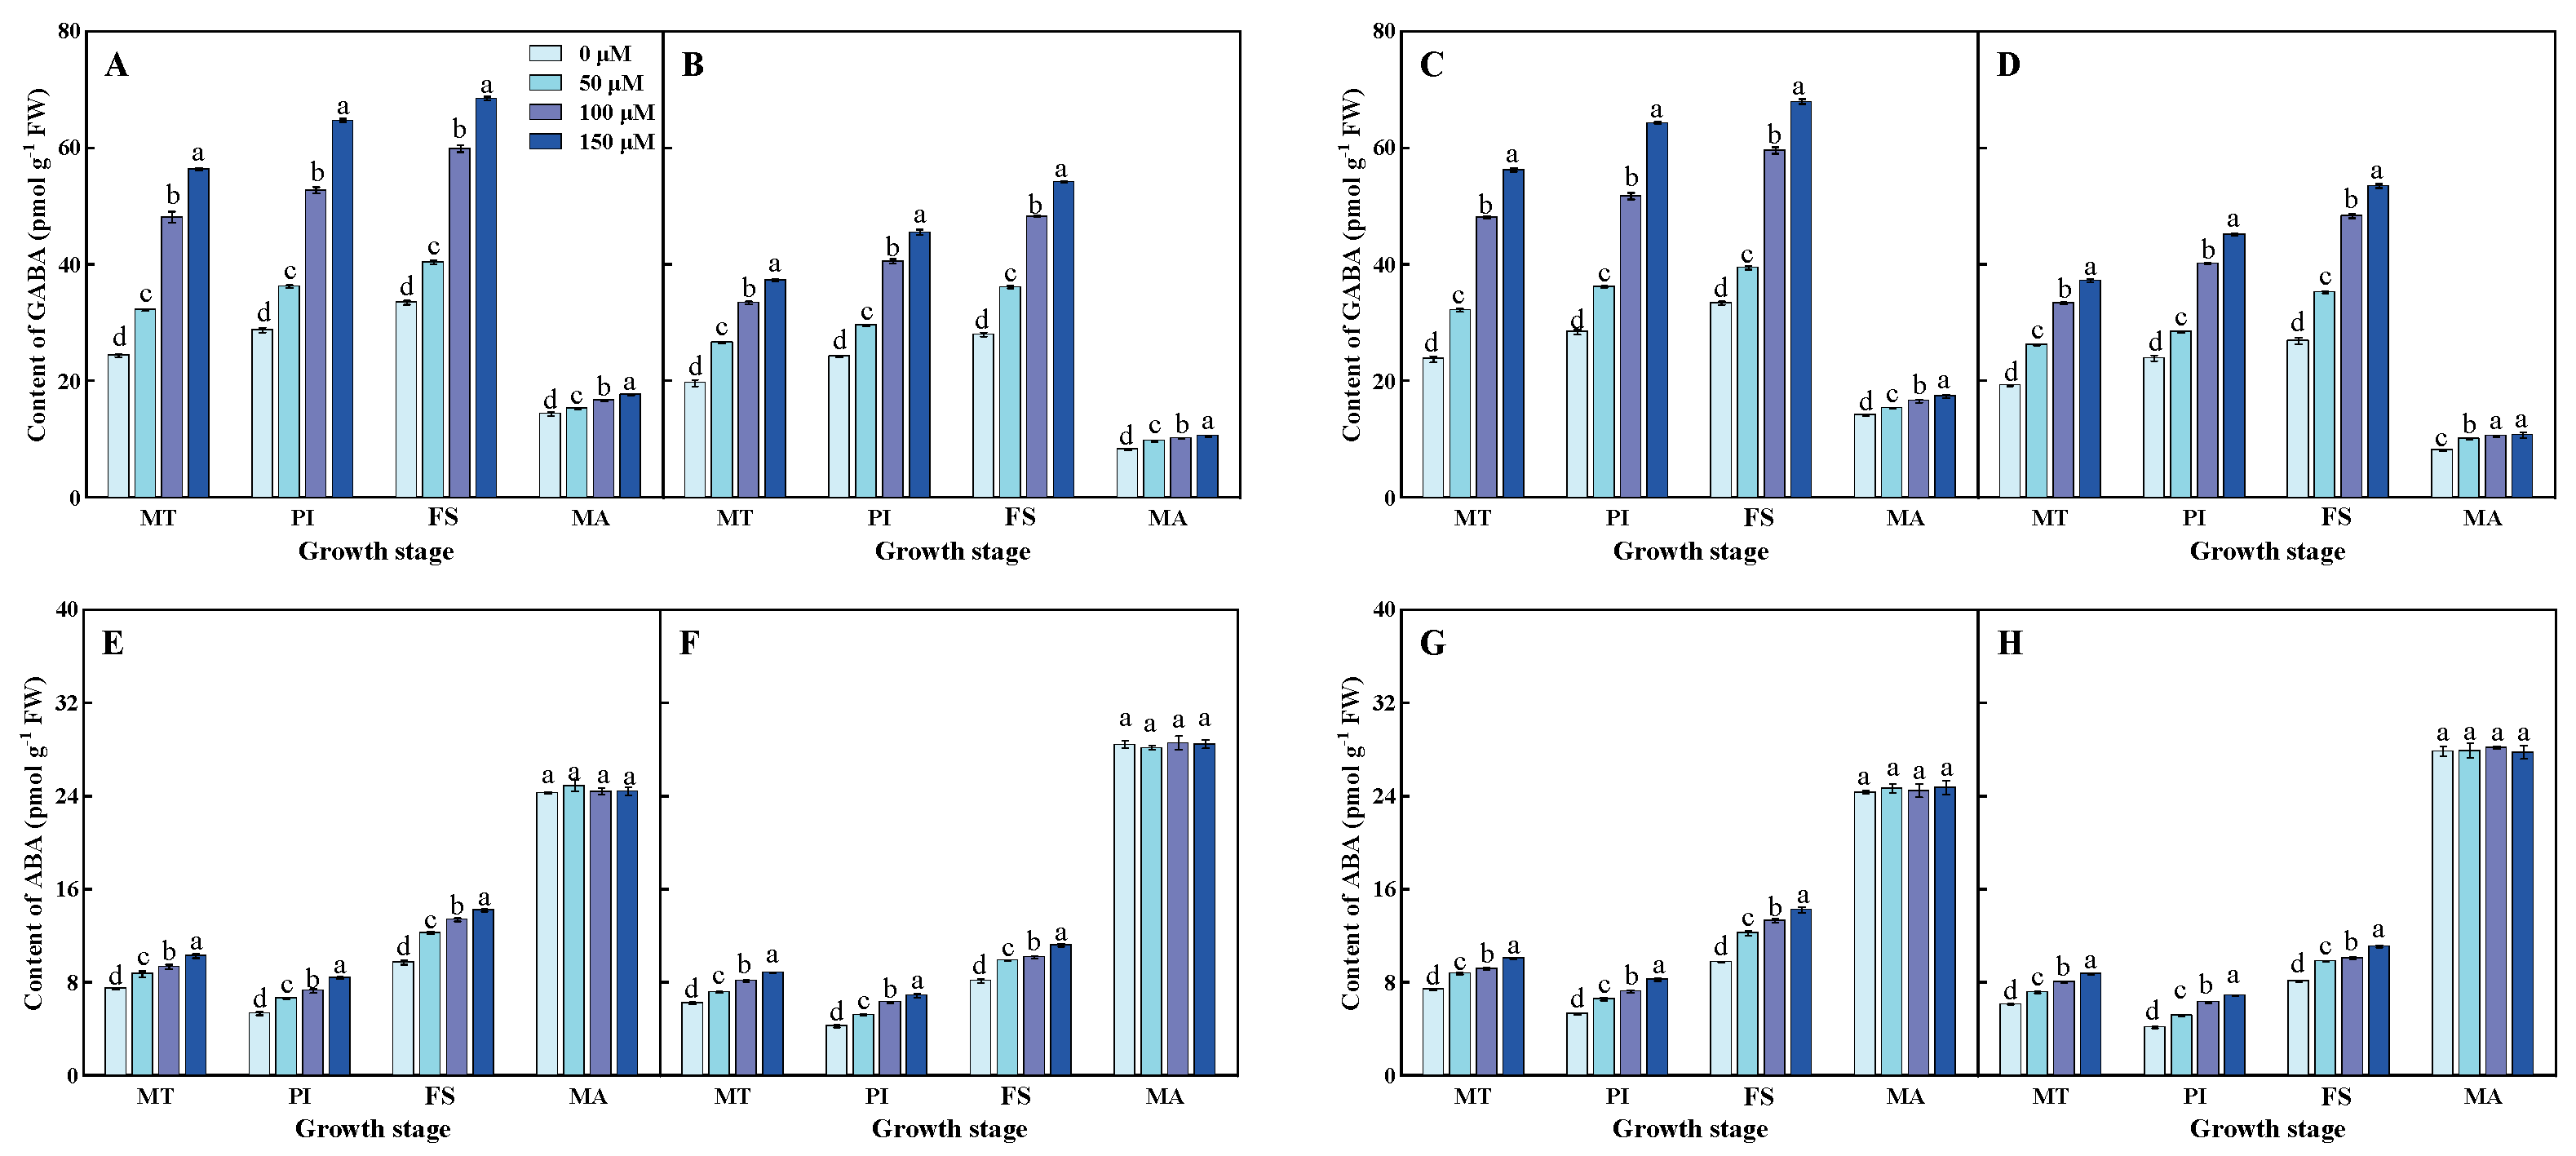
Figure 6 showed the GABA and ABA contents in different rice cultivars. Compared to the 0 μM GABA treatment, GABA contents continuously increased significantly under the 50 μM, 100 μM, and 150 μM GABA treatments at the MT, PI, FS, and MA over the two years. Compared to the 0 μM GABA treatment, ABA content significantly increased with increasing levels of GABA at the MT, PI, and FS over the two years. However, ABA content showed no significant change with the exogenous application of GABA at the MA in both years (Figure 6). The content of ABA and GABA of the salt-tolerant rice cultivar J-5 was significantly higher than the salt-susceptible rice cultivar L-7.

3.9. Contents of K+, Na+, Malondialdehyde, and Osmotic Adjustment Substances and Activities of Antioxidant Enzymes

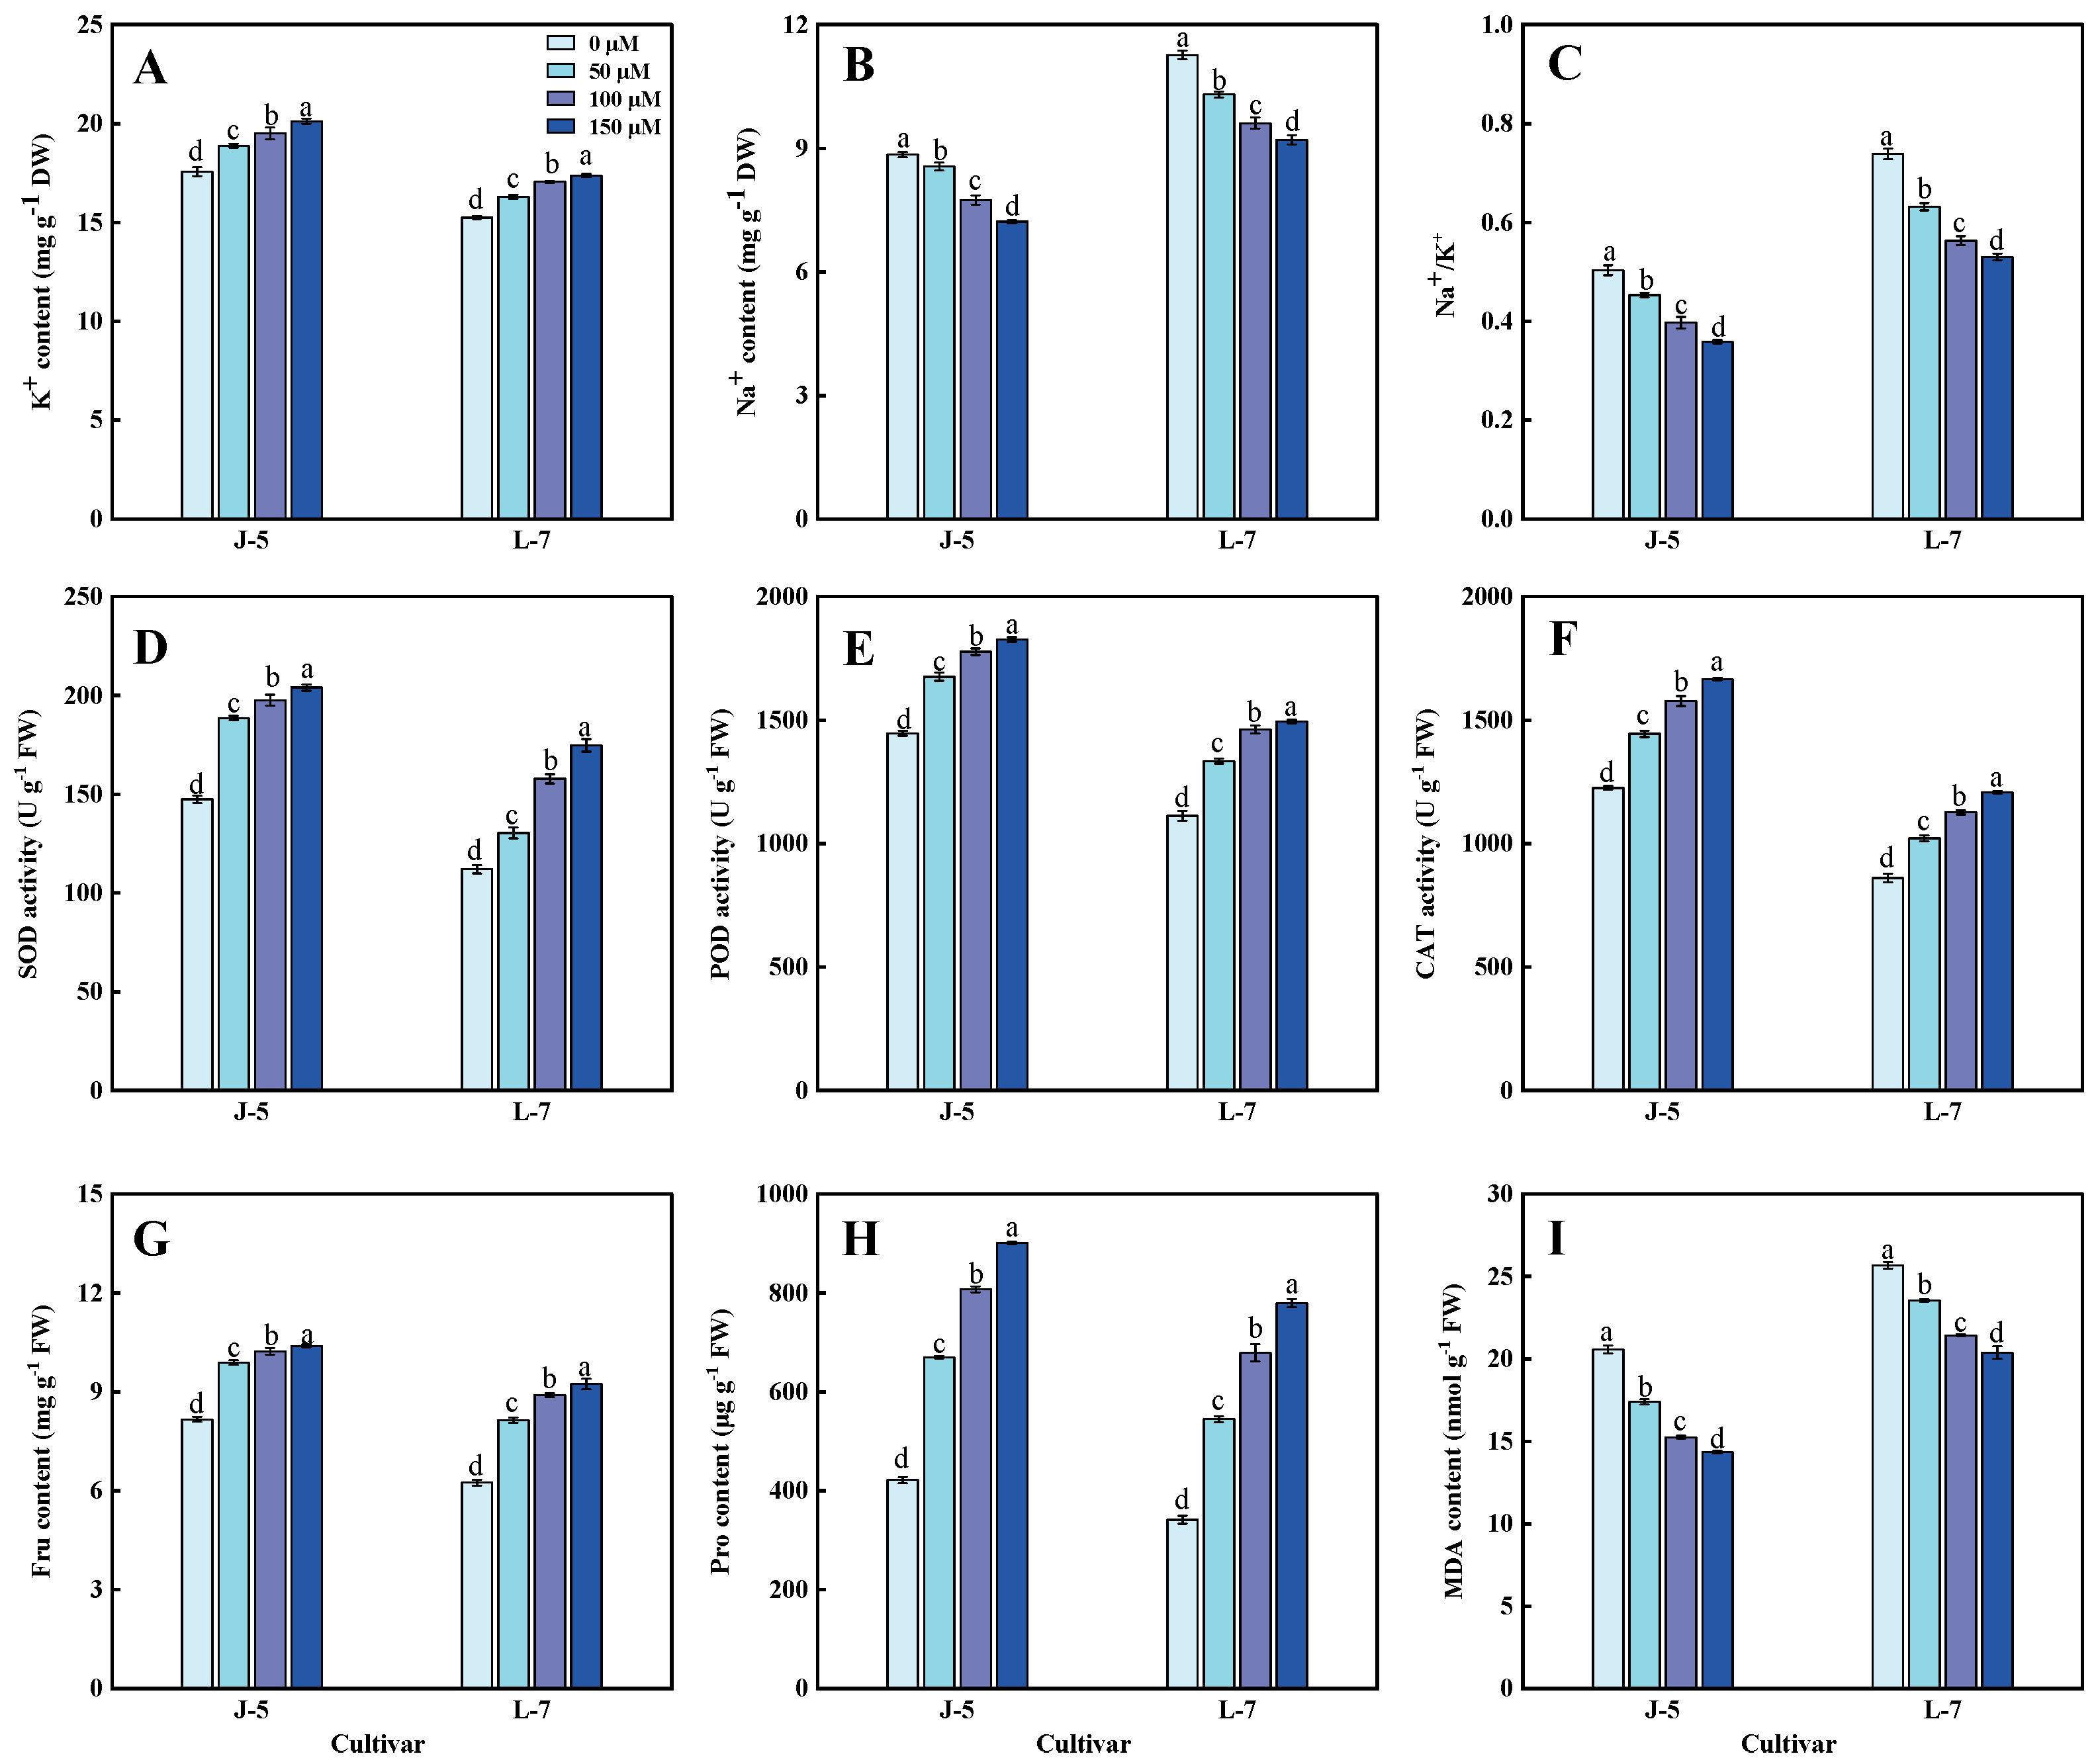
Compared to the 0 μM GABA treatment, K+ content significantly increased with rising GABA levels at the FS (Figure 7A), while Na+ content significantly decreased under the same GABA treatments at the FS (Figure 7B). Therefore, compared with the 0 μM GABA treatment, the Na+/K+ ratio decreased significantly with increasing levels of GABA at the FS (Figure 7C). The content of K+ and Na+/K+ of the salt-tolerant rice cultivar J-5 was significantly higher than that of the salt-susceptible rice cultivar L-7. The activities of SOD, POD, and CAT were significantly increased with the rising application levels of exogenous GABA (Figure 7D–F). The activity of antioxidant enzymes of the salt-tolerant rice cultivar J-5 was significantly higher than the salt-susceptible rice cultivar L-7. In this study, the exogenous application of GABA led to a significant increase in proline and fructose contents (Figure 7G,H). Additionally, compared to the 0 μM GABA treatment, MDA content significantly decreased with increasing levels of GABA at the FS (Figure 7I).

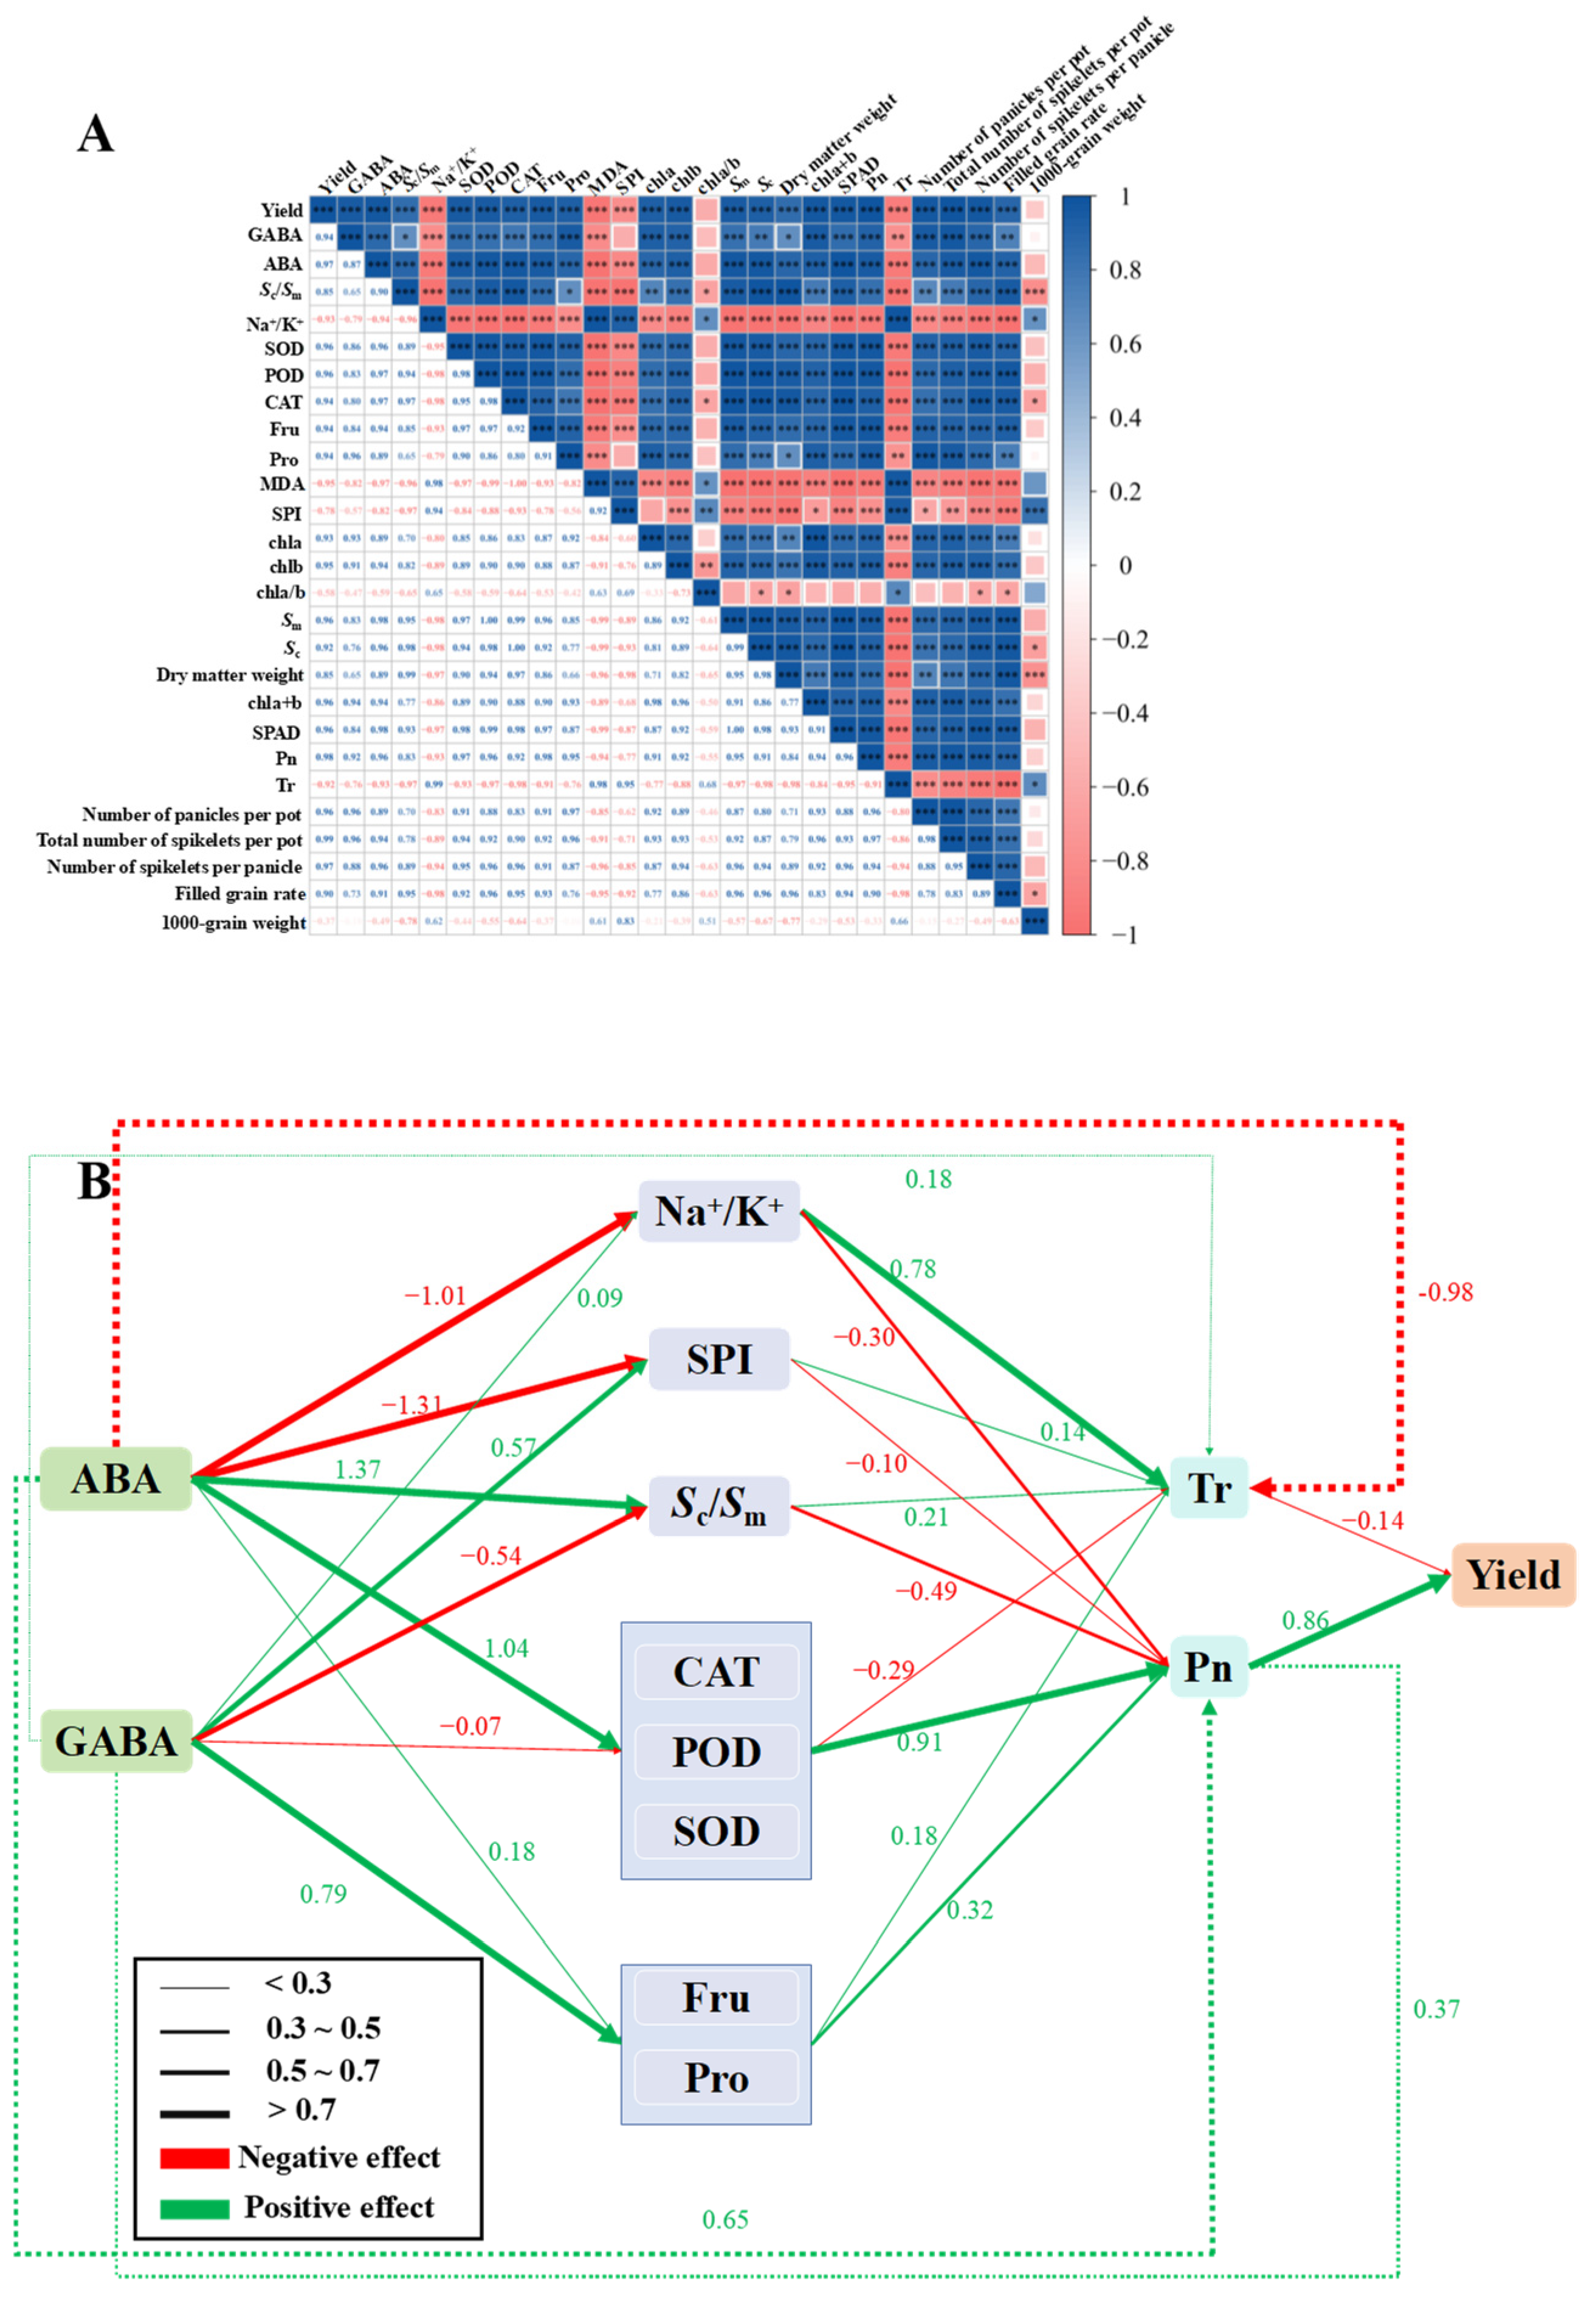
3.10. Correlation Analysis and Analysis of Structural Equation Model

The results of the Pearson correlation analysis are presented in Figure 8A. Overall, yield was positively correlated with the contents of GABA, ABA, proline, and fructose, as well as the activities of SOD, POD, and CAT, the Sc/Sm ratio, photosynthetic rate, and the number of spikelets per panicle. Yield was negatively correlated with the Na+/K+ ratio, MDA, SPI, and transpiration rate (Figure 8A).
The structural equation model results indicated that yield was influenced by both the photosynthetic rate and transpiration rate (Figure 8B). The activities of POD, SOD, CAT, and the contents of osmotic adjustment substances had dominant impacts on the photosynthetic rate. The content of GABA had a dominant impact on the transpiration rate, photosynthetic rate, Na+/K+, and the osmotic adjustment substance. The positive impact of the content of GABA (r = 0.37) on photosynthetic rate outweighed the transpiration rate increase caused by the content of GABA (r = 0.18). The influence of increasing the photosynthetic rate (r = 0.86) through the yield was notably higher than the reduction achieved by increasing the transpiration rate (r = −0.14). The positive impact of the content of ABA (r = 1.37) on Sc/Sm outweighed the decrease caused by the content of GABA (r = −0.54). The negative impact of the content of ABA (r = −1.31) on SPI outweighed the decrease caused by the content of GABA (r = 0.57). The content of GABA positively influenced yield by decreasing the transpiration rate and increasing the photosynthetic rate (Figure 8B).

4. Discussion

4.1. Effects of Genes Related to GABA Synthesis

GABA is irreversibly synthesized by glutamate decarboxylase (GAD). GAD is vital for GABA metabolism in response to abiotic stress, catalyzing both the degradation of glutamate (Glu) and the synthesis of GABA [39]. In our study, we analyzed the relative expression levels of GADs in the leaves of both rice genotypes under salt stress. We identified a gene (LOC4333932) in the salt-tolerant rice cultivar that increases GABA content by elevating GAD activity (Figure 2).

4.2. Effects of Exogenous GABA Application on Rice Yield and Growth and Development

It has been reported that rice plant growth is less restricted when soil salt content is below 1.5 g kg−1 [6]. However, many saline mudflat soils currently have salinity levels exceeding 3 g kg−1 [6,9]. GABA is a crucial metabolite in both primary and secondary metabolism, serving as an essential intermediate in nitrogen metabolism and amino acid biosynthesis [27,43]. Additionally, GABA metabolism via the GABA shunt supplies carbon skeletons and energy for downstream biosynthetic pathways. GABA also plays a role in signaling and regulatory mechanisms [44]. GABA plays a dual role in plants as both a metabolite and a signaling molecule, influencing growth and development [45,46]. It accumulates rapidly under abiotic stressed environments and helps plants cope with biotic challenges through various mechanisms [39,47]. By serving as both a key intermediate in metabolism and a regulator in stress response pathways, GABA enables plants to better adapt to adverse conditions [48]. Additionally, the exogenous application of GABA can trigger similar effects to its natural accumulation, potentially boosting plant resilience and overall vigor [44].
In our study, exogenous GABA application increased yield by enhancing the number of panicles per pot, spikelets per panicle, and the thousand-grain weight (Table 2). This treatment significantly boosted grain yield in both rice genotypes under saline conditions. With over 110 million hectares of saline land potentially available globally [49], utilizing exogenous GABA to improve rice salt tolerance could be instrumental in addressing limited cropland availability and ensuring food safety [50].

4.3. Exogenous GABA Regulates the Physiological and Biochemical Properties of Rice Under Salt Stress to Improve Salt Tolerance

Salt stress primarily closes stomata and damages photosynthetic apparatus, and reduces the plant photosynthesis [51]. GABA promotes the synthesis of photosynthetic pigments and carotenoids, which may help sustain the photosynthesis [52]. Photosynthesis and transpiration are crucial factors contributing to a plant’s ability to tolerate salt, with photosynthesis being the most critical process for energy production, and highly influenced by salt stress [11]. Stomatal closure, regulated by ABA to reduce transpiration, is a strategy plants adopt to overcome osmotic stress [53]. Chlorophyll is essential for light harvesting during photosynthesis, but under salt stress, chlorophyll synthesis slows or its breakdown accelerates [54]. Exogenous GABA can help maintain chlorophyll levels in salt-stressed mung bean [26]. In this study, the application of GABA mitigated the decline in chlorophyll content induced by salt stress (Table 4). Previous research has shown that exogenous GABA can help sustain or enhance chlorophyll levels in salt-stressed mung bean, as well as in wheat [55], rice [40], muskmelon [32], and tomato [27]. Our findings also showed that Chl a and Chl b levels increased with higher exogenous GABA application. Additionally, TEM images of leaves indicated that chloroplast development was enhanced with exogenous GABA treatment under salt stress. In our study, the application of exogenous GABA decreased the stomatal number per area and transpiration rate under salt stress. An increase in Sc and Sc/Sm indicates that a larger surface area of the mesophyll cell periphery is covered by chloroplasts [56]. In summary, exogenous GABA application enhances the levels of GABA and ABA in leaves, which can boost photosynthesis and reduce transpiration, thereby improving salt tolerance.
Plants respond to salt stress at multiple levels, including ionic homeostasis, osmotic adjustment, ROS scavenging, and maintaining nutritional balance [57]. ROS serve as signaling molecules during growth, development, and stress responses; however, they can also cause damage to plant cells [58]. GABA treatment promoted growth and stress tolerance by scavenging free radicals, regulating enzyme activity, and stabilizing plants under salinity stress [59]. It is reported that exogenous GABA significantly enhances the activities of antioxidant enzymes in rice [60]. Similarly, seeds soaked in exogenous GABA showed increased activities of antioxidant enzymes in the roots and leaves of tomato seedlings, leading to reduced oxidative damage under salt stress [27]. SOD, CAT, and POD are key enzymes that play crucial roles in the antioxidant defense system of plants [61]. They catalyze O2 and H2O2 into O2 and H2O [61,62]. In this study, the enhancing effects of GABA on SOD and POD were observed under salt stress, which also contributed to improved salt resistance in rice plants.
Osmotic adjustment substances are essential for improving salt tolerance. Exogenous GABA application could help regulate osmotic equilibrium in plants, enhancing their resistance to adverse environmental conditions [21,47]. Plants adapt to osmotic stress by accumulating compatible solutes such as proline, glycine betaine, soluble sugars, and organic acids [63]. In this study, the application of GABA enhanced the accumulation of proline and fructose in both genotypes under salt stress (Figure 7). Studies indicate that exogenous GABA application inhibits MDA accumulation, reduces electrolyte leakage, and helps maintain membrane integrity [26,39,40]. Similarly, in our study, the content of MDA decreased with increasing concentrations of sprayed GABA.
Salt stress arises from elevated Na+ and Cl ion concentrations in the soil, disrupting ionic balance and water availability for plants [57]. K+ is crucial for the catalytic functions of many enzymes, but excess Na+ competes with K+ for uptake across plant cell membranes [64]. K+ is vital for osmoregulation, protein synthesis, cell turgor, and photosynthesis [65,66]. Proper Na+/K+ homeostasis is essential for a plant’s survival under salt stress [67]. Exogenous GABA application reduced Na+ accumulation, increased K+ absorption, and improved the Na+/K+ balance [68]. We found that the exogenous application of GABA reduced Na+ contents and increased K+ contents in leaves (Figure 7). Compared with the salt-susceptible rice cultivar L-7, the content of K+ of the salt-tolerant rice cultivar J-5 was higher. On the contrary, the content of Na+ of the salt-tolerant rice cultivar J-5 was lower than that of the salt-susceptible rice cultivar L-7 (Figure 7). Meanwhile, the Na+/K+ ratio consistently decreased as the concentration of sprayed GABA increased.

5. Conclusions

RNA-seq analysis revealed that GABA production was significantly enhanced through the activation of the glutamate decarboxylase (GAD) gene (LOC4333932) in salt-tolerant rice cultivars. The application of GABA improves the salt tolerance of the salt-tolerant rice cultivar and salt-susceptible rice cultivar by stimulating the synthesis of endogenous GABA and ABA. Under salt stress, photosynthesis was improved and transpiration was decreased by increasing endogenous GABA and ABA after spraying exogenous GABA. The activity of CAT, POD, and SOD and the content of Fru and Pro were increased by increasing photosynthesis and the Na+/K+ was decreased by decreasing transpiration. Therefore, exogenous GABA application improved the salt tolerance and yield of different rice cultivars under salt stress. Moreover, the analysis of stomatal density, size, and leaf anatomical characteristics showed a reduction in SPI, which lowered the transpiration rate. Concurrently, the increased proportion of mesophyll cell periphery covered by chloroplasts (Sc/Sm) indicated improved mesophyll conductance. This improvement in internal CO2 diffusion, along with reduced water loss, contributed to the maintenance of photosynthesis under saline environments, further enhancing rice salt tolerance. In conclusion, our study underscores the potential of exogenous GABA application as a promising strategy for mitigating salinity stress in rice production by promoting physiological adaptations that improve water-use efficiency, photosynthesis, and overall growth under adverse conditions. This approach could be crucial in sustaining crop productivity on saline soils, which are becoming increasingly prevalent due to environmental challenges.

Author Contributions

Conceptualization, J.G. and J.Y.; methodology, J.F., T.Z. and Y.G.; software, T.Z.; validation, C.S. and K.Z.; formal analysis, J.F.; investigation, J.F., T.Z. and Y.G.; resources, J.G.; data curation, W.Z.; writing—original draft preparation, J.F.; writing—review and editing, H.Z., L.L. and Z.W.; visualization, T.Z.; supervision, J.G. and J.Y.; project administration, J.G.; funding acquisition, J.Y. All authors have read and agreed to the published version of the manuscript.

Funding

This project was financially supported by the National Natural Science Foundation of China (32272198; 32071943), the R&D Foundation of Jiangsu Province, China (BE2022425), the Ministry of Agriculture and Rural Affairs of China (FSNK202218080316, FSNK202218080317) and the Priority Academic Program Development of Jiangsu Higher Education Institutions (PAPD).

Data Availability Statement

The data presented in this study are available upon request from the corresponding author.

Conflicts of Interest

The authors declare no conflicts of interest.

References

  1. Litalien, A.; Zeeb, B. Curing the earth: A review of anthropogenic soil salinization and plant-based strategies for sustainable mitigation. Sci. Total Environ. 2020, 698, 134235. [Google Scholar] [CrossRef] [PubMed]
  2. Zhang, Y.; Li, Y.P.; Sun, J.; Huang, G. Optimizing water resources allocation and soil salinity control for supporting agricultural and environmental sustainable development in Central Asia. Sci. Total Environ. 2020, 704, 135281. [Google Scholar] [CrossRef] [PubMed]
  3. Shahid, S.A.; Zaman, M.; Heng, L. Soil salinity: Historical perspectives and a world overview of the problem. In Guideline for Salinity Assessment, Mitigation and Adaptation Using Nuclear and Related Techniques; Springer: Cham, Switzerland, 2018; pp. 43–53. [Google Scholar]
  4. Kumar, P.; Sharma, P.K. Soil salinity and food security in India. Front. Sustain. Food Syst. 2020, 4, 533781. [Google Scholar] [CrossRef]
  5. Xu, Z.; Shao, T.; Lv, Z.; Yue, Y.; Liu, A.; Long, X.; Rengel, Z. The mechanisms of improving coastal saline soils by planting rice. Sci. Total Environ. 2020, 703, 135529. [Google Scholar] [CrossRef] [PubMed]
  6. Li, Z.; Zhou, T.; Zhu, K.; Wang, W.; Zhang, W.; Zhang, H.; Yang, J. Effects of salt stress on grain yield and quality parameters in rice cultivars with differing salt tolerance. Plants 2023, 12, 3243. [Google Scholar] [CrossRef]
  7. Mukhopadhyay, R.; Sarkar, B.; Jat, H.S.; Sharma, P.C.; Bolan, N.S. Soil salinity under climate change: Challenges for sustainable agriculture and food security. J. Environ. Manag. 2021, 280, 111736. [Google Scholar] [CrossRef]
  8. Zheng, C.; Liu, C.; Liu, L.; Tan, Y.; Sheng, X.; Yu, D.; Sun, Z.; Sun, X.; Chen, J.; Yuan, C.; et al. Effect of salinity stress on rice yield and grain quality: A meta-analysis. Eur. J. Agron. 2023, 144, 126765. [Google Scholar] [CrossRef]
  9. Qin, H.; Li, Y.; Huang, R. Advances and challenges in the breeding of salt-tolerant rice. Int. J. Mol. Sci. 2020, 21, 8385. [Google Scholar] [CrossRef]
  10. Reddy, I.N.B.L.; Kim, B.K.; Yoon, I.S.; Kim, K.H.; Kwon, T.R. Salt tolerance in rice: Focus on mechanisms and approaches. Rice Sci. 2017, 24, 123–144. [Google Scholar] [CrossRef]
  11. Yan, F.; Zhang, J.; Li, W.; Ding, Y.; Zhong, Q.; Xu, X.; Li, G. Exogenous melatonin alleviates salt stress by improving leaf photosynthesis in rice seedlings. Plant Physiol. Biochem. 2021, 163, 367–375. [Google Scholar] [CrossRef]
  12. Hussain, S.; Zhong, C.; Bai, Z.; Cao, X.; Zhu, L.; Hussain, A.; Zhu, C.; Fahad, S.; James, A.B.; Zhang, J.; et al. Effects of 1-methylcyclopropene on rice growth characteristics and superior and inferior spikelet development under salt stress. J. Plant Growth Regul. 2018, 37, 1368–1384. [Google Scholar] [CrossRef]
  13. Arif, Y.; Singh, P.; Siddiqui, H.; Bajguz, A.; Hayat, S. Salinity induced physiological and biochemical changes in plants: An omic approach towards salt stress tolerance. Plant Physiol. Biochem. 2020, 156, 64–77. [Google Scholar] [CrossRef] [PubMed]
  14. Liu, C.; Lin, J.; Wang, Y.; Tian, Y.; Zheng, H.; Zhou, Z.; Liu, X. The protein phosphatase PC1 dephosphorylates and deactivates CatC to negatively regulate H2O2 homeostasis and salt tolerance in rice. Plant Cell 2023, 35, 3604–3625. [Google Scholar] [CrossRef] [PubMed]
  15. Liu, S.; Liu, W.; Lai, J.; Liu, Q.; Zhang, W.; Chen, Z.; Gao, J.; Song, S.; Liu, J.; Xiao, Y. OsGLYI3, a glyoxalase gene expressed in rice seed, contributes to seed longevity and salt stress tolerance. Plant Physiol. Biochem. 2022, 183, 85–95. [Google Scholar] [CrossRef]
  16. Song, T.; Shi, Y.; Shen, L.; Cao, C.; Shen, Y.; Jing, W.; Tian, Q.; Lin, F.; Li, W.; Zhang, W. An endoplasmic reticulum-localized cytochrome b5 regulates high-affinity K+ transport in response to salt stress in rice. Proc. Nat. Acad. Sci. USA 2021, 118, e2114347118. [Google Scholar] [CrossRef]
  17. Yang, Y.; Guo, Y. Elucidating the molecular mechanisms mediating plant salt-stress responses. New Phytol. 2018, 217, 523–539. [Google Scholar] [CrossRef]
  18. Ponce, K.S.; Guo, L.; Leng, Y.; Meng, L.; Ye, G. Advances in sensing, response and regulation mechanism of salt tolerance in rice. Int. J. Mol. Sci. 2021, 22, 2254. [Google Scholar] [CrossRef]
  19. Ganie, S.A.; Molla, K.A.; Henry, R.; Bhat, K.V.; Mondal, T.K. Advances in understanding salt tolerance in rice. Theor. Appl. Genet. 2019, 132, 851–870. [Google Scholar] [CrossRef]
  20. Steward, F.C.; Thompson, J.F.; Dent, C.E. γ-Aminobutyric acid: A constituent of the potato tuber? Science 1949, 110, 439–440. [Google Scholar]
  21. Li, L.; Dou, N.; Zhang, H.; Wu, C. The versatile GABA in plants. Plant Signal. Behav. 2021, 16, 1862565. [Google Scholar] [CrossRef]
  22. Hasan, M.M.; Alabdallah, N.M.; Alharbi, B.M.; Waseem, M.; Yao, G.; Liu, X.D.; Abd El-Gawad, H.G.; El-Yazied, A.A.; Ibrahim, M.F.; Jahan, M.S.; et al. GABA: A key player in drought stress resistance in plants. Int. J. Mol. Sci. 2021, 22, 10136. [Google Scholar] [CrossRef] [PubMed]
  23. Mishra, V.; Gahlowt, P.; Singh, S.; Dubey, N.K.; Singh, S.P.; Tripathi, D.K.; Singh, V.P. GABA: A key player of abiotic stress regulation. Plant Signal. Behav. 2023, 18, 2163343. [Google Scholar] [CrossRef] [PubMed]
  24. Ziogas, V.; Tanou, G.; Belghazi, M.; Diamantidis, G.; Molassiotis, A. Characterization of β-amino-and γ-amino butyric acid-induced citrus seeds germination under salinity using nanoLC–MS/MS analysis. Plant Cell Rep. 2017, 36, 787–789. [Google Scholar] [CrossRef] [PubMed]
  25. Wang, Y.; Cao, H.; Wang, S.; Guo, J.; Dou, H.; Qiao, J.; Yang, Q.; Shao, R.; Wang, H. Exogenous γ-aminobutyric acid (GABA) improves salt-inhibited nitrogen metabolism and the anaplerotic reaction of the tricarboxylic acid cycle by regulating GABA-shunt metabolism in maize seedlings. Ecotoxicol. Environ. Safe 2023, 254, 114756. [Google Scholar] [CrossRef] [PubMed]
  26. Ullah, A.; Ali, I.; Noor, J.; Zeng, F.; Bawazeer, S.; Eldin, S.M.; Asghar, M.A.; Javed, H.H.; Saleem, K.; Ullah, S.; et al. Exogenous γ-aminobutyric acid (GABA) mitigated salinity-induced impairments in mungbean plants by regulating their nitrogen metabolism and antioxidant potential. Front. Plant Sci. 2023, 13, 1081188. [Google Scholar] [CrossRef]
  27. Wu, X.; Jia, Q.; Ji, S.; Gong, B.; Li, J.; Lü, G.; Gao, H. Gamma-aminobutyric acid (GABA) alleviates salt damage in tomato by modulating Na+ uptake, the GAD gene, amino acid synthesis and reactive oxygen species metabolism. BMC Plant Biol. 2020, 20, 465. [Google Scholar] [CrossRef]
  28. Alkharabsheh, H.M.; Seleiman, M.F.; Hewedy, O.A.; Battaglia, M.L.; Jalal, R.S.; Alhammad, B.A.; Al-Doss, A. Field crop responses and management strategies to mitigate soil salinity in modern agriculture: A review. Agronomy 2021, 11, 2299. [Google Scholar] [CrossRef]
  29. Hosseini, S.S.; Ramezanpour, S.S.; Soltanloo, H.; Seifati, S.E. RNA-seq analysis and reconstruction of gene networks involved in response to salinity stress in quinoa (cv. Titicaca). Sci. Rep. 2023, 13, 7308. [Google Scholar] [CrossRef]
  30. Guo, X.; Meng, Z.; Zhu, M.; Long, J.; Li, J.; Zhou, B.; Ai, Z.; Deng, H. Comparative transcriptomic analysis of the super hybrid rice Chaoyouqianhao under salt stress. BMC Plant Biol. 2022, 22, 233. [Google Scholar]
  31. Kim, D.; Langmead, B.; Salzberg, S.L. HISAT: A fast spliced aligner with low memory requirements. Nat. Methods 2015, 12, 357–360. [Google Scholar] [CrossRef]
  32. Jin, X.; Liu, T.; Xu, J.; Gao, Z.; Hu, X. Exogenous GABA enhances muskmelon tolerance to salinity-alkalinity stress by regulating redox balance and chlorophyll biosynthesis. BMC Plant Biol. 2019, 19, 48. [Google Scholar] [CrossRef] [PubMed]
  33. Jerbi, A.; Brereton, N.J.B.; Sas, E.; Amiot, S.; Lachapelle-T, X.; Comeau, Y.; Pitre, F.; Labrecque, M. High biomass yield increases in a primary effluent wastewater phytofiltration are associated to altered leaf morphology and stomatal size in Salix miyabeana. Sci. Total Environ. 2020, 738, 139728. [Google Scholar] [CrossRef] [PubMed]
  34. Fanourakis, D.; Giday, H.; Milla, R.; Pieruschka, R.; Kjaer, K.H.; Bolger, M.; Vasilevski, A.; Nunes-Nesi, A.; Fiorani, F.; Ottosen, C.O. Pore size regulates operating stomatal conductance, while stomatal densities drive the partitioning of conductance between leaf sides. Ann. Bot. 2015, 115, 555–565. [Google Scholar] [CrossRef] [PubMed]
  35. Ouyang, W.; Struik, P.C.; Yin, X.; Yang, J. Stomatal conductance, mesophyll conductance, and transpiration efficiency in relation to leaf anatomy in rice and wheat genotypes under drought. J. Exp. Bot. 2017, 68, 5191–5205. [Google Scholar] [CrossRef]
  36. Xiong, D.; Huang, J.; Peng, S.; Li, Y. A few enlarged chloroplasts are less efficient in photosynthesis than a large population of small chloroplasts in Arabidopsis thaliana. Sci. Rep. 2017, 7, 5782. [Google Scholar] [CrossRef]
  37. Xie, W.; Li, Y.; Li, Y.; Ma, L.; Ashraf, U.; Tang, X.; Pan, S.; Tian, H.; Mo, Z. Application of γ-aminobutyric acid under low light conditions: Effects on yield, aroma, element status, and physiological attributes of fragrant rice. Ecotox. Environ. Safe 2021, 213, 111941. [Google Scholar] [CrossRef]
  38. Xu, Z.; Wang, J.; Zhen, W.; Sun, T.; Hu, X. Abscisic acid alleviates harmful effect of saline–alkaline stress on tomato seedlings. Plant Physiol. Biochem. 2022, 175, 58–67. [Google Scholar] [CrossRef]
  39. Li, Y.; Fan, Y.; Ma, Y.; Zhang, Z.; Yue, H.; Wang, L.; Li, J.; Jiao, Y. Effects of exogenous γ-aminobutyric acid (GABA) on photosynthesis and antioxidant system in pepper (Capsicum annuum L.) seedlings under low light stress. J. Plant Growth. Regul. 2017, 36, 436–449. [Google Scholar] [CrossRef]
  40. Nayyar, H.; Kaur, R.; Kaur, S.; Singh, R. γ-Aminobutyric acid (GABA) imparts partial protection from heat stress injury to rice seedlings by improving leaf turgor and upregulating osmoprotectants and antioxidants. J. Plant Growth Regul. 2014, 33, 408–419. [Google Scholar] [CrossRef]
  41. Li, Z.; Zhao, Q.; Cheng, F. Sugar starvation enhances leaf senescence and genes involved in sugar signaling pathways regulate early leaf senescence in mutant rice. Rice Sci. 2020, 27, 201–214. [Google Scholar]
  42. Gu, Y.; Liang, C. Responses of antioxidative enzymes and gene expression in Oryza sativa L and Cucumis sativus L seedlings to microcystins stress. Ecotoxicol. Environ. Safe 2020, 193, 110351. [Google Scholar] [CrossRef] [PubMed]
  43. Rashmi, D.; Zanan, R.; John, S.; Khandagale, K.; Nadaf, A. γ-aminobutyric acid (GABA): Biosynthesis, role, commercial production, and application. In Study in Natural Products Chemistry, 1st ed.; Rahman, A., Ed.; Elsevier: Amsterdam, The Netherlands, 2018; Volume 57, pp. 413–452. [Google Scholar]
  44. Ramesh, S.A.; Tyerman, S.D.; Gilliham, M.; Xu, B. γ-Aminobutyric acid (GABA) signalling in plants. Cell. Mol. Life Sci. 2017, 74, 1577–1603. [Google Scholar] [CrossRef] [PubMed]
  45. Sita, K.; Kumar, V. Role of Gamma Amino Butyric Acid (GABA) against abiotic stress tolerance in legumes: A review. Plant Physiol. Rep. 2020, 25, 654–663. [Google Scholar] [CrossRef]
  46. Khan, M.I.R.; Jalil, S.U.; Chopra, P.; Chhillar, H.; Ferrante, A.; Khan, N.A.; Ansari, M.I. Role of GABA in plant growth, development and senescence. Plant Gene 2021, 26, 100283. [Google Scholar] [CrossRef]
  47. Signorelli, S.; Tarkowski, Ł.P.; O’Leary, B.; Tabares-da Rosa, S.; Borsani, O.; Monza, J. GABA and Proline Metabolism in Response to Stress. In Hormones and Plant Response. Plant in Challenging Environments; Gupta, D.K., Corpas, F.J., Eds.; Springer: Cham, Switzerland, 2021; pp. 291–314. [Google Scholar]
  48. Podlešáková, K.; Ugena, L.; Spíchal, L.; Doležal, K.; De Diego, N. Phytohormones and polyamines regulate plant stress responses by altering GABA pathway. New Biotechnol. 2019, 48, 53–65. [Google Scholar] [CrossRef]
  49. Alexandratos, N.; Bruinsma, J. (Eds.) World Agriculture towards 2030/2050: The 2012 Revision; ESA Working Papers 12-03; ESA: Paris, France, 2012. [Google Scholar]
  50. Mustafa, G.; Akhtar, M.S.; Abdullah, R. Global concern for salinity on various agro-ecosystems. In Salt Stress, Microbes, and Plant Interactions: Causes and Solution; Springer: Singapore, 2019; pp. 1–19. [Google Scholar]
  51. Zahra, N.; Al Hinai, M.S.; Hafeez, M.B.; Rehman, A.; Wahid, A.; Siddique, K.H.; Farooq, M. Regulation of photosynthesis under salt stress and associated tolerance mechanisms. Plant Physiol. Biochem. 2022, 178, 55–69. [Google Scholar] [CrossRef]
  52. Li, W.; Liu, J.; Ashraf, U.; Li, G.; Li, Y.; Lu, W.; Hu, J. Exogenous γ-aminobutyric acid (GABA) application improved early growth, net photosynthesis, and associated physio-biochemical events in maize. Front. Plant Sci. 2016, 7, 919. [Google Scholar] [CrossRef]
  53. Parveen, A.; Ahmar, S.; Kamran, M.; Malik, Z.; Ali, A.; Riaz, M.; Abbasi, G.H.; Khan, M.; Bin Sohail, A.; Rizwan, M.; et al. Abscisic acid signaling reduced transpiration flow, regulated Na+ ion homeostasis and antioxidant enzyme activities to induce salinity tolerance in wheat (Triticum aestivum L.) seedlings. Environ. Technol. Inno. 2021, 24, 101808. [Google Scholar] [CrossRef]
  54. Li, X.; Zhang, W.; Niu, D.; Liu, X. Effects of abiotic stress on chlorophyll metabolism. Plant Sci. 2024, 342, 112030. [Google Scholar] [CrossRef]
  55. Badr, A.; Basuoni, M.M.; Ibrahim, M.; Salama, Y.E.; Abd-Ellatif, S.; Abdel Razek, E.S.; Amer, K.; Ibrahim, A.A.; Zayed, E.M. Ameliorative impacts of gamma-aminobutyric acid (GABA) on seedling growth, physiological biomarkers, and gene expression in eight wheat (Triticum aestivum L.) cultivars under salt stress. BMC Plant Biol. 2024, 24, 605. [Google Scholar] [CrossRef]
  56. Ye, M.; Wang, Z.; Wu, M.; Li, H.; Gu, J.; Yang, J.; Zhang, H.; Zhang, Z. Optimized leaf anatomy improves photosynthetic producing capacity of mid-season indica rice in the Yangtze River Basin during the genetic improvement. Eur. J. Agron. 2024, 158, 127196. [Google Scholar] [CrossRef]
  57. Liu, C.; Mao, B.; Yuan, D.; Chu, C.; Duan, M. Salt tolerance in rice: Physiological responses and molecular mechanisms. Crop J. 2022, 10, 13–25. [Google Scholar] [CrossRef]
  58. Sewelam, N.; Kazan, K.; Schenk, P.M. Global plant stress signaling: Reactive oxygen species at the cross-road. Front. Plant Sci. 2016, 7, 187. [Google Scholar] [CrossRef] [PubMed]
  59. Jalil, S.U.; Ansari, M.I. Physiological role of gamma-aminobutyric acid in salt stress tolerance. In Salt and Drought Stress Tolerance in Plants; Hasanuzzaman, M., Tanveer, M., Eds.; Springer: Cham, Switzerland, 2020; pp. 337–350. [Google Scholar]
  60. Wang, G.; Zhang, L.; Zhang, S.; Li, B.; Li, J.; Wang, X.; Zhang, J.; Guan, C.; Ji, J. The combined use of a plant growth promoting Bacillus sp. strain and GABA promotes the growth of rice under salt stress by regulating antioxidant enzyme system, enhancing photosynthesis and improving soil enzyme activities. Microbiol. Res. 2023, 266, 127225. [Google Scholar] [CrossRef]
  61. Fujita, M.; Hasanuzzaman, M. Approaches to enhancing antioxidant defense in plants. Antioxidants 2022, 11, 925. [Google Scholar] [CrossRef]
  62. Parihar, P.; Singh, S.; Singh, R.; Singh, V.P.; Prasad, S.M. Effect of salinity stress on plants and its tolerance strategies: A review. Environ. Sci. Pollut. Res. 2015, 22, 4056–4075. [Google Scholar] [CrossRef]
  63. Bhattacharya, S.; Kundu, A. Sugars and sugar polyols in overcoming environmental stresses. In Protective Chemical Agents in the Amelioration of Plant Abiotic Stress; Aryadeep Roychoudhury, A., Tripathi, D.K., Eds.; John Wiley Sons, Ltd.: West Sussex, UK, 2020; pp. 71–101. [Google Scholar]
  64. Pandey, G.K.; Mahiwal, S. Potassium in Abiotic Stress. In Role of Potassium in Plants; Springer: Cham, Switzerland, 2020; pp. 45–49. [Google Scholar]
  65. Johnson, R.; Vishwakarma, K.; Hossen, M.S.; Kumar, V.; Shackira, A.M.; Puthur, J.T.; Abdi, G.; Sarraf, M.; Hasanuzzaman, M. Potassium in plants: Growth regulation, signaling, and environmental stress tolerance. Plant Physiol. Biochem. 2022, 172, 56–69. [Google Scholar] [CrossRef]
  66. Abbasi, H.; Jamil, M.; Haq, A.; Ali, S.; Ahmad, R.; Malik, Z.; Parveen, Z. Salt stress manifestation on plants, mechanism of salt tolerance and potassium role in alleviating it: A review. Zemdirbyste 2016, 103, 229–238. [Google Scholar] [CrossRef]
  67. Hussain, S.; Hussain, S.; Ali, B.; Ren, X.; Chen, X.; Li, Q.; Saqib, M.; Ahmad, N. Recent progress in understanding salinity tolerance in plants: Story of Na+/K+ balance and beyond. Plant Physiol. Biochem. 2021, 160, 239–256. [Google Scholar] [CrossRef]
  68. Su, N.; Wu, Q.; Chen, J.; Shabala, L.; Mithöfer, A.; Wang, H.; Qu, M.; Yu, M.; Cui, J.; Shabala, S. GABA operates upstream of H+-ATPase and improves salinity tolerance in Arabidopsis by enabling cytosolic K+ retention and Na+ exclusion. J. Exp. Bot. 2019, 70, 6349–6361. [Google Scholar] [CrossRef]
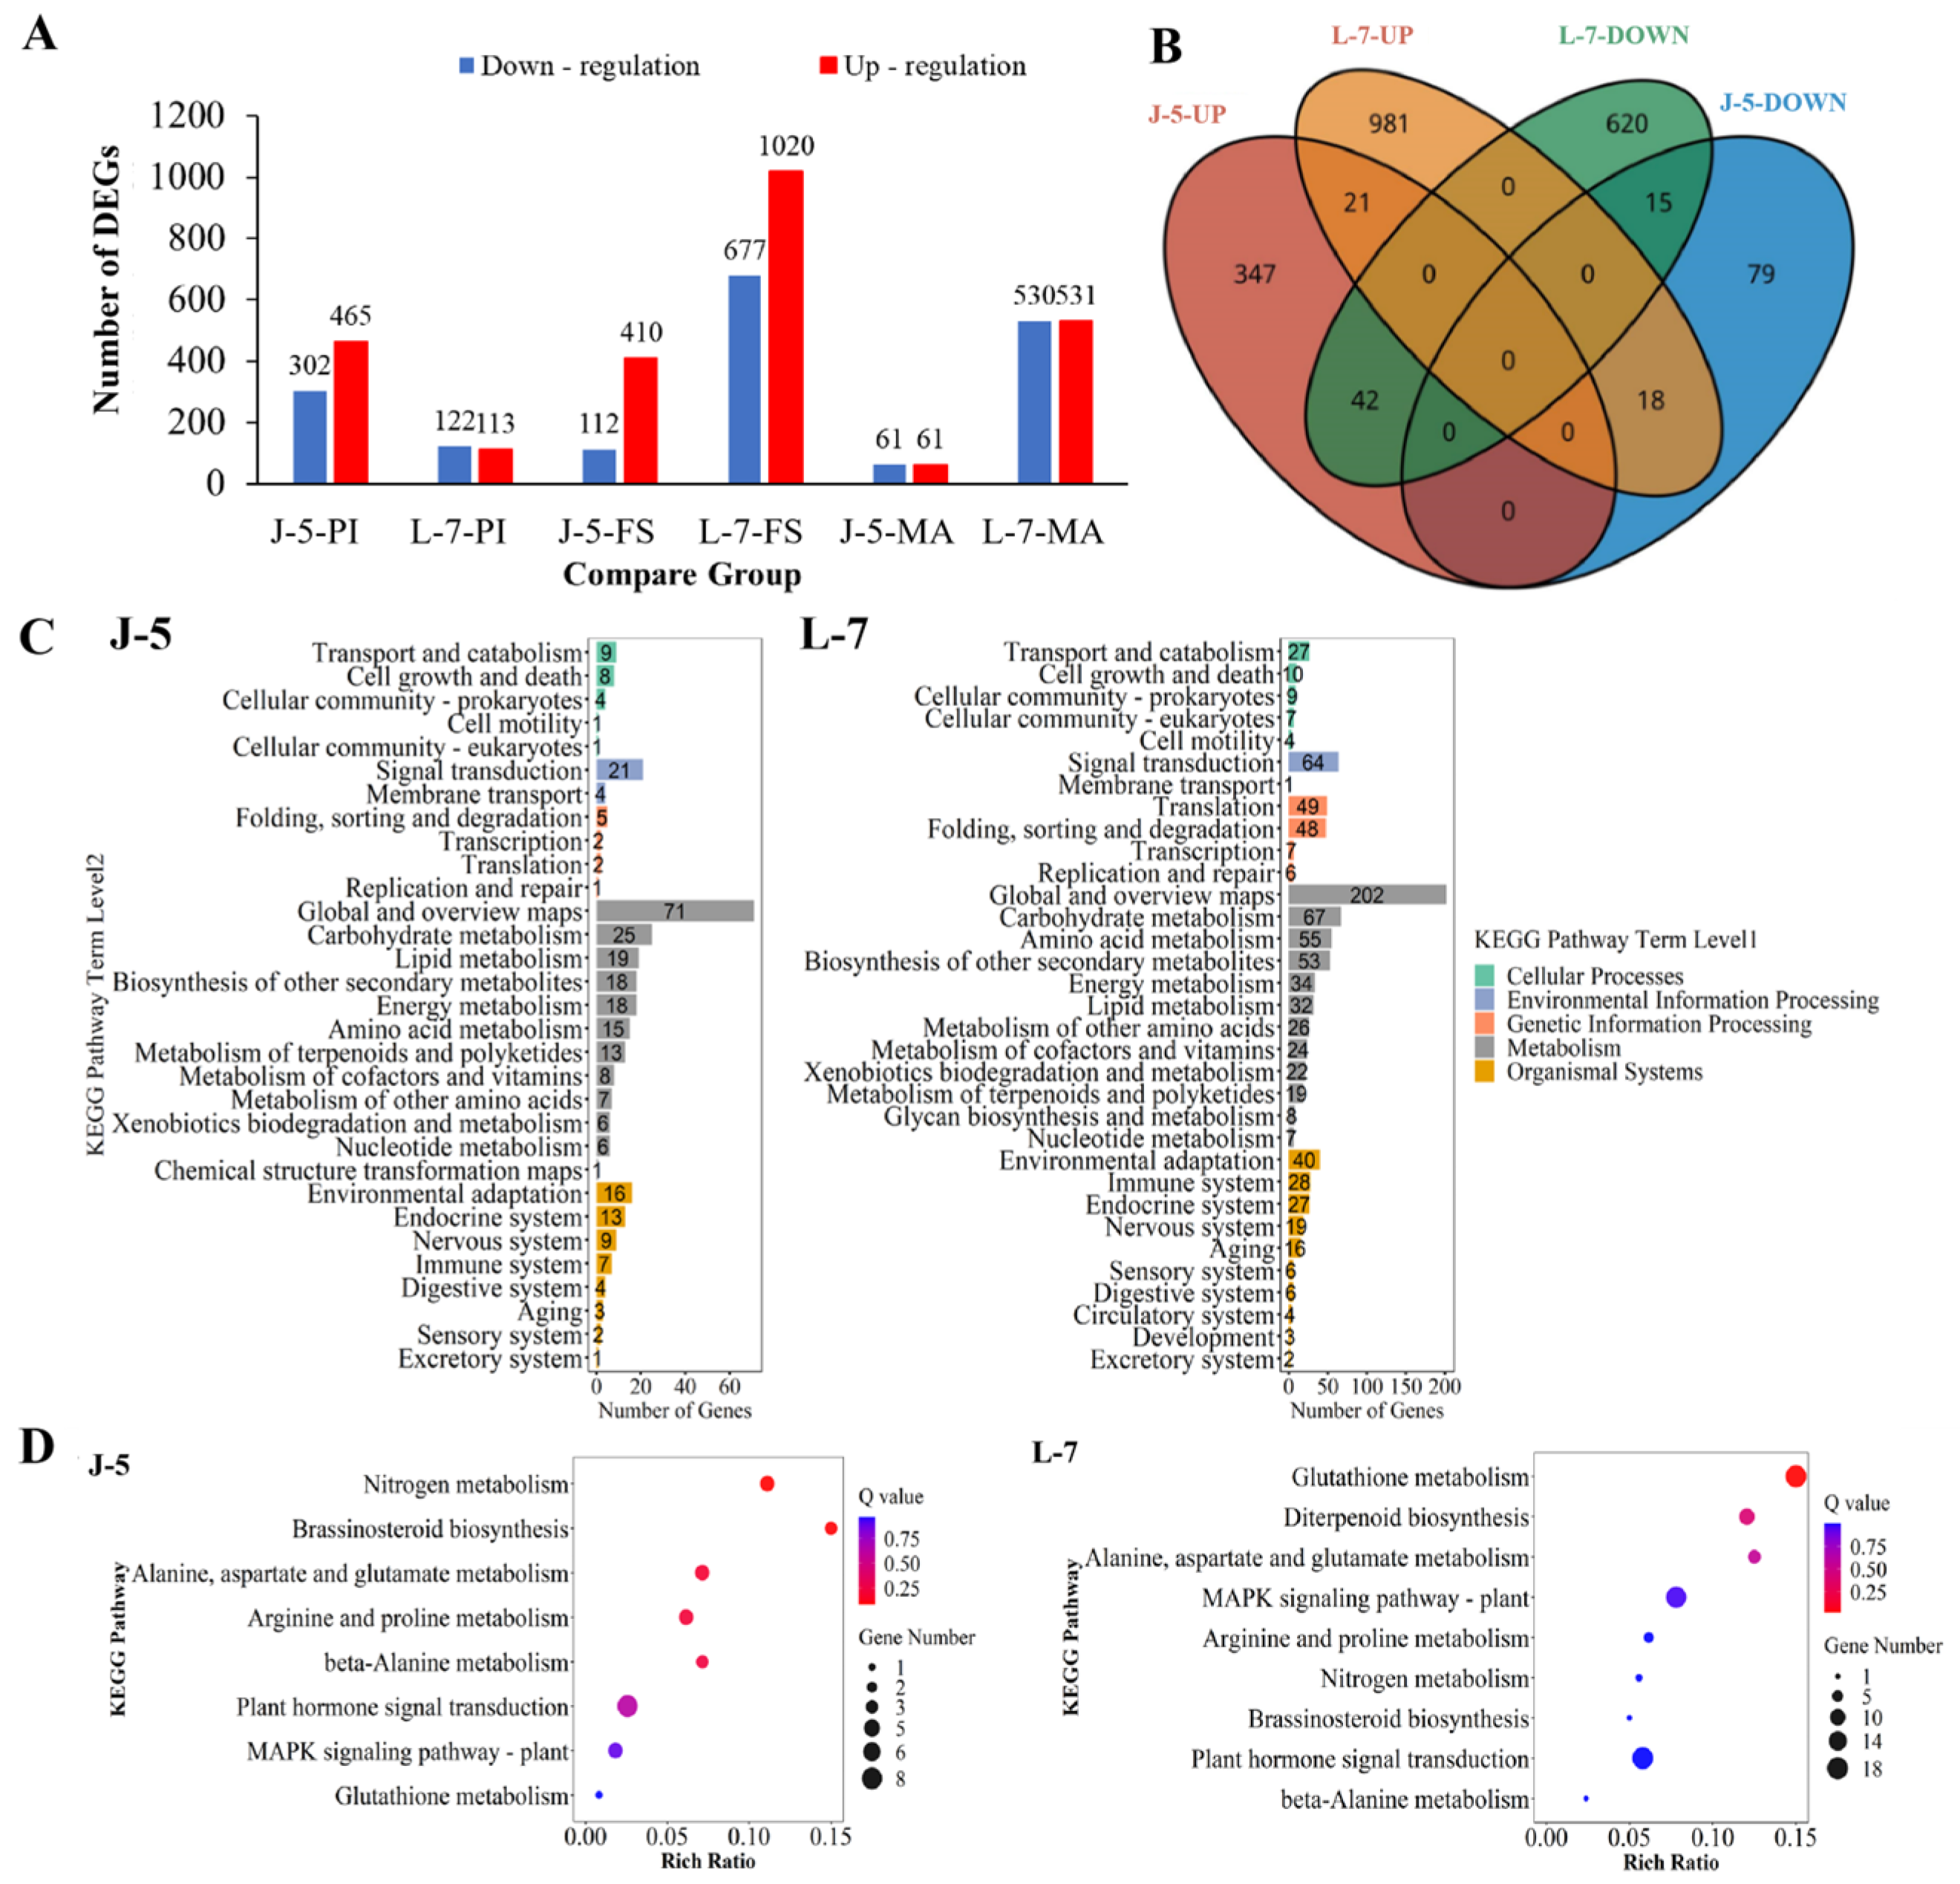
Figure 1. The transcriptome profiling of genes with significant differentially expressed genes (DEGs) between salt-stressed and CK treatments. (A) A histogram of DEGs between CK and salt-stressed treatments. The number above the columns represents the number of DEGs. (B) A venn diagram of the numbers of DEG of up- or down-regulated genes between salt-stressed and CK treatments at the flowering stage. (C) A histogram of KEGG pathways with an annotation of the unigenes at the flowering stage. The five main KEGG classifications are shown in different colors on the right side. (D) A bubble plot of the KEGG pathway enrichment of DEGs at the flowering stage. PI, panicle initiation stage; FS, flowering stage; MA, maturity stage; J-5, Lianjian 5; L-7, Lianjing 7.
Agronomy 14 02524 g001
Figure 2. Pathway map of physiological metabolism of GABA (A) and log2 fold changes in gene expression of GABA metabolism pathway between salt-stressed and CK treatments in salt-tolerant rice cultivar J-5 and salt-susceptible rice cultivar L-7 (B). Nrt, nitrate transporter; NR, nitrate reductase; NiR, nitrite reductase; GLUL, glutamate-ammonia ligase; Gln, glutamine; GTL1, the trihelix-transcription factor GT-2-like 1; Glu, glutamic acid; GDH, glutamate dehydrogenase; GAD, glutamate decarboxylase; J-5, Lianjian 5; L-7, Lianjing 7. NA, not applicable.
Agronomy 14 02524 g002
Figure 3. The effect of the exogenous application of GABA (0 μM, 50 μM, 100 μM, and 150 μM) on the photosynthetic rate of the salt-tolerant rice cultivar J-5 (A,C) and salt-susceptible rice cultivar L-7 (B,D) in 2020 (A,B) and 2021 (C,D), and the transpiration rate of the salt-tolerant rice cultivar J-5 (E,G) and salt-susceptible rice cultivar L-7 (F,H) in 2020 (E,F) and 2021 (G,H) under salt stress at the MT, PI, FS, and MA. MT, mid-tillering stage; PI, panicle initiation stage; FS, flowering stage; MA, maturity stage; Pn, photosynthetic rate; Tr, transpiration rate; J-5, Lianjian 5; L-7, Lianjing 7. Different letters indicate significant differences between different levels of the exogenous application of GABA (p < 0.05, Tukey’s test). Bars represent ± SD (n = 3).
Agronomy 14 02524 g003
Figure 4. Light micrographs illustrating leaf surfaces of rice under different levels of exogenous application of GABA (0 μM, 50 μM, 100 μM, and 150 μM) for rice cultivars J-5 and L-7 in 2021 under stressed environment. Red box indicates presence of stomata. J-5, Lianjian 5; L-7, Lianjing 7.
Agronomy 14 02524 g004
Figure 5. Transmission electron microscope images of rice leaves under different levels of exogenous application of GABA (0 μM, 50 μM, 100 μM, and 150 μM) for rice cultivars J-5 and L-7 in year 2021 under salt-stressed environment. J-5, Lianjian 5; L-7, Lianjing 7.
Agronomy 14 02524 g005
Figure 6. The effect of exogenous applications of GABA (0 μM, 50 μM, 100 μM, and 150 μM) on the contents of GABA of the salt-tolerant rice cultivar J-5 (A,C) and salt-susceptible rice cultivar L-7 (B,D) in 2020 (A,B) and 2021 (C,D), and the content of ABA of the salt-tolerant rice cultivar J-5 (E,G) and salt-susceptible rice cultivar L-7 (F,H) in 2020 (E,F) and 2021 (G,H) at the MT, PI, FS, and MA. MT, mid-tillering stage; PI, panicle initiation stage; FS, flowering stage; MA, maturity stage. J-5, Lianjian 5; L-7, Lianjing 7. Different letters indicate significant differences between different levels of the exogenous application of GABA (p < 0.05, Tukey’s test). Bars represent ± SD (n = 3).
Agronomy 14 02524 g006
Figure 7. Effects of exogenous application of GABA (0 μM, 50 μM, 100 μM, and 150 μM) on contents of K+, Na+, malondialdehyde (MDA), osmotic adjustment substances, and activities of antioxidant enzymes of salt-tolerant rice cultivar J-5 and salt-susceptible rice cultivar L-7 (AI). SOD, superoxide dismutase; POD, peroxidase; CAT, catalase; MDA, malondialdehyde; Pro, proline; Fru, fructose. J-5, Lianjian 5; L-7, Lianjing 7. Different letters indicate significant differences between different treatments (p < 0.05, Tukey’s test). Bars represent ± SD (n = 3).
Agronomy 14 02524 g007
Figure 8. (A) The Pearson correlation analysis for the yield and its components, the contents of GABA, ABA, and osmotic adjustment substances, the activities of POD, SOD, and CAT, and leaf anatomical traits under salt stress. *, **, and *** indicate the significance levels at p < 0.05, p < 0.01, and p < 0.001, respectively. (B) The structural equation model revealing the effects of diverse factors on rice yield with exogenous GABA application under the salt-stressed environment. The red arrows indicate significant negative relationships, whereas the green arrows indicate significant positive relationships. The significance level was set at p < 0.05. Numbers adjacent to the arrows are standardized coefficients. Solid lines indicated direct effects, while dashed lines indicated indirect effects. The width of arrows indicates the strength of the standardized path coefficient.
Agronomy 14 02524 g008
Table 1. Soil electrical conductivity after CK treatment and with 0.2% salinity at different growth stages.
YearGrowth StageTreatmentSoil Salinity
(g kg−1)
Soil Electrical
Conductivity (μS cm−1)
2020MTCK0225.26 ± 3.14 b
0.2%0.24832.37 ± 36.24 a
PICK0224.56 ± 3.05 b
0.2%0.24831.23 ± 26.31 a
MACK0224.31 ± 3.66 b
0.2%0.24828.11 ± 17.34 a
2021MTCK0223.13 ± 4.72 b
0.2%0.24815.51 ± 21.96 a
PICK0222.96 ± 5.12 b
0.2%0.24811.30 ± 36.32 a
MACK0222.94 ± 4.62 b
0.2%0.24812.37 ± 22.56 a
Values ± SD (n = 3) in the same column of the same cultivar with different letters are significantly different (p < 0.05, Tukey’s test). CK, control treatment; 0.2%, salt stress treatments; MT, mid-tillering stage; PI, panicle initiation stage; MA, maturity stage.
Table 2. Effects of exogenous application of GABA on grain yields and yield components of salt-tolerant (J-5) and salt-susceptible (L-7) rice cultivars.
YearCultivarTreatmentNumber of Panicles per PotTotal Number of Spikelets per Pot (103)Number of Spikelets per PanicleFilled Grain Rate (%)1000-Grain Weight (g)Yield
(g pot−1)
Yield Increase Rate (%)
2020J-50 μM16.33 ± 0.58 c1.90 ± 0.01 c116.33 ± 3.79 c65.30 ± 2.54 b22.84 ± 0.08 c28.31 ± 1.06 d
50 μM19.00 ± 1.00 b2.27 ± 0.12 b119.67 ± 0.58 c69.60 ± 2.96 a23.07 ± 0.03 b36.47 ± 1.30 c29.04 ± 3.12 c
100 μM22.67 ± 0.58 a2.84 ± 0.10 a125.33 ± 1.53 b72.50 ± 2.21 a23.14 ± 0.02 b47.65 ± 2.02 b68.48 ± 4.25 b
150 μM23.00 ± 1.00 a2.98 ± 0.10 a129.67 ± 1.53 a73.80 ± 0.70 a23.27 ± 0.03 a51.19 ± 1.20 a81.07 ± 5.65 a
L-70 μM14.00 ± 1.00 d1.46 ± 0.08 d104.33 ± 1.53 b45.27 ± 2.76c24.30 ± 0.02 d16.07 ± 1.65 d
50 μM16.33 ± 0.58 c1.75 ± 0.10 c107.33 ± 2.31 b55.53 ± 0.32 b24.40 ± 0.02 c23.77 ± 1.52 c49.15 ± 3.02 c
100 μM18.33 ± 0.58 b2.08 ± 0.07 b113.33 ± 3.21 a59.27 ± 0.42 a24.92 ± 0.03 b30.68 ± 0.98 b91.99 ± 1.25 b
150 μM20.33 ± 1.15 a2.33 ± 0.16 a114.67 ± 2.08 a60.87 ± 0.60 a24.97 ± 0.02 a35.44 ± 2.14 a121.37 ± 4.01 a
2021J-50 μM15.67 ± 1.15 c1.77 ± 0.14 d112.67 ± 2.52 d64.70 ± 0.85 d22.81 ± 0.04 d26.04 ± 1.72 d
50 μM18.33 ± 0.58 b2.19 ± 0.06 c119.67 ± 1.15 c69.13 ± 0.64 c23.05 ± 0.01 c34.95 ± 1.08 c34.40 ± 3.21 c
100 μM21.67 ± 0.58 a2.71 ± 0.09 b125.00 ± 1.00 b72.20 ± 1.13 b23.14 ± 0.01 b45.27 ± 1.88 b74.17 ± 4.36 b
150 μM22.33 ± 0.58 a2.94 ± 0.05 a131.637 ± 2.08 a74.43 ± 0.80 a23.28 ± 0.01 a50.94 ± 1.49 a96.24 ± 2.24 a
L-70 μM13.67 ± 0.58 d1.41 ± 0.04 d103.33 ± 1.53 d41.00 ± 0.62 d24.35 ± 0.02 d14.10 ± 0.54 d
50 μM16.33 ± 0.58 c1.74 ± 0.10 c106.67 ± 2.08 c55.00 ± 1.44 c24.44 ± 0.03 c23.41 ± 0.74 c66.34 ± 4.55 c
100 μM18.67 ± 0.58 b2.12 ± 0.04 b113.33 ± 1.53 b58.63 ± 0.96 b24.91 ± 0.02 b30.89 ± 0.47 b119.42 ± 5.12 b
150 μM20.33 ± 0.58 a2.37 ± 0.09 a116.67 ± 1.53 a60.50 ± 0.20 a24.98 ± 0.04 a35.86 ± 1.40 a154.81 ± 4.18 a
Values ± SD (n = 3) in the same column of the same cultivar with different letters are significantly different between treatments (p < 0.05, Tukey’s test); J-5, Lianjian 5; L-7, Lianjing 7.
Table 3. Effect of exogenous application of GABA on dry matter weight and plant growth rate of salt-tolerant (J-5) and salt-susceptible (L-7) rice cultivars.
YearCultivarTreatmentDry Matter Weight (g Pot−1)Plant Growth Rate (g d−1 Pot−1)
MTPIFSMAMT-PIPI-FSFS-MA
2020J-50 μM11.36 ± 0.09 d45.30 ± 0.34 d66.26 ± 1.02 d112.76 ± 1.51 d1.31 ± 0.01 d1.40 ± 0.05 ab1.01 ± 0.02 d
50 μM13.36 ± 0.06 c49.60 ± 0.47 c71.63 ± 0.85 c136.86 ± 3.01 c1.39 ± 0.02 c1.47 ± 0.06 a1.42 ± 0.05 c
100 μM14.76 ± 0.12 b53.38 ± 0.13 b74.50 ± 0.43 b157.61 ± 0.93 b1.49 ± 0.01 b1.41 ± 0.02 a1.81 ± 0.03 b
150 μM16.25 ± 0.15 a56.25 ± 0.36 a76.08 ± 0.09 a166.47 ± 1.01 a1.54 ± 0.02 a1.32 ± 0.02 b1.96 ± 0.02 a
L-70 μM6.53 ± 0.02 d30.48 ± 0.12 d43.36 ± 0.17 d66.22 ± 0.98 d0.86 ± 0.00 d0.76 ± 0.02 c0.48 ± 0.02 d
50 μM8.77 ± 0.07 c34.66 ± 0.31 c49.64 ± 0.94 c77.97 ± 0.68 c0.92 ± 0.01 c0.88 ± 0.07 b0.59 ± 0.01 c
100 μM9.77 ± 0.21 b36.42 ± 0.37 b53.75 ± 0.48 b85.43 ± 0.25 b0.95 ± 0.02 b1.02 ± 0.03 a0.66 ± 0.01 b
150 μM10.29 ± 0.12 a39.55 ± 0.36 a57.58 ± 0.42 a90.52 ± 0.23 a1.05 ± 0.01 a1.06 ± 0.03 a0.69 ± 0.01 a
2021J-50 μM11.22 ± 0.22 d44.83 ± 0.49 d65.89 ± 1.07 d111.25 ± 2.59 d1.29 ± 0.01 d1.40 ± 0.06 a0.99 ± 0.03 d
50 μM13.45 ± 0.09 c50.17 ± 0.05 c71.68 ± 0.39 c136.22 ± 1.94 c1.42 ± 0.00 c1.43 ± 0.03 a1.40 ± 0.05 c
100 μM14.56 ± 0.26 b53.19 ± 0.09 b74.28 ± 0.11 b156.60 ± 1.83 b1.49 ± 0.01 b1.41 ± 0.01 a1.79 ± 0.04 b
150 μM16.19 ± 0.16 a55.59 ± 0.49 a76.18 ± 0.12 a165.27 ± 0.96 a1.52 ± 0.02 a1.37 ± 0.04 a1.94 ± 0.02 a
L-70 μM6.48 ± 0.03 d29.34 ± 0.20 d42.93 ± 2.13 d64.89 ± 0.62 d0.82 ± 0.01 d0.80 ± 0.13 c0.46 ± 0.04 c
50 μM8.71 ± 0.13 c34.23 ± 0.25 c49.77 ± 0.57 c77.72 ± 0.65 c0.91 ± 0.01 c0.91 ± 0.05 bc0.58 ± 0.02 b
100 μM9.83 ± 0.18 b36.14 ± 0.08 b53.46 ± 0.45 b84.75 ± 0.52 b0.94 ± 0.01 b1.02 ± 0.02 ab0.65 ± 0.01 a
150 μM10.23 ± 0.11 a39.26 ± 0.17 a57.25 ± 0.08 a90.11 ± 0.88 a1.04 ± 0.01 a1.06 ± 0.01 a0.68 ± 0.02 a
Values ± SD (n = 3) in the same column of the same cultivar with different letters are significantly different between treatments (p < 0.05, Tukey’s test). MT, mid-tillering stage; PI, panicle initiation stage; FS, flowering stage; MA, maturity stage; J-5, Lianjian 5; L-7, Lianjing 7.
Table 4. Effect of exogenous application of GABA (0 μM, 50 μM, 100 μM, and 150 μM) on chlorophyll contents and SPAD value of salt-tolerant (J-5) and salt-susceptible (L-7) rice cultivars under salt-stressed environment.
YearCultivarTreatmentChl a
(mg g−1 FW)
Chl b
(mg g−1 FW)
Chl a + b
(mg g−1 FW)
Chl a/bSPAD
2020J-50 μM1.32 ± 0.04 b0.62 ± 0.02 b1.94 ± 0.04 c2.13 ± 0.07 a34.23 ± 0.04 d
50 μM1.35 ± 0.02 b0.65 ± 0.03 b2.00 ± 0.04 c2.08 ± 0.08 a37.34 ± 0.20 c
100 μM1.41 ± 0.03 a0.69 ± 0.01 a2.10 ± 0.03 b2.04 ± 0.06 a38.24 ± 0.07 b
150 μM1.45 ± 0.03 a0.72 ± 0.02 a2.17 ± 0.03 a2.02 ± 0.09 a39.06 ± 0.14 a
L-70 μM1.28 ± 0.04 b0.58 ± 0.01 c1.86 ± 0.04 c2.21 ± 0.06 a31.10 ± 0.09 c
50 μM1.31 ± 0.04 ab0.60 ± 0.03 bc1.91 ± 0.04 bc2.19 ± 0.13 a33.36 ± 0.26 b
100 μM1.35 ± 0.05 ab0.63 ± 0.02 ab1.98 ± 0.07 ab2.14 ± 0.02 a34.53 ± 0.51 a
150 μM1.36 ± 0.03 a0.64 ± 0.01 a2.00 ± 0.02 a2.13 ± 0.07 a34.78 ± 0.19 a
2021J-50 μM1.28 ± 0.03 c0.62 ± 0.01 b1.91 ± 0.03 d2.06 ± 0.02 a34.12 ± 0.03 d
50 μM1.34 ± 0.01 b0.65 ± 0.01 b1.99 ± 0.01 c2.08 ± 0.03 a37.28 ± 0.11 c
100 μM1.42 ± 0.01 a0.69 ± 0.03 a2.11 ± 0.04 b2.06 ± 0.08 a38.25 ± 0.09 b
150 μM1.45 ± 0.03 a0.71 ± 0.02 a2.16 ± 0.02 a2.03 ± 0.08 a39.06 ± 0.05 a
L-70 μM1.25 ± 0.03 b0.58 ± 0.02 c1.84 ± 0.05 c2.15 ± 0.04 a31.09 ± 0.10 d
50 μM1.32 ± 0.01 a0.61 ± 0.01 b1.93 ± 0.01 b2.15 ± 0.03 a33.26 ± 0.26 c
100 μM1.35 ± 0.03 a0.63 ± 0.01 ab1.98 ± 0.03 ab2.13 ± 0.05 a34.68 ± 0.14 b
150 μM1.36 ± 0.02 a0.65 ± 0.01 a2.01 ± 0.01 a2.09 ± 0.05 a35.09 ± 0.09 a
Values ± SD (n = 3) in the same column of the same cultivar with different letters are significantly different between treatments (p < 0.05, Tukey’s test). J-5, Lianjian 5; L-7, Lianjing 7.
Table 5. Effect of exogenous application of GABA (0 μM, 50 μM, 100 μM, and 150 μM) on stomatal density and size, and leaf anatomical properties of salt-tolerant (J-5) and salt-susceptible (L-7) rice cultivars in 2021.
CultivarTreatmentSL
(μm)
SW
(μm)
SA
(μm2)
SD
(mm−2)
SPI
(10−2 μm2 μm−2)
Sm
(μm2 μm−2)
Sc
(μm2 μm−2)
Sc/Sm
(%)
J-50 μM16.45 ± 0.19 d9.31 ± 0.07 d120.20 ± 1.91 d444.44 ± 10.18 a5.34 ± 0.12 a18.25 ± 0.07 d14.31 ± 0.06 d78.41 ± 0.20 c
50 μM17.80 ± 0.42 c10.33 ± 0.01 c144.34 ± 3.50 c348.89 ± 10.18 b5.03 ± 0.13 b20.30 ± 0.11 c16.76 ± 0.19 c82.58 ± 0.81 b
100 μM18.36 ± 0.18 b11.23 ± 0.08 b161.83 ± 1.91 b293.33 ± 6.67 c4.75 ± 0.16 c21.37 ± 0.16 b17.94 ± 0.21 b83.95 ± 0.87 ab
150 μM18.98 ± 0.13 a11.37 ± 0.09 a169.48 ± 0.81 a264.44 ± 10.18 d4.48 ± 0.19 d21.89 ± 0.05 a18.47 ± 0.23 a84.40 ± 0.89 a
L-70 μM26.66 ± 0.45 c16.27 ± 0.06 d340.55 ± 6.20 d271.11 ± 10.18 a9.24 ± 0.49 a15.25 ± 0.09 d10.32 ± 0.06 d67.64 ± 0.05 c
50 μM27.51 ± 0.16 b16.71 ± 0.06 c360.81 ± 1.05 c242.22 ± 3.85 cb8.74 ± 0.13 b17.25 ± 0.10 c12.24 ± 0.11 c70.98 ± 0.72 b
100 μM27.91 ± 0.10 ab17.25 ± 0.12 b377.95 ± 1.94 b211.11 ± 3.85 c7.98 ± 0.17 c18.14 ± 0.18 b13.23 ± 0.12 b72.90 ± 0.23 a
150 μM28.35 ± 0.11 a17.83 ± 0.18 a396.89 ± 3.25 a184.44 ± 3.85 d7.32 ± 0.20 d18.54 ± 0.08 a13.68 ± 0.15 a73.80 ± 0.74 a
SL, stomatal length; SW, stomatal width; SA, stomatal area; SD, stomatal density; SPI, stomatal pore area index; Sm, surface area of mesophyll cells exposed to intercellular airspace per leaf area; Sc, surface area of chloroplasts exposed to intercellular airspace per leaf area; Sc/Sm, proportion of mesophyll cell periphery covered by chloroplasts. J-5, Lianjian 5; L-7, Lianjing 7. Values ± SD (n = 3) in same column of same cultivar with different letters are significantly different between treatments (p < 0.05, Tukey’s test).
Disclaimer/Publisher’s Note: The statements, opinions and data contained in all publications are solely those of the individual author(s) and contributor(s) and not of MDPI and/or the editor(s). MDPI and/or the editor(s) disclaim responsibility for any injury to people or property resulting from any ideas, methods, instructions or products referred to in the content.