Abstract
The growing demand for quality food has intensified agricultural practices, thus deteriorating soil fertility. In response, reclamation techniques such as minimum, zero, or no tillage have been applied, especially in the Bajio region of the State of Guanajuato, Mexico. However, a reliable tool to evaluate the effectiveness of these techniques remains elusive. This study evaluated the effect of zero tillage and conventional tillage by developing a Soil Quality Index (SQI) from eight agricultural soils in the Bajio region. A set of 26 physicochemical indicators was used, reducing them by means of principal component analysis (PCA). Subsequently, the SQI methodology called “unified weighted” was applied. The resulting SQIu included key indicators such as C/N, SND, ESP, and Fe. Although significant differences in soil quality were observed among the samples tested, the SQIu was unable to discern soil quality under the different tillage schemes. This may be attributed to the limited application time of zero tillage, which might not be sufficient to achieve significant recovery of SQI indicators. Nevertheless, the SQIu could be useful as a monitoring tool to evaluate the progress of soil recovery under zero tillage, both in the studied area and in similar contexts at the national or international level.
1. Introduction
Human populations depend on high-quality food. Throughout history, agriculture and its methods have been crucial to the advancement of societies. However, certain agricultural practices, such as monoculture farming, deep tillage, and the use of low-quality water, diminish the ability of soils to produce quality nutritious food, making it difficult to effectively feed communities [1].
In today’s society, with more stringent demands on food standards, there is increasing pressure on agricultural production chains. This has led to an increase in the intensity of use of various production technologies, such as tillage, which is used in an industrialized way to expose soil organic matter (OM) and facilitate its use by crops. However, tillage has also had negative effects, such as reduced OM, breakdown of soil aggregates, and decreased porosity, which affects the soil’s ability to retain and provide water to crops. These changes are associated with soils more vulnerable to erosion [2].
In this context, Mexico is currently facing similar soil challenges to those mentioned above, as agriculture is one of the country’s main economic activities. Intensive agriculture has caused the deterioration of extensive agricultural areas, including the Bajio region in the State of Guanajuato, where a general decline in soil fertility has been observed [3].
Governments, being aware of the inherent problems in an economic model based on unlimited profits in a world of finite resources, have implemented programs to measure the environmental deterioration caused by intensive agricultural practices. They have also established programs to conserve and restore degraded soils by loss of fertility and erosion. However, so far, there is not an inexpensive and easy-to-implement tool to effectively assess soil quality.
A system that meets the criteria of being trouble-free to implement, inexpensive, and relatively uncomplicated to interpret consists of the Soil Quality Indices (SQI). These indices are mathematical tools based on physicochemical and biological parameters or indicators related to the ecosystem and agronomic services provided by the soil. There are several methodologies for developing an SQI, the most common being the SQIs developed by expert opinion [4], additive SQIs [5], weighted SQIs, and unified weighted SQIs [6]. However, there is not a single consensus for selecting the appropriate methodology to develop an SQI to suit specific soil conditions. Therefore, several SQIs have been established, and their results are compared to determine which methodology best suits the analyzed soils.
Similar approaches have been developed in different parts of the world. For example, Chang et al. [7] created a Soil Health Index (SHI) for agricultural soils northeast of the Mississippi River in the United States. They established that indicators of hydrogen potential (pH), total organic carbon (C) (TOC), total nitrogen (N) (TN), phosphorus (P), bulk density (BD), aggregate stability in water (ASW), dehydrogenase activity (DHA), and heterotrophic plate count are most closely related to soil quality and health under different tillage practices. On the other hand, Adak et al. [4] developed an SQI for agricultural soils under corn–sorghum rotation in the northwestern Indo-Gangetic plains of India. They used the methodologies of SQI by expert opinion and unified weighted SQI, employing principal component analysis (PCA). They identified that indicators of potassium (K), P, TOC, electrical conductivity (EC), BD, DHA, and microbial biomass C (BMC) in soil are most closely related to soil quality under different tillage practices.
The aforementioned soil-fertility challenges and the permanent necessity for tools to evaluate remediation processes have motivated the development of a specific strategy that examines the effects of conventional tillage techniques and soil reclamation techniques on fertility indicators of agricultural soils in the Bajio region in the State of Guanajuato. Therefore, the following research hypotheses are posed: (1) Conventional tillage and zero-tillage methods generate differences in soil quality-related indicators. (2) The development of an SQI based on physicochemical indicators that considers both tillage methods will allow for distinguishing soil quality under these two different tillage approaches.
2. Materials and Methods
2.1. Study and Sampling Area
Sampling was carried out using eight agricultural soils in the Bajio region, within five municipalities of the State of Guanajuato, central Mexico. Sites are located at an altitude that ranges from 1700 to 1800 m above sea level. At these locations, the average annual temperature varies between 18 and 22 °C, and annual precipitation reaches 700 mm; accordingly, the climate at the different locations could be classified as arid or semi-arid.
The selected soils were chosen using the Carta de Uso de Suelo y Vegetación Serie V Guanajuato, as well as data from the federal program ProAgro 2017 spring–summer cycle and the Marco Geoestadístico Nacional 2018. In order to select the agricultural soils, the following criteria were applied: (1) the presence of different irrigation zones, (2) uniformity in soil type, and (3) an extension of between five and six hectares. Based on these criteria, eight agricultural soils with different crops and management practices were selected (Table 1).

Table 1.
Sampled soils from the Bajio region.
The following is a description of the general management of the traditional and zero-tillage schemes used in the Bajo region. Traditional tillage employs machinery designed to cut and invert all or part of the first 15 cm of soil. The main activities include subsoiling, fallowing, harrowing (using tractors with 12 to 15 cm diameter discs to create a planting bed at least 10 cm deep), and land leveling. On the other hand, no-tillage is based on sowing directly on a soil surface that retains at least 30% of the residues of the previous crop. For this purpose, specific seed drills are used for no-tillage, either single or multiple [8].
Sampling began by dividing each farming field under study into three subplots of 600 m2 each. Once the subplots were established, the soils were sampled, starting at one end and following a zig-zag pattern. Samples were taken every 18 m using an auger, making a 30 cm by 40 cm deep and wide hole, respectively. In each borehole, 2 kg of soil were collected, thus obtaining 15 subsamples per subplot and a total of 45 subsamples per sampled soil, thus generating a composite sample. A total of 360 soil samples were collected and then georeferenced using a Garmin® eTrex Legend GPS (Garmin International Inc., Olathe, KS, USA)
2.2. Sample Preparation
Once the samples were collected, they were placed in Ziploc® plastic bags and transported to the laboratory at room temperature. There, the soil samples were aerated and dried. Subsequently, they were sieved using a 2 mm opening-size sieve. Once this process was completed, the samples were placed back into Ziploc® plastic bags and stored at 4 °C until further analysis.
2.3. Physicochemical Characterization
Soil samples were subjected to physicochemical analysis in triplicate to evaluate their fertility. Soil texture was determined using the Bouyoucos hydrometer method [9], expressing the percentages of sand (SND), clay (CLY), and silt (SLT). The textural classification was carried out according to the diagram proposed by the USDA [10]. The pH was determined according to the method described by Thomas [11]. The EC was measured with a HANNA model HI9811-5 digital conductivity meter (Hanna instruments Inc., Woonsocket, RI, USA) and reported in dS m−1 [12]. The water-holding capacity (WHC) was determined by weight difference according to Nannipieri’s method [13], expressed as a percentage of WHC. The TOC content was determined according to Walkley and Black [14], expressed as a percentage. The OM was calculated by multiplying the TOC by the Van Benmelen factor (1.724) [15] and reported as a percentage. TN was analyzed by digestion of the sample and subsequent determination of ammoniacal N (N-NH4+) using a micro-Kjeldahl equipment model mdk-6 (Novatech, San Pedro Tlaquepaque, Jal., Mexico), with colorimetric quantification at 660 nm using a UV-Vis spectrophotometer JEANWAY 6305 (Bibby Scientific Ltd., Dunmow, Essex, UK), reported in percentage [16]. Macronutrients (P, K, calcium (Ca), magnesium (Mg), sodium (Na), and sulfur (S)) and micronutrients (iron (Fe), zinc (Zn), manganese (Mn), copper (Cu), and boron (B)) were quantified by microwave acid digestion/ICP [17], expressed in meq 100 g−1 of soil. The cation exchange capacity (CEC) was determined following the Cottenie method [18], reported in meq 100 g−1 of soil. The exchangeable sodium percentage (ESP) and sodium adsorption ratio (SAR) indicators were determined according to SEMARNAT methods [19] and reported as a percentage.
2.4. Statistical Analysis
The analysis was performed using R statistical software version 4.3.2 [20]. It started with a Shapiro–Wilk normality test with a significance level of . To evaluate the differences between the analyzed indicators of the sampled soils, a Kruskal–Wallis non-parametric analysis of variance was performed, followed by a Dunnett’s test of medians with Bonferroni adjustment and a significance level of [21]. As part of the PCA, a Spearman’s nonparametric correlation matrix followed by a Mantel test was performed [21], considering important correlations as those with values of , with a significance level of [22]. Subsequently, a Kaiser–Meyer–Olkin (KMO) fit analysis was performed to determine the suitability of the data set for PCA; eliminating indicators with a KMO < 0.5. PCA was then performed, selecting principal components (PC) with an eigenvalue criterion ≥ 1. Indicators that presented a linear correlation with any of the established PCs were selected. Then, the redundancy of the selected indicators was reduced, prioritizing the number of interactions, PC membership, and correlation with their respective PC [22]. Finally, the quality results obtained by developing the SQI were analyzed using a Kruskal–Wallis nonparametric analysis of variance, followed by a Dunnett’s test of medians with Bonferroni adjustment and a significance level of [21].
2.5. Development of the SQI
An SQI was developed following the methodology described by Yu et al. [6], which is based on the use of the unified additive weights equation (SQIu) (Equation (1)), using the variability obtained in the established PCs.
where represents the proportion of the variability of the PCs to which the indicator is correlated, and refers to the score value of the indicators resulting from the redundancy reduction process.
Scoring of the indicators resulting from the redundancy reduction process was performed using two equations, depending on the function considered for the indicator in the soil. The non-linear scoring equation (Equation (2)) was used for those indicators considered as “more is better” or “less is better”.
where represents the maximum value of the indicator, represents the average value of the indicator, represents the value obtained from the indicator, and represents the slope of the indicator (2.5 for those indicators whose function is considered as “more is better” and 2.5 for those indicators whose function is considered as “less is better”).
In turn, Equation (3) was used for those indicators whose function in the soil is considered optimal.
where represents the optimum value of the indicator and therefore the slope is equal to 0.5, represents the limit value of the indicator, and X represents the value of the indicator.
The objective of the SQIu is to be a tool of easy application and interpretation, which establishes results between values of 0 and 1, allowing the quality of soils to be established according to the classification shown in Table 2.
Table 2.
Soil quality classification.
3. Results and Discussion
3.1. Analysis of Variance of Indicators
Table 3 shows the results of the Kruskal–Wallis analysis of the indicators in the sampled soils. It is observed that all indicators presented significant differences among the different analyzed soils. It is important to highlight that the soils showed neutral (Ce1 < Sa6 < Sa5 < Ce2) and slightly acidic conditions (Cm2 < Va1 < Co1 < Va2). The tendency towards acidification in the second group of soils could be due to the traditional applications of chemical fertilizers (Table 1), which cause the release of organic acids through the action of microorganisms [23]. As for the EC indicator, all soils presented non-saline conditions, which reduces the impact of salinity on soil structure [24]. In relation to the SND, CLY, and SLT fractions, the soils were classified as vertisols with high CLY content [10]. Regarding the WHC indicator, soils were considered to have low (Co1 < Ce1 < Ce2) and moderate (Cm2 < Va1 < Va2 < Sa6 < Sa5) capacity. The low WHC values could be due to the deterioration caused by continuous and deep plowing used in conventional agriculture. In addition, the low WHC values could be related to low OM [25].
Table 3.
Kruskal-Wallis analysis of analyzed indicators.
For TOC and OM indicators, soils were classified with moderate concentrations (Co1 < Sa6 < Sa6 < Va2 < Ce1 < Ce2) and high concentrations (Sa5 < Va1 < Cm2). This contradicts the assumption that agricultural soils have low OM concentrations due to intensive agricultural practices. The high OM concentrations in soils Sa5, Va1, and Cm2 could be due to the application of organic amendments that increased the concentration of nutrients in the soils analyzed [26,27]. In relation to the TN indicator, the soils were classified in the moderate (Sa6 < Sa5 < Va2) and very high (Va1 < Cm2 < Ce2 < Co1 < Ce1 < Ce1) concentration categories. The high concentrations found could be due to the fertilization practices in the area (Table 1), which could cause leaching of these nitrogenous compounds to nearby water bodies, causing contamination, along with the decrease in soil pH [28]. With respect to the C/N indicator, high concentrations of both indicators lead to low values of the indicator, which allows the mineralization of OM in the soil and facilitates its degradation by the metabolic activity of the microorganisms present. In addition, there could be stimulating effects on the growth of microbial populations due to the chemical fertilization used [29].
In relation to the macronutrients P, K, Ca, Mg, Na, and S, the soils were classified with very low concentrations for the P indicator, which could affect plant growth and the development of microbial communities. P is essential for the creation of energy molecules used in their metabolism and the formation of cell membranes [3,30]. For indicator K, soils were classified with moderate concentration (Cm2 < Ce1) and high concentrations for the rest of the soils. The high concentrations could be due to the chemical fertilization used in the soils (Table 1). Excess K can cause osmotic stress in plants [25]. Regarding the Ca indicator, all soils showed very high concentrations. Ca is essential for plant development and photosynthesis, but high concentrations could affect growth through osmotic stress [31]. The indicator Mg also showed very high concentrations in all soils. Mg is essential for photosynthesis and leaf pigmentation, but high concentrations, as with Ca, can cause osmotic stress [32]. As for the Na indicator, the soils showed adequate concentrations (Ce1 < Cm2 < Ce2 < Co1) and high concentrations for the rest of the soils. Excess Na can affect soil structure by interacting with the indicator CLY and reducing porosity, compacting the soil [25].
Finally, all soils showed very high concentrations of S, essential for crop development and resistance to abiotic stress, but its excess may be due to fertilization practices in the study area, which could lead to leaching phenomena.
As for micronutrients, the soils were classified with adequate concentrations for the indicators Fe, Mn, and Cu. Fe is essential for crops in enzyme production, photosynthesis, and N metabolism. Its absence can affect crop growth and yield, as well as the cycling of nutrients in the soil by microbial communities. On the other hand, Mn is essential for chloroplast synthesis and the photosynthesis process, as well as for the production of various enzymes. Its deficiency can cause chlorosis and necrotic spots and affect root growth. Cu plays an essential role in reproduction, photosynthesis, and disease resistance mechanisms. Its deficiency reduces crop growth and yield, as well as grain and fruit quality [1]. As for Zn, soils were classified with high concentrations (Sa5 < Va1), presenting adequate concentrations in the remaining soils. Zn is important for growth, heat tolerance, pathogen resistance, and reproductive functions in plants. Its deficiency is a global problem and its leaching is the main loss in soils. For B, soils were classified with low concentration (Ce1 < Ce2), adequate concentrations (Cm2 = Co1 = Sa6), and high concentrations (Va1 < Va2 < Sa5). Lack or deficiency of B can affect crop growth and yield, root elongation, and reduce nodule number in legumes. High concentrations of B are toxic to crops and microorganisms [1].
3.2. PCA
3.2.1. Correlation Matrix and Mantel Test
The PCA began with the creation of a Spearman correlation matrix, shown in Figure 1. Figure 1A highlights the interactions with the pH indicator, which has negative correlations with the SLT fraction. This is consistent with the nature of this fraction, as it has been used to regulate pH due to its concentration in carbonates [7,33]. The pH shows a positive correlation with Mn, which could be attributed to the slightly acidic pH of the soils. However, the availability of the element Mn could decrease in alkaline soils (pH > 7.5) [1]. Soil fractions (SND, CLY) showed positive correlations with most soil minerals, which in turn increased the CEC indicator. Regarding the Mantel test, zero tillage showed significant positive correlations with the indicators EC, SND, CLY, WHC, TN, C/N, P, Ca, Mg, Na, B, CEC, ESP, and SAR while showing significant negative correlations with the indicators K and Cu (Figure 1A). Regarding conventional tillage, it showed significant positive correlations with the indicators SND, CLY, WHC, TN, C/N, Ca, Mn, and CEC, while it showed significant negative correlations with the indicator S (Figure 1B). It can be highlighted that the effect presented by the different types of tillage on the interactions of the indicators analyzed presents a greater positive synergism in zero tillage, while conventional tillage presents a greater tendency to negative interactions. Regarding the correlations between soils with the indicators, significant positive correlations were presented with SND, CLY, WHC, TN, Ca, Mg, Cu, and CEC, presenting significant negative correlations with the K indicator (Figure 1C).
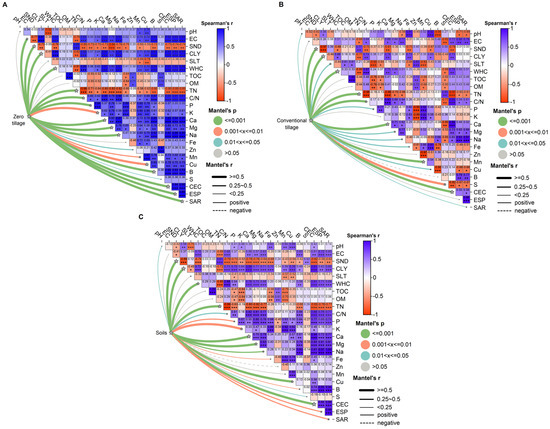
Figure 1.
Spearman correlation matrix with Mantel test. (A) Zero-tillage soils; (B) Conventionally tilled soils; (C) General (both tillage schemes); pH, hydrogen potential; EC, electrical conductivity; SND, sand fraction; CLY, clay fraction; SLT, silt fraction; WHC, water-holding capacity; TOC, total organic C; OM, organic matter; TN, total N; C/N, C and N ratio; P, phosphorus; K, potassium; Ca, calcium; Mg, magnesium; Na, sodium; Fe, iron; Zn, zinc; Mn, manganese; Cu, copper; B, boron; S, sulfur; CEC, cation exchange capacity; ESP, exchangeable sodium percentage; SAR, sodium adsorption ratio; levels of significant differences, * significant under of , ** very significant under of , *** and highly significant under a significance level of .
The SND fraction showed significant negative correlations with most of the macro- and micronutrients, with the exception of the Zn indicator, possibly due to leaching processes. In addition, it showed significant positive correlations with the TN and S indicators, which could be explained by the fertilization processes used in the soils (Table 1). The CLY fraction presented an inverse behavior to that shown by the SND indicator, possibly due to the negative charges present in this fraction, which would interact with the soil cations, retaining them [15]. The SLT fraction showed negative correlations with the pH, CLY, Mn, and Cu indicators, possibly due to the capacity of the possible carbonates in this fraction, which decreases the availability of these elements by adsorption phenomena [1]. The CEC indicator presented positive correlations with all macro- and micronutrients, as well as with the ESP and SAR indicators, which could be due to the fact that the CEC indicator is closely related to the CLY indicator due to the negative charges of the aforementioned fraction, which retains minerals with greater strength [15].
In reference to the correlation matrix for soils under conventional tillage (Figure 1B), the following interactions stand out. The pH showed positive correlations with the indicators Fe and Cu, possibly due to the slightly acidic conditions of the soils, which would facilitate the availability of these elements for crops. However, these correlations could be reversed under neutral or alkaline conditions [1]. The pH presented negative correlations with the SND fraction and indicator B. The negative correlation with the SND fraction could be due to the effects of processes of mineral leaching, which could leave a higher concentration of compounds with elements such as Al [34]. Regarding indicator B, its availability in the soil is highly dependent on pH, being lower in acid soils and increasing in alkaline conditions [1]. Regarding the different soil fractions, the SND indicator showed negative correlations with the CLY, WHC, and Ca indicators. This could be due to the fact that the higher the amount of SND, the lower the proportion of CLY, which in turn increases the porosity of the soil, decreasing its capacity to retain water available for crops. The negative correlation with the Ca indicator could be a consequence of the leaching phenomena of the elements caused by greater soil porosity. In relation to macro- and micronutrients, mixed correlations were observed. It is important to mention that P and K showed negative correlations with Zn, possibly due to the application of P-based chemical fertilizers or organic amendments, which could decrease the availability of Zn through the formation of organo-mineral complexes [1]. With respect to the CEC indicator, a decrease in the number of important interactions is observed, possibly due to structural alterations caused by conventional tillage over time. This contrasts with the effects of zero tillage on the soil, which may include an increase in OM, lower BD, and higher porosity, improving soil physical conditions in general [33].
Referring to Figure 1C, which takes into consideration the indicator values of all the soils analyzed, most of these indicators presented at least one significant correlation with some other indicator, with the exception of the TOC, Zn, and S indicators, which were discarded from the database for the PCA.
3.2.2. Obtaining PCs
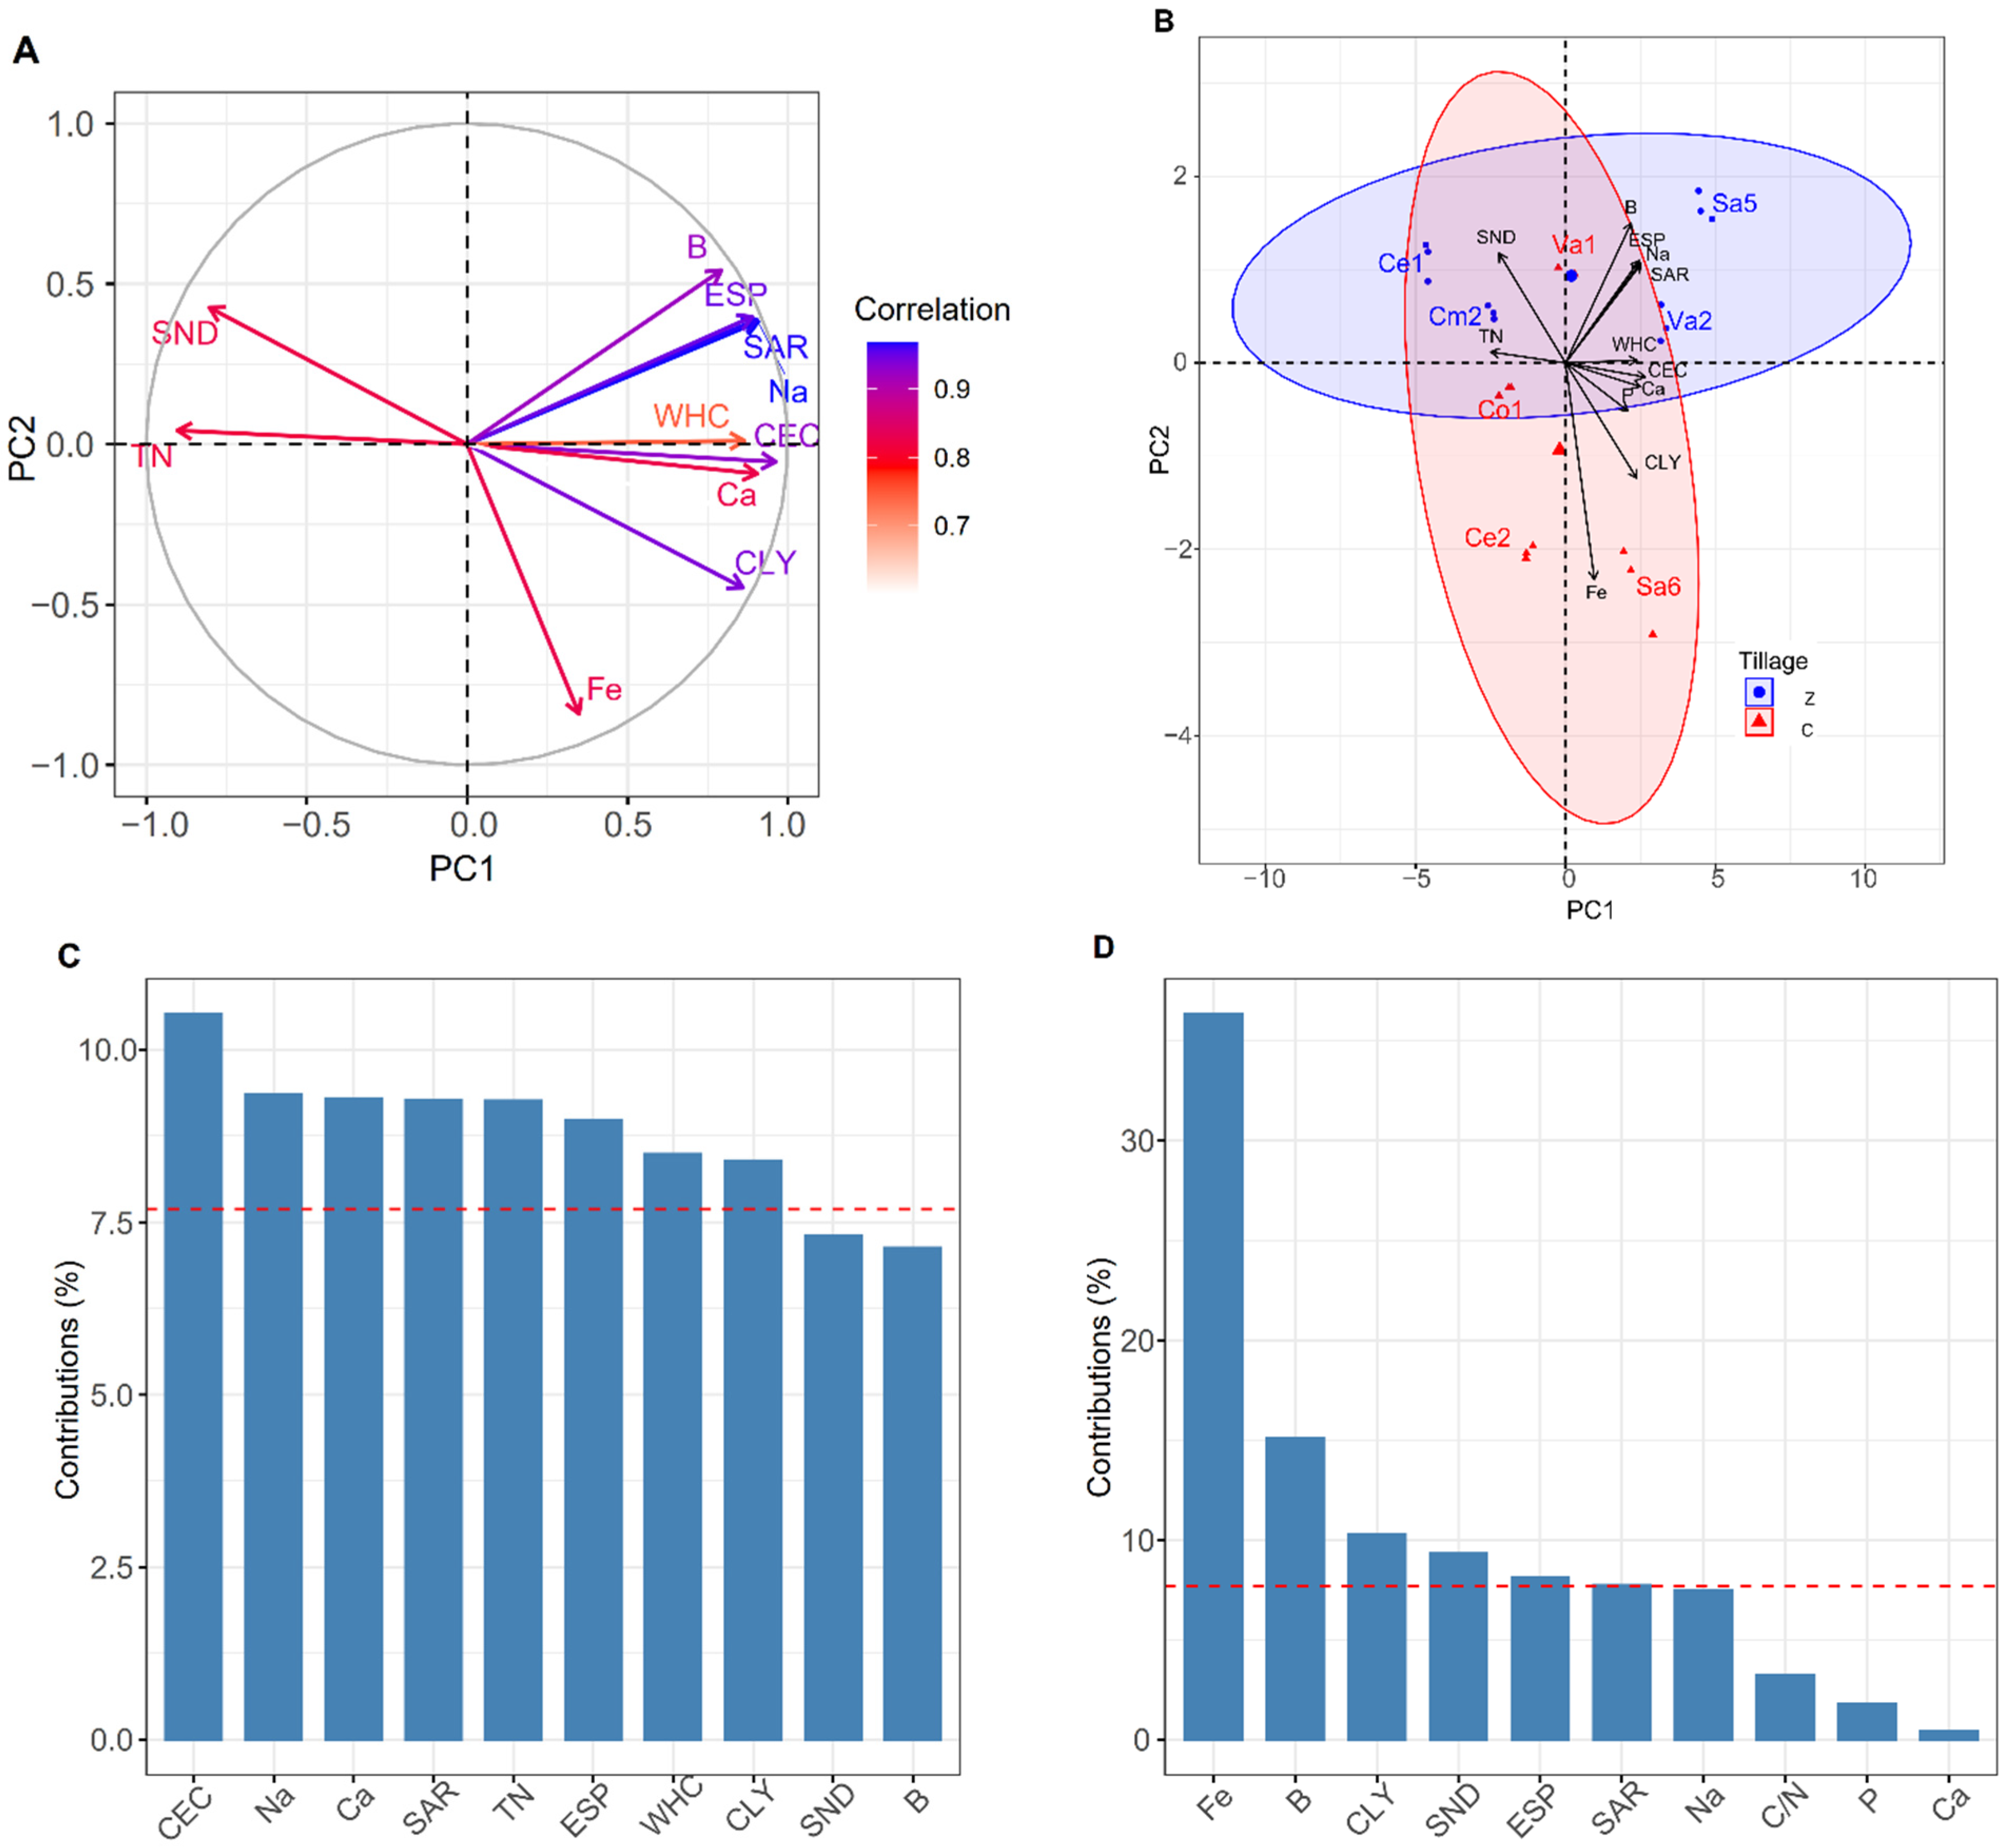
The PCA generated two PCs that explained 82.7% of the variability of the data. PC1 accounted for 67.7% of this variability and showed positive correlations with the indicators CLY, WHC, C/N, P, Ca, Na, Na, B, CEC, ESP, and SAR, while it presented negative correlations with the indicators SND and TN (Table 4 and Figure 2A). On the other hand, PC2 accounted for 15% of the variability and showed a single negative correlation with the Fe indicator (Figure 2A). The indicators that contributed the most to the variability established by the PCs are shown in Figure 2C,D for PC1 and PC2, respectively.
Table 4.
Weights of indicators in the PCs of the sampled soils.

Figure 2.
PCA results. (A) Bi-graph of PCs; (B) Bi-graph of PCs and soil group; (C) Indicator contributions to PC1; (D) Indicator contributions to PC2. Z, zero tillage; C, conventional tillage. Red dotted line refers to the average contribution of indicators. PC, principal component; SND, sand fraction; CLY, clay fraction; WHC, water-holding capacity; TN, total N; C/N, C and N ratio; P, phosphorus; Ca, calcium; Na, sodium; Fe, iron; B, boron; CEC, cation exchange capacity; ESP, exchangeable sodium percentage; SAR, sodium adsorption ratio.
In relation to soils, it was observed that soils SA5 and VA2 were more related to indicators B, Na, ESP, and SAR, as well as to indicator WHC, respectively. Indicators B and SND showed a stronger relationship with soil Va1, while for soils Ce1 and Cm2, the indicators with the greatest influence were SND and TN. Soil Sa6 was more related to indicators SND and Fe, and for soils Co1 and Ce2, no outstanding relationships with any particular indicator were observed.
3.2.3. Key Indicators for the Development of the SQI
After the redundancy reduction process, the most relevant indicators were selected to evaluate soil quality under both types of tillage. These indicators were C/N, SND, ESP, and Fe. The C/N indicator is closely related to the quality of OM present in the soil. It is considered that values between 25 and 15 indicate adequate conditions for its mineralization by soil microorganisms [29]. On the other hand, the SND indicator is linked to soil structure. High values in this fraction can lead to the leaching of minerals, which reduces the nutritional capacity of the soil [35]. The ESP indicator is associated with the Na concentration in the soil. Na can replace Ca in the soil structure and interact with the negative charges of the CLY fraction [15], resulting in a decrease in soil porosity and a reduction of the WHC indicator, making soils more susceptible to water erosion [36]. Finally, the Fe indicator is closely related to crop nutrition. It is essential for plant growth, as it is involved in N metabolism, photosynthesis, and enzyme synthesis [1]. The developed SQIu from the aforementioned indicators is shown in Equation (4).
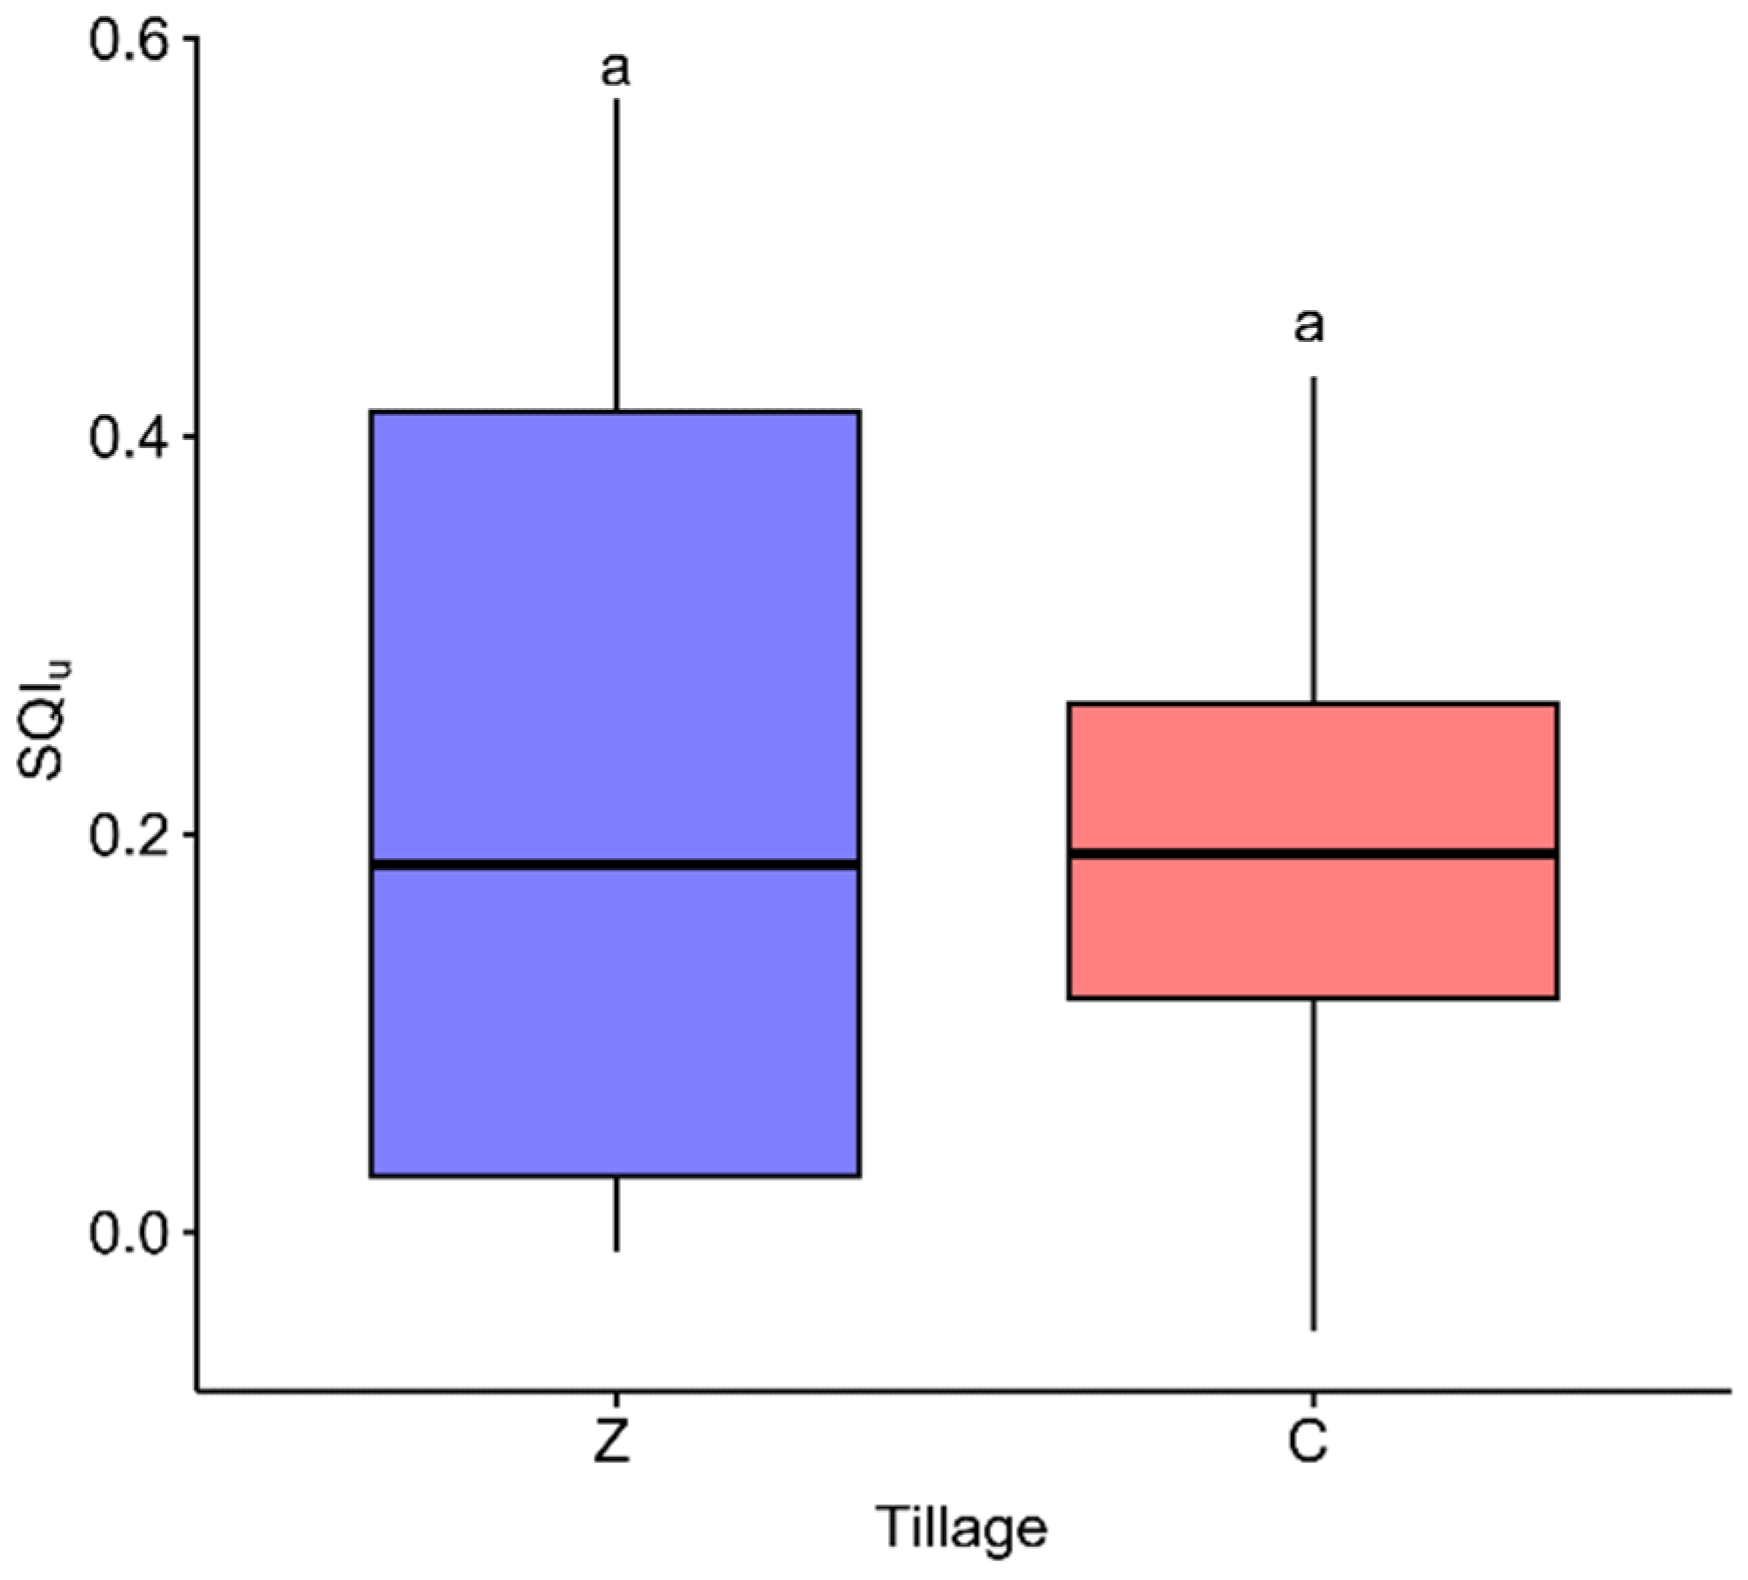
After developing the SQIu, it was applied to the soils analyzed under both tillage schemes, and the results are presented in Figure 3.

Figure 3.
Kruskal–Wallis analysis of SQIu results as a function of tillage scheme. Z, zero tillage; C, conventional tillage. Different letters above the box mean significant differences according to a Kruskal-Wallis test with subsequent Dunnett’s test with Bonferroni adjustment.
The results of this study are in line with previous research. Chang et al. [7] developed an SHI composed of seven indicators: pH, TOC, TN, and P (soil nutrition), BD and ASW (structure), and DHA (microbial activity). Some of these aforementioned indicators coincide with those selected in the present study, such as C/N and Fe (nutrition) and SND (structure). Likewise, Adak et al. [4] developed an SQI with a methodology similar to the one used in the present study, focused on the impact of tillage on soil quality. This SQI included indicators such as K, P, and TOC (soil nutrition), BD (structure), EC (salinity), and DHA (microbial activity). Compared to the aforementioned studies, the SQIu developed in this study presents operational advantages, such as fewer analyses required, reducing costs, and simplifying the interpretation of quality results. However, a limitation of the SQIu presented here is the absence of indicators related to microbial activity, which have been shown to be particularly sensitive to changes in soil conditions [37]. This omission could partially limit the index’s ability to detect subtle variations in soil quality, highlighting the need to include these indicators in the SQIu.
It is observed that SQIu was not able to distinguish soil quality between the different tillage schemes. This could be attributed to the time during which the treatments were applied. A longer zero-tillage period is necessary to be able to observe significant changes in the physicochemical indicators analyzed [38,39]. It is also important to note that there is greater variability in quality in the zero-tillage scheme. This could be explained by the different periods of time during which the soils were subjected to these treatments (Table 1). Very low quality (Va2 and Sa5), low quality (Cm2), and moderate quality (Ce1) were reported. In contrast, soils under conventional tillage showed less variability in quality, with conditions ranging from very low to low quality.
4. Conclusions
The analysis of indicators of agricultural soils under different tillage schemes revealed significant differences among soils. The different tillage schemes impacted the correlations of the indicators analyzed. The zero-tillage scheme showed a higher positive interaction between soil macro- and micronutrients and the CEC indicator, which could enhance the nutritional capacity of the soil for crops. In contrast, conventional tillage showed fewer interactions between macro- and micronutrients with the CEC indicator, as well as between different soil fractions and nutrients. PCA reduced the complexity of the study, initially with 26 indicators related to soil fertility, to only four key indicators closely related to soil quality: C/N, SND, ESP, and Fe. The C/N indicator provides insight into soil OM quality, while SND clarifies soil structure and its capacity to retain water. ESP provides information on the effect of Na on soil structure, and Fe reflects the capacity of the soil to support crops. However, the developed SQIu failed to differentiate the quality of soils under different tillage schemes, possibly due to the short periods during which soils under zero-tillage were evaluated, which may not have significantly affected the indicators analyzed. Although SQIu could not distinguish soil quality, it is still a useful tool to effectively measure remediation processes of degraded agricultural soils, especially under similar conditions in the Bajío region of the State of Guanajuato. This tool could be applied nationally or internationally in agricultural soils under similar conditions.
Author Contributions
M.d.l.L.X.N.-R.: Conceptualization, data curation, formal analysis, investigation, methodology, software, validation, visualization, writing original draft, resources, writing review, and editing. E.C.-B.: Supervision, writing review and editing. G.A.S.-M. and G.A.-G.: Methodology, writing review and editing. H.R.-M. and F.E.T.-F.: Investigation, validation. H.I.B.-R.: Conceptualization, data curation, formal analysis, investigation, methodology, software, validation, visualization, writing original draft, funding acquisition, project administration, resources, supervision, writing review and editing. All authors have read and agreed to the published version of the manuscript.
Funding
This research was funded by Consejo Nacional de Humanidades, Ciencias y Tecnologías (CONAHCYT) for the postgraduate scholarship No. 491864 (2019 to 2023).
Data Availability Statement
The data that support the findings of this study are available by request from the corresponding author (H.I.B.-R.). The data are not yet publicly available because they are being utilized in other current studies.
Conflicts of Interest
The authors declare that they have no known competing financial interests or personal relationships that could have appeared to influence the work reported in this paper.
References
- Denton-Thompson, S.M.; Sayer, E.J. Micronutrients in Food Production: What Can We Learn from Natural Ecosystems? Soil Syst. 2022, 6, 8. [Google Scholar] [CrossRef]
- Nunes, M.R.; Van Es, H.M.; Schindelbeck, R.; Ristow, A.J.; Ryan, M. No-till and Cropping System Diversification Improve Soil Health and Crop Yield. Geoderma 2018, 328, 30–43. [Google Scholar] [CrossRef]
- Bedolla-Rivera, H.I.; Xochilt Negrete-Rodríguez, M.D.L.L.; Medina-Herrera, M.D.R.; Gámez-Vázquez, F.P.; Álvarez-Bernal, D.; Samaniego-Hernández, M.; Gámez-Vázquez, A.J.; Conde-Barajas, E. Development of a Soil Quality Index for Soils under Different Agricultural Management Conditions in the Central Lowlands of Mexico: Physicochemical, Biological and Ecophysiological Indicators. Sustainability 2020, 12, 9754. [Google Scholar] [CrossRef]
- Adak, S.; Bandyopadhyay, K.; Purakayastha, T.J.; Sen, S.; Sahoo, R.N.; Shrivastava, M.; Krishnan, P. Impact of Contrasting Tillage, Residue Mulch and Nitrogen Management on Soil Quality and System Productivity under Maize-Wheat Rotation in the North-Western Indo-Gangetic Plains. Front. Sustain. Food Syst. 2023, 7, 1230207. [Google Scholar] [CrossRef]
- Nabiollahi, K.; Taghizadeh-Mehrjardi, R.; Eskandari, S. Assessing and Monitoring the Soil Quality of Forested and Agricultural Areas Using Soil-Quality Indices and Digital Soil-Mapping in a Semi-Arid Environment. Arch. Agron. Soil Sci. 2018, 64, 696–707. [Google Scholar] [CrossRef]
- Yu, P.; Liu, S.; Zhang, L.; Li, Q.; Zhou, D. Selecting the Minimum Data Set and Quantitative Soil Quality Indexing of Alkaline Soils under Different Land Uses in Northeastern China. Sci. Total Environ. 2018, 616–617, 564–571. [Google Scholar] [CrossRef]
- Chang, T.; Feng, G.; Paul, V.; Adeli, A.; Brooks, J.P.; Jenkins, J.N. Soil Health Assessment for Different Tillage and Cropping Systems to Determine Sustainable Management Practices in a Humid Region. Soil Tillage Res. 2023, 233, 105796. [Google Scholar] [CrossRef]
- Mandujano Bueno, A.; Paredes Melesio, R.; Alamilla Gómez, M.d.P. Guía para la Producción de Granos Básicos Maíz, Fijol, Trigo y Sorgo en Guanajuato; Instituto Nacional de Investigaciones Forestales, Agrícolas y Pecuarias [INIFAP]: Coyoacán, Mexico, 2013. [Google Scholar]
- Bouyoucos, G.J. Hydrometer Method Improved for Making Particle Size Analyses of Soils. Agron. J. 1962, 54, 464–465. [Google Scholar] [CrossRef]
- U.S. Department of Agriculture, [USDA]. Soil Survey Manual; United Department of Agriculture: Washington, DC, USA, 1951. [Google Scholar]
- Thomas, G.W. Soil pH and Soil Acidity. In SSSA Book Series; Sparks, D.L., Page, A.L., Helmke, P.A., Loeppert, R.H., Soltanpour, P.N., Tabatabai, M.A., Johnston, C.T., Sumner, M.E., Eds.; Soil Science Society of America, American Society of Agronomy: Madison, WI, USA, 2018; pp. 475–490. ISBN 978-0-89118-866-7. [Google Scholar]
- Hendrickx, J.M.H.; Das, B.; Corwin, D.L.; Wraith, J.M.; Kachanoski, R.G. Relationship between Soil Water Solute Concentration and Apparent Soil Electrical Conductivity. In Methods of Soil Analysis; Soil Science Society of America: Madison, WI, USA, 2002; Volume 4, pp. 1275–1282. [Google Scholar]
- Hopkins, D.W.; Alef, K.; Nannipieri, P. Methods in Applied Soil Microbiology and Biochemestry. J. Appl. Ecol. 1996, 33, 178. [Google Scholar]
- Walkley, A.; Black, I.A. An Examination of the Degtjareff Method for Determining Soil Organic Matter, and a Proposed Modification of the Chromic Acid Titration Method. Soil Sci. 1934, 37, 29–38. [Google Scholar] [CrossRef]
- Yilmaz, E.; Sönmez, M. The Role of Organic/Bio–Fertilizer Amendment on Aggregate Stability and Organic Carbon Content in Different Aggregate Scales. Soil Tillage Res. 2017, 168, 118–124. [Google Scholar] [CrossRef]
- Bremner, J.M. Nitrogen-Total. In Methods of Soil Analysis: Chemical Methods; The Soil Science Society of America, Inc.: Madison, WI, USA, 2018; pp. 1085–1121. [Google Scholar]
- Bettinelli, M.; Baroni, U. A Microwave Oven Digestion Method for the Determination of Metals in Sewage Sludges by ICP-AES and GFAAS. Int. J. Environ. Anal. Chem. 1991, 43, 33–40. [Google Scholar] [CrossRef]
- Cottenie, A. Soil and Plant Testing as a Basis of Fertilizer Recommendations; FAO Soils Bulletin; Food and Agriculture Organization of the United Nations: Rome, Italy, 1980; pp. 64–65. [Google Scholar]
- Secretaría de Medio Ambiente y Recursos Naturales [SEMARNAT] NOM-021-RECNAT-2002. 2003. Available online: http://www.ordenjuridico.gob.mx/Documentos/Federal/wo69255.pdf (accessed on 20 November 2024).
- R Core Team. R: Language and Environment for Statistical Computing; R Foundation for Statistical Computing: Vienna, Austria, 2021. [Google Scholar]
- Mahajan, G.; Das, B.; Morajkar, S.; Desai, A.; Murgaokar, D.; Kulkarni, R.; Sale, R.; Patel, K. Soil Quality Assessment of Coastal Salt-Affected Acid Soils of India. Environ. Sci. Pollut. Res. 2020, 27, 26221–26238. [Google Scholar] [CrossRef] [PubMed]
- Muñoz-Rojas, M.; Erickson, T.E.; Dixon, K.W.; Merritt, D.J. Soil Quality Indicators to Assess Functionality of Restored Soils in Degraded Semiarid Ecosystems. Restor. Ecol. 2016, 24, S43–S52. [Google Scholar] [CrossRef]
- Chen, J.; Luo, Y.; Van Groenigen, K.J.; Hungate, B.A.; Cao, J.; Zhou, X.; Wang, R. A Keystone Microbial Enzyme for Nitrogen Control of Soil Carbon Storage. Sci. Adv. 2018, 4, eaaq1689. [Google Scholar] [CrossRef]
- Hazelton, P.; Murphy, B. Interpreting Soil Test Results: What Do All the Numbers Mean? CSIRO Publishing: Collingwood, VIC, Australia, 2007; ISBN 978-0-643-09225-9. [Google Scholar]
- Leogrande, R.; Vitti, C. Use of Organic Amendments to Reclaim Saline and Sodic Soils: A Review. Arid Land Res. Manag. 2019, 33, 1–21. [Google Scholar] [CrossRef]
- Wu, L.; Zhang, S.; Ma, R.; Chen, M.; Wei, W.; Ding, X. Carbon Sequestration under Different Organic Amendments in Saline-Alkaline Soils. CATENA 2021, 196, 104882. [Google Scholar] [CrossRef]
- Zanor, G.; López-Pérez, M.; Martínez-Yáñez, R.; Ramírez-Santoyo, L.; Gutiérrez-Vargas, S.; León-Galván, M.F. Mejoramiento de Las Propiedades Físicas y Químicas de Un Suelo Agrícola Mezclado Con Lombricompostas de Dos Efluentes de Biodigestor. Ing. Investig. Tecnol. 2018, 19, e036. [Google Scholar] [CrossRef]
- Chen, H.; Li, D.; Zhao, J.; Xiao, K.; Wang, K. Effects of Nitrogen Addition on Activities of Soil Nitrogen Acquisition enzymes: A Meta-Analysis. Agric. Ecosyst. Environ. 2018, 252, 126–131. [Google Scholar] [CrossRef]
- Marzi, M.; Shahbazi, K.; Kharazi, N.; Rezaei, M. The Influence of Organic Amendment Source on Carbon and Nitrogen Mineralization in Different Soils. J. Soil Sci. Plant Nutr. 2020, 20, 177–191. [Google Scholar] [CrossRef]
- Naeem, M.; Ansari, A.A.; Gill, S.S. (Eds.) Contaminants in Agriculture: Sources, Impacts and Management; Springer International Publishing: Cham, Switzerland, 2020; ISBN 978-3-030-41551-8. [Google Scholar]
- Wong, V.N.L.; Greene, R.S.B.; Dalal, R.C.; Murphy, B.W. Soil Carbon Dynamics in Saline and Sodic Soils: A Review: Soil Carbon Dynamics in Saline and Sodic Soils. Soil Use Manag. 2010, 26, 2–11. [Google Scholar] [CrossRef]
- Zungu, N.S.; Egbewale, S.O.; Olaniran, A.O.; Pérez-Fernández, M.; Magadlela, A. Soil Nutrition, Microbial Composition and Associated Soil Enzyme Activities in KwaZulu-Natal Grasslands and Savannah Ecosystems Soils. Appl. Soil Ecol. 2020, 155, 103663. [Google Scholar] [CrossRef]
- Poeplau, C.; Riefling, T.; Schiedung, M.; Anlauf, R. Land Use and Soil Property Effects on Aggregate Stability Assessed by Three Different Slaking Methods. Eur. J. Soil Sci. 2024, 75, e13549. [Google Scholar] [CrossRef]
- Rahman, M.A.; Lee, S.-H.; Ji, H.C.; Kabir, A.H.; Jones, C.S.; Lee, K.-W. Importance of Mineral Nutrition for Mitigating Aluminum Toxicity in Plants on Acidic Soils: Current Status and Opportunities. Int. J. Mol. Sci. 2018, 19, 3073. [Google Scholar] [CrossRef] [PubMed]
- Usowicz, B.; Lipiec, J. Spatial Variability of Saturated Hydraulic Conductivity and Its Links with Other Soil Properties at the Regional Scale. Sci. Rep. 2021, 11, 8293. [Google Scholar] [CrossRef] [PubMed]
- Castro-González, I.; Bedolla-Rivera, H.I.; Negrete-Rodríguez, M.D.L.L.X.; Castillo, O.S.; Álvarez-Bernal, D.; Conde-Barajas, E. Mineralization of Microalgal Carbon and Nitrogen in Sodic Soils. Rev. Int. Contam. Ambient. 2024, 40, 149–166. [Google Scholar] [CrossRef]
- Sánchez-Guzmán, A.; Bedolla-Rivera, H.I.; Conde-Barajas, E.; Negrete-Rodríguez, M.D.L.L.X.; Lastiri-Hernández, M.A.; Gámez-Vázquez, F.P.; Álvarez-Bernal, D. Corn Cropping Systems in Agricultural Soils from the Bajio Region of Guanajuato: Soil Quality Indexes (SQIs). Appl. Sci. 2024, 14, 2858. [Google Scholar] [CrossRef]
- Dugan, I.; Pereira, P.; Kisic, I.; Matisic, M.; Bogunovic, I. Analyzing the Influence of Conservation Tillage and Manure on Soil Parameter Modulations in Croplands. Plants 2024, 13, 607. [Google Scholar] [CrossRef]
- Rocco, S.; Munkholm, L.J.; Jensen, J.L. Long-Term Soil Quality and C Stock Effects of Tillage and Cover Cropping in a Conservation Agriculture System. Soil Tillage Res. 2024, 241, 106129. [Google Scholar] [CrossRef]

Disclaimer/Publisher’s Note: The statements, opinions and data contained in all publications are solely those of the individual author(s) and contributor(s) and not of MDPI and/or the editor(s). MDPI and/or the editor(s) disclaim responsibility for any injury to people or property resulting from any ideas, methods, instructions or products referred to in the content. |
© 2024 by the authors. Licensee MDPI, Basel, Switzerland. This article is an open access article distributed under the terms and conditions of the Creative Commons Attribution (CC BY) license (https://creativecommons.org/licenses/by/4.0/).