Article

The Impact of Applying Different Fertilizers on Greenhouse Gas Emissions and Ammonia Volatilization from Northeast Spring Corn

1
Institute of Applied Ecology, Chinese Academy of Sciences, Shenyang 110016, China
2
University of Chinese Academy of Sciences, Beijing 100049, China
3
Fuxin Inspection and Testing Certification Center, Fuxin 123000, China
*
Author to whom correspondence should be addressed.
These authors contributed equally to this work.
Agronomy 2024, 14(12), 2798; https://doi.org/10.3390/agronomy14122798
Submission received: 15 October 2024 / Revised: 5 November 2024 / Accepted: 22 November 2024 / Published: 25 November 2024

Abstract

:
Reducing greenhouse gas (GHG) emissions and ammonia (NH3) volatilization by improving fertilization methods to increase crop yield is beneficial for the green and sustainable development of agriculture. This study evaluated the effects of farmer practice fertilization (FP), nutrient expert optimized fertilization (NE—optimized fertilizer usage and time), the application of stable compound fertilizer (SF), and the application of controlled-release coated urea (CRU) on greenhouse gases, NH3 volatilization, and corn yield through field experiments set up in the corn planting area in western Liaoning Province. The results showed that compared with FP treatment, NE could significantly reduce NH3 volatilization by 28% and increase N2O release by 41%. Compared with FP treatment, SF could significantly reduce NH3 volatilization by 48.54%, N2O release by 38.54%, CO2 release by 13.96%, global warming potential (GWP) by 16.60%, and greenhouse gas emission intensity (GHGI) by 27.23%, and could significantly increase corn yield by 15.86%. Compared with FP treatment, CRU could significantly reduce NH3 volatilization by 63.46%, CO2 release by 11.98%, GWP by 10.73%, and GHGI by 13.77%, while increasing N2O release by 6.71%. Overall, NE, SF, and CRU treatments all showed better effects than FP treatment in increasing corn yield or reducing NH3 volatilization and GHG emissions. Among them, SF treatment demonstrated superior performance over NE and CRU treatments in terms of NH3 volatilization, corn yield, and GHGI. Therefore, the application of stable compound fertilizer is the optimal choice for corn planting in western Liaoning, with broad application prospects.

1. Introduction

Global warming caused by the increase in greenhouse gases (GHG) is one of the most important environmental issues in the 21st century, with extreme weather and natural disasters constantly threatening human survival and development [1,2,3]. Agricultural GHG emissions account for 14% of total anthropogenic GHG emissions, with carbon dioxide (CO2), methane (CH4), and nitrous oxide (N2O) being the three most important GHG [4]. Therefore, reducing agricultural source GHG emissions is crucial for mitigating global warming. In addition, the continuous increase in world population also poses significant challenges to food production [5]. In order to ensure national food production, Chinese farmers use mineral nitrogen (N) fertilizers that are more than 30% higher than the average crop requirement [6]. Therefore, the resource waste and environmental problems caused by N fertilizer application have become a key concern in China.
Ammonia (NH3) volatilization indirectly contributes to greenhouse gases, as it can be converted to N₂O in the atmosphere [7]. In order to reduce GHG emissions and NH3 volatilization, while increasing crop yields, a large number of studies have been conducted in the past. Stabilized fertilizers with urease inhibitors and nitrification inhibitors were thought to delay urea hydrolysis and inhibit ammonium oxidation processes, thereby reducing GHG emissions and increasing crop yields [5,8]. Coated fertilizer was also another commonly used high-efficiency fertilizer, where polymers and their micropores provided U dissolution through diffusion, and soil moisture controls N release. It improved the synchronization between N release and corn demand by reducing NH3 loss and N₂O emissions to enhance N use efficiency, but N release is lower at the beginning of the corn growth cycle, leading to a risk of reduced yield [7,9]. In addition, using the Nutrient Expert software (Corn NE V 1.0) for fertilization management in specific locations could reduce GHG emissions and increase crop yields by providing nutrients to crops at the right time and dosage [10,11]. Due to the actual situation of cultivation, only one type of fertilizer could be selected. Therefore, it is necessary to compare these fertilizers to determine the optimal type of fertilization.
This study takes corn in the region as the research object and explores the effects of applying different fertilizers on GHG emissions, ammonia volatilization, and the corn yield of spring corn in Northeast China in order to determine the optimal type of fertilizer.

2. Materials and Methods

2.1. Field Site

The field was set up at the experimental station of the Liaoning Key Laboratory of Water-Saving Agriculture in Fuxin County, Northeast China, in the spring of 2023 (41°44′ N, 121°26′ E). The experimental station is a typical semi-arid region in Liaoning Province. The average temperature during the crop growth period is 20.2 °C [12]. The test soil was a cinnamon soil (60.6% sand, 20.5% silt, and 18.9% clay) with an organic matter content of 13.4 g kg−1, a total N of 1.0 g kg−1, a total phosphate (P) of 0.4 g kg−1, a total potassium (K) of 22.8 g kg−1, an available P of 53.6 mg kg−1, an exchangeable K of 86.7 mg kg−1, an ammonium nitrogen (NH4+-N) of 4.85 mg kg−1, and a nitrate nitrogen (NO3-N) of 3.49 mg kg−1. Soil bulk density (0 to 20 cm) was 1.51 g cm−3, and the pH was 5.5 [3]. The farming system only plants corn for one season per year.

2.2. Field Experimental Design

The field experiment was set up with four treatments, namely, farmer practice fertilization (FP), nutrient expert optimized fertilization (NE), application of stable compound fertilizer (SF), and application of controlled-release coated urea (CRU). A randomized block design with three replicates was arranged. Each plot covers an area of 20 m2 (4 m × 5 m). The FP used NPK amounts of N 156 kg ha−1, P2O5 60 kg ha−1, and K2O 72 kg ha−1. The fertilizers used for FP and NE were urea (N 46%), superphosphate (P2O5 18%), and potassium chloride (K2O 60%). Apart from the FP, the NPK ratios for other treatments were recommended by a Nutrient Expert system, with NPK amounts of N 200 kg ha−1, P2O5 120 kg ha−1, and K2O 130 kg ha−1, respectively. The NE system needed to collect environmental information, such as the location of farmland, soil texture, soil fertility, etc., and input the fertilization and yield information of farmers in the previous season. Then, the NE system was run to estimate achievable yield and yield response and ultimately provide optimized nutrition management practices for crops in the current season [13]. The controlled-release coated urea (N 43%) was polymeric resin-coated, and the stable compound fertilizer (N-P2O5-K2O: 26%—10%—12%) contained 0.5% urease inhibitor N-(n-butyl) thiophosphoric triamide (NBPT) and 0.5% nitrification inhibitor 3,4-dimethylpyrazole phosphate (DMPP), respectively. The total nutrients (N-P2O5-K2O) in NE, SF, and CRU were the same. Using NE as the standard, the missing phosphorus and potassium fertilizers in SF and CRU were supplemented by superphosphate and potassium chloride. This experiment was conducted during the corn-growing season from May to September 2024, with the spring corn variety being “HS737”. Only NE applied topdressing, while other treatments only applied basal fertilizer. Base fertilizer was applied at sowing time for spring corn (7 May), followed by two topdressings on 19 June (jointing stage) and 14 August (filling stage). The two topdressing times were 43 and 99 days after planting, respectively. The row distance for spring corn was 31 cm × 50 cm, with a planting density of 64,500 plants per hectare. Field management followed local farmer practices, with fertilizer amounts as shown in Table 1.

2.3. Sample Collection and Analysis

In situ GHG emissions of corn fields during the corn-growing season were measured via the static chamber method [14]. Gas samples were collected on days 1, 4, 7, 10, 15, 22, 29, 43, 50, 57, 71, 85, 99, 106, 120, and 143 after fertilization between 8 a.m. and 10 a.m. The static chamber in the field is composed of a base and a chamber body (Figure 1). The base is 45 cm long, 30 cm wide, and 15 cm high. There is a groove above the base that can be filled with water for sealing. The chamber body is 45 cm long, 30 cm wide, and 40 cm high. Each plot was provided with a static chamber, which were placed between two rows of corn and had no corn plants inside. The chamber body is made of stainless steel material, wrapped with thermal reflective film on the outside, and equipped with a small fan and thermometer inside to mix the gas and measure the temperature. Gas samples were collected from the chamber at 0, 30, and 60 min after closing the chamber body, with the sampling time and internal temperature of the chamber being recorded in real-time. Each gas collection was conducted with a well-sealed syringe to collect 100 mL of gas into a vacuum gas collection bag, which was then brought back to the laboratory for GHG concentration determination. The collected gases were analyzed using a gas chromatograph (Agilent 7890B, Gas Chromatograph, Newark, DE, USA) equipped with a HP-5 column (30 m × 0.25 mm × 0.25 μm) [15]. The N2O detector used was an ECD (Electron Capture Detector) with a temperature of 300 °C, high purity N2 as the carrier gas, and ArCH4 (Ar 90%, CH4 10%) as the make-up gas. The flow rates of the carrier gas and make-up gas were 20 and 2 mL min−1, respectively. The CO2 and CH4 detectors used were FID (Flame Ionization Detectors) with a temperature of 250 °C. We used high-purity N2, H2, air, and ordinary N2 as carrier gas, combustion gas, auxiliary gas, and make-up gas, respectively, with flow rates of 20, 80, 450, and 25 mL min−1, respectively. The column oven temperature was set at 60 °C.
The volatilization of ammonia (NH3) in soil was determined using the sponge absorption method [16]. The sampling date and time of NH3 volatilization were consistent with that of GHG collection. The capture device was made of a polyvinyl chloride rigid plastic pipe, with an inner diameter of 15 cm and a height of 30 cm (Figure 1). Each plot had a capture device placed between two corn plants in the same row. During the measurement process, two sponges with a thickness of 2 cm and a diameter of 15.5 cm were evenly soaked in 15 mL of glycerol phosphate solution (50 mL phosphoric acid + 40 mL glycerol, diluted to 1000 mL with deionized water). The two layers of sponges were placed in the rigid plastic pipe, with the lower sponge 5 cm from the ground and the upper sponge level with the top of the pipe. The capture device was placed in the community at 8 a.m. and extracted at 8 a.m. the next day. During sampling, the sponge from the lower layer of the capture device is removed, quickly sealed in a self-sealing bag, and brought back to the laboratory in a timely manner. Subsequently, the sponge is placed into 500 mL plastic bottles, with 300 mL of 1.0 mol L−1 KCl solution added to completely immerse the sponge. After shaking for 1 h under constant temperature of 25 °C and a rotation speed of 160 r min−1, the ammonium nitrogen (NH4+-N) content in the leachate is determined using a continuous flow analyzer (AA3, Bran + Luebbe, Norderstedt, Germany).
At maturity, the corn yield is recorded after being oven-dried (105 °C for 0.5 h and 60 °C for 24 h).

2.4. Data Analysis

The calculation equation for GHG emission flux is as follows [14]:
F g a s = ρ × d c d t × P P 0 × V A × 273 273 + T ,
where Fgas is the N2O flux (µg m−2 h−1), CH4 flux (mg m−2 h−1), or CO2 flux (mg m−2 h−1); ρ is their standard-state density (N2O 1.964 kg m−3, CH4 0.714 kg m−3, and CO2 1.861 kg m−3); V/A is the ratio of static chamber volume to land area inside the chamber, i.e., the chamber height above the soil (m); dc/dt is the slope of the gas concentration curve; 273 is the gas constant; and T is the average air temperature inside the chamber during gas collection (°C).
Seasonal GHG emissions for each plot were calculated using a weighted interpolation method [14].
Due to the different warming effects of N2O, CH4, and CO2, it is necessary to have a unified standard to measure the potential impacts of various GHG. The global warming potential (GWP) serves as such an integrated index. The GWP of N2O and CH4 is calculated by converting the warming potential of cumulative emissions (kg hm−2) of N2O and CH4 into CO2 equivalents. On a 100-year scale, N2O and CH4 are, respectively, 298 times and 25 times that of CO2 [14]. The calculation equation is as follows [14]:
GWP = CE (N2O) + CE (CH4) + CE (CO2),
where GWP refers to the global warming potential (kg CO2 ha−1) for N2O, CH4, and CO2; and CE refers to the climate-enhancing potential (kg CO2 ha−1) of N2O, CH4, or CO2.
To evaluate the comprehensive effects of a certain agricultural operation on yield and warming potential, the greenhouse gas emission intensity (GHGI) is commonly used for characterization. It represents the amount of GHG emitted per unit of yield and serves as an indicator for the comprehensive evaluation of the greenhouse effect of various treatments. The calculation equation is as follows [14]:
GHGI = GWP/Y,
where GHGI is the greenhouse gas emission intensity (kg kg−1); GWP stands for the combined warming potential of N2O, CH4, and CO2 (kg CO2 ha−1); and Y denotes the average yield per unit area of the treatment (kg ha−1).
Calculation formula for NH3 volatilization rate (F, kg NH3-N ha−1 d−1) [17]:
F = M/A/D/100,
where M is the average amount of ammonia (NH3-N, mg) measured each time by a single device using the sponge absorption method; A is the cross-sectional area of the capture device (m2); and D is the duration of continuous capture in each test, with 1 day being the unit of measurement used in the experiment.
During the corn-growing season, the NH3 volatilization accumulation in each plot was calculated by linearly interpolating the gas emissions on the sampling dates [16].
SPSS Statistics 16.0 (SPSS Inc., Chicago, IL, USA) was used for statistical analysis of data (one-way ANOVA, p < 0.05). Figures were prepared with Origin 8 (Origin Lab Corp., Northampton, MA, USA). The data in the figures and tables are the average value ± standard error (SE).

3. Results

3.1. Greenhouse Gas Flux

The dynamic N2O emission under different treatments showed a multi-peak curve (Figure 2A). During the corn-growing season, the N2O emission flux ranged from 5.59 to 367.51 μg m−2 h−1. CRU treatment had the highest N2O emission peak, which was CRU > NE > FP > SF. After the application of base fertilizer, the N2O emission flux increased in all treatments, followed by a gradual decrease in the SF treatments, while the FP, NE, and CRU treatments experienced another peak in N2O emissions after the initial decrease. No CH4 emissions were detected during the corn-growing season. The CO2 emission flux ranged from 127.37 to 555.24 mg m−2 h−1. FP treatment had the highest CO2 emission peak, which was FP > NE > SF > CRU. The variation trend of CO2 emission flux was consistent among all treatments during the whole corn-growing season; that is, the CO2 emission flux showed a trend of first increasing and then decreasing with the growth process of corn (Figure 2B).

3.2. Greenhouse Gas Accumulation

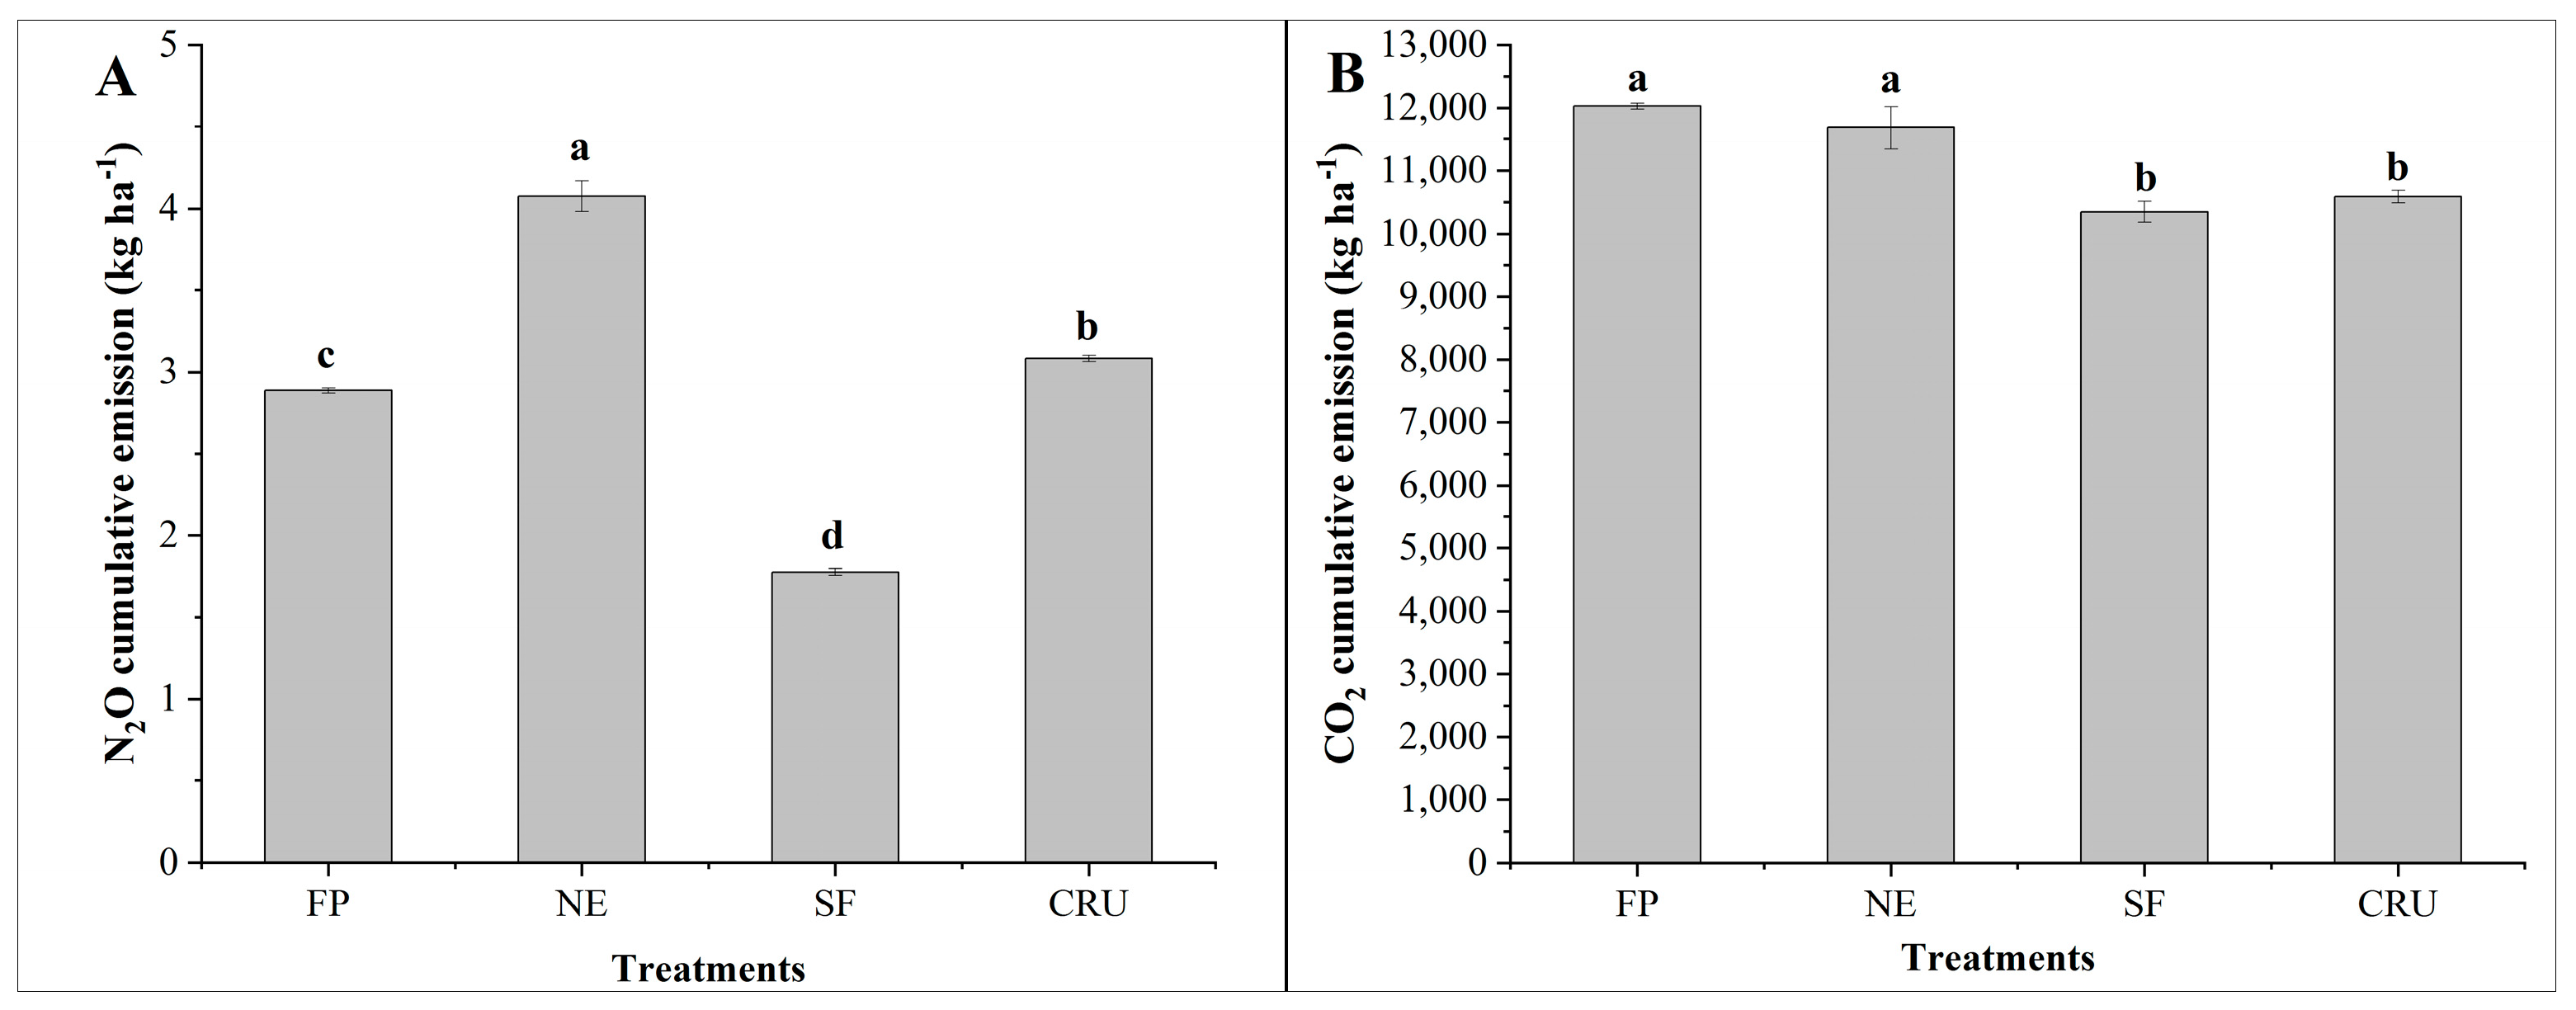
The N2O accumulation during the corn-growing season ranged from 1.74 to 4.23 kg ha−1, with significant differences among all treatments, which were NE > CRU >  FP > SF (Figure 3A, p < 0.05). The CO2 accumulation during the corn-growing season ranged from 10,028 to 12,337 kg ha−1, with the CO2 accumulation of the FP and NE treatments being significantly greater than those of the SF and CRU treatments (Figure 3B, p < 0.05).

3.3. Ammonia Volatilization Flux and Accumulation

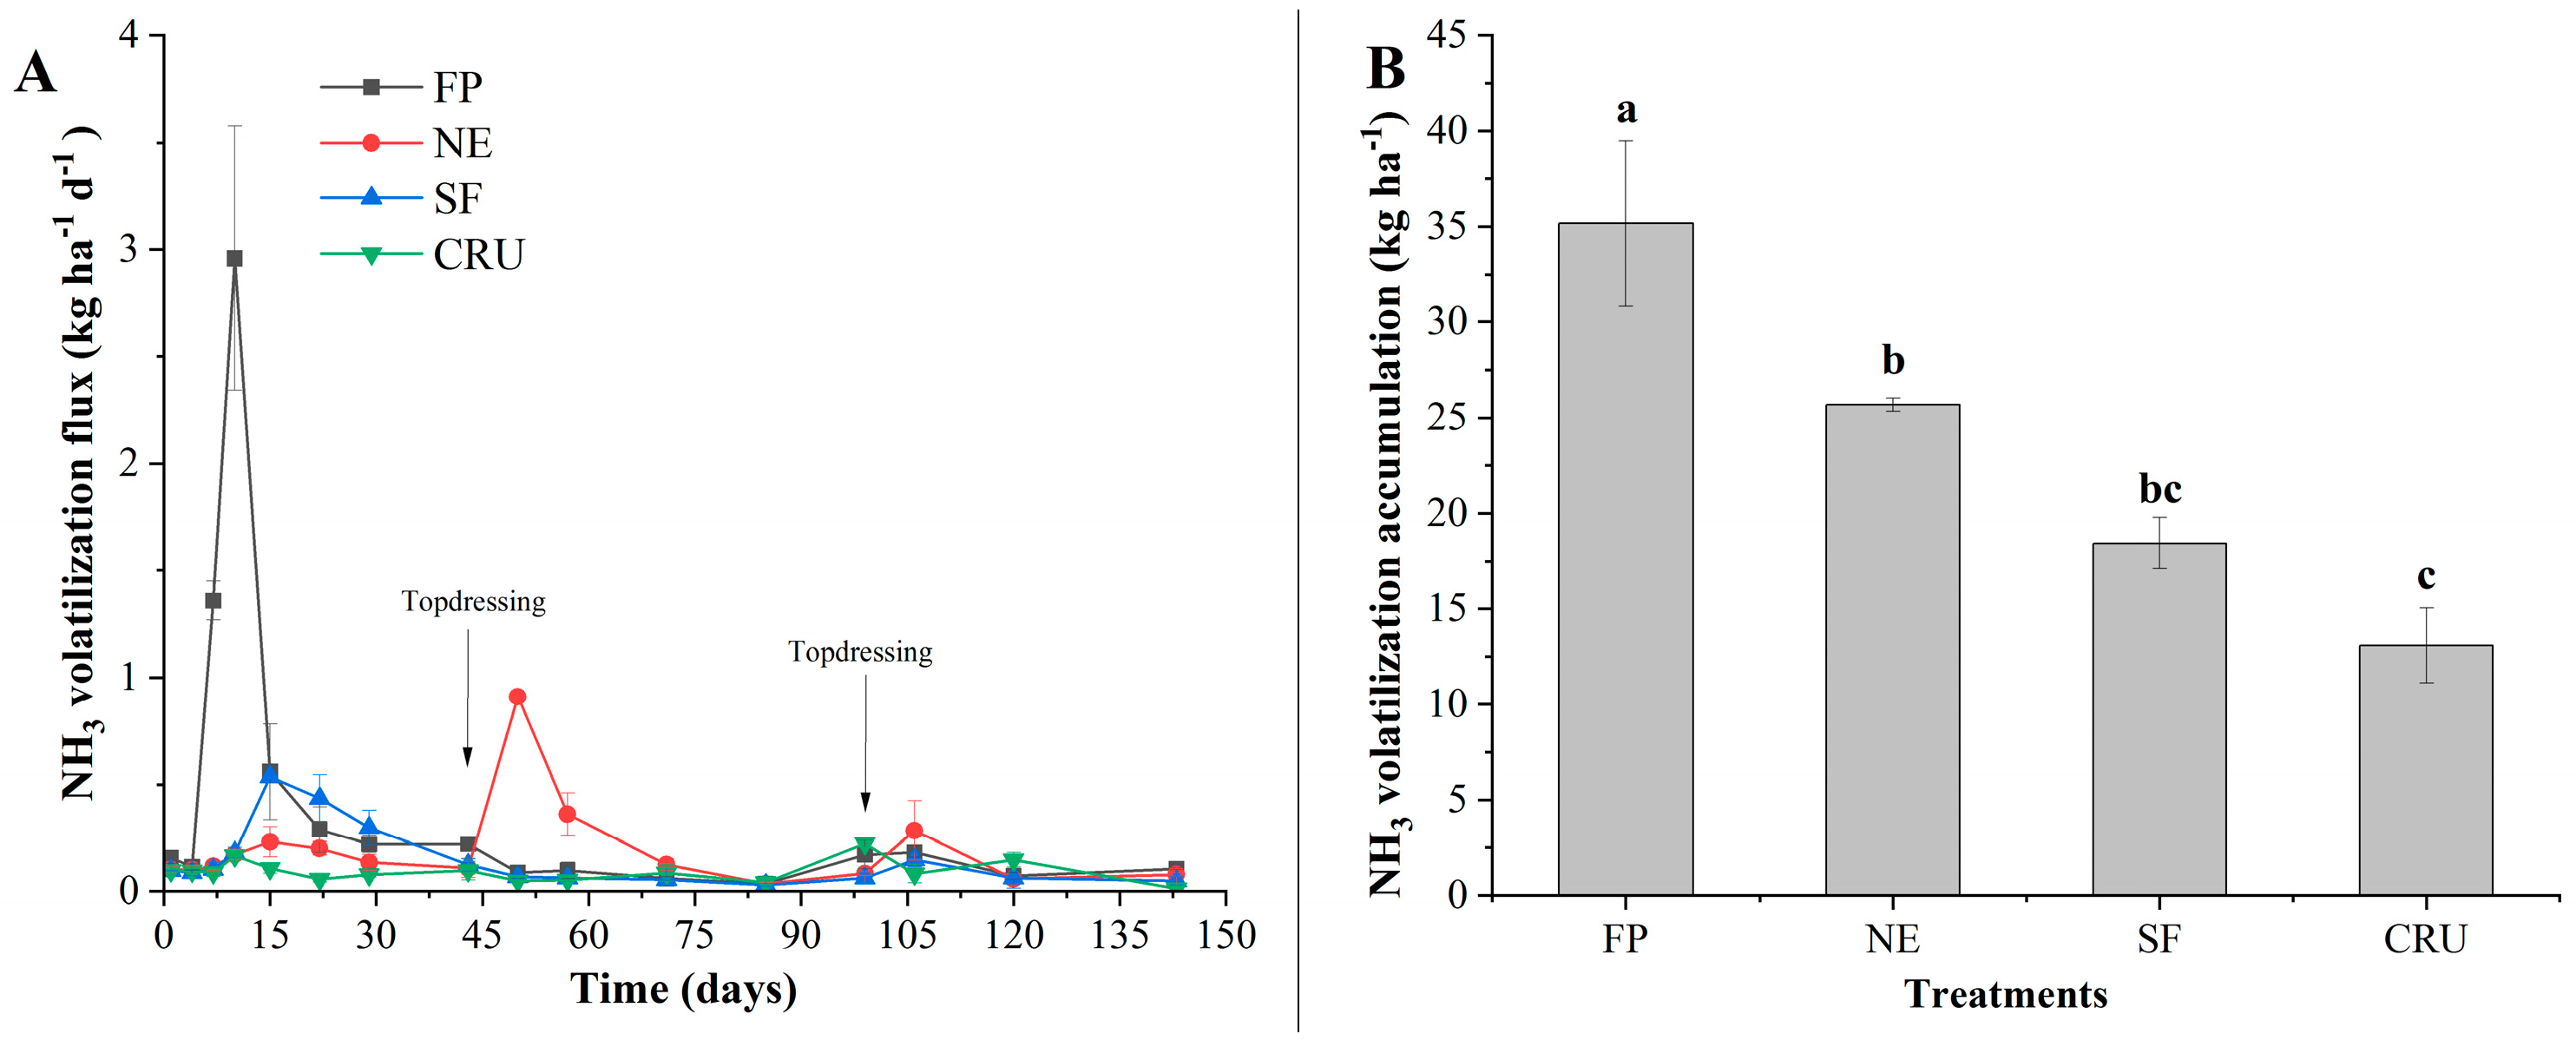
As shown in Figure 4A, the range of NH3 volatilization flux during the corn-growing season was 0.01–4.03 kg ha−1 d−1. The FP treatment showed a peak in NH3 volatilization on the 10th day after the application of base fertilizer, while the peak for the SF treatment occurred on the 15th day, followed by a rapid decline and maintaining a lower level of NH3 volatilization. The NE treatment exhibited noticeable peaks in NH3 volatilization after two topdressings, whereas the CRU treatment had, overall, less NH3 volatilization throughout the corn growth period.
The NH3 volatilization accumulation during the corn-growing season ranged from 10.77 to 45.10 kg ha−1 (Figure 4B). FP treatment had the highest NH3 volatilization peak, which was FP > NE > SF > CRU. The FP treatment had the highest NH3 volatilization accumulation and was significantly greater than the other three treatments (p < 0.05). The NE treatment was significantly higher than the CRU treatment but not significantly different from the SF treatment (p < 0.05). There was no significant difference between the CRU and SF treatments.

3.4. Global Warming Potential, Corn Yieldp, and Greenhouse Gas Emission Intensity

As shown in Table 2, NE and FP treatments had the highest GWP, followed by CRU treatment, and finally SF treatment (p < 0.05). The corn yield of SF treatment was the highest and significantly greater than that of FP treatment (p < 0.05). There was no significant difference in GHGI between NE and FP treatments. However, the GHGI of NE and FP was significantly higher than that of SF and CRU treatments (p < 0.05). The GHGI of CRU treatment was significantly higher than that of SF treatment (p < 0.05).

4. Discussion

In this study, the N2O flux of each treatment increased rapidly after fertilization. Previous studies have also shown that N application significantly increases N2O emissions [3,18]. The N2O emission flux of FP, NE, and CRU treatments showed a second peak after a decrease. The second N2O emission peak of FP treatment may be due to heavy rainfall during this period [18]. The second N2O emission peak of NE treatment may be due to an increase in soil mineral N concentration caused by topdressing [6,19]. The second N2O emission peak of CRU treatment may be due to the slow decomposition and release of urea encapsulated in the resin coating during this period [20]. Compared with FP treatment, NE and CRU treatment promoted N2O emissions, increasing by 41.00% and 6.71%, respectively, while SF treatment reduced N2O emissions by 38.54%. The increase in N2O accumulation of NE treatment may be due to the total amount of N fertilizer applied being greater than that of FP treatment [3,21]. The increase in N2O accumulation of CRU treatment may be due to the total amount of N fertilizer applied being greater than that of FP treatment and frequent rainfall during the middle stage of corn growth causing the resin coating to break down, accelerating the hydrolysis of urea and promoting N2O emissions [20]. The decrease in N2O accumulation in SF treatment may be due to the inhibition of urea hydrolysis and nitrification of NH4+-N by urease and nitrification inhibitors, which indirectly weakened the denitrification because nitrification and denitrification are important biochemical processes of N2O production, thus significantly reducing the emission of N2O [22]. No CH4 emissions were detected in this study, which may be due to the fact that the region belongs to a semi-arid area and the high soil sand content is conducive to drainage, which cannot support a suitable anaerobic environment for microorganisms and is not conducive to CH4 production [23]. The CO2 flux of all treatments showed a similar trend after fertilization, first increasing slowly and then slowing down. The production of CO2 in soil may be mainly influenced by temperature, as the temperature first increases and then decreases during the corn-growing season, and temperature is one of the key factors affecting the growth and respiration of maize and microorganisms [24]. The CO2 accumulation of SF and CRU treatments were significantly smaller than those of FP and NE treatments, which may be due to SF treatment slowing down the decomposition of fertilizer N in the soil by inhibiting the activity of N transformation-related microorganisms [25,26], while CRU treatment achieves slow release of fertilizer N in the soil through the slow decomposition of resin coating [9,20]. At the same time, both SF and CRU treatments can reduce the peak value of N supply in the soil during corn growth, thereby promoting better absorption and utilization of N by corn and microorganisms and fixing more carbon in the soil, reducing CO2 emissions from the soil [4].
The NH3 volatilization accumulation was significantly lower in NE, SF, and CRU treatments than that in FP treatment, with reductions of 28.23%, 48.54%, and 63.46%, respectively. The extensive use of N fertilizer in soil could stimulate the NH3 volatilization [27]. NE treatment avoided the accumulation of large amounts of N in the soil in a short period of time by increasing the frequency of fertilization but reducing the amount of N applied each time, thereby reducing NH3 volatilization [11]. SF treatment inhibited the activity of microorganisms related to N conversion, especially urease inhibitors, which can inhibit urease activity, delay urea hydrolysis, avoid the formation of large amounts of NH4+-N in the soil, and thus reduce NH3 volatilization [7]. CRU treatment reduced the direct contact between urea and soil due to the resin coating, resulting in a decrease in the concentration of fertilizer N in the soil, thus reducing the NH3 volatilization [9].
In the corn agroecosystem, compared with FP treatment, SF treatment significantly increased corn yield by 15.86% (Table 2). First, this may have been due to a 28% increase in N application rate in SF treatment, which could promote corn yield increase [23]. In addition, inhibitors had a regulatory effect on the release of fertilizer N, delaying urea hydrolysis and ammonium oxidation processes, making them more in line with the growth and absorption laws of corn, thereby promoting high corn yield [28,29]. The GHGI of SF and CRU treatments was significantly lower than that of FP treatment, with reductions of 27.23% and 13.77%, respectively. The reduction in GHGI in SF treatment was due to a decrease in GWP (both CO2 and N2O decrease) and an increase in corn yield, while the reduction in GHGI in CRU treatment was due to a decrease in GWP (CO2 decrease and N2O increase). CRU treatment did not increase corn yield, possibly due to lower N release at the beginning of the corn growth cycle, which affected the early growth of corn [9].

5. Conclusions

We investigated the effects of applying different fertilizers on GHG emissions and NH3 volatilization of spring corn in Northeast China. The results showed that compared with FP, NE promoted N2O emission (41%) but reduced NH3 volatilization (28%). Compared with FP, SF reduced NH3 volatilization (48.54%), N2O emission (38.54%), CO2 emission (13.96%), GWP (15.60%), and GHGI (27.23%) but increased corn yield (15.86%). Compared with FP, CRU reduced NH3 volatilization (63.46%), CO2 emission (11.98%), GWP (10.73%), and GHGI (13.77%) but increased N2O emission (6.71%). Overall, compared with NE and CRU, SF had more advantages in reducing GHG emissions and NH3 volatilization, as well as promoting high corn yield. Therefore, in this study, SF was the best choice for corn planting in western Liaoning, with great potential in reducing greenhouse gas emissions and increasing corn yield.

Author Contributions

K.W., L.Z. (Lei Zhang), P.G. and Z.W. conceived and designed the experiments; L.W., Y.S., Y.X. and M.H. performed the experiments; L.W. and K.W. analyzed the data; K.W. and L.Z. (Lili Zhang) wrote the paper, and all authors approved submission of the paper. All authors have read and agreed to the published version of the manuscript.

Funding

This work was funded by the National Key Research and Development Program of China (2022YFD1700605), the Applied Basic Research Program of Liaoning Province (2023JH2/101600048, 2023JH1/10400017) and the Key Research and Development Program of Shandong Province (2022SFGC0301).

Institutional Review Board Statement

Not applicable.

Data Availability Statement

All relevant data are contained within the article.

Acknowledgments

The authors thank the editors and reviewers for their constructive comments and suggestions. Controlled-release coated urea and stable compound fertilizer were provided by Kingenta Ecological Engineering Group Co., Ltd., and Shenyang Zhongke New Fertilizer Co., Ltd., respectively.

Conflicts of Interest

The authors declare no conflicts of interest.

References

  1. Davidson, E.A. The contribution of manure and fertilizer nitrogen to atmospheric nitrous oxide since 1860. Nat. Geosci. 2009, 2, 659–662. [Google Scholar] [CrossRef]
  2. Wheeler, T.; von Braun, J. Climate Change Impacts on Global Food Security. Science 2013, 341, 508–513. [Google Scholar] [CrossRef] [PubMed]
  3. Wu, K.; Zhang, Z.; Feng, L.; Bai, W.; Feng, C.; Song, Y.; Gong, P.; Meng, Y.; Zhang, L. Effects of Corn Stalks and Urea on N2O Production from Corn Field Soil. Agronomy 2021, 11, 2009. [Google Scholar] [CrossRef]
  4. Cheng, Z.; Bai, L.; Wang, Z.; Wang, F.; Wang, Y.; Liang, H.; Wang, Y.; Rong, M.; Wang, Z. Strip-Till Farming: Combining Controlled-Release Blended Fertilizer to Enhance Rainfed Maize Yield While Reducing Greenhouse Gas Emissions. Agronomy 2024, 14, 136. [Google Scholar] [CrossRef]
  5. Gao, X.; Ouyang, W.; Hao, Z.; Shi, Y.; Wei, P.; Hao, F. Farmland-atmosphere feedbacks amplify decreases in diffuse nitrogen pollution in a freeze-thaw agricultural area under climate warming conditions. Sci. Total Environ. 2017, 579, 484–494. [Google Scholar] [CrossRef]
  6. Zhang, T.; Liu, H.; Luo, J.; Wang, H.; Zhai, L.; Geng, Y.; Zhang, Y.; Li, J.; Lei, Q.; Bashir, M.A.; et al. Long-term manure application increased greenhouse gas emissions but had no effect on ammonia volatilization in a Northern China upland field. Sci. Total Environ. 2018, 633, 230–239. [Google Scholar] [CrossRef]
  7. Tian, Z.; Wang, J.J.; Liu, S.; Zhang, Z.; Dodla, S.K.; Myers, G. Application effects of coated urea and urease and nitrification inhibitors on ammonia and greenhouse gas emissions from a subtropical cotton field of the Mississippi delta region. Sci. Total Environ. 2015, 533, 329–338. [Google Scholar] [CrossRef]
  8. Byrne, M.P.; Tobin, J.T.; Forrestal, P.J.; Danaher, M.; Nkwonta, C.G.; Richards, K.; Cummins, E.; Hogan, S.A.; O’Callaghan, T.F. Urease and Nitrification Inhibitors—As Mitigation Tools for Greenhouse Gas Emissions in Sustainable Dairy Systems: A Review. Sustainability 2020, 12, 6018. [Google Scholar] [CrossRef]
  9. Garcia, P.L.; Sermarini, R.A.; Filho, C.R.d.S.A.; Bendassolli, J.A.; Boschiero, B.N.; Trivelin, P.C.O. 15N-Fertilizer Recovery in Maize as an Additional Strategy for Understanding Nitrogen Fertilization Management with Blends of Controlled-Release and Conventional Urea. Agronomy 2020, 10, 1932. [Google Scholar] [CrossRef]
  10. Jat, R.K.; Bijarniya, D.; Kakraliya, S.K.; Sapkota, T.B.; Kakraliya, M.; Jat, M.L. Precision Nutrient Rates and Placement in Conservation Maize-Wheat System: Effects on Crop Productivity, Profitability, Nutrient-Use Efficiency, and Environmental Footprints. Agronomy 2021, 11, 2320. [Google Scholar] [CrossRef]
  11. Pramanick, B.; Kumar, M.; Naik, B.M.; Kumar, M.; Singh, S.K.; Maitra, S.; Naik, B.; Rajput, V.D.; Minkina, T. Long-Term Conservation Tillage and Precision Nutrient Management in Maize-Wheat Cropping System: Effect on Soil Properties, Crop Production, and Economics. Agronomy 2022, 12, 2766. [Google Scholar] [CrossRef]
  12. Hou, W.; Yin, G.; Gu, J.; Ma, N. Estimation of Spring Maize Evapotranspiration in Semi-Arid Regions of Northeast China Using Machine Learning: An Improved SVR Model Based on PSO and RF Algorithms. Water 2023, 15, 1503. [Google Scholar] [CrossRef]
  13. Zhang, J.J.; He, P.; Xu, X.P.; Ding, W.C.; Ullah, S.; Wang, Y.L.; Jia, L.L.; Cui, R.Z.; Wang, H.T.; Zhou, W. Nutrient Expert Improves Nitrogen Efficiency and Environmental Benefits for Winter Wheat in China. Agron. J. 2018, 110, 696–706. [Google Scholar] [CrossRef]
  14. Li, J.; Li, Y.; Wan, Y.; Wang, B.; Waqas, M.A.; Cai, W.; Guo, C.; Zhou, S.; Su, R.; Qin, X.; et al. Combination of modified nitrogen fertilizers and water saving irrigation can reduce greenhouse gas emissions and increase rice yield. Geoderma 2018, 315, 1–10. [Google Scholar] [CrossRef]
  15. Zhang, W.; Zhang, X.; Bai, E.; Cui, Y.; He, H.; Zhang, X. The strategy of microbial utilization of the deposited N in a temperate forest soil. Biol. Fertil. Soils 2019, 56, 359–367. [Google Scholar] [CrossRef]
  16. Liu, T.Q.; Fan, D.J.; Zhang, X.X.; Chen, J.; Li, C.F.; Cao, C.G. Deep placement of nitrogen fertilizers reduces ammonia volatilization and increases nitrogen utilization efficiency in no-tillage paddy fields in central China. Field Crops Res. 2015, 184, 80–90. [Google Scholar] [CrossRef]
  17. Guo, C.; Ren, T.; Li, P.; Wang, B.; Zou, J.; Hussain, S.; Cong, R.; Wu, L.; Lu, J.; Li, X. Producing more grain yield of rice with less ammonia volatilization and greenhouse gases emission using slow/controlled-release urea. Environ. Sci. Pollut. Res. 2019, 26, 2569–2579. [Google Scholar] [CrossRef]
  18. Bizimana, F.; Timilsina, A.; Dong, W.; Uwamungu, J.Y.; Li, X.; Wang, Y.; Pandey, B.; Qin, S.; Hu, C. Effects of long-term nitrogen fertilization on N2O, N2 and their yield-scaled emissions in a temperate semi-arid agro-ecosystem. J. Soil. Sediment. 2021, 21, 1659–1671. [Google Scholar] [CrossRef]
  19. Sadhukhan, R.; Kumar, D.; Sepat, S.; Ghosh, A.; Banerjee, K.; Shivay, Y.S.; Gawdiya, S.; Harish, M.N.; Bhatia, A.; Kumawat, A.; et al. Precision nutrient management influences the productivity, nutrients use efficiency, N2O fluxes and soil enzymatic activity in zero-till wheat (Triticum aestivum L.). Field Crops Res. 2024, 317, 109526. [Google Scholar] [CrossRef]
  20. Sitthisuwannakul, K.; Boonpavanitchakul, K.; Wirunmongkol, T.; Muthitamongkol, P.; Kangwansupamonkon, W. A tunable controlled-release urea fertilizer coated with a biodegradable polyurethane-nanoclay composite layer. J. Coat. Technol. Res. 2022, 20, 635–646. [Google Scholar] [CrossRef]
  21. Zhu, X.; Burger, M.; Doane, T.A.; Horwath, W.R. Ammonia oxidation pathways and nitrifier denitrification are significant sources of N2O and NO under low oxygen availability. Proc. Natl. Acad. Sci. USA 2013, 110, 6328–6333. [Google Scholar] [CrossRef] [PubMed]
  22. Ruser, R.; Schulz, R. The effect of nitrification inhibitors on the nitrous oxide (N2O) release from agricultural soils-a review. J. Plant Nutr. Soil Sci. 2015, 178, 171–188. [Google Scholar] [CrossRef]
  23. Zhang, S.; Xue, L.; Liu, J.; Xia, L.; Jia, P.; Feng, Y.; Hao, X.; Zhao, X. Biochar application reduced carbon footprint of maize production in the saline-alkali soils. Agric. Ecosyst. Environ. 2024, 368, 109001. [Google Scholar] [CrossRef]
  24. Voigt, C.; Lamprecht, R.E.; Marushchak, M.E.; Lind, S.E.; Novakovskiy, A.; Aurela, M.; Martikainen, P.J.; Biasi, C. Warming of subarctic tundra increases emissions of all three important greenhouse gases—Carbon dioxide, methane, and nitrous oxide. Glob. Change Biol. 2016, 23, 3121–3138. [Google Scholar] [CrossRef]
  25. Abalos, D.; Jeffery, S.; Sanz-Cobena, A.; Guardia, G.; Vallejo, A. Meta-analysis of the effect of urease and nitrification inhibitors on crop productivity and nitrogen use efficiency. Agric. Ecosyst. Environ. 2014, 189, 136–144. [Google Scholar] [CrossRef]
  26. Hashim, M.M.a.; Yusop, M.K.; Othman, R.; Wahid, S.A. Field Evaluation of Newly-Developed Controlled Release Fertilizer on Rice Production and Nitrogen Uptake. Sains Malays. 2017, 46, 925–932. [Google Scholar] [CrossRef]
  27. Pan, B.; Lam, S.K.; Mosier, A.; Luo, Y.; Chen, D. Ammonia volatilization from synthetic fertilizers and its mitigation strategies: A global synthesis. Agric. Ecosyst. Environ. 2016, 232, 283–289. [Google Scholar] [CrossRef]
  28. Pasda, G.; Hähndel, R.; Zerulla, W. Effect of fertilizers with the new nitrification inhibitor DMPP (3,4-dimethylpyrazole phosphate) on yield and quality of agricultural and horticultural crops. Biol. Fertil. Soils 2001, 34, 85–97. [Google Scholar] [CrossRef]
  29. Venterea, R.T.; Bijesh, M.; Dolan, M.S. Fertilizer source and tillage effects on yield-scaled nitrous oxide emissions in a corn cropping system. J. Environ. Qual. 2011, 40, 1521–1531. [Google Scholar] [CrossRef]
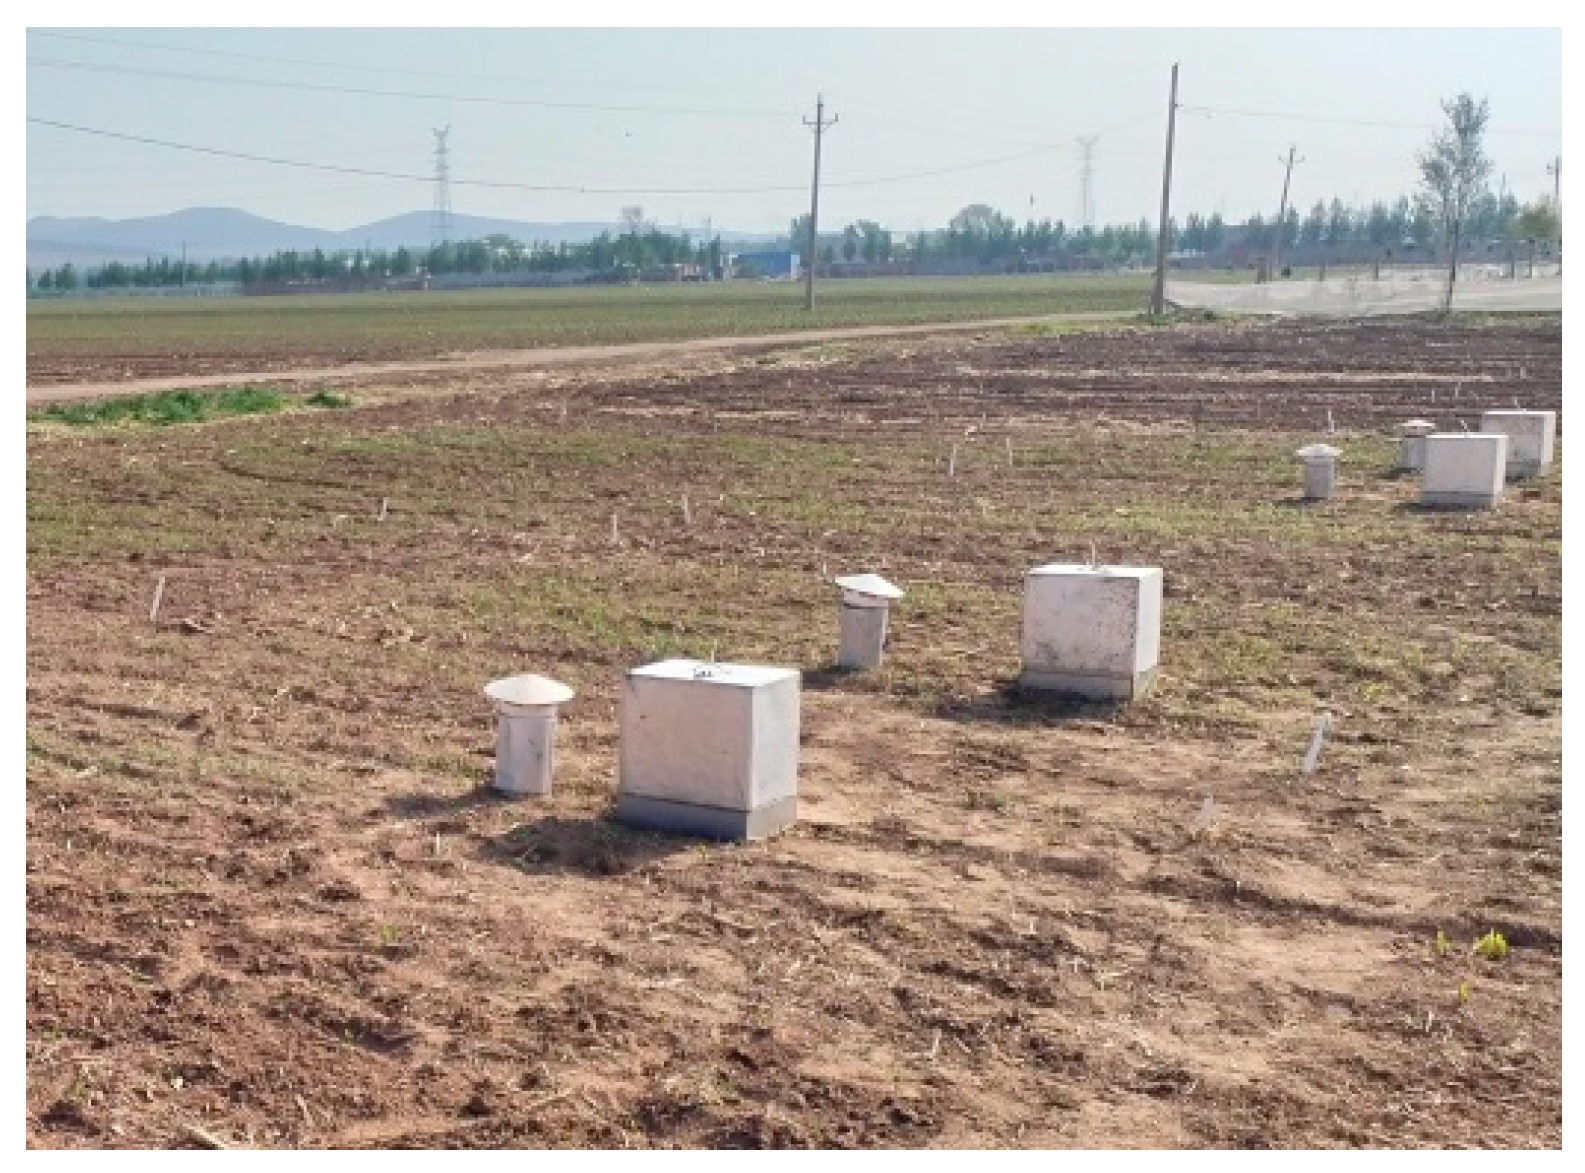
Figure 1. Static chamber and ammonia (NH3) volatilization field device diagram.
Agronomy 14 02798 g001
Figure 2. Effects of different treatments on N2O (A) and CO2 (B) flux during the corn-growing season (mean ± SE). FP: conventional fertilization; NE: nutrient expert optimized fertilization; SF: stable compound fertilizer; CRU: controlled-release-coated urea. The same apply below.
Agronomy 14 02798 g002
Figure 3. Effects of different treatments on N2O (A) and CO2 (B) accumulation during the corn-growing season (mean ± SE). Different lowercase letters within treatments indicate significant differences (p < 0.05).
Agronomy 14 02798 g003
Figure 4. Effects of different treatments on NH3 volatilization flux (A) and accumulation (B) during the corn-growing season (mean ± SE). Different lowercase letters within treatments indicate significant differences (p < 0.05).
Agronomy 14 02798 g004
Table 1. Fertilizer application amount of different treatments.
TreatmentBase FertilizerFirst TopdressingSecond Topdressing
N
Kg ha−1
P2O5
kg ha−1
K2O
kg ha−1
N
kg ha−1
P2O5
kg ha−1
K2O
kg ha−1
N
kg ha−1
P2O5
kg ha−1
K2O
kg ha−1
FP1566072000000
NE8312069690614800
SF200120130000000
CRU200120130000000
Table 2. Effects of different treatments on N2O cumulative emissions, CO2 cumulative emissions, global warming potential, corn yield, and greenhouse gas emission intensity during the corn-growing season.
TreatmentsN2O Cumulative Emissions
kg ha−1
CO2 Cumulative Emissions
kg ha−1
GWP
kg CO2-eq ha−1
Corn Yield
kg ha−1
GHGI
kg kg−1
FP2.89 ± 0.02c12,031 ± 44a12,891 ± 41a12,182 ± 492b1.06 ± 0.04a
NE4.07 ± 0.09a11,685 ± 339a12,899 ± 333a12,498 ± 749ab1.04 ± 0.06a
SF1.78 ± 0.02d10,351 ± 163b10,881 ± 157c14,113 ± 351a0.77 ± 0.01c
CRU3.08 ± 0.02b10,589 ± 100b11,508 ± 100b12,594 ± 172ab0.91 ± 0.01b
Different lowercase letters in the same column indicate significant differences (p < 0.05).
Disclaimer/Publisher’s Note: The statements, opinions and data contained in all publications are solely those of the individual author(s) and contributor(s) and not of MDPI and/or the editor(s). MDPI and/or the editor(s) disclaim responsibility for any injury to people or property resulting from any ideas, methods, instructions or products referred to in the content.