Abstract
This work aimed to determine how factors such as genotype, environment, and location influence the variation of biochemical compounds constituting the nutraceutical profile of Rosa canina L. fruits for their future integration as a functional food in everyday life, in a region of Romania, where wild fruits have lost their popularity, along with globalization and the social evolution of the rural environment. For nine genotypes of Rosa canina L., the average values of moisture (35.81%), ash (2.55%), total sugar content (41.37 g glucose equivalents/100 g), polyphenols (1211.15 mg gallic acid equivalents/100 g), tannins (764.22 mg gallic acid equivalents/100 g), flavonoids (126 mg catechin equivalents/100 g), anthocyanins (18.64 mg cyanidin 3-glucoside equivalents/100 g), alkaloids (64.20 mg equivalents of atropine sulfate/100 g), antioxidant activity (91.97%), as well as the contents of vitamin C (1.97 g/100 g), lycopene (0.85 mg/100 g), and β-carotene (1.42 mg/100 g) were determined. The determining factor is the genotype, and there are significant variations in the contents of bioactive compounds, both between the three studied areas and between genotypes in the same area. The contents of compounds with nutraceutical value justifies the significant food potential of these wild fruits and their use as a natural medicine in prophylactic and preventive activity.
Keywords:
Rosa canina L.; polyphenols; flavonoids; vitamin C; anthocyanins; alkaloids; antioxidant activity 1. Introduction
In the last decade, wild fruits have attracted increasing attention due to their medicinal properties and high nutritional and nutraceutical values, being a rich source of antioxidant compounds, vitamins, and minerals [1]. Despite the remarkable composition of wild edible fruits, their phytochemical fingerprints have not been sufficiently explored [2]. Unfortunately, people tend to consume fast food, processed food, and sweets, which results in higher body weight associated with various diseases [3,4]. The biologically active substances present in the fruit could provide several health benefits by reducing inflammation, protecting the liver, and improving heart conditions [5]. Supplementing the diet with natural products, prepared in the form of powders, decoctions, infusions, or poultices [6], is therefore, a solution to reduce the occurrence of many health problems [7]. Rosa canina L., commonly known as rosehip, belongs to the Rosaceae family and is a widespread shrub in Europe, western Asia, and northeastern Africa [8,9]. It has a long history of use for medicinal, cosmetic, and culinary purposes [10]. The species name canina (Latin for dog) can be attributed to the writings of the ancient Greek physician Hippocrates and the Roman naturalist Pliny the Elder, who suggested that preparing the wild root of R. canina could treat a dog bite [11]. Its flowers are characterized by shades of petals, ranging from white to pale pink, the occurrence of intense pink being particularly rare [12]. Its pseudo fruits, rosehips, reaching maturity in August–September, are a valuable resource both from a medical and economic point of view [13]. Its leaves, fruits, roots, flowers, and seeds are mainly used for extracting floral water and essential oils [14]. Rosehip shows remarkable antioxidant, antimicrobial, gastroprotective, anti-inflammatory, cardioprotective, and immunosuppressive activities, which are associated with the presence of different bioactive compounds [15]. The fruit is rich in vitamins and minerals, and the vitamin C concentration of rose hips is relatively high [16] compared to other types of fruits and vegetables. At the same time, rose hips contain high levels of pectin, hesperidin, essential oils, proteins, and vitamins, as well as color pigments such as beta-carotene, lycopene, and anthocyanins. The mixed sweet–sour taste of the fruit is caused by citric acid, ellagic acid, and malic acid [17]. This paper aims to identify the impact of factors such as genotype, environment, and location on the content of biochemical compounds in the fruits of Rosa canina L. for their future integration as a functional food in everyday life, in an area where the wild fruits have lost their popularity, along with globalization and the social evolution of the rural environment.
2. Materials and Methods
2.1. Materials and Location
For the analysis, ripe rosehip (Rosa canina L.) fruits were collected from the spontaneous flora of Olt County, Romania. The selected genotypes, three from each location, presented special pomological characteristics (fruit size and productivity) and are part of 3 forest ecosystems: Grădinile Forest, Studinita Forest, and Vlădila Forest. The codes given to the genotypes were made up of the initial of the forest of origin (G, S, and V) and the first letter of the botanical name of the species (R). To obtain plant powder, freshly harvested fruits were washed with water, dried with a paper towel, and ground.
Vlădila forest (44°00′58″ N 24°23′10″ E) has a forest–steppe climate; it is located on a relief with altitudes of 100–115 m, consisting of loess and loessoid deposits, and is crossed by Ungura Valley and Vlădila stream, with annual precipitation of approximately 525 mm and an average temperature of 11.5 °C, and the dominant winds are from the west, contributing to the dry climate. Studinita Forest (43°58′22″ N 24°24′09″ E) also has a forest–steppe climate with similar conditions, annual temperature of 11.5 °C and precipitation of 525 mm, being exposed to western winds, without surface water courses, but with groundwater stored in gravel deposits and sand. The climate is silvosteppe type, with cambic and clay-iluvial soils. Grădinile Forest (43°56′26″ N 24°24′24″ E), located at a more varied altitude (between 115.9 and 98.8 m) and intersected by Suhatului Valley and Grădinilor Valley, registers an average temperature of 10.6 °C, with winters marked by atmospheric variability and summers by warm and dry winds from the southwest and occasionally moist air from the Danube.
2.2. Chemicals and Reagents
Ethanol, distilled water, hexane, acetone, Folin–Ciocalteu reagent, sodium carbonate, sodium nitrite, aluminum chloride, sodium hydroxide, potassium chloride, ferric chloride, 1.10-phenanthroline, sodium acetate, 2,6-dichloroindophenol (DCPIP), 2,2-diphenyl-1-picrylhydrazyl, sodium bicarbonate, phosphoric acid, concentrated sulphuric acid, phenol and glucose standards, gallic acid monohydrate, catechin hydrate, ascorbic acid, cyanidin-3-glucoside, and atropine sulfate monohydrate were all manufactured by Merck-Sigma-Aldrich, Darmstadt, Germany.
2.3. Laboratory Equipment
A Corning-Labnet Vortex Mixer VX-200 system (Corning Life Sciences, Tewksbury, MA, USA), an ultrasonic bath with heater (ULTR-2L0-001; Labbox Labware, Migjorn, Spain), and a Labnet Spectrafuge 6c centrifuge ((Labnet International Inc., Edison, NJ, USA) were used to obtain extracts from the plant material. Colorimetric determinations were performed with a Perkin Elmer Lambda25 UV–Vis spectrophotometer (Shelton, CT, USA).
2.4. Preparation of Aqueous Extracts
A total of 1 g of each plant powder was mixed with 10 mL of distilled water. The samples were vortexed using a Corning-Labnet Vortex Mixer VX-200 system at 3000 rpm for 2 min. The mixtures were then placed in an ultrasonic bath (40 kHz) at 99 °C for 30 min. Finally, each supernatant was separated by filtration through a Whatman no. 1 filter paper (Merck-Sigma-Aldrich, Darmstadt, Germany) and used to determine total tannin and total sugar content [18,19,20].
2.5. Preparation of the Ethanolic Extracts
A total of 10 mL of ethanol–water mixture (8:2, v/v) was added to 1 g of each plant powder. The samples were vortexed using a Corning-Labnet Vortex Mixer VX-200 system at 3000 rpm for 2 min. The mixtures were placed in an ultrasonic bath (40 kHz) for 60 min and then centrifuged at 6500 rpm for 30 min. Samples were taken from the supernatant without filtration to determine total polyphenol, flavonoid, anthocyanin, and alkaloid content and antioxidant activity [18,19,20].
2.6. Determination of Moisture and Ash Content
Moisture (water content) and ash (mineral content) were determined gravimetrically by oven drying at 105–110 °C and calcination of the dried residue at 550–600 °C, respectively, until the samples were brought to constant mass. The results were expressed as a percentage (%) of moisture content and ash, respectively [18].
2.7. Determination of Sugar Content
Total sugar content (TSC), expressed as g glucose equivalents (GluE)/100 g fresh weight (FW), was determined colorimetrically following the methodology suggested by Vijan et al. [18]. To an equimolecular mixture of 0.25 mL of aqueous extract and 0.25 mL of distilled water, 2.5 mL of concentrated sulphuric acid was added. After stirring, 1 mL of a 5% phenol solution was quickly added to the sample. The samples were placed in a water bath at 100 °C for 15 min, and then, after shaking for a few seconds to develop the color, the absorbance was measured at 490 nm using a quartz cell with a 1 cm optical path. The sugar content was determined using the glucose calibration curve.
2.8. Determination of Vitamin C Content
Vitamin C content, expressed in g/100 g FW, was determined colorimetrically, according to the methodology described by Hera et al. [19], using 2,6-dichloroindophenol (DCPIP) at pH 3–4.5. DCPIP is a dye that acts as an oxidizing agent when it reacts with ascorbic acid (vitamin C). If vitamin C, which is a good reducing agent, is present in a sample, the blue dye, which turns pink under acidic conditions, is reduced by ascorbic acid to a colorless compound. The redox reaction of DCPIP with vitamin C causes a decrease in absorbance at 520 nm.
2.9. Determination of Antioxidant Activity (DPPH)
Antioxidant activity, expressed as percent inhibition of 2,2-diphenyl-1-picrylhydrazyl (DPPH %), was determined using the methodology proposed by Mazilu et al. [20], with ethanol extracts from the plant material. The method is based on the observation that when the DPPH radical is scavenged by an antioxidant through hydrogen donation to form DPPH-H, the color of the DPPH solution changes from purple to yellow, and the absorbance of the sample at 517 nm decreases. A total of 2.97 mL of DPPH solution in ethanol was mixed with 0.03 mL of ethanolic extract. The reaction mixtures were shaken thoroughly and allowed to stand in the dark at room temperature for up to 20 min. Absorption spectra were then recorded and the absorbance values at 517 nm were noted.
2.10. Determination of Total Polyphenol Content
The total polyphenol content (TPC), expressed in mg gallic acid equivalents (GAE)/100 g FW, was determined colorimetrically, following the methodology proposed by Giosanu et al. [21], with small modifications. The principle of the method is based on the formation of a blue-colored compound between phosphotungstic acid and polyphenols in an alkaline medium. Thus, to 7 mL of distilled water, 0.5 mL of ethanolic extract, 0.5 mL of Folin–Ciocalteu reagent, and 2 mL of 10% sodium carbonate solution were added in turn. The samples were kept in the dark for two hours. Absorption spectra were then recorded, and the absorbance values at 760 nm were noted.
2.11. Determination of Total Tannin Content
The total tannin content (TTC), expressed as mg GAE/100 g FW, was determined colorimetrically following the methodology proposed by Giura et al. [22], with minor modifications. To 7 mL of distilled water, 0.5 mL of aqueous filtered extract, 0.5 mL of Folin–Ciocalteu reagent, and 2 mL of 10% sodium carbonate solution were added in turn. The samples were kept in the dark for 60 min. Absorption spectra were then recorded and absorbance values at 760 nm were noted.
2.12. Determination of Total Flavonoid Content
The concentration of flavonoids (TFC) was performed by spectrophotometric method, according to the methodology proposed by Giura et al. [22]. The principle of the method is based on the formation of a yellow-orange-colored compound due to the reaction between the flavonoids and the aluminum chloride. Thus, to 6 mL of distilled water, 1 mL of ethanolic extract, 0.5 mL of sodium nitrite 5%, 0.5 mL of aluminum chloride 10%, and 2 mL of sodium hydroxide 1M solution were added in turn. Absorption spectra were immediately recorded, and absorbance values at 510 nm were noted. The concentration of flavonoids was estimated using the catechin calibration curve, and finally, their content was expressed as mg catechin equivalent (EC)/100 g FW.
2.13. Determination of Total Anthocyanin Content
The total anthocyanin content (TAC), expressed in mg cyanidin-3-glucoside equivalents (C3GE)/100 g FW, was determined colorimetrically, by the differential pH method proposed by Anggraini et al. [23], with minor changes. The extracts were diluted with two buffer solutions of different pHs: 0.025 M potassium chloride (pH 1.0) and 0.4 M sodium acetate (pH 4.5). After resting for 15 min, the absorption spectra of the samples were recorded, noting the absorbance values at 520 and 700 nm.
2.14. Determination of Total Alkaloid Content
The total alkaloid content, expressed as mg atropine sulfate monohydrate equivalents (CSAE)/100 g FW, was determined by the method proposed by Badea and Vijan [24] with small modifications. To 7 mL of distilled water, 1 mL of ethanolic extract, 1 mL of 0.025 M ethanolic solution of ferric chloride, and 1 mL of 0.05 M ethanolic 1.10-phenanthroline solution were added in turn. The mixtures were kept at 70 °C for 30 min. After cooling, the absorption spectra of the samples were recorded, noting the absorbance values at 510 nm.
2.15. Determination of Carotenoid Content (Lycopene and β-Carotene)
The content of lycopene and β-carotene, expressed in mg/100 g FW, was determined colorimetrically, in the supernatant resulting from the extraction of 2 g of powder in a mixture of hexane, ethanol, and acetone in a volumetric ratio of 2:1:1, according to the methodology proposed by Cosmulescu et al. [25], using the molar extinction coefficients at 470 nm and 503 nm for lycopene and β-carotene in hexane.
2.16. ATR-FTIR Analysis
Spectral measurements were performed with a Jasco 6300 FTIR spectrometer equipped with a diamond crystal ATR accessory (Pike Technologies, Madison, WI, USA). Spectral data for fresh fruit (skin and pulp) and dried fruit (as fine powder), recorded in the 4000–400 cm−1 region using a TGS detector and Cosin apodization, were processed with JASCO Spectra Manager software II (ver. 2.08A) [26]. The results were reported on the average resulting from each studied area. The three genotypes from the Grădinile area were coded GR, respectively, and SR and VR for the genotypes from the other two studied areas.
2.17. Statistical Analysis
All assays were performed in triplicate. Results were reported as mean ± standard deviation (SD). Data were processed in Excel (Microsoft Office 2010) and SPSS Trial Version 26.0 (SPSS Inc., Chicago, IL, USA). Duncan’s multiple range test was used to test the differences between the studied genotypes. Values of p < 0.05 were considered significant. The Pearson correlation coefficient was used to measure the strength of the linear correlation between the determined parameters.
3. Results and Discussion
3.1. Determination of Moisture, Ash, Sugars, Vitamin C, and DPPH
Analyzing the data presented in Table 1, it is observed that there are significant differences between the studied genotypes for all identified parameters (p < 0.05). The significant differences observed between the genotypes studied in terms of moisture content, ash content, sugars, vitamin C, and antioxidant activity (DPPH) can be attributed to both genetic variation and the influence of the specific environment in the area of origin. Each genotype, originating from a different environment, may develop distinct biochemical adaptations in response to local soil, climate, and altitude conditions. Thus, the interaction between genotype and environment plays an essential role in determining the biochemical composition, reflected by the notable differences in the measured values for these parameters. The average humidity for all genotypes was 35.81%, ranging from 23.38% (GR3) to 48.34% (VR2). Regarding ash, the highest value was obtained in the SR2 genotype (2.88%), and the lowest values were obtained in the GR2 and SR3 genotypes (2.33%), the values being quite close to the average (2.55%). Regarding humidity, results close to the values of the present study were reported in the work of Andronie et al. [27] for red rose hips (Rosa canina L.) fruits harvested from Cluj County, Romania, reporting an average value of 30.30%. Similar values were determined by Vasilj et al. [28] within the same species, finding the maximum value of 2.41% for ash and a humidity of 47.72%. For both parameters, different results from those obtained in the present study were reported for fresh fruits of black rosehip (Rosa pimpinellifolia L.) from a region on the border of Iran and Azerbaijan: average moisture of 15.77% and average amount of ash of 4.51% [29]. The obtained results show that the two parameters show great variability, being strongly influenced by the amount of water in the soil and atmospheric precipitation. The average amount of TSC was 41.37 gGluE/100 g, with quite large differences between genotypes; thus, it oscillated between 30.68 (VR2) and 57.22 gGluE/100 g (SR1). The analysis of the results regarding the vitamin C content revealed a similar situation with the TSC, with the average value (1.97 g/100 g) oscillating between the values recorded at VR2 (1.68 g/100 g) and SR1 (2.23 g/100 g).

Table 1.
Moisture content, ash, sugars, vitamin C, and antioxidant activity (DPPH I%).
These values are significantly higher than those reported by Grdiša [30], where the average value identified was 118.10 mg/100 g FW. In the case of vitamin C, it is known that with time, temperature changes and conservation processes can lead to its degradation [27,31]. Oxidative stress is a metabolic condition in which the cellular antioxidant capacity does not counterbalance the oxidative damage induced by various aggressions such as free radicals. Oxidative stress is the consequence of the imbalance between reactive oxygen species (ROS) and antioxidants leading to cellular damage and the pathophysiology of many diseases [8]. The antioxidant activity recorded an average free radical inhibition value of 91.97%, with a difference of 4.97% up to the maximum value recorded in the SR2 genotype (96.94%). In a comparative study [32] on some species of the Rosaceae family collected from Greece, the variation in antioxidant activity determined by the DPPH test on fruits was as follows: Rosa canina (100 μg/mL) > Rosa sempervivens (130 μg/mL) > Pyracantha coccinea (500 μg/mL).
3.2. Determination of Phenolic Compounds
Table 2 shows the values obtained for the content of phenolic compounds in fresh rosehip fruits. It is observed that there are significant differences between the studied genotypes for all the identified parameters (p < 0.05). The significant differences in the content of phenolic compounds in fresh rosehip fruits can be explained by the genetic variation between genotypes and the influence of environmental factors in the growing areas. Phenolic compounds are often produced in response to environmental stress [26], such as exposure to UV radiation, temperature, moisture, and soil nutrient availability. Geographical location also plays an important role, contributing through specific microclimate and soil characteristics. For example, previous research [21,22] here shows that regional variations are influencing the phenolic content in similar plants due to adaptation to local stress. Therefore, genotypes from different environments may accumulate varying amounts of phenolic compounds to better adapt to local conditions. This complex interaction between genetics and environment is central to the observed variability in fruit phenolic composition. TPC, known for its antioxidant properties [33], varied greatly, both between and within genotypes. The limits of variation were 956.67 (GR3) and 1884.67 mg GAE/100 g (GR1), both values coming from fresh fruit from genotypes from the same area.
Table 2.
The content of phenolic compounds in fresh rosehip fruits.
Our results are close to those obtained in Turkey [34], on four cultivated species of the genus Rosa, where the fruits of R. canina stood out as having the highest average amount of TPC (1538.68 mg GAE/100 g) compared to the other three species (R. corymbifera—1336.04 mg GAE/100 g; R. rugosa—896.53 mg GAE/100 g; and R. alba—1336.04 mg GAE/100 g). In all analyzed genotypes, tannins represent the highest percentage of phenolic compounds, followed by flavonoids and anthocyanins, with significant differences in the order of magnitude between these classes. The highest amount of TTC was identified in the VR2 genotype (873.67 mg GAE/100 g), representing 84.91% of TPC. In the case of TFC, the maximum was reached by the VR3 genotype (202.33 mg CE/100 g), with a weight of 18.69% of the TPC, a value found in the reported range (61–294 mg CE/100 g) for Rosa fruits from Serbia [35]. Anthocyanins constitute the least represented class of polyphenolic compounds in rosehip fruits, the maximum TAC content being recorded in the GR1 genotype (20.63 mg C3GE/100 g), with a weight of 1.09% in TPC. The TAC showed an average value of 18.64 mg C3GE/100 g for all genotypes, with the highest share of TAC being found in the GR3 genotype (2%). In Turkey [36], it was reported that the fruits of R. canina and R. dumalis had a TAC between 36.2–78.1 mg C3GE/100 g, higher than the values in our study.
3.3. Determination of Alkaloids and Carotenes (Lycopene and β-Carotene)
Table 3 shows the values obtained for the content of alkaloids and carotenes (lycopene and β-carotene) in fresh rosehip fruits. The significant differences (p < 0.05) in the content of alkaloids and carotenoids between the studied genotypes reflect a complex interaction between the genetic and environmental factors. This highlights the biological diversity of the studied genotypes, which influences the ability to synthesize bioactive compounds, as well as the adaptation to different environmental conditions. Environmental factors such as light, humidity, temperature extremes, and soil composition play a critical role in stimulating or inhibiting the production of these compounds, and the geographic location contributes through specific microclimates and variations in available nutrients [24,37]. In addition, this interaction between genetics, environment, and location is responsible for the observed variability in the biochemical profile, suggesting a unique ecological adaptability leading to the genotype. The limits of variation for the content of alkaloids in rosehip fruits were quite wide, as evidenced by the SD value of 17.16 and the mean of 64.20 mg CSAE/100 g for all genotypes, which is much closer to the maximum value recorded in genotype VR3 (86.71 mg CSAE/100 g), compared to the minimum value recorded at GR3 (37.34 mg CSAE/100 g). Carotenoids are pigments produced by plants that give yellow, orange, and red color. They are powerful antioxidants that provide several benefits to human health [37].
Table 3.
The content of alkaloids and carotenes (lycopene and β-carotene) in fresh rosehip fruits.
In all rosehip samples, lycopene was found in much lower amounts than β-carotene. The highest amounts of lycopene were found in genotype VR1 (1.10 mg/100 g) and β-carotene in genotype SR1 (2.49 mg/100 g). The values obtained for carotenoids in the analyzed rosehip fruits were similar to those found in a study by Goztepe [38], where 1.06 mg/100 β-carotene and 2.41 mg/100 g lycopene were found.
3.4. Pearson Correlation Matrix Between Biological Compounds and Genotypes
The most significant positive correlations were recorded in the case of genotypes with moisture (r = 0.452, p < 0.05), TTC (r = 0.409, p < 0.05), TFC (r = 0.501, p < 0.01), alkaloids (r = 0.717, p < 0.01) and negative correlations with TPC (r = −0.570, p < 0.01) and DPPH (r = −0.600, p < 0.01). TTC recorded significant positive correlations with moisture (r = 0.561, p < 0.01), genotype (r = 0.409, p < 0.05), TPC (r = 0.391, p < 0.05), TFC (r = 0.687, p < 0.01) and alkaloids (r = 0.705, p < 0.01). In addition to the positive correlation with genotypes and TTC, humidity also had a positive correlation with alkaloids (r = 0.452, p < 0.05) and a negative correlation with ash (r = −0.526, p < 0.01) and vitamin C (r = −0.572, p < 0.01). Significant positive correlations were also recorded in the case of sugars, being associated with vitamin C (r = 0.410, p < 0.05), TPC (r = 0.456, p < 0.05), TFC (r = 0.445, p < 0.05), and β-carotene (r = 0.447, p < 0.05) (Table 4).
Table 4.
The intensity of correlations between the bioactive compounds determined in the fruit of Rosa canina L.
TPC positively influences both TAC (r = 0.695, p < 0.01) and DPPH (r = 0.473, p < 0.05). In the case of TFC, a positive relationship was also identified with alkaloids (r = 0.551, p < 0.01) and a negative one with DPPH (r = −0.433, p < 0.05). Other significant correlations were TAC–β-carotene (r = −0.395, p < 0.05), lycopene–β-carotene (r = 0.561, p < 0.01), and lycopene–DPPH (r = −0.399, p < 0.05) (Table 4). The data obtained are in accordance with those from the specialized literature [36,39], and it is obvious that there are a number of factors such as genotype, TPC, TFC, or lycopene that correlate with antioxidant activity.
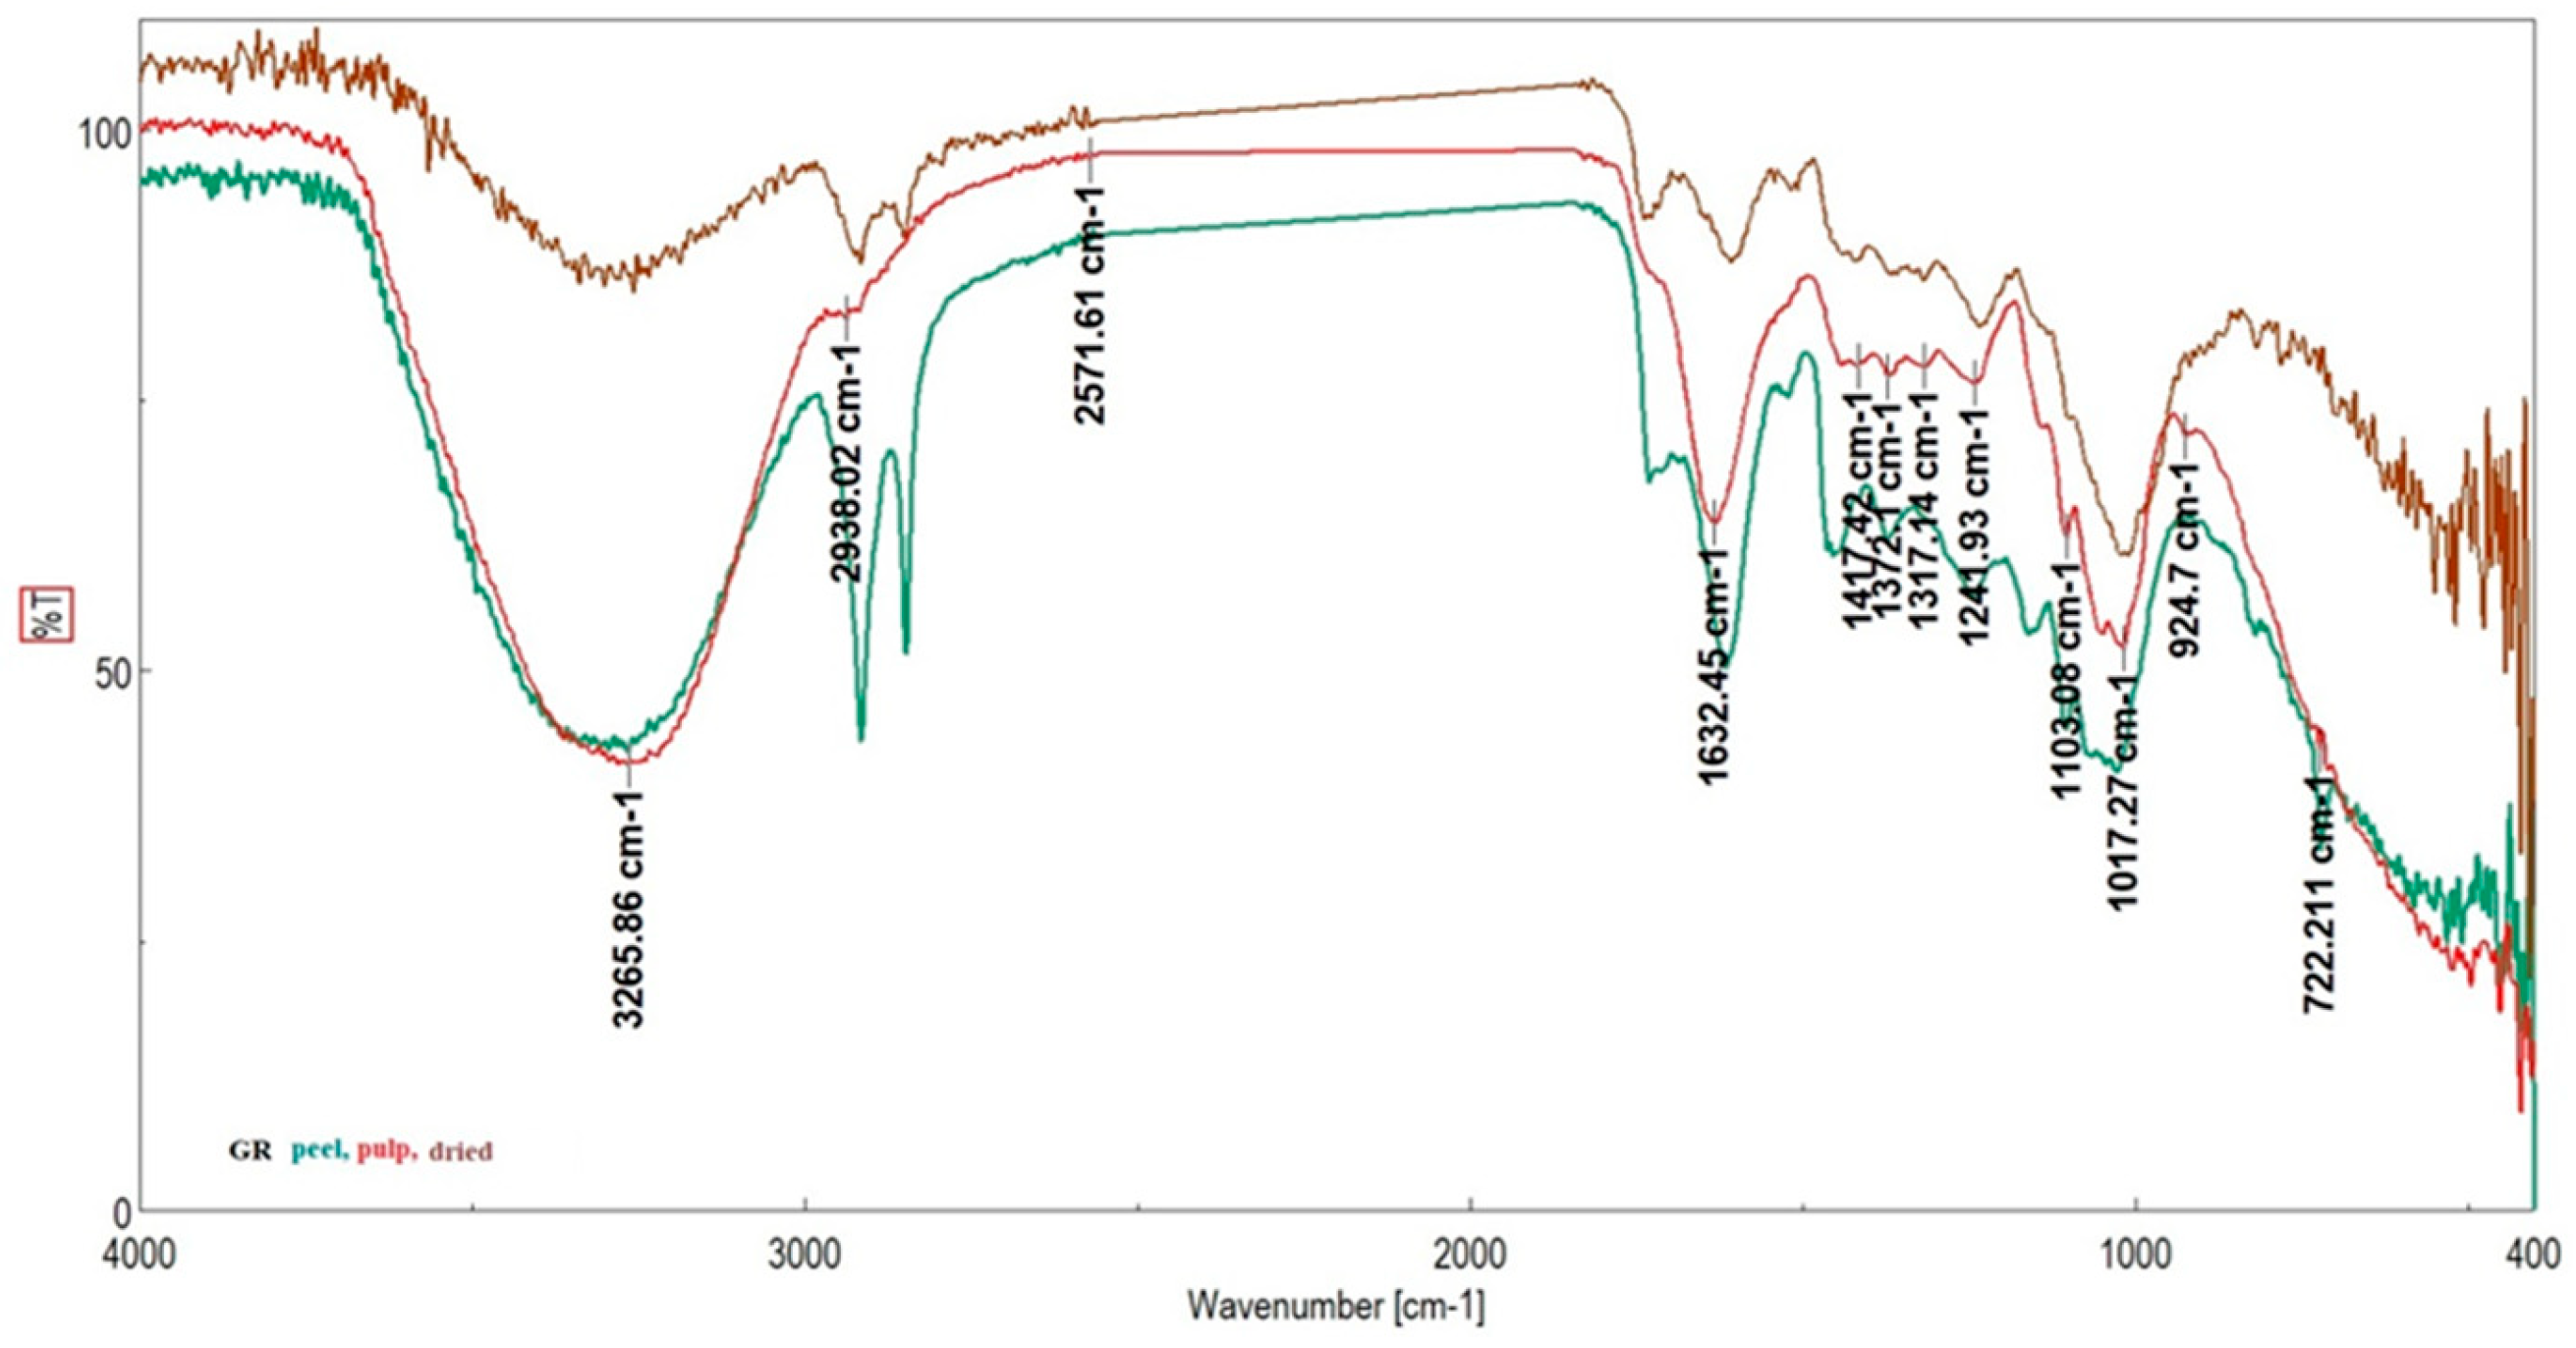
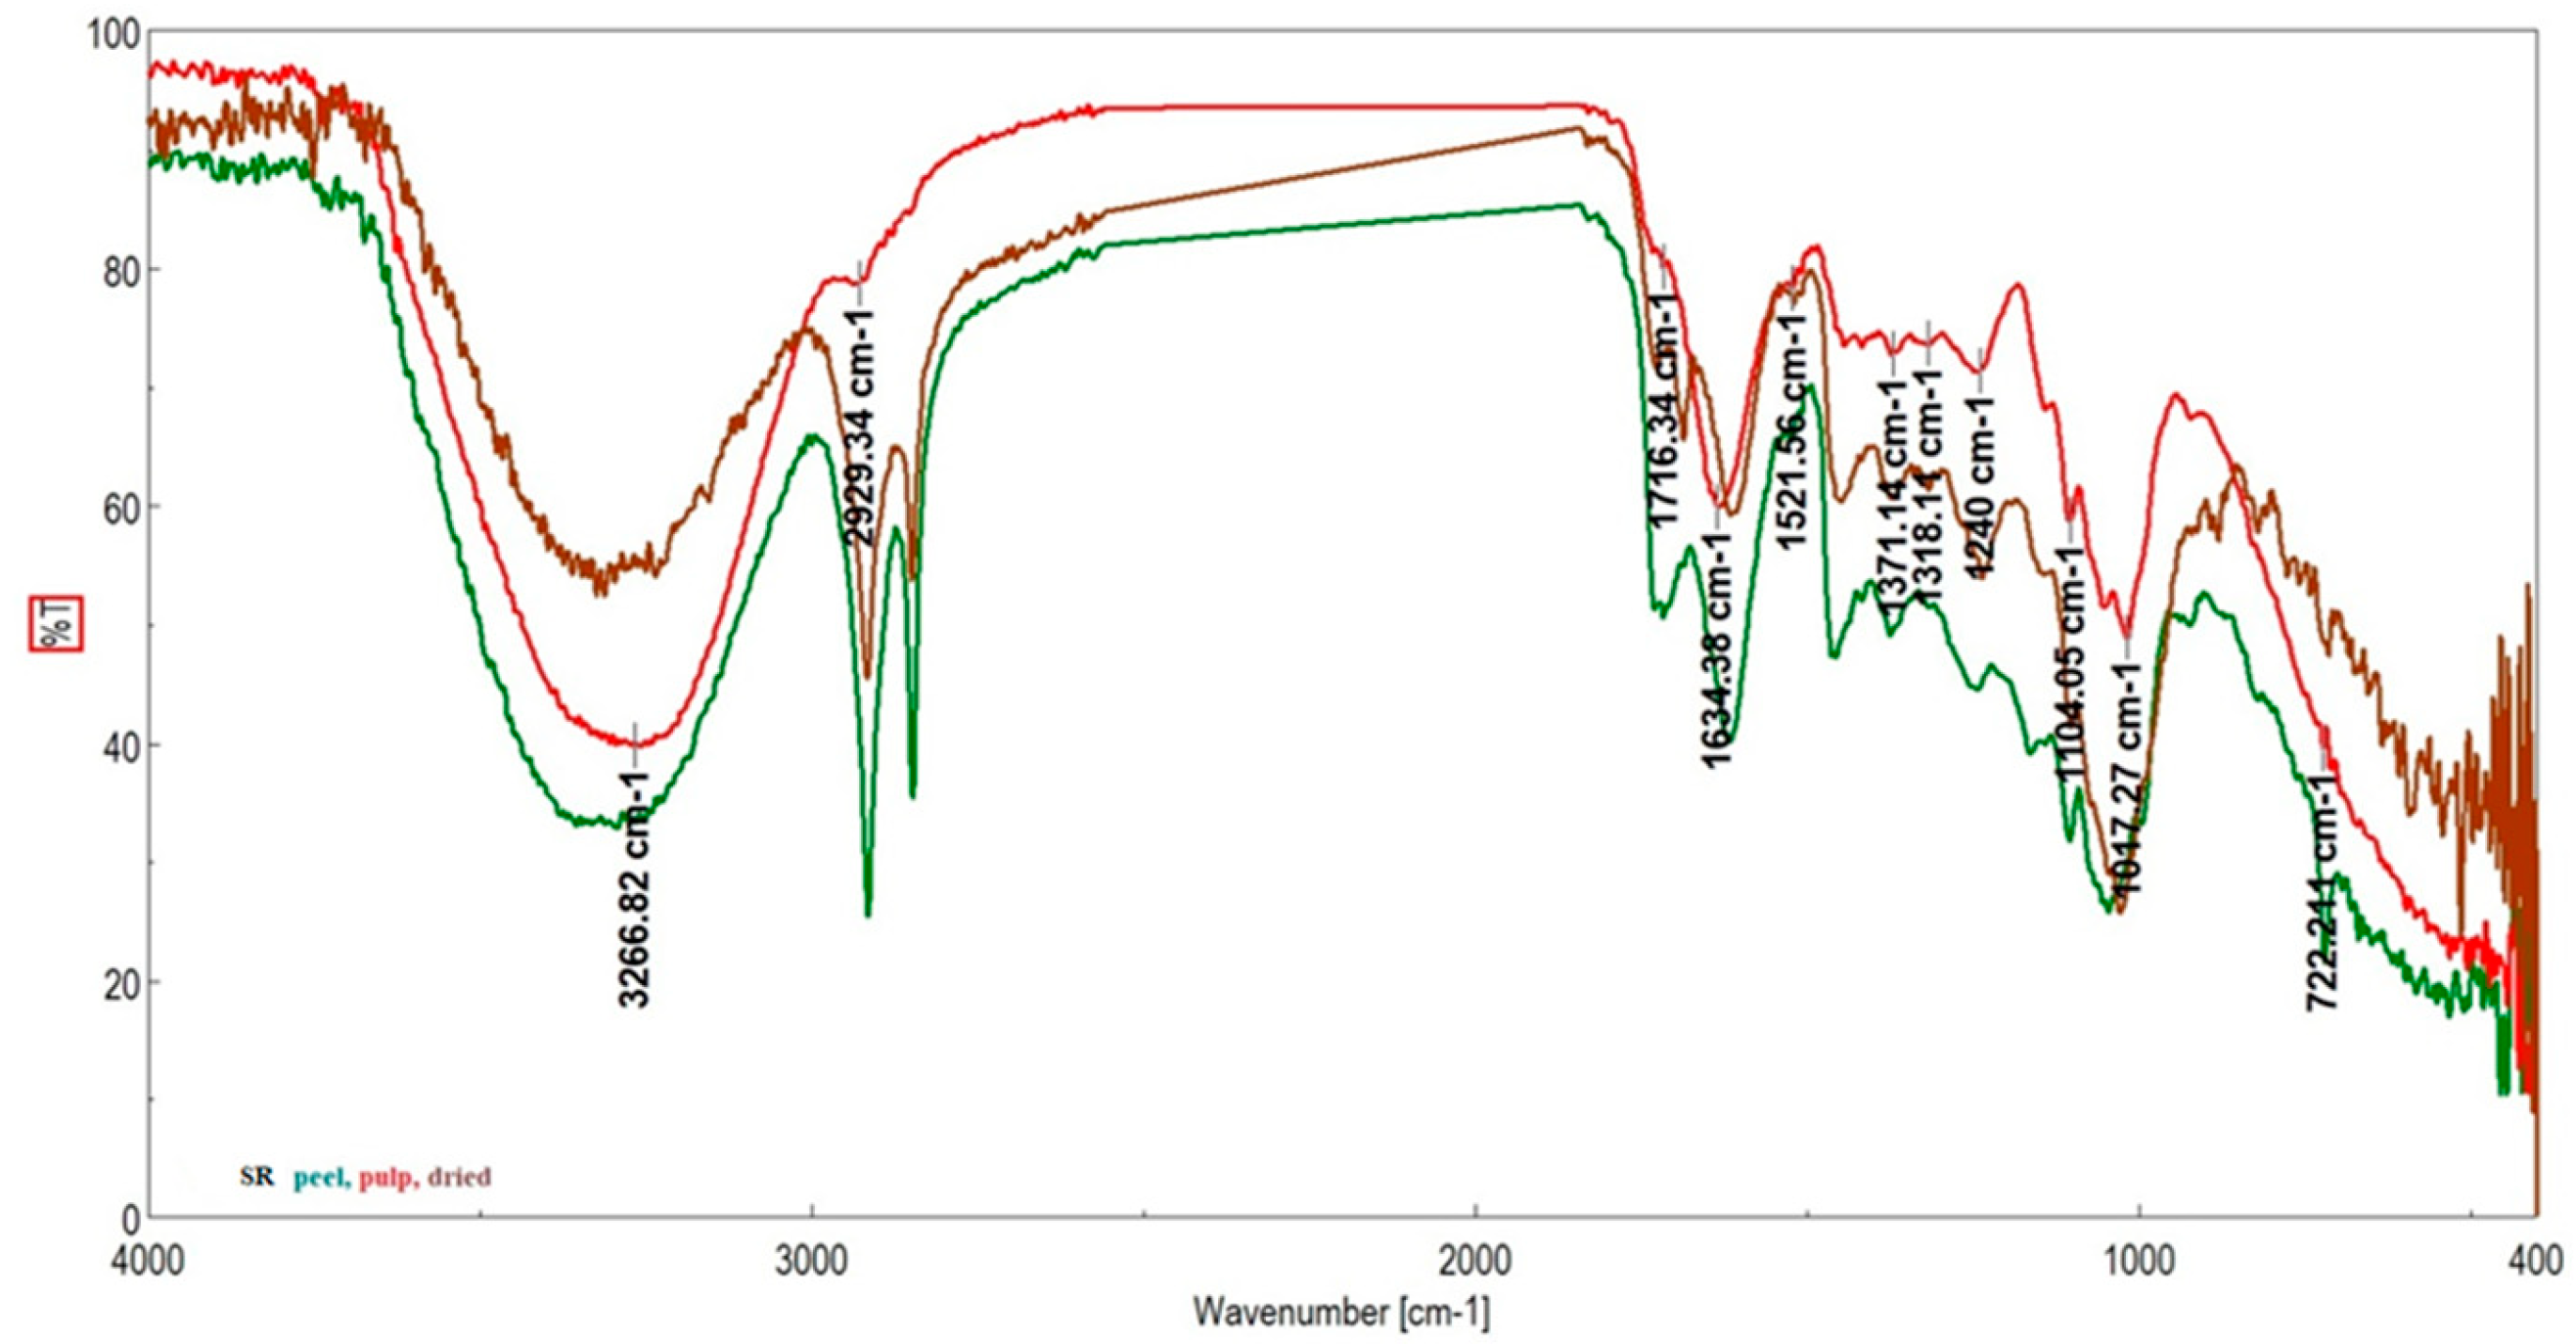
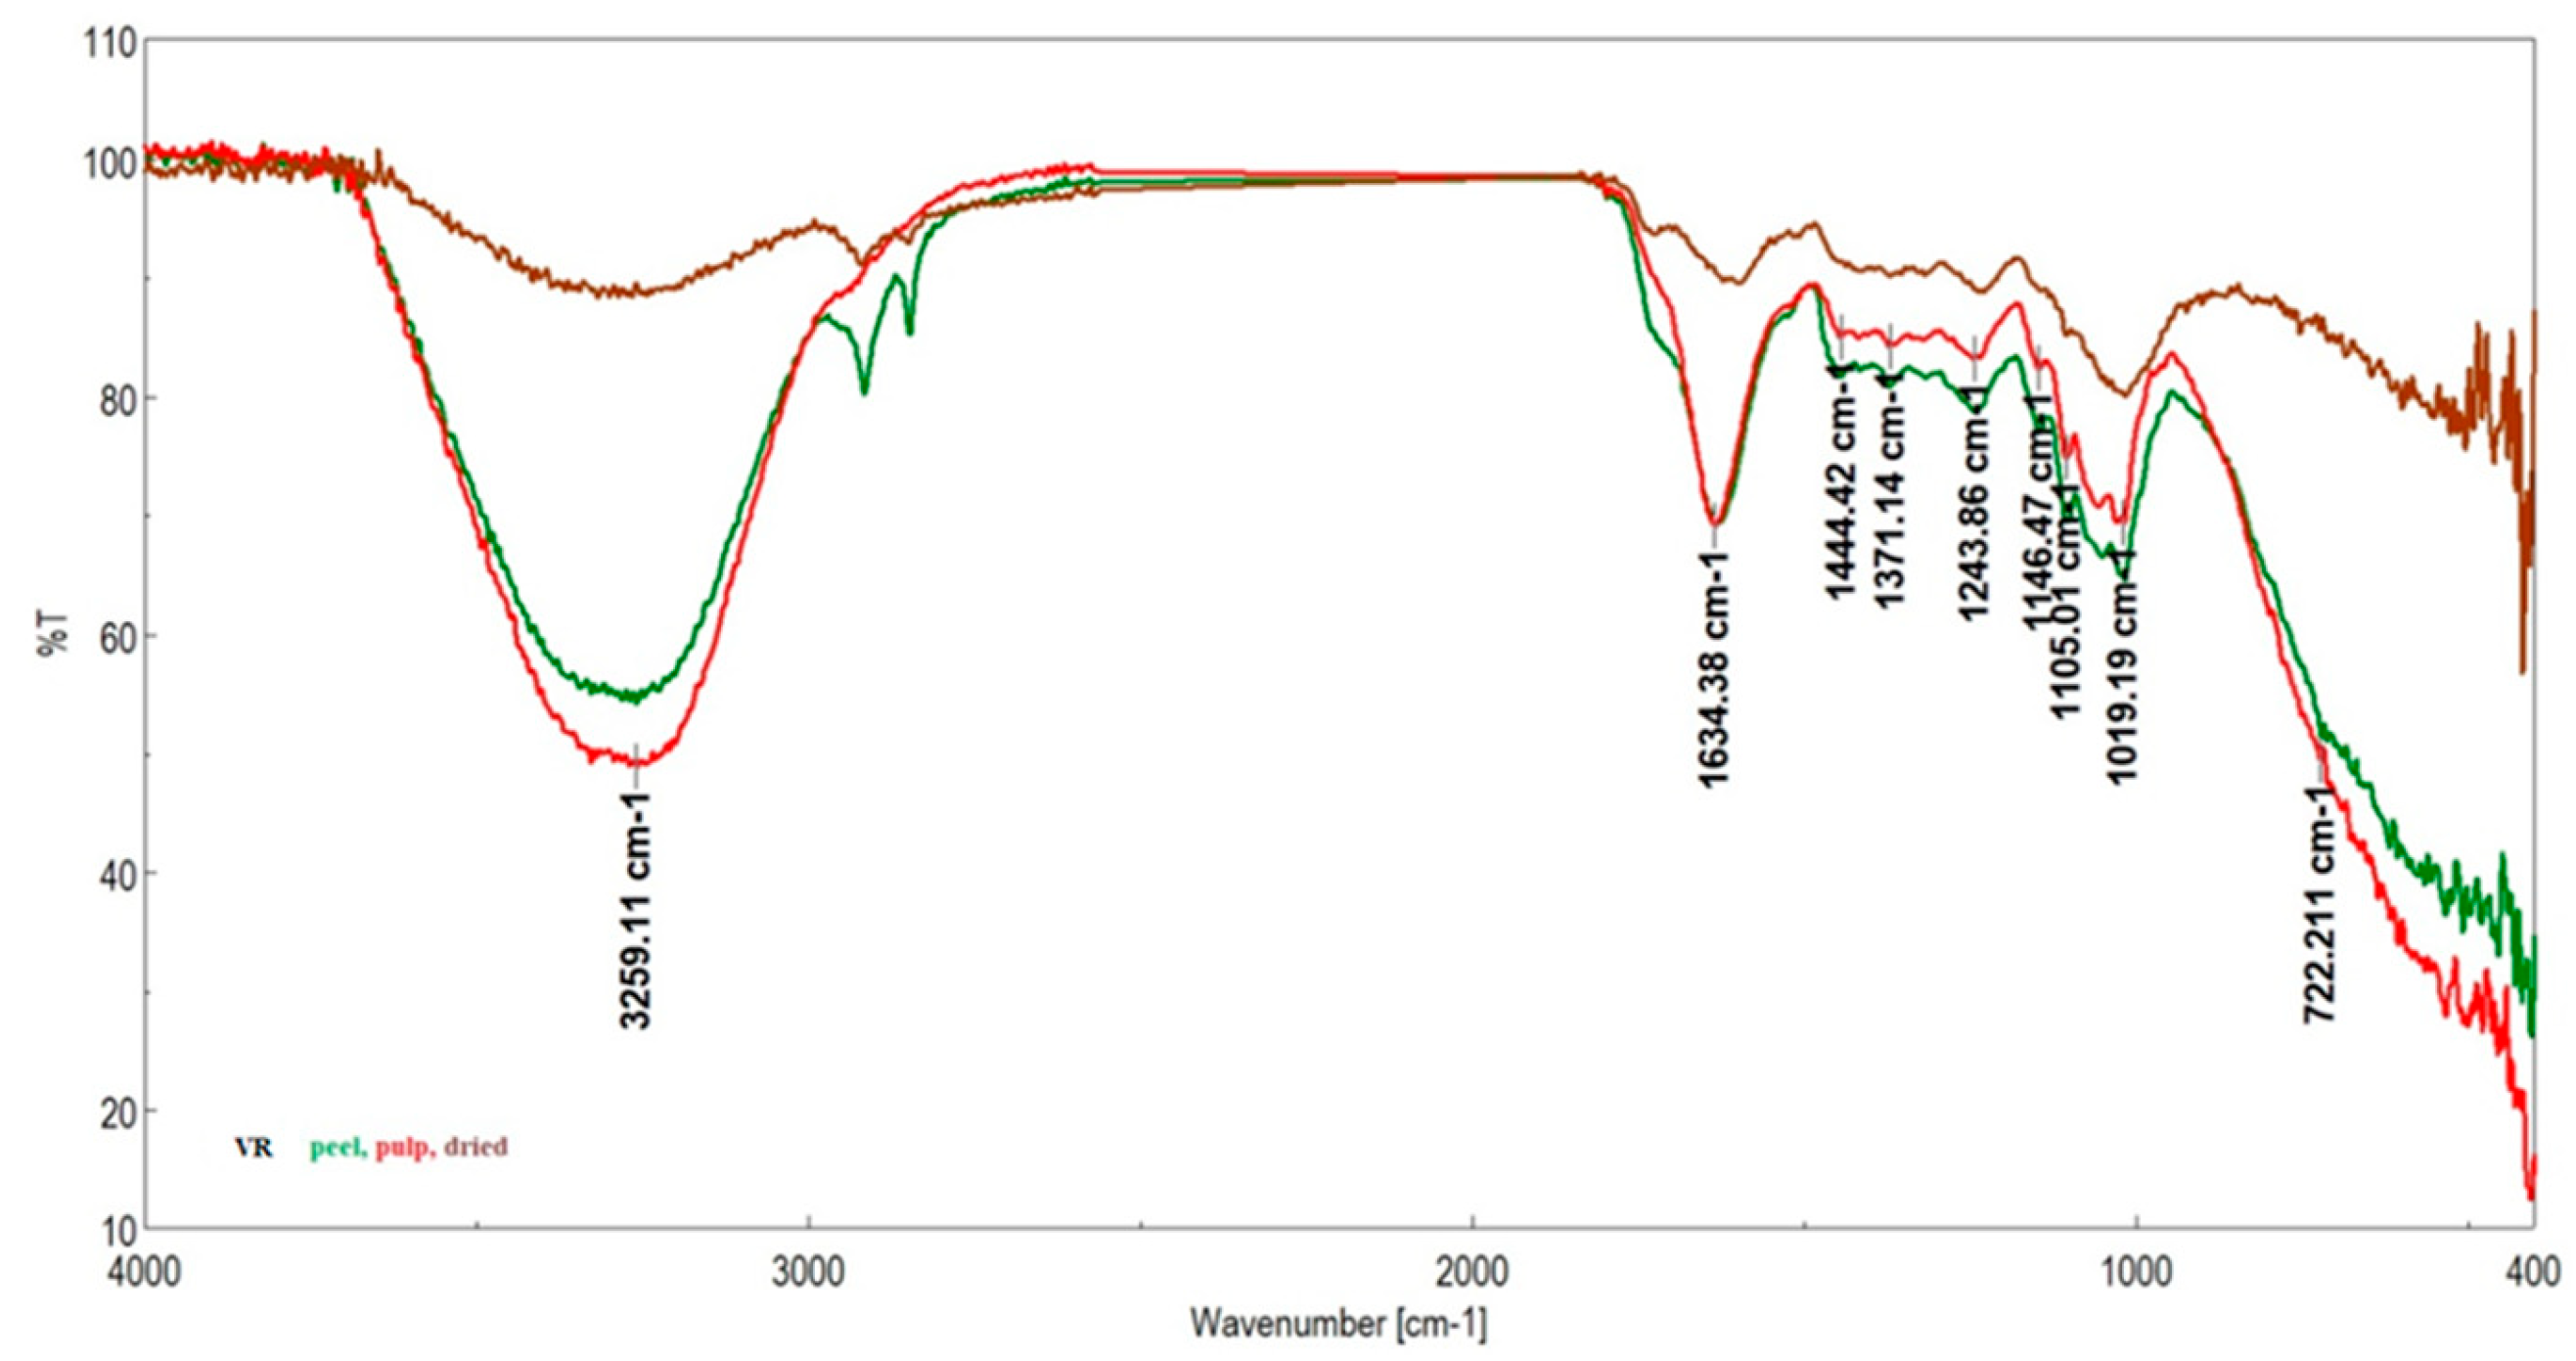
3.5. ATR-FTIR Results
Rosehips have a lot of promise for use in the creation of functional meals since they are full of nutrients and bioactive substances. Rosa canina oils are mostly composed of polyunsaturated fatty acids, with linoleic acid being the primary fatty acid (62.3%) and oleic acid (28.6%). Table 5 shows the frequencies and assignments of the bands observed in the vibrational spectra (Figure 1, Figure 2 and Figure 3) for the various samples of R. canina, the attributes from the figures are given for the pulp. To facilitate such assignments, the spectra of other plant samples Rosa rubiginosa-RR [40] with relatively similar percentages of fundamental constituents (lipids, proteins, and carbohydrates) have been included. Only oil and seed samples exhibit the lipid characteristic band at 3009 cm−1, which is caused by the carbon–carbon double bond’s C–H stretching vibration [41]. The characteristic lipid bands appear at 3009 cm−1 due to the C–H stretching vibration of the carbon–carbon double bond, 2956–2850 for the asymmetric and symmetric stretching vibration of CH3 and CH2 of the acyl chains, and the band at 1726–1742 cm−1 is due to the stretching vibration of the carbonyl (-C-C=O-) ester group of triglycerides. The bands between 1634–1698 upper for Rosa canina are assigned to C=O (amide I). The peak that appears between 1506–1537 cm−1 should be assigned to N-H bending vibrations (amide II).
Table 5.
Main bands in the ATR-FTIR spectra of different parts of R. rubiginosa plant and of other species (for comparison purposes). All wavenumber values are in cm−1.

Figure 1.
ATR-FTIR spectra of Grădinile genotypes (GR1, GR2, and GR3).
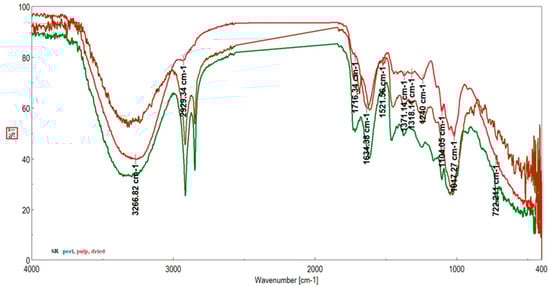
Figure 2.
ATR-FTIR spectra of Studinita genotypes (SR1, SR2, and SR3).

Figure 3.
ATR-FTIR spectra of Vlădila genotypes (VR1, VR2, and VR3).
The absorption band at around 1240 cm−1 is attributed to N-H bending (amide III), and the following bands (down to 1100 cm−1) have a fingerprint of methyl ester of long-chain fatty acids [42]. The bands at wavenumbers around 1020 cm−1 and 810–765 cm−1 are due to the phosphate component. Finally, the band at 722 cm−1 can be assigned to (CH2)n rocking [41].
4. Conclusions
Analyzing the presented results, it appears that the genotype has the greatest impact on the concentration of bioactive compounds, and it can be observed that there are genotypes with much higher nutritional values compared to others, regardless of the type of compound analyzed and the harvesting area. The relatively close distance between the harvest areas determined a difference between them but did not single out one as much more favorable. The maximum and total mean values also varied depending on the analyzed compound, with a significant fluctuation. Thus, in the case of TPC, for example, the order was GR > SR > VR, in the case of TTC, the order was SR > VR > GR, and for TFC, the order VR > SR > GR was recorded. It can thus be admitted that another factor can be essential, namely the environmental conditions. Given that there are three forest ecosystems under discussion, two of which have a water source or are close to one (VR, GR), it can be hypothesized that the presence of water in a forest ecosystem can influence the amounts of biocompounds in fruits. Regarding the nutraceutical value of the Rosa canina species, it is undeniable that it can be a source of vitamins and other nutrients both necessary for the human body and animals. As evidence, there is also a diversity of ways of using these fruits in traditional medicine in many areas of the globe, a fact for which in adopting a healthy lifestyle, the consumption of such fruit can do nothing but help in prophylaxis and prevention against various pathologies.
Author Contributions
Conceptualization, F.D.S. and S.N.C.; methodology, L.E.V. and C.M.T.; software, F.D.S., L.E.V. and C.M.T.; validation, F.D.S., L.E.V., C.M.T. and S.N.C.; formal analysis, L.E.V. and C.M.T.; investigation, F.D.S. and S.N.C.; resources, F.D.S. and S.N.C.; writing—original draft preparation, F.D.S., L.E.V. and C.M.T.; writing—review and editing, S.N.C. All authors have read and agreed to the published version of the manuscript.
Funding
This research received no external funding.
Data Availability Statement
The original contributions presented in the study are included in the article, further inquiries can be directed to the corresponding author.
Conflicts of Interest
The authors declare no conflicts of interest.
References
- Natić, M.; Pavlović, A.; Bosco, F.L.; Stanisavljević, N.; Zagorac, D.D.; Akšić, M.F.; Papetti, A. Nutraceutical properties and phytochemical characterization of wild Serbian fruits. Eur. Food Res. Technol. 2019, 245, 469–478. [Google Scholar] [CrossRef]
- Ritika Bora, B.; Ismail, B.B.; Garba, U.; Mishra, S.; Jha, A.K.; Naik, B.; Kumar, V.; Rather, M.A.; Preet, M.S.; Rustagi, S.; et al. Himalayan fruit and circular economy: Nutraceutical potential, traditional uses, challenges and opportunities. Food Prod. Process. Nutr. 2024, 6, 71. [Google Scholar] [CrossRef]
- Dimitriadis, K.M.; Karavergou, S.; Tsiftsoglou, O.S.; Karapatzak, E.; Paschalidis, K.; Hadjipavlou-Litina, D.; Charalambous, D.; Krigas, N.; Lazari, D. Nutritional value, major chemical compounds, and biological activities of Petromarula pinnata (Campanulaceae)—A unique nutraceutical wild edible green of Crete (Greece). Horticulturae 2024, 10, 689. [Google Scholar] [CrossRef]
- Dos Santos, O.V.; do Rosário, R.C.; Teixeira-Costa, B.E. Sources of carotenoids in amazonian fruits. Molecules 2024, 29, 2190. [Google Scholar] [CrossRef] [PubMed]
- Stabnikova, O.; Stabnikov, V.; Paredes-López, O. Fruits of wild-grown shrubs for health nutrition. Plant Foods Hum. Nutr. 2024, 79, 20–37. [Google Scholar] [CrossRef]
- Khan, M.N.; Ullah, B.; Kaplan, A.; Wahab, S.; Ali, B.; Al Obaid, S.; Ansari, M.J. An in-depth investigation of the nutraceutical value and medicinal perspectives of wild medicinal plants in Ojhor Valley, Hindukush Range, Chitral, Pakistan. Genet. Resour. Crop Evol. 2024. [Google Scholar] [CrossRef]
- Fantasma, F.; Samukha, V.; Saviano, G.; Chini, M.G.; Iorizzi, M.; Caprari, C. Nutraceutical aspects of selected wild edible plants of the Italian Central Apennines. Nutraceuticals 2024, 4, 190–231. [Google Scholar] [CrossRef]
- Khelfi, S.; Zerizer, S.; Bensouici, C.; Tebibel, S.; Kabouche, Z. The antioxidant activity and the protective effect of Rosa canina L. fruit against intestinal inflammation induced by hyperhomocysteinemia in mice. Pharm. Chem. J. 2024, 57, 1778–1788. [Google Scholar] [CrossRef]
- Sallustio, V.; Rossi, M.; Marto, J.; Coelho, T.; Chinnici, F.; Mandrone, M.; Chiocchio, I.; Cappadone, C.; Luppi, B.; Bigucci, F.; et al. Green extraction of Rosa canina L. and Prunus spinosa L. by NaDES and their encapsulation in chitosan nanoparticles for cosmetic industry. Ind. Crops Prod. 2024, 218, 119042. [Google Scholar] [CrossRef]
- Jariani, P.; Shahnejat-Bushehri, A.A.; Naderi, R.; Zargar, M.; Naghavi, M.R. Molecular and phytochemical characteristics of flower color and scent compounds in dog rose (Rosa canina L.). Molecules 2024, 29, 3145. [Google Scholar] [CrossRef]
- Popović-Djordjević, J.; Špirović-Trifunović, B.; Pećinar, I.; de Oliveira, L.F.C.; Krstić, Đ.; Mihajlović, D.; Akšić, M.F.; Simal-Gandara, J. Fatty acids in seed oil of wild and cultivated rosehip (Rosa canina L.) from different locations in Serbia. Ind. Crops Prod. 2023, 191, 115797. [Google Scholar] [CrossRef]
- Jariani, P.; Shahnejat-Bushehri, A.A.; Naderi, R.; Zargar, M.; Naghavi, M.R. Characterization of key genes in anthocyanin and flavonoid biosynthesis during floral development in Rosa canina L. Int. J. Biol. Macromol. 2024, 276, 133937. [Google Scholar] [CrossRef] [PubMed]
- Miljković, V.M.; Nikolić, L.; Mrmošanin, J.; Gajić, I.; Mihajilov-Krstev, T.; Zvezdanović, J.; Miljković, M. Chemical profile and antioxidant and antimicrobial activity of Rosa canina L. dried fruit commercially available in Serbia. Int. J. Mol. Sci. 2024, 25, 2518. [Google Scholar] [CrossRef] [PubMed]
- Bhiri, F.; Kallel, F.; Bouallegue, A.; Abidi, S.; Bensidhom, G.; Ellouz Chaabouni, S.; Trabelsi, A.B.H. Hydro-distilled wastes from Rosa canina: A new renewable bioresource for the extraction and characterization of cellulosic microfibers. Euro-Mediterr. J. Environ. Integr. 2024, 9, 1–13. [Google Scholar] [CrossRef]
- Ashrafi, A.; Ahari, H.; Asadi, G.; Nafchi, A.M. Enhancement of the quality and preservation of frozen burgers by active coating containing Rosa canina L. extract nanoemulsions. Food Chem. X 2024, 23, 101749. [Google Scholar] [CrossRef]
- Stoenescu, A.M.; Cosmulescu, S.N. Variability of some Rosa canina L. genotypes from southern area of Oltenia. Sci. Pap. Ser. B Hortic. 2021, 65, 250–255. [Google Scholar]
- Gunaydin, S.; Alibas, I. The influence of short, medium, and long duration common dehydration methods on total protein, nutrients, vitamins, and carotenoids of rosehip fruit (Rosa canina L.). J. Food Compos. Anal. 2023, 124, 105631. [Google Scholar] [CrossRef]
- Vîjan, L.E.; Mazilu, I.C.; Enache, C.; Enache, S.; Topală, C.M. Botanical origin influence on some honey physicochemical characteristics and antioxidant properties. Foods 2023, 12, 2134. [Google Scholar] [CrossRef]
- Hera, O.; Sturzeanu, M.; Vîjan, L.E.; Tudor, V.; Teodorescu, R. Biochemical evaluation of some fruit characteristics of blueberry progenies obtained from ‘Simultan × Duke’. ACS Omega 2023, 8, 18603–18616. [Google Scholar] [CrossRef]
- Mazilu, I.E.; Vîjan, L.E.; Cosmulescu, S. The influence of harvest moment and cultivar on variability of some chemical constituents and antiradical activity of dehydrated chokeberry pomace. Horticulturae 2022, 8, 544. [Google Scholar] [CrossRef]
- Giosanu, D.; Bărbuceanu, M.; Anghel, M.; Vîjan, L. The determination of the content of phenolic compounds from different Romanian wines using Folin-Ciocîlteu method. Curr. Trends Nat. Sci 2018, 7, 155–159. [Google Scholar]
- Giura, S.; Botu, M.; Vulpe, M.; Vîjan, L.E.; Mitrea, R. Evolution of the polyphenols, flavonoids, and tannins content in walnut leaves and green walnut husk during growing season. Not. Bot. Horti Agrobot. Cluj-Napoca 2019, 47, 1264–1271. [Google Scholar] [CrossRef]
- Anggraini, T.; Wilma, S.; Syukri, D.; Azima, F. Total phenolic, anthocyanin, catechins, DPPH radical scavenging activity, and toxicity of Lepisanthes alata (Blume) Leenh. Int. J. Food Sci. 2019, 9703176. [Google Scholar] [CrossRef] [PubMed]
- Badea, A.M.; Vijan, L.E. Otravă sau medicament? Alcaloizi în Aristolochia clemantitis L., Chelidonium majus L., Delphinius consolida L. și Digitalis purpurea L. Bul. Științ. Ser. Chim. Fiz. 2023, 1, 58–65. [Google Scholar]
- Cosmulescu, S.; Vijan, L.; Mazilu, I.C.; Badea, G. Bioactive compounds in the residue obtained from fruits of some cultivars of Lonicera caerulea. Horticulturae 2024, 10, 211. [Google Scholar] [CrossRef]
- Munteanu, A.L.; Vijan, L.E.; Topală, C.M.; Mitrea, R. Influence of the phytosanitary status, cultivar, and harvest time on the phenolic, chlorophyll, and alkaloid content of Rosa sp. leaves. Horticulturae 2023, 9, 1169. [Google Scholar] [CrossRef]
- Andronie, L.; Holonec, L.; Ioana, P.O.P.; Truta, A.M.; Odagiu, A.; Sălăgean, T.; Sobolu, R.; Coroian, A.; Balta, I.; Șuba, E.E. Antioxidant capacity of several Romanian forest fruits (Rosa canina L., Prunus spinosa L., Vaccium vitis-idaea L. and Cornus mas L.). Not. Bot. Horti Agrobot. Cluj-Napoca 2019, 47, 1178–1184. [Google Scholar] [CrossRef]
- Vasilj, V.; Brekalo, H.; Petrović, D.; Šaravanja, P.; Batinić, K. Chemical composition and mineral content of fresh and dried fruits of the wild rosehip (Rosa canina L.) population. J. Cent. Eur. Agric. 2024, 25, 179–193. [Google Scholar] [CrossRef]
- Pashaei, M.; Hassanpour, H. Phenolic, amino acids, and fatty acids profiles and the nutritional properties in the fresh and dried fruits of black rosehip (Rosa pimpinellifolia L). Sci. Rep. 2024, 14, 19665. [Google Scholar] [CrossRef]
- Grdiša, M.; Šic Žlabur, J.; Varga, F.; Bosilj, P.; Klepo, T.; Šatović, Z. Phytochemical diversity of Rosa canina L. populations in Croatia. Maced. Pharm. Bull. 2022, 68 (Suppl. S2), 57–58. [Google Scholar] [CrossRef]
- Michalec, K.; Wasik, R.; Gach, M.B. The content of vitamin C in dog rose fruit Rosa canina L. depending on the method and duration of storage. Sylwan 2023, 167, 110–119. [Google Scholar] [CrossRef]
- Kerasioti, E.; Apostolou, A.; Kafantaris, I.; Chronis, K.; Kokka, E.; Dimitriadou, C.; Tzanetou, E.N.; Priftis, A.; Koulocheri, S.D.; Haroutounian, S.A.; et al. Polyphenolic composition of Rosa canina, Rosa sempervivens and Pyrocantha coccinea extracts and assessment of their antioxidant activity in human endothelial cells. Antioxidants 2019, 8, 92. [Google Scholar] [CrossRef] [PubMed]
- Koczka, N.; Stefanovits-Bányai, É.; Ombódi, A. Total polyphenol content and antioxidant capacity of rosehips of some Rosa species. Medicines 2018, 5, 84. [Google Scholar] [CrossRef] [PubMed]
- Kayahan, S.; Ozdemir, Y.; Gulbag, F. Functional compounds and antioxidant activity of Rosa species grown in Turkey. Erwerbs-Obstbau 2023, 65, 1079–1086. [Google Scholar] [CrossRef]
- Nađpal, J.D.; Lesjak, M.M.; Šibul, F.S.; Anačkov, G.T.; Četojević-Simin, D.D.; Mimica-Dukić, N.M.; Beara, I.N. Comparative study of biological activiti and phytochemical composition of two rose hips and their preserves: Rosa canina L. and Rosa arvensis Huds. Food Chem. 2016, 192, 907–914. [Google Scholar] [CrossRef]
- Bozhuyuk, M.R.; Ercisli, S.; Karatas, N.; Ekiert, H.; Elansary, H.O.; Szopa, A. Morphological and biochemical diversity in fruits of unsprayed Rosa canina and Rosa dumalis ecotypes found in different agroecological conditions. Sustainability 2021, 13, 8060. [Google Scholar] [CrossRef]
- Medveckienė, B.; Kulaitienė, J.; Jarienė, E.; Vaitkevičienė, N.; Hallman, E. Carotenoids, polyphenols, and ascorbic acid in organic rosehips (Rosa spp.) cultivated in Lithuania. Appl. Sci. 2020, 10, 5337. [Google Scholar] [CrossRef]
- Goztepe, B.; Kayacan, S.; Bozkurt, F.; Tomas, M.; Sagdic, O.; Karasu, S. Drying kinetics, total bioactive compounds, antioxidant activity, phenolic profile, lycopene and β-carotene content and color quality of Rosehip dehydrated by different methods. LWT 2022, 153, 112476. [Google Scholar] [CrossRef]
- Butkevičiūtė, A.; Urbštaitė, R.; Liaudanskas, M.; Obelevičius, K.; Janulis, V. Phenolic content and antioxidant activity in fruit of the genus Rosa L. Antioxidants 2022, 11, 912. [Google Scholar] [CrossRef]
- Ramos, P.M.; Gil, J.M.; Ramos Sánchez, C.R.; Gracia, L.M.N.; Navarro, S.H.; Gil, F.J.M. Vibrational and thermal characterization of seeds, pulp, leaves and seed oil of Rosa rubiginosa. Boletín Soc. Argent. Botánica 2016, 51, 429–439. [Google Scholar] [CrossRef]
- Guillén, M.D.; Cabo, N. Infrared spectroscopy in the study of edible oils and fats. J. Sci. Food Agric. 1997, 75, 1–11. [Google Scholar] [CrossRef]
- Silverstein, R.M.; Webster, F.X.; Kiemle, D.J. Spectrometric Identification of Organic Compounds, 7th ed.; John Wiley & Sons: Hoboken, NJ, USA, 2005. [Google Scholar]
- Dovbeshko, G.I.; Gridina, N.Y.; Kruglova, E.B.; Pashchuk, O.P. FTIR spectroscopy studies of nucleic acid damage. Talanta 2000, 53, 233–346. [Google Scholar] [CrossRef] [PubMed]
- Dovbeshko, G.I.; Chegel, V.I.; Gridina, N.Y.; Repnytska, O.P.; Shirshov, Y.M.; Tryndiak, V.P.; Todor, I.M.; Solyanik, G.I. Surface enhanced IR absorption of nucleic acids from tumor cells: FTIR reflectance study. Biopolymers 2002, 67, 470–486. [Google Scholar] [CrossRef] [PubMed]
- Movasaghi, Z.; Rehman, S.; ur Rehman, D.I. Fourier transform infrared (FTIR) spectroscopy of biological tissues. Appl. Spectrosc. Rev. 2008, 43, 134–179. [Google Scholar] [CrossRef]
Disclaimer/Publisher’s Note: The statements, opinions and data contained in all publications are solely those of the individual author(s) and contributor(s) and not of MDPI and/or the editor(s). MDPI and/or the editor(s) disclaim responsibility for any injury to people or property resulting from any ideas, methods, instructions or products referred to in the content. |
© 2024 by the authors. Licensee MDPI, Basel, Switzerland. This article is an open access article distributed under the terms and conditions of the Creative Commons Attribution (CC BY) license (https://creativecommons.org/licenses/by/4.0/).