
Evaluation of the Egner–Riehm DL and Mehlich 3 Tests for the Determination of Phosphorus: The Influence of Soil Properties on Extraction Efficiency and Test Conversion


Abstract
:1. Introduction
2. Materials and Methods
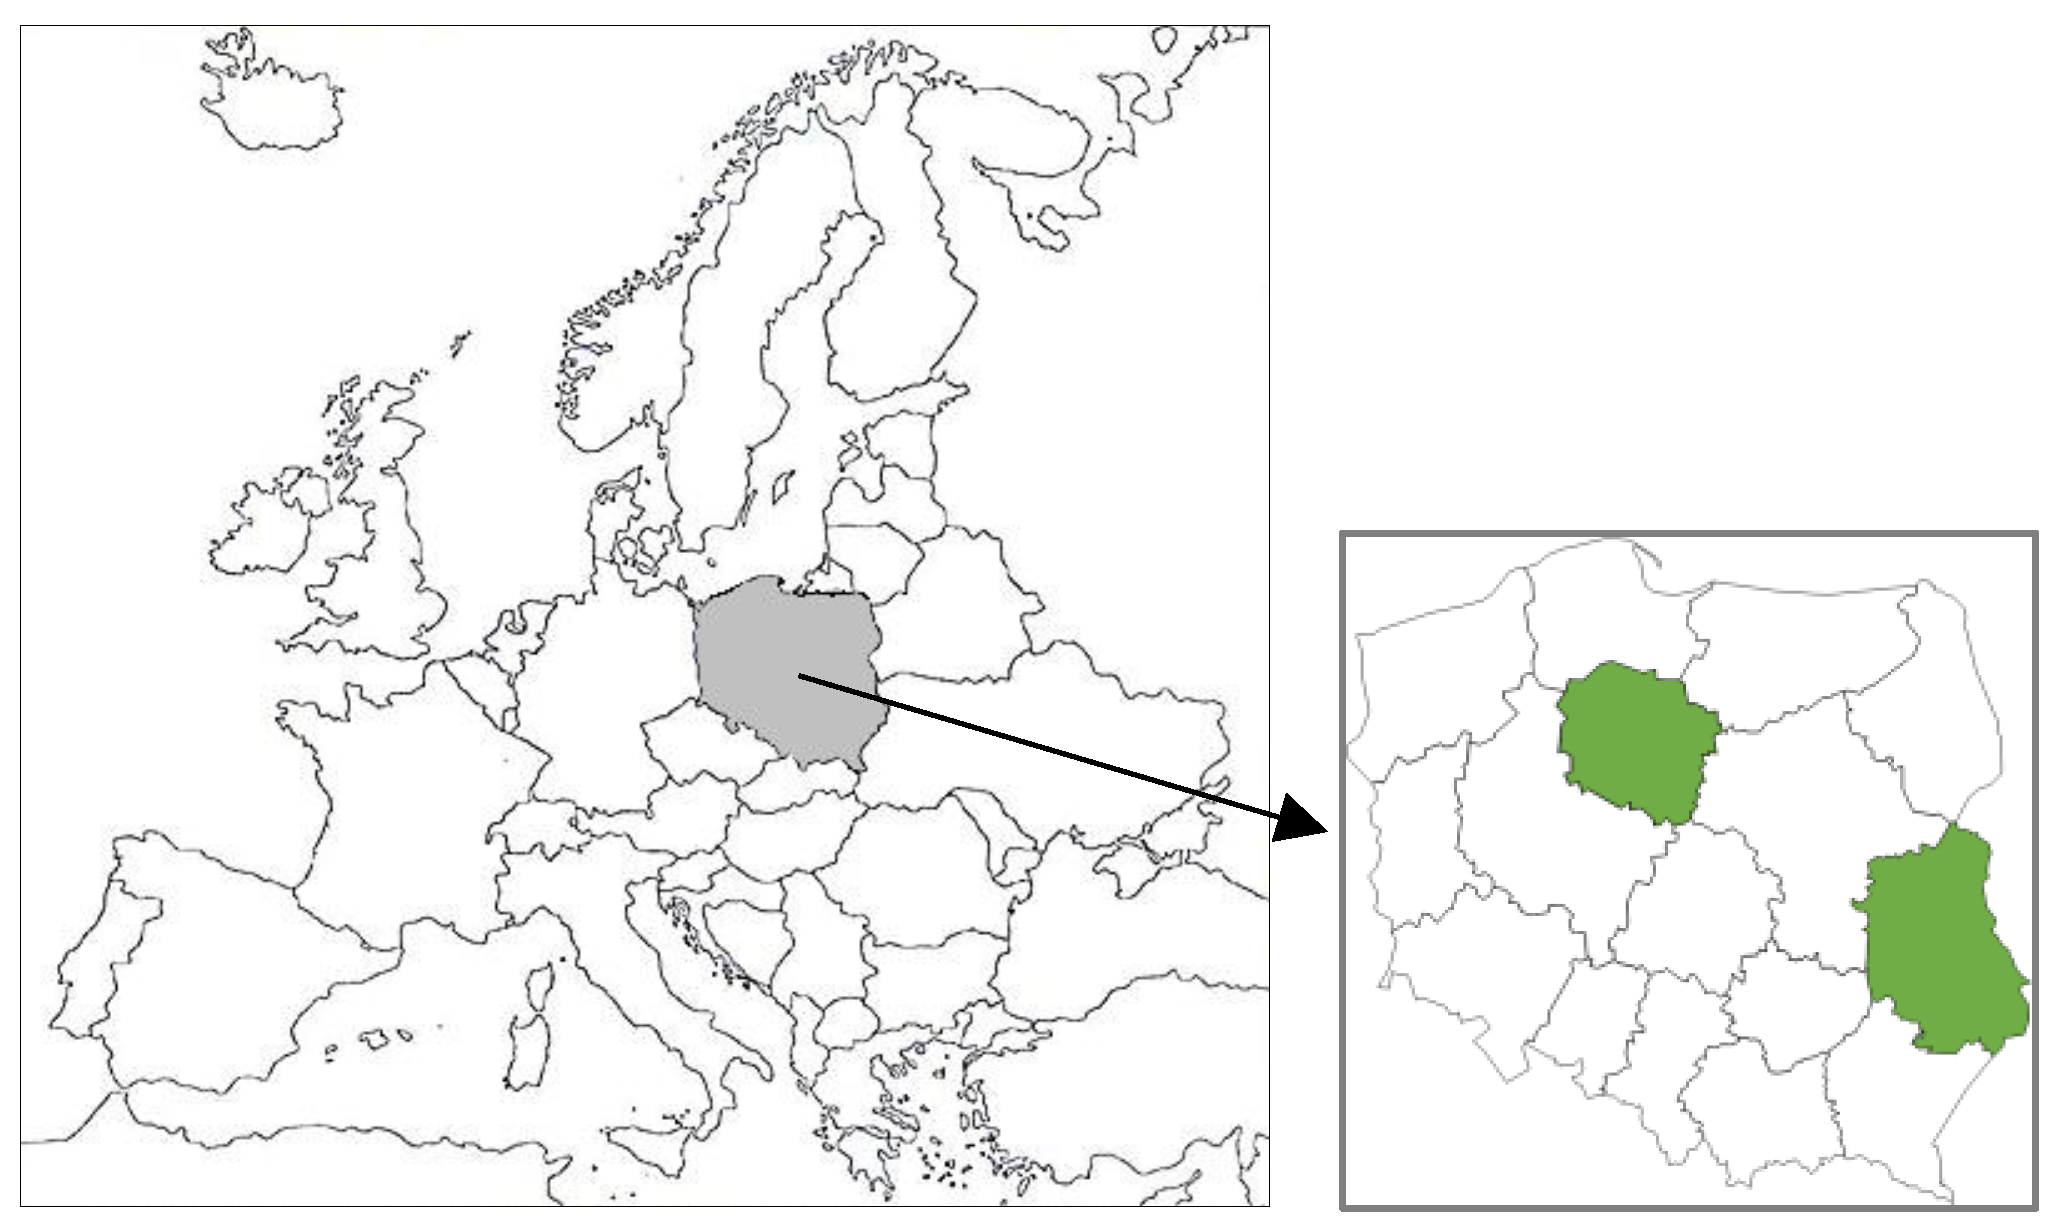
2.1. Sample Collection
2.2. Analytical Procedures
2.3. Statistics
3. Results and Discussion
3.1. Factors Affecting Soil Tests
3.2. Extraction Efficiency
3.3. The Relationship Between Soil Tests
3.4. Evaluation of Soil Tests with Plant Features
4. Conclusions
Author Contributions
Funding
Data Availability Statement
Conflicts of Interest
References
- Barrow, N.J. The effects of pH on phosphate uptake from the soil. Plant Soil 2017, 410, 401–410. [Google Scholar] [CrossRef]
- Penn, C.J.; Camberato, J.J. A critical review on soil chemical processes that control how soil pH affects phosphorus availability to plants. Agriculture 2019, 9, 120. [Google Scholar] [CrossRef]
- Cordell, D.; Drangert, J.; White, S. The story of phosphorus: Global food security and food for thought. Glob. Environ. Change 2009, 19, 292–305. [Google Scholar] [CrossRef]
- Bartosova, A.; Capell, R.; Olesen, J.E.; Jabloun, M.; Refsgaard, J.C.; Donnelly, C.; Arheimer, B. Future socioeconomic conditions may have a larger impact than climate change on nutrient loads to the Baltic Sea. AMBIO 2019, 48, 1325–1336. [Google Scholar] [CrossRef] [PubMed]
- Svendsen, L.M.; Gustafsson, B. Waterborne Nitrogen and Phosphorus Inputs and Water Flow to the Baltic Sea 1995–2018. HELCOM Baltic Sea Environmental Fact Sheet 2020. Available online: https://helcom.fi/wp-content/uploads/2020/06/BSEFS-Waterborne-nitrogen-and-phosphorus-inputs-and-water-flow-to-the-Baltic-Sea.pdf (accessed on 17 October 2024).
- Buczko, U.; van Laak, M.; Eichler-Löbermann, B.; Gans, W.; Merbach, I.; Panten, K.; Peiter, E.; Reitz, T.; Spiegel, H.; von Tucher, S. Re-evaluation of the yield response to phosphorus fertilization based on meta-analyses of long-term field experiments. AMBIO 2018, 47, 50–61. [Google Scholar] [CrossRef] [PubMed]
- Higgins, S.; Keesstra, S.D.; Kadziuliene, Ž.; Jordan-Meille, L.; Wall, D.; Trinchera, A.; Spiegel, H.; Sandén, T.; Baumgarten, A.; Jensen, J.L.; et al. Stocktake study of current fertilisation recommendations across Europe and discussion towards a more harmonised approach. Eur. J. Soil Sci. 2023, 74, 13422. [Google Scholar] [CrossRef]
- Steinfurth, K.; Börjesson, G.; Denoroy, P.; Eichler-Löbermann, B.; Gans, W.; Heyn, J.; Buczko, U. Thresholds of target phosphorus fertility classes in European fertilizer recommendations in relation to critical soil test phosphorus values derived from the analysis of 55 European long-term field experiments. Agric. Ecosyst. Environ. 2022, 332, 107926. [Google Scholar] [CrossRef]
- Tóth, G.; Guicharnaud, R.A.; Tóth, B.; Hermann, T. Phosphorus levels in croplands of the European Union with implications for P fertilizer use. Eur. J. Agron. 2014, 55, 42–52. [Google Scholar] [CrossRef]
- Jordan-Meille, L.; Rubæk, G.H.; Ehlert, P.A.I.; Genot, V.; Hofman, G.; Goulding, K.; Recknagel, J.; Provolo, G.; Barraclough, P. An overview of fertilizer-Precommendations in Europe: Soil testing, calibration and fertilizer recommendations. Soil Use Manag. 2012, 28, 419–435. [Google Scholar] [CrossRef]
- Egnér, H. Neue Beiträge zur chemischen Bodenuntersuchung unter besonderer Berücksichtigung der Laktatmethode. Landwirtsch. Forsch. 1954, SH6, 28–32. [Google Scholar]
- Egner, H.; Kohler, G.; Nydahl, F. Die Laktatmethode zur Bestimmung leicht-loslicher Phosphorsa ure in Ackerboden [The lactate method for determination of easily dissolved phosphorus in agricultural soils]. Lantbrukshogsk. Ann. 1938, 6, 1227–1234. [Google Scholar]
- Riehm, H. Bestimmung der laktatloslichen Phosphorsaure in karbonathaltigen Boden. Phosphorsaure 1943, 1, 167–178. [Google Scholar]
- Schüller, H. Die CAL-Methode, eine neue Methode zur Bestimmung des pflanzenverfügbaren Phosphates in Böden. Z. Pflanzenernähr. Bodenkd. 1969, 123, 48–63. [Google Scholar] [CrossRef]
- Mehlich, A. Mehlich 3 soil test extractant: A modification of the Mehlich 2 extractant. Commun. Soil Sci. Plant Anal. 1984, 15, 1409–1416. [Google Scholar] [CrossRef]
- Olsen, S.R.; Watanabe, F.S.; Cosper, H.R.; Larson, W.E.; Nelson, L.B. Residual phosphorus availability in long-time rotations on calcareous soils. Soil Sci. 1954, 78, 141–152. [Google Scholar] [CrossRef]
- Bray, R.H.; Kurtz, L.T. Determination of total, organic, and available forms of phosphorus in soils. Soil Sci. 1945, 59, 39–45. [Google Scholar] [CrossRef]
- Dyer, B. On the analytical determination of probably available mineral plant food in soils. J. Chem. Soc. 1894, 65, 115–167. [Google Scholar] [CrossRef]
- Vuorinen, J.; Makitie, O. The method of soil testing in use in Finland. Agrogeol. Publ. 1995, 63, 1–44. [Google Scholar]
- Schick, J.; Kratz, S.; Rückamp, D.; Shwiekh, R.; Haneklaus, S.; Schnug, E. Comparison and Inter-Calibration of Different Soil P Tests Used in the Baltic Sea Countries; Julius Kühn-Institut, Federal Research Center for Cultivated Plants (JKI) Institute for Crop and Soil Science: Braunschweig, Germany, 2013. [Google Scholar]
- Kesik, K.; Jadczyszyn, T.; Lipinski, W.; Jurga, B. Adaptation of the Mehlich 3 procedure for routine determination of phosphorus, potassium and magnesium in soil. Przem. Chem. 2015, 6, 973–976. [Google Scholar]
- Korzeniowska, J.; Stanislawska-Glubiak, E.; Lipiński, W. New limit values of micronutrient deficiency in soil determined using 1 M HCl extractant for wheat and rapeseed. Soil Sci. Annu. 2020, 71, 205–214. [Google Scholar] [CrossRef]
- Wuenscher, R.; Unterfrauner, H.; Peticzka, R.; Zehetner, F. A comparison of 14 soil phosphorus extraction methods applied to 50 agricultural soils from Central Europe. Plant Soil Environ. 2015, 61, 86–96. [Google Scholar] [CrossRef]
- Vona, V.; Centeri, C.; Biró, Z.; Vona, M.; Kalocsai, R.; Jakab, G.; Kauser, J.; Kulmány, I.M.; Kovács, A.J.; Milics, G. Comparing different phosphorus extraction methods: Effects of influencing parameters. Sustainability 2022, 14, 2158. [Google Scholar] [CrossRef]
- Dari, B.; Rogers, C.W.; Leytem, A.B.; Schroeder, K.L. Evaluation of soil test phosphorus extractants in Idaho soils. Soil Sci. Soc. Am. J. 2019, 83, 817–824. [Google Scholar] [CrossRef]
- van Laak, M.; Klingenberg, U.; Peiter, E.; Reitz, T.; Zimmer, D.; Buczko, U. The equivalence of the Calcium-Acetate-Lactate and Double-Lactate extraction methods to assess soil phosphorus fertility. J. Plant Nutr. Soil Sci. 2018, 181, 795–801. [Google Scholar] [CrossRef]
- Haefele, S.M.; Mossa, A.W.; Gashu, D.; Nalivata, P.C.; Broadley, M.R.; McGrath, S.P.; Thomas, C.L. Mehlich 3 as an indicator of grain nutrient concentration for five cereals in sub-Saharan Africa. Field Crops Res. 2024, 307, 109243. [Google Scholar] [CrossRef]
- Watson, M.; Mullen, R. Understanding Soil Tests for Plant-Available Phosphorus Fact Sheet; Ohio State University: Columbus, OH, USA, 2007; Available online: https://agcrops.osu.edu/sites/agcrops/files/imce/fertility/Soil_Tests.pdf (accessed on 17 October 2024).
- Kabala, C.; Galka, B.; Labaz, B.; Anjos, L.; de Souza Cavassani, R. Towards more simple and coherent chemical criteria in a classification of anthropogenic soils: A comparison of phosphorus tests for diagnostic horizons and properties. Geoderma 2018, 320, 1–11. [Google Scholar] [CrossRef]
- Vucans, R.; Lipenite, I.; Livmanis, J. Comparison of methods determination of phosphorus in carbonatic soil. Agron. Vestis. 2008, 11, 229–304. [Google Scholar]
- Zbíral, J.; Němec, P. Comparison of Mehlich 2, Mehlich 3, CAL, Egner, Olsen, and 0.01 M CaCl2 extractants for determination of phosphorus in soils. Commun. Soil Sci. Plant 2002, 33, 3405–3417. [Google Scholar] [CrossRef]
- Eriksson, A.K.; Ulén, B.; Berzina, L.; Iital, A.; Janssons, V.; Sileika, A.S.; Toomsoo, A. Phosphorus in agricultural soils around the Baltic Sea–comparison of laboratory methods as indices for phosphorus leaching to waters. Soil Use Manag. 2013, 29, 5–14. [Google Scholar] [CrossRef]
- Iho, A.; Valve, H.; Ekholm, P.; Uusitalo, R.; Lehtoranta, J.; Soinne, H.; Salminen, J. Efficient protection of the Baltic Sea needs a revision of phosphorus metric. AMBIO 2023, 52, 1389–1399. [Google Scholar] [CrossRef]
- Sánchez-Alcalá, I.; Del Campillo, M.C.; Torrent, J. Critical Olsen P and CaCl2-P levels as related to soil properties: Results from micropot experiments. Soil Use Manag. 2015, 31, 233–240. [Google Scholar] [CrossRef]
- PN-R-04023; Chemical and Agricultural Analysis Determination of the Content Available Phosphorus in Mineral Soil. Polish Standards Committee: Warszawa, Poland, 1996. (In Polish)
- PN-ISO 14235:2003; Soil Quality: Determination of Organic Carbon in Soil by Sulfochromic Oxidation. Polish Committee for Standardization: Warsaw, Poland, 2003. (In Polish)
- PN-EN ISO 10390:2022-09; Soil, Treated Biowaste and Sludge—Determination of pH (ISO 10390:2021). Polish Committee for Standardization: Warsaw, Poland, 2022. (In Polish)
- PN-R-04033:1998; Soil and Mineral Soil Materials—Particle Size Distribution on Soil Classes. Polish Committee for Standardization: Warsaw, Poland, 1998. (In Polish)
- PN-EN ISO/IEC 17025:2018-02; General Requirements for the Competence of Testing and Calibration Laboratories. Polish Committee for Standardization: Warsaw, Poland, 2018. (In Polish)
- Mumbach, G.L.; Gatiboni, L.C.; Dall’Orsoletta, D.J.; Schmitt, D.E.; Pessotto, P.P.; de Oliveira, C.M.B. Phosphorus extraction with soil test methods affected by soil P sorption capacity. J. Soil Sci. Plant Nutr. 2020, 20, 1882–1890. [Google Scholar] [CrossRef]
- Lindsay, W.L. Chemical Equilibria in Soils; John Wiley & Sons: New York, NY, USA, 1979; p. 449. [Google Scholar]
- Ziadi, N.; Whalen, J.K.; Messiga, A.J.; Morel, C. Assessment and modeling of soil available phosphorus in sustainable cropping systems. Adv. Agron. 2013, 122, 85–126. [Google Scholar]

| Test | Solution Components | Literature Source | Country |
|---|---|---|---|
| Egner AL | 0.1 M NH4(C3H5O3) + 0.4 M CH3COOH, pH 3.75 | Egner 1954 [11] | Belgium, Hungary, Lithuania, Norway, Slovenia, and Sweden |
| Egner–Riehm DL | 0.02 M Ca(C3H5O3)2 + 0.02 M HCl, pH 3.7 | Egner et al., 1938 [12], Riehm 1943 [13] | Latvia and Poland |
| CAL | 0.05 M Ca(C3H5O3)2 + 0.05 M Ca(CH3COO)2 + 0.3 M CH3COOH, pH 4.1 | Schüller 1969 [14] | Austria and Germany |
| Mehlich 3 | 0.2 M CH3COOH + 0.25 M NH4NO3 + 0.015 M NH4F + 0.013 M HNO3 + 0.001 M EDTA, pH 2.5 | Mehlich 1984 [15] | The Czech Republic, Estonia, and Poland |
| Olsen | 0.5 M NaHCO3, pH 8.5 | Olsen et al., 1954 [16] | Denmark, England, France, Italy, and Spain |
| Bray 1 | 0.03 M NH4F + 0.025 M HCl, pH 6.8 | Bray and Kurtz 1945 [17] | Italy |
| Dyer | citric acid 2%, pH 2.0 | Dyer 1984 [18] | France |
| AAAc | 0.5 M CH3COONH4 + 0.5 M CH3COOH, pH 4.65 | Vuorinen and Makitie 1955 [19] | Finland |
| H2O | H2O (20 °C), unbuffered | Shick et al., 2013 [20] | The Netherlands |
| Feature | Mean ± Standard Error | Range |
|---|---|---|
| Soil PDL (mg kg)−1 | 190.3 ± 8.32 | 32.0–980.0 |
| Soil PM3 (mg kg)−1 | 201.2 ± 6.46 | 31.0–660.0 |
| Plant P (%) | 0.46 ± 0.01 | 0.21–1.04 |
| pH (KCl) | 6.13 ± 0.06 | 4.06–7.67 |
| Fraction < 0.02 mm (%) | 19.2 ± 0.57 | 3.6–39.3 |
| Total organic carbon (%) | 1.09 ± 0.03 | 0.27–4.29 |
| Soil Fe (mg kg)−1 | 381.6 ± 6.58 | 36.6–661.0 |
| Soil Test | Extraction Solution Components | Solution pH | Soil/Solution Ratio | Extraction Time |
|---|---|---|---|---|
| Egner–Riehm DL | 0.02 M Ca(C3H5O3)2 + 0.02 M HCl | 3.7 | 1:50 | 90 min |
| Mehlich 3 | 0.2 M CH3COOH + 0.25 M NH4NO3 + 0.015 M NH4F + 0.013 M HNO3 + 0.001 M EDTA | 2.5 | 1:10 | 5 min |
| Soil Feature | PDL | PM3 |
|---|---|---|
| pH | 0.21 ** | ns |
| Fraction < 0.02 mm | ns | −0.35 *** |
| TOC | 0.14 * | ns |
| Fe | 0.16 * | 0.34 *** |
| Soils (pH) | n | Soils (% of Fraction with Particles <0.02 mm in Diameter) | n |
|---|---|---|---|
| Acidic (≤5.5) | 62 | Very light (≤10%) | 36 |
| Slightly acidic (5.6–6.5) | 90 | Light (11–20%) | 111 |
| Neutral (6.6–7.2) | 59 | Medium (21–35%) | 73 |
| Alkaline (≥7.3) | 26 | Heavy (≥36%) | 17 |
| All | 237 | All | 237 |
| Soils | Range of Fraction <0.02 mm (%) | Pearson Coefficient | Soils | Range of pH | Pearson Coefficient |
|---|---|---|---|---|---|
| Acidic | 4.3–37.0 | ns | Very light | 4.06–7.61 | ns |
| Slightly acidic | 5.0–39.3 | ns | Light | 4.06–7.57 | ns |
| Neutral | 2.6–37.0 | ns | Medium | 4.10–7.67 | ns |
| Alkaline | 3.6–37.2 | ns | Heavy | 4.10–7.57 | ns |
| All | 2.6–39.3 | ns | All | 4.06–7.67 | ns |
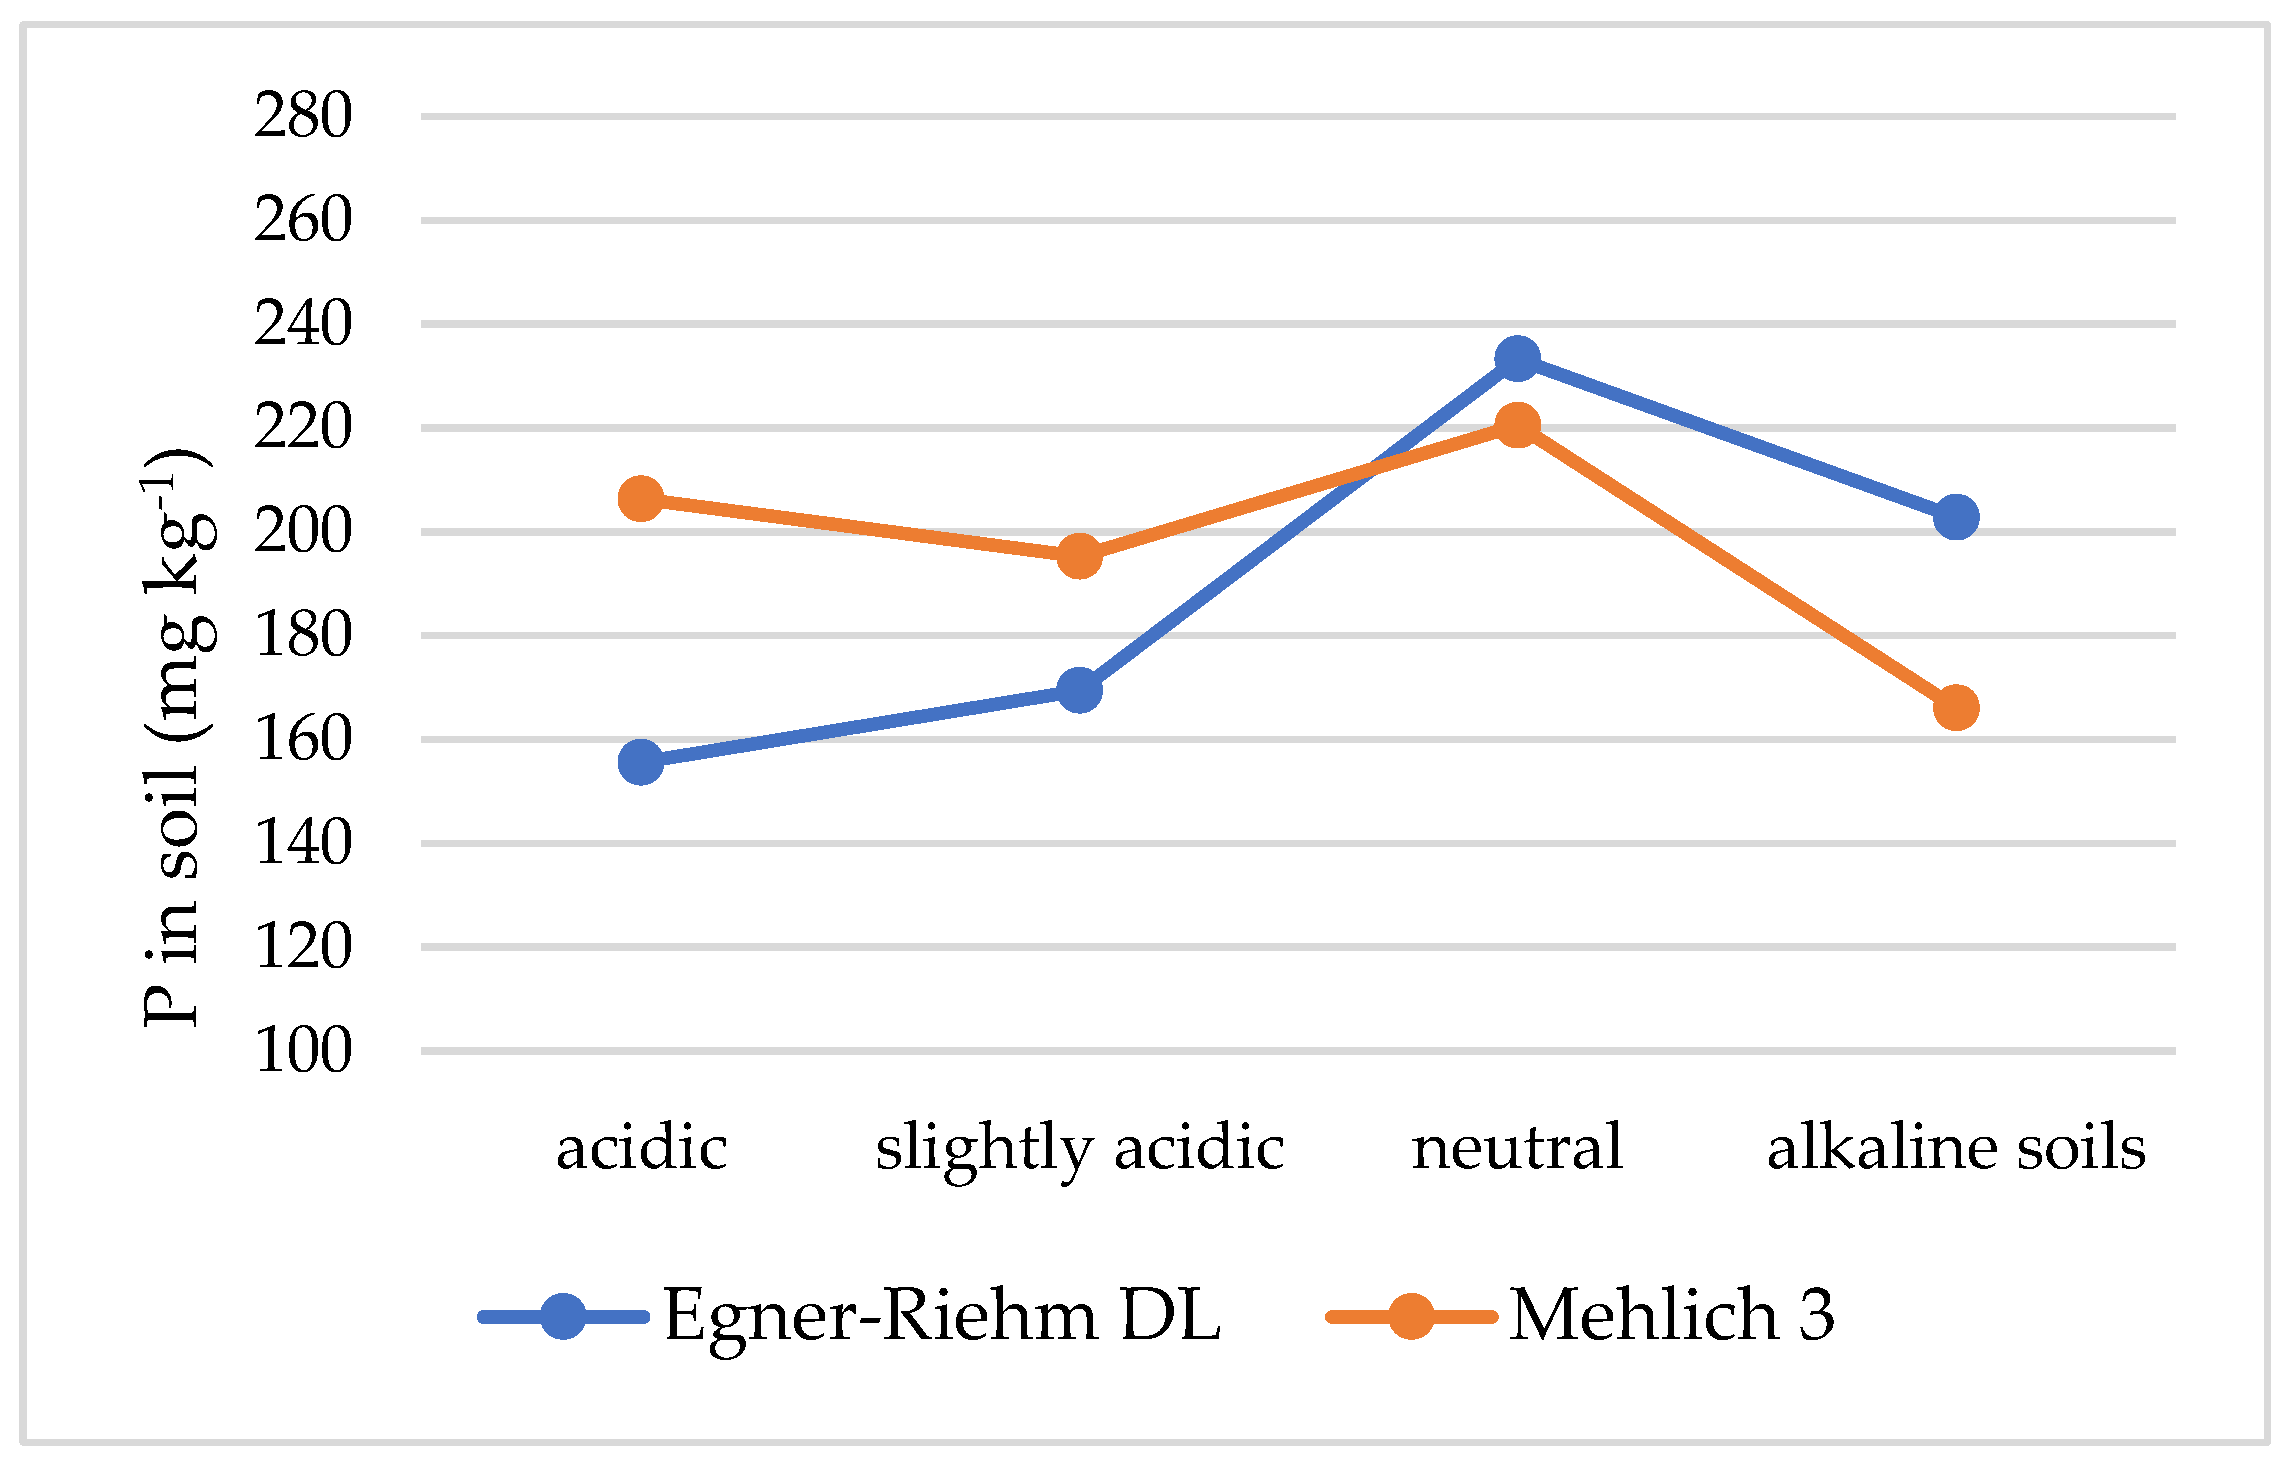
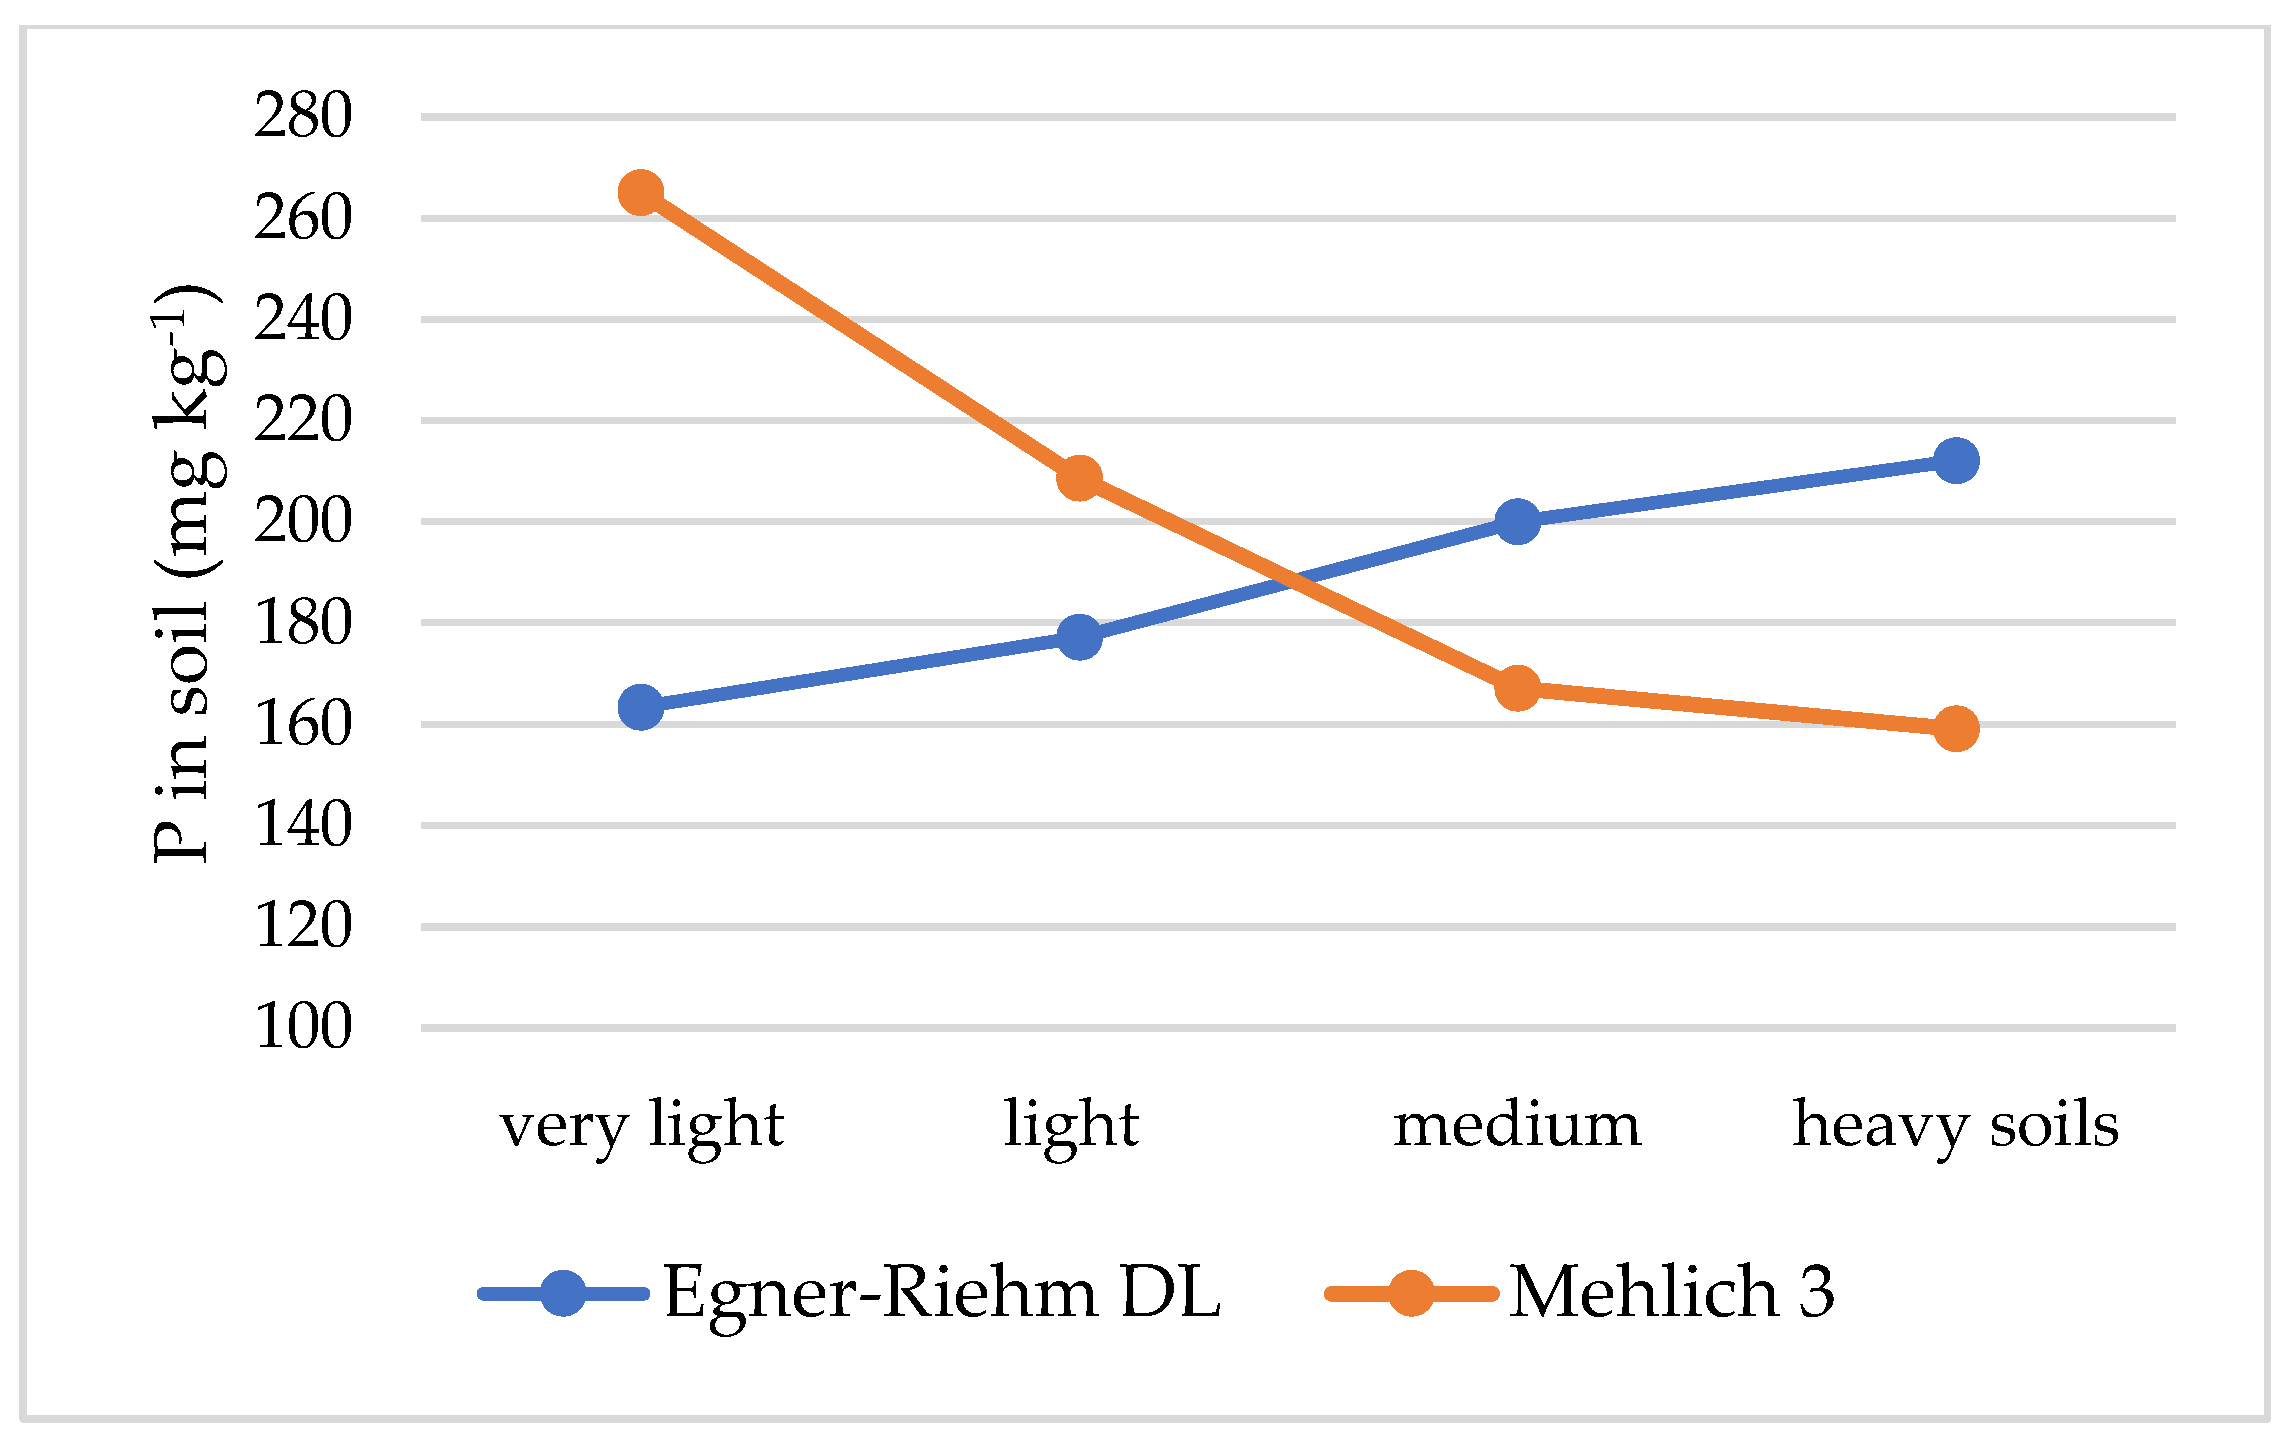
| Soils | PDL | PM3 | PDL-PM3 | PM3/PDL | Soils | PDL | PM3 | PDL-PM3 | PM3/PDL |
|---|---|---|---|---|---|---|---|---|---|
| mg kg−1 | mg kg−1 | ||||||||
| Acidic | 156 | 210 | −54 | 1.3 | Very light | 163 | 265 | −102 | 1.6 |
| Slightly acidic | 169 | 198 | −29 | 1.2 | Light | 177 | 209 | −32 | 1.2 |
| Neutral | 233 | 225 | 8 | 1.0 | Medium | 200 | 167 | 33 | 0.8 |
| Alkaline | 203 | 170 | 33 | 0.8 | Heavy | 222 | 165 | 57 | 0.7 |
| All | 190 | 201 | −11 | 0.9 | All | 190 | 201 | −11 | 0.9 |
| Soils | n | Coefficient | Soils | n | Coefficient |
|---|---|---|---|---|---|
| Acidic | 62 | 0.786 *** | Very light | 36 | 0.708 *** |
| Slightly acidic | 90 | 0.678 *** | Light | 111 | 0.692 *** |
| Neutral | 59 | 0.643 *** | Medium | 73 | 0.850 *** |
| Alkaline | 26 | 0.684 *** | Heavy | 17 | 0.568 *** |
| All | 237 | 0.664 *** | All | 237 | 0.664 *** |
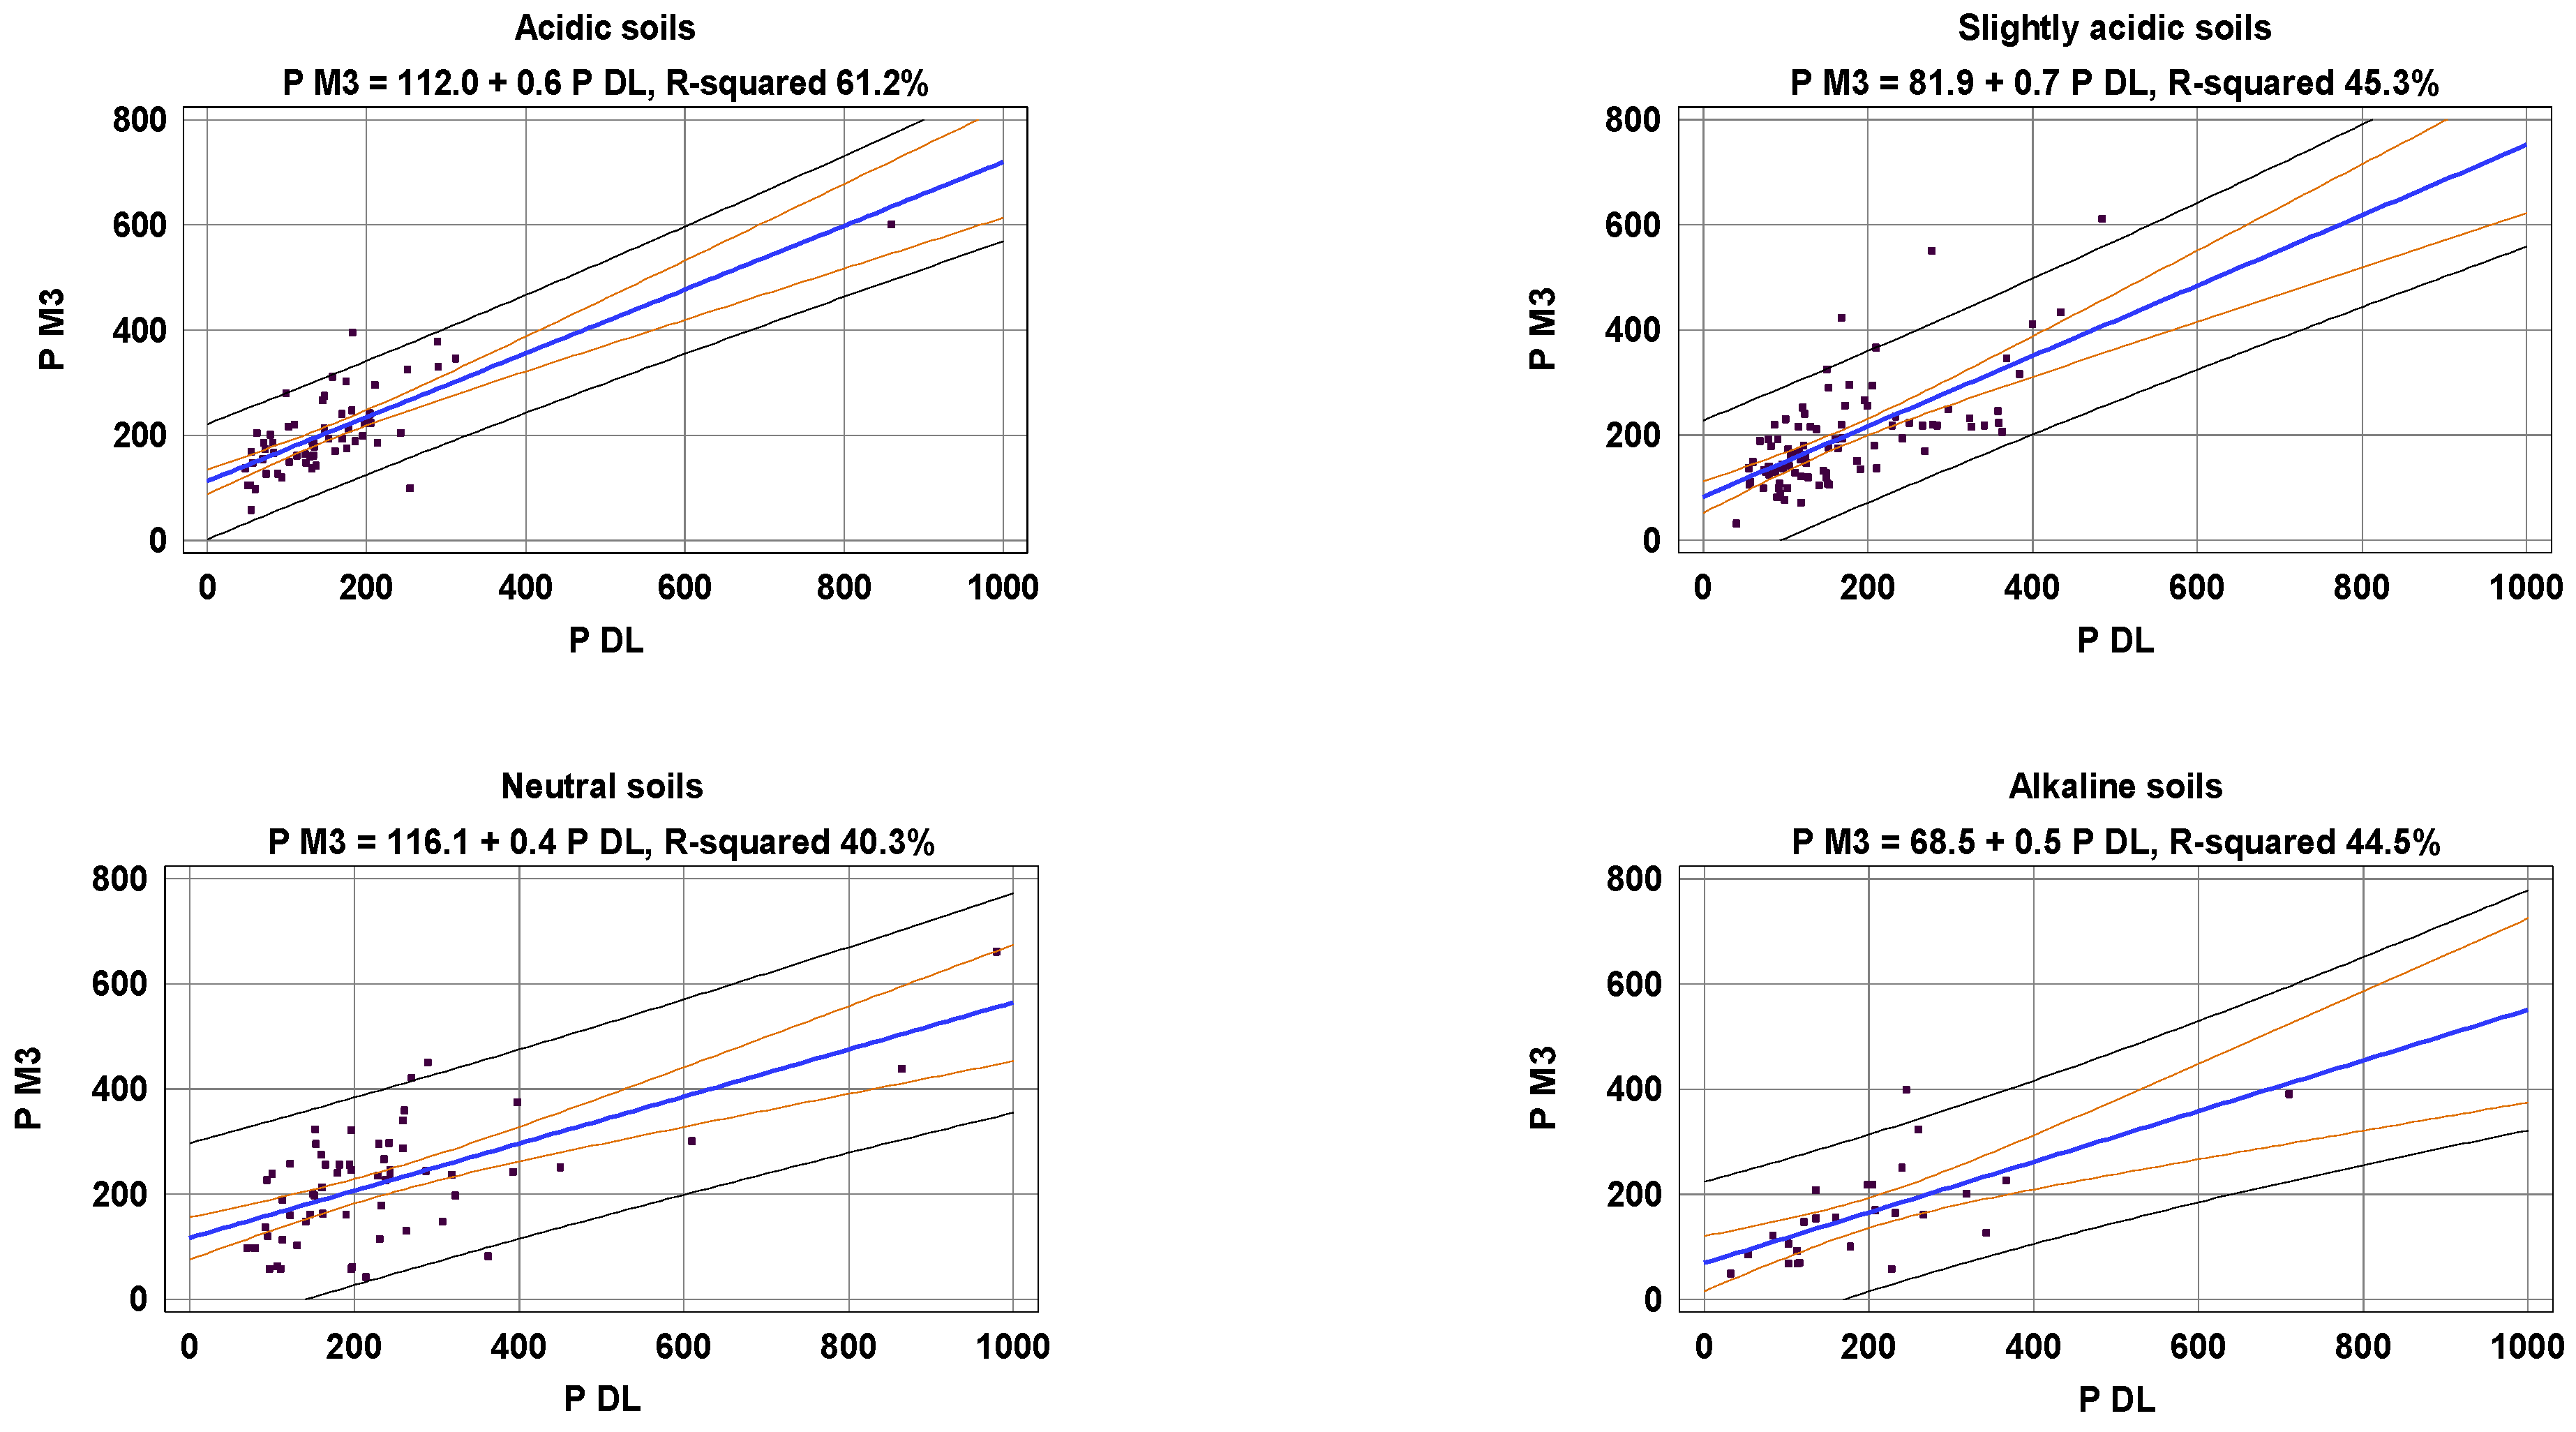
| Soils | n | Equation | R2 |
|---|---|---|---|
| Acidic | 62 | PM3 = 154.9 + 0.7 PDL − 2.8 Fr < 0.02 | 68.2 *** |
| Slightly acidic | 90 | PM3 = 181.3 + 0.7 PDL − 5.0 Fr < 0.02 | 66.3 *** |
| Neutral | 59 | PM3 = 223.8 + 0.5 PDL − 6.3 Fr < 0.02 | 61.6 *** |
| Alkaline | 26 | PM3 = 141.6 + 0.6 PDL − 4.4 Fr < 0.02 | 62.4 *** |
| All | 237 | PM3 = 291.6 + 0.6 PDL − 17.8 pH − 4.6 Fr < 0.02 | 66.4 *** |
| Soils | n | Equation | R2 |
|---|---|---|---|
| Very light | 36 | PM3 = 111.6 + 0.9 PDL | 48.6 *** |
| Light | 111 | PM3 = 209.4 + 0.5 PDL − 16.2 pH | 49.5 *** |
| Medium | 73 | PM3 = -30.9 + 0.5 PDL + 0.3 Fe | 77.9 *** |
| Heavy | 17 | PM3 = 24.2 + 0.3 PDL + 0.2 Fe | 40.1 ** |
| All | 237 | PM3 = 291.6 + 0.6 PDL − 17.8 pH − 4.6 Fr < 0.02 | 66.4 *** |
| Soils | PDL | PM3 | Soils | PDL | PM3 |
|---|---|---|---|---|---|
| Acidic | 0.30 * | 0.27 * | Very light | ns | ns |
| Slightly acidic | 0.22 * | ns | Light | 0.36 *** | 0.26 ** |
| Neutral | 0.32 * | ns | Medium | 0.25 * | ns |
| Alkaline | 0.58 ** | ns | Heavy | Ns | ns |
| All | 0.26 * | ns | All | 0.26 * | ns |
Disclaimer/Publisher’s Note: The statements, opinions and data contained in all publications are solely those of the individual author(s) and contributor(s) and not of MDPI and/or the editor(s). MDPI and/or the editor(s) disclaim responsibility for any injury to people or property resulting from any ideas, methods, instructions or products referred to in the content. |
© 2024 by the authors. Licensee MDPI, Basel, Switzerland. This article is an open access article distributed under the terms and conditions of the Creative Commons Attribution (CC BY) license (https://creativecommons.org/licenses/by/4.0/).
Share and Cite
Korzeniowska, J.; Stanislawska-Glubiak, E. Evaluation of the Egner–Riehm DL and Mehlich 3 Tests for the Determination of Phosphorus: The Influence of Soil Properties on Extraction Efficiency and Test Conversion. Agronomy 2024, 14, 2921. https://doi.org/10.3390/agronomy14122921
Korzeniowska J, Stanislawska-Glubiak E. Evaluation of the Egner–Riehm DL and Mehlich 3 Tests for the Determination of Phosphorus: The Influence of Soil Properties on Extraction Efficiency and Test Conversion. Agronomy. 2024; 14(12):2921. https://doi.org/10.3390/agronomy14122921
Chicago/Turabian StyleKorzeniowska, Jolanta, and Ewa Stanislawska-Glubiak. 2024. "Evaluation of the Egner–Riehm DL and Mehlich 3 Tests for the Determination of Phosphorus: The Influence of Soil Properties on Extraction Efficiency and Test Conversion" Agronomy 14, no. 12: 2921. https://doi.org/10.3390/agronomy14122921
APA StyleKorzeniowska, J., & Stanislawska-Glubiak, E. (2024). Evaluation of the Egner–Riehm DL and Mehlich 3 Tests for the Determination of Phosphorus: The Influence of Soil Properties on Extraction Efficiency and Test Conversion. Agronomy, 14(12), 2921. https://doi.org/10.3390/agronomy14122921