Article

Effects of Root Trace Nitrogen Reduction in Arid Areas on Sucrose–Starch Metabolism of Flag Leaves and Grains and Yield of Drip-Irrigated Spring Wheat

1
College of Agriculture, Shihezi University, Shihezi 832003, China
2
Agricultural Science Research Institute of the 12th Division of Xinjiang Production and Construction Corps, Urumqi 830088, China
*
Author to whom correspondence should be addressed.
These authors contributed equally to this work.
Agronomy 2024, 14(2), 312; https://doi.org/10.3390/agronomy14020312
Submission received: 29 December 2023 / Revised: 25 January 2024 / Accepted: 30 January 2024 / Published: 31 January 2024
(This article belongs to the Section Plant-Crop Biology and Biochemistry)

Abstract

:
To investigate the effect of nitrogen (N) application on the carbon metabolism and yield of flag leaves and grains of spring wheat under drip irrigation in Xinjiang, a split-zone design was adopted from 2020 to 2021, with strong-gluten wheat, Xinchun 37 (XC37), and medium-gluten wheat, Xinchun 6 (XC 6), as the main zones and different nitrogen application rates as the sub-zones. Four nitrogen application rates of 0, 210, 255, and 300 kg·ha−1 (CK2, B1, A1, and CK1, respectively) were set to analyze and compare the nitrogen response of key enzyme activity, soluble sugar, and sucrose and starch content in flag leaves and grains to control yield formation. The results showed that with the increase in nitrogen application, the activities of sucrose phosphate synthase (SPS) and sucrose synthase (SS) in flag leaves; the activities of SS, adenosine diphosphate glucose pyrophosphorylase (ADPG-PPase), soluble starch synthase (SSS), granule-bound starch synthase (GBSS), and starch branching enzyme (SBE) in grains; the contents of soluble sugar and sucrose in the flag leaves; and the yield, all first increased and then decreased. There is a significant difference between A1 (255 kg·ha−1) and the CK1 (300 kg·ha−1), B1 (210 kg·ha−1), and CK2 (0 kg·ha−1) treatments under the above indicators, with increases of 8–158%, 9–155%, 8–53%, 5–63%, 3–86%, 3–57%, 9–79%, 9–197%, and 9–113%, as well as higher levels of amylose, amylopectin, and total starch content than other treatments by 2–30%, 11–84%, and 8–63%, respectively. Correlation and stepwise regression analyses indicated highly a significant positive correlation between the yield and soluble sugar and sucrose of flag leaves and grains, as well as their key enzymes and starch. Among them, soluble sugar in grains, amylopectin, and sucrose in grains have the greatest impact on the yield of XC37, determining 85% of its yield. SSS, soluble sugars in grains, amylopectin, and SBE have the greatest impact on the yield of XC 6, determining 80% of its yield. The starch showed a highly significant positive correlation with ADPG-PPase, SSS, GBSS, and SBE. There was a significant interaction effect between the nitrogen application rate and variety, with better performance observed in Xinchun 37 compared to Xinchun 6. Under drip irrigation conditions in arid areas, a nitrogen application of 255 kg·ha−1 can effectively regulate the metabolism of sucrose to starch in the flag leaves and grains of spring wheat, which is conducive to the accumulation of starch in grains and the formation of yield.

1. Introduction

Wheat is the largest grain crop in the arid region of Xinjiang, China, and its production capacity is of great significance for ensuring regional food security [1]. Reasonable nitrogen application in Xinjiang can greatly enhance the yield and quality of wheat, while also mitigating environmental pollution caused by soil nitrogen loss and promoting efficient and sustainable wheat production in the region [2,3]. However, Xinjiang’s wheat production has historically focused on achieving high nitrogen levels and high yields. The continuous and excessive use of nitrogen fertilizer not only escalates planting costs but also leads to environmental pollution. The excessive application of nitrogen fertilizer remains a prominent factor that hampers the high yield and efficiency of Xinjiang’s wheat [4]. Therefore, exploring suitable nitrogen application rates and achieving synchronization between nitrogen fertilizer supply and demand has become the key to efficient wheat production in arid areas of Xinjiang.
Carbon metabolism is a metabolic pathway closely related to carbohydrate synthesis in crops, including the synthesis and transformation of sucrose and starch [5]. Sucrose is the primary form of carbohydrate storage and transportation in higher plants, and it plays a critical role in regulating plant carbon metabolism [6]. The balance and coordination of sucrose synthesis and degradation rely on the synergistic effect of two enzymes: sucrose phosphate synthase (SPS) and sucrose synthase (SS). The activity of these enzymes reflects the flag leaves’ capacity to convert photosynthetic products into sucrose [7]. SPS is a key enzyme in the regulation of sucrose synthesis, and the sucrose content in flag leaves is significantly positively correlated with SPS activity [8]. Different nitrogen fertilizer management methods have a significant regulatory effect on sucrose metabolism. Decreasing the amount of nitrogen applied can significantly reduce the activity of SPS in flag leaves, slowing down the conversion of carbohydrates to sucrose and resulting in a decrease in sucrose content [9]. Excessive nitrogen fertilizer application can inhibit the activity of SPS and SS in flag leaves, as well as the activity of soluble starch synthase (SSS) in grains. This inhibition is unfavorable for sucrose synthesis in flag leaves and starch synthesis in grains, ultimately leading to a decrease in yield [10]. The high activity of SPS in flag leaves and SS in grains indicates that the source end has a strong ability to continuously supply assimilates, while the sink end has high activity.
Starch is the primary ingredient in wheat grains, and the amount of sucrose available and its capacity to be turned into starch are what determine how much starch accumulates. The key enzymes that regulate starch synthesis are SS, SSS, adenosine diphosphate glucose pyrophosphorylase (ADPG-PPase), granule-bound starch synthase (GBSS), and starch branching enzyme (SBE) [11]. In the process of starch synthesis, there is a significant correlation between the accumulation rate of amylose, amylopectin, and total starch in grains and the activities of SBE, SSS, and GBSS. The activity of SS in flag leaves and grains shows a highly significant positive correlation with the accumulation rate of grain starch. The starch content and the ratio of amylose to amylopectin have a significant impact on the yield and quality of grains [12,13]. Yang et al. [14] found in their study on changes in the activity of key enzymes involved in starch synthesis that GBSS, SSS, ADPG-PPase, and SBE activities all increased with increasing nitrogen application at a nitrogen application rate of 0–200 kg·ha−1. Xin et al. [15] believe that, compared to non-nitrogen treatment, the soluble sugar content, GBSS, SSS, ADPG-PPase, and SBE activities in winter wheat grains significantly increased after nitrogen application, leading to an increase in starch content, thereby increasing the starch yield. Further research has revealed that a declining nitrogen application rate has a positive impact on the activities of ADPG-PPase, SSS, and GBSS in carbon metabolism, while excessive nitrogen application hinders starch formation, ultimately affecting grain weight [16]. However, the research results regarding the influence of starch content have been inconsistent. Some studies have demonstrated that increasing the application rate of nitrogen fertilizer within the range of 0–240 kg·ha−1 can enhance the content of grain starch and its components [17,18], while in the range of 270–300 kg·ha−1, it can lead to a decrease in starch and amylose content [19], although the effect on amylopectin content varies [20,21]. Since different wheat regions have varied effective nitrogen fertilizer utilization patterns, more research is required to understand the nitrogen response mechanism of starch accumulation and yield production in wheat under drip irrigation in arid areas of Xinjiang.
Drip irrigation technology, which integrates water and fertilizer, intelligent field management, and reduces labor and input costs, has become the main cultivation technology for wheat production in Xinjiang [22]. The regulatory mechanism of reducing nitrogen application under drip irrigation on the sucrose degradation and starch synthesis pathways in flag leaves and grains remains unclear. Additionally, the regulatory mechanism of how to avoid a significant inhibition of wheat carbon metabolism enzymes, while also timely and moderately promoting the transport of assimilates to grains and increasing yield, is still unknown. These are all topics that need further exploration. This study investigates the carbon metabolism characteristics of the flag leaves and grains of drip-irrigated spring wheat based on existing production technology. The objective is to address the following issues: (i) analyzing changes in the key enzyme activities in the sucrose starch metabolism pathway of flag leaves and grains and their relationship with starch accumulation, revealing the enzymatic mechanism of starch accumulation in drip-irrigated spring wheat grains; (ii) clarifying the relationship between grain starch and the component content, yield formation, and nitrogen application rate; and (iii) exploring possible ways to synergistically improve yield and nitrogen fertilizer utilization efficiency, proposing suitable nitrogen fertilizer application models for drip-irrigated spring wheat in arid areas, and providing a scientific basis for the nitrogen-efficient and green production of drip-irrigated spring wheat in Xinjiang.

2. Materials and Methods

2.1. Experimental Site

The experiment was carried out at the Experimental Station of the Agricultural College of Shihezi University (85°59′ E, 44°18′ N) from April to July in 2020 and 2021. The average temperature in Shihezi ranges from around 7.5 to 8.2 °C, with the highest temperature occurring in June, reaching up to 39 °C. The precipitation is 208 mm and the evaporation is 1660 mm, belonging to a typical continental climate. The variations in meteorological indicators during wheat growth are depicted in Figure 1. The soil type tested is irrigated gray desert soil, and the fundamental characteristics of the 0–40 cm soil are shown in Table 1.

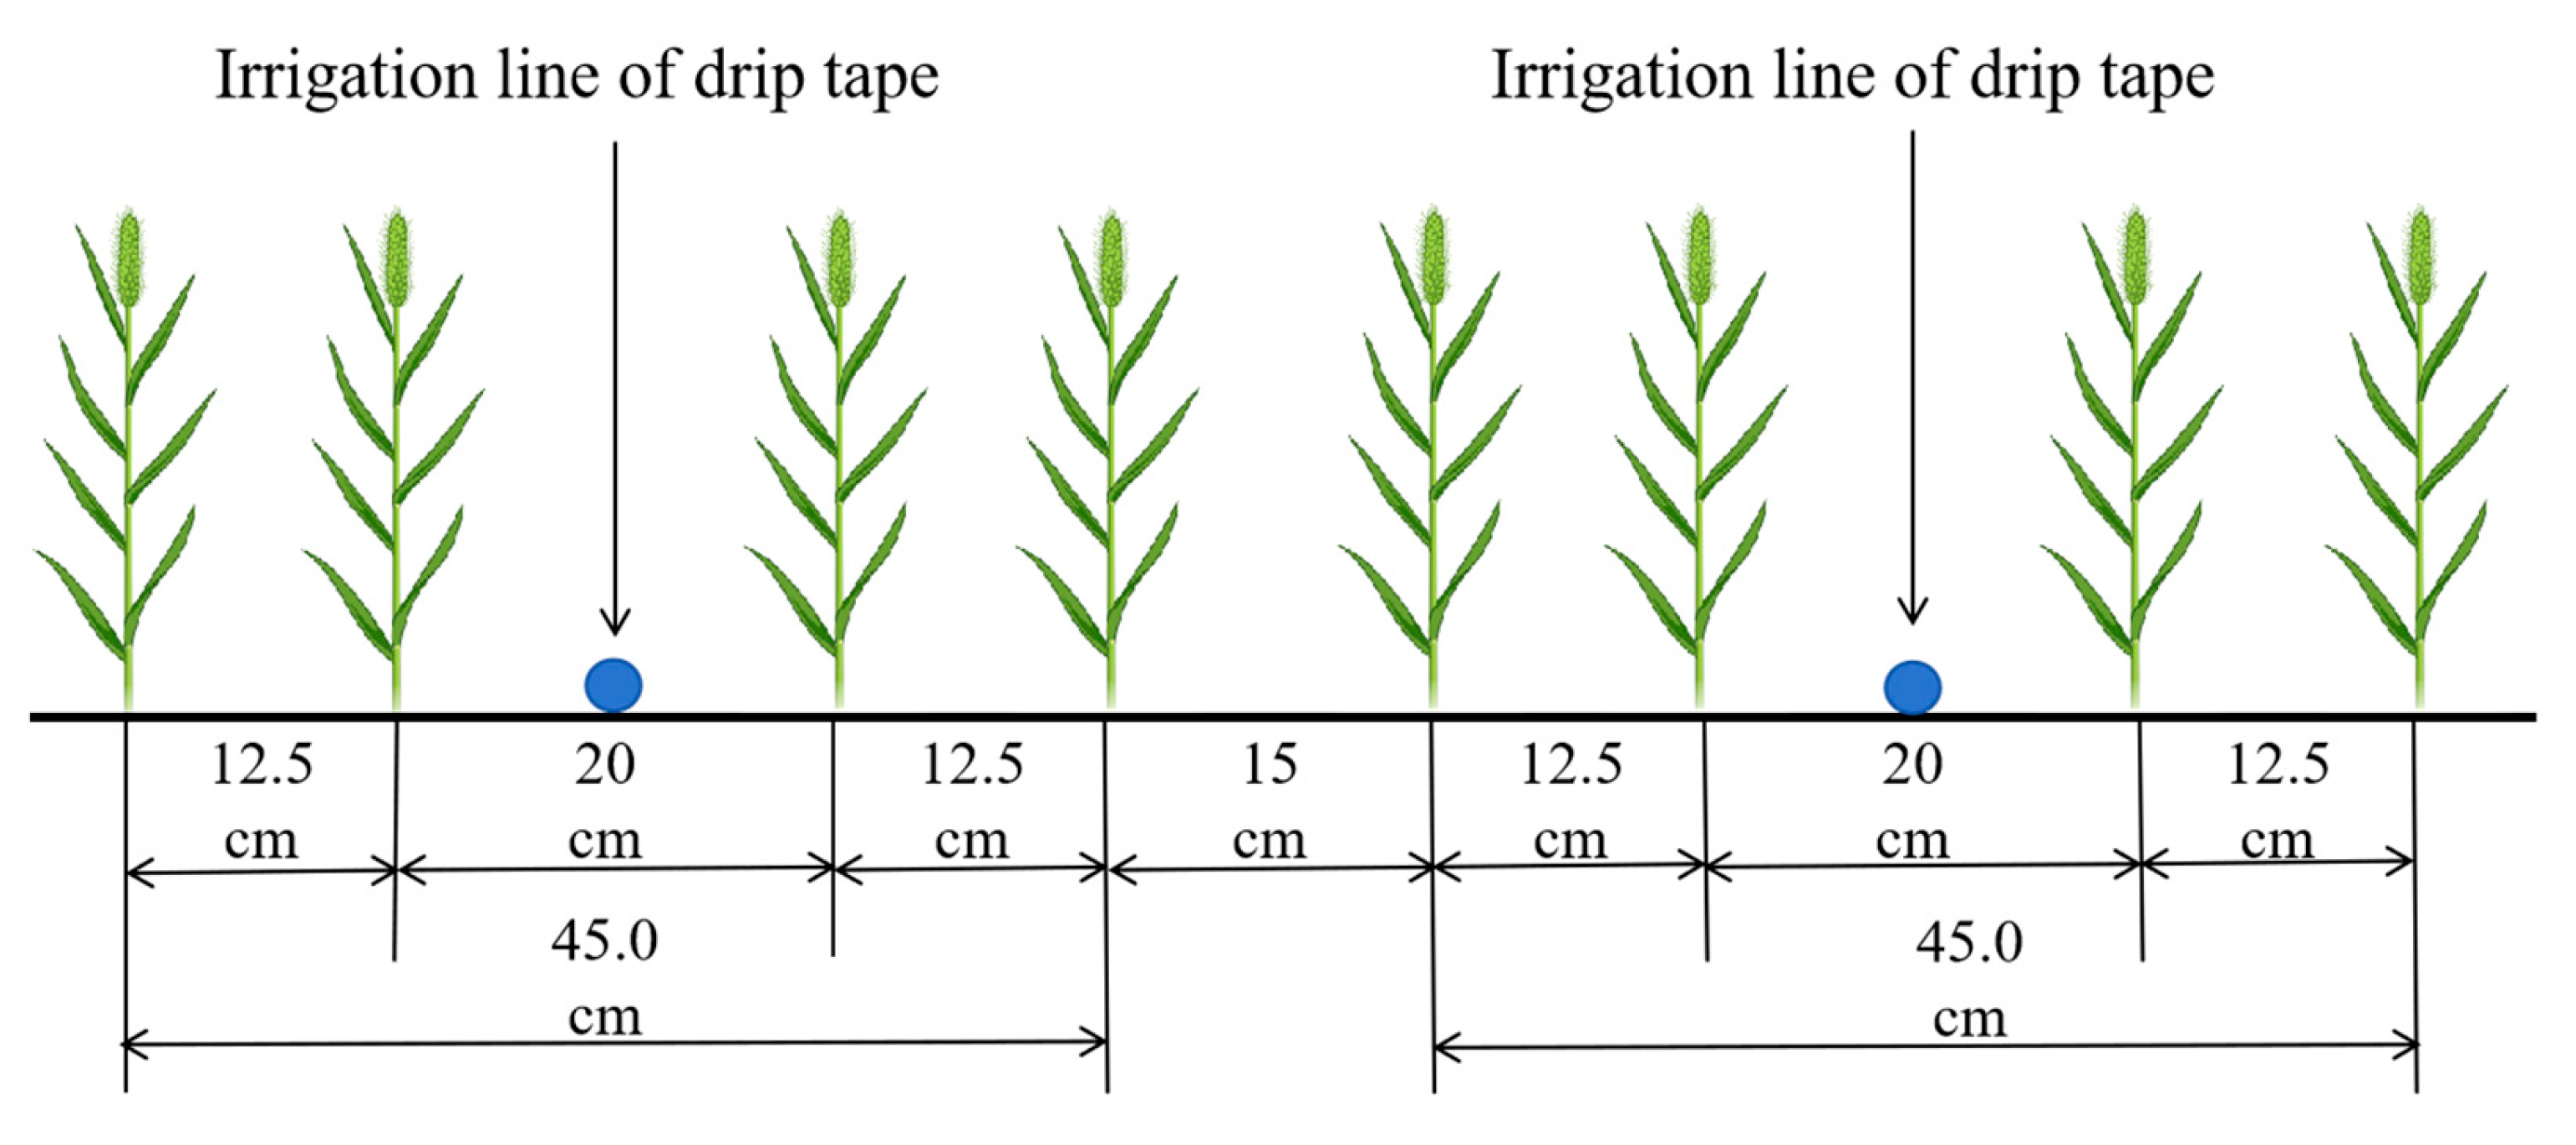
2.2. Experimental Design

The experiment adopted a split-zone design, with the variety as the main zone. Two spring wheat (Triticum aestivum L.) varieties were used as the experimental materials. Xinchun 37 (XC37, protein content: 16.3%) was a strong-gluten wheat, while Xinchun 6 was a medium-gluten wheat (XC 6, protein content: 13.5%). Nitrogen was used in sub-zones, with four different nitrogen application rates set up, as shown in Table 2. Each treatment was repeated 3 times, with a planting area of 12 m2 (3 m × 4 m) in the community; a 100 cm depth anti-seepage film was buried between each residential area to prevent fertilizer migration. Before sowing, 120 kg·ha−1 of P2O5 (superphosphate) was plowed into the soil as a base fertilizer. The nitrogen fertilizer used during the growth period was urea (N = 46%). A total of 9 irrigations were conducted throughout the entire growth period, with a total irrigation amount of 6000 m3/hm2. The irrigation amount at each stage was precisely controlled by the water meter. Seeds were sown on 1 April 2020 and 4 April 2021, and the sowing amount was 345 kg·ha−1. The planting mode was wide and narrow rows, with a “one tube four rows” approach, and a row spacing of 12.5 + 20 + 12.5 + 15 cm (Figure 2). Drip irrigation tape was placed in a 20 cm wide row, with a pipe diameter of 16 mm, a spacing of 30 cm between the drip heads, and a flow rate of 2.6 L·h−1. Wheat was harvested on 4 July 2020 and 7 July 2021. The other field management practices were similar to local field production.

2.3. Measurement Items and Methods

2.3.1. Sample Collection

Samples of XC37 and XC 6 from each treatment were collected randomly (1 m × 1 m) at 7-day intervals after the flowering stage. The samples were divided into two parts: one part of the flag leaves and grains were blanched at 105 °C and dried at 70 °C for dry sample determination, while the other part was stored in a −80 °C super-cold refrigerator to determine the activity of key enzymes in the sucrose–starch metabolism pathway.

2.3.2. Determination of Key Enzyme Activities in Carbon Metabolism of Flag Leaves and Grains

Sucrose synthase (SS) activity and adenosine diphosphate glucose pyrophosphorylase (ADPG-PPase) activity were determined following the method of Douglas et al. [23]: Collect 5–10 wheat grains and measure their weight. Add 10 mL of Hepes NaOH buffer with a pH of 7.5; grind the grains in an ice bath. Take 30 μL of the resulting homogenate and add 1.8 mL of Hepes NaOH buffer. Freeze–centrifuge the mixture at 1000× g for 3 min. Use the supernatant obtained from the centrifugation to determine the activity of SS and ADPG-PPase.
Sucrose phosphate synthase (SPS) activity was determined according to the method of Keller et al. [24]: Add 10 mL of Hepes NaOH buffer with pH 7.5 to 1 g of the sample. Grind the mixture in an ice bath; freeze and centrifuge the mixture for 10 min at 10,000× g. Add 50 μL of the enzyme solution, 50 μL of Hepes NaOH buffer, 20 μL of 50 mmol·L−1 MgCl2, 20 μL of 100 mmol·L−1 UDPG, and 20 μL of 100 mmol·L−1 fructose 6-phosphate. Allow the reaction to proceed for 30 min. Terminate the reaction by adding 200 μL of 2 mol·L−1 NaOH; add 1.5 mL of concentrated hydrochloric acid and 0.5 mL of 1% resorcinol. Determine the content.
Granule-bound starch synthase (GBSS) activity, soluble starch synthase (SSS) activity, and starch branching enzyme (SBE) activity were determined referring to the method of Nakamura [25].

2.3.3. Determination of Soluble Sugar and Sucrose Content in Flag Leaves and Grains, Starch and Component Content in Grains

Soluble sugar content and sucrose content were determined referring to the method of Vila et al. [26]: Weigh 0.1 g of the sample. Add 8 mL of 80% ethanol and mix well in a 10 mL centrifuge tube. Add to a water bath at 80 °C for 30 min and centrifuge at 3000× g for 10 min. Take out the supernatant, repeat the extraction three times, and bring to a volume of 25 mL of extraction solution for the determination of soluble sugar and sucrose content.
Amylose, amylopectin, and total starch content were determined referring to the method of Jin et al. [27]. The main wavelength for measuring the content of amylose is 620 nm, and the reference wavelength is 430 nm; the main wavelength for measuring the content of branched starch is 540 nm, and the reference wavelength is 720 nm; and the total starch content is the sum of the amylose and amylopectin contents.

2.3.4. Yield Measurement

Randomly select 1 square meter of sample for each treatment during the wheat maturity period, harvest all plants and naturally air dry them, weigh the grain weight, and calculate the yield.
Simultaneously measure the number of wheat ears in a 1 m2 plot, randomly select 20 plants from them, and use them to measure the number of grains per ear and the thousand-grain weight. Repeat this process three times.

2.4. Data Analysis

We used SPSS 26.0 (SPSS Inc., Chicago, IL, USA) to analyze the data. A one-way analysis of variance (ANOVA) and subsequent Duncan’s multiple range tests at the 0.05 significance level were used to determine differences in the indicators of the same wheat variety at the same stage in different N treatments. Images were plotted using OriginLab 2021 (Northampton, MA, USA).

3. Results

3.1. Effect of Nitrogen Supply on Carbon Metabolism in Flag Leaves of Spring Wheat

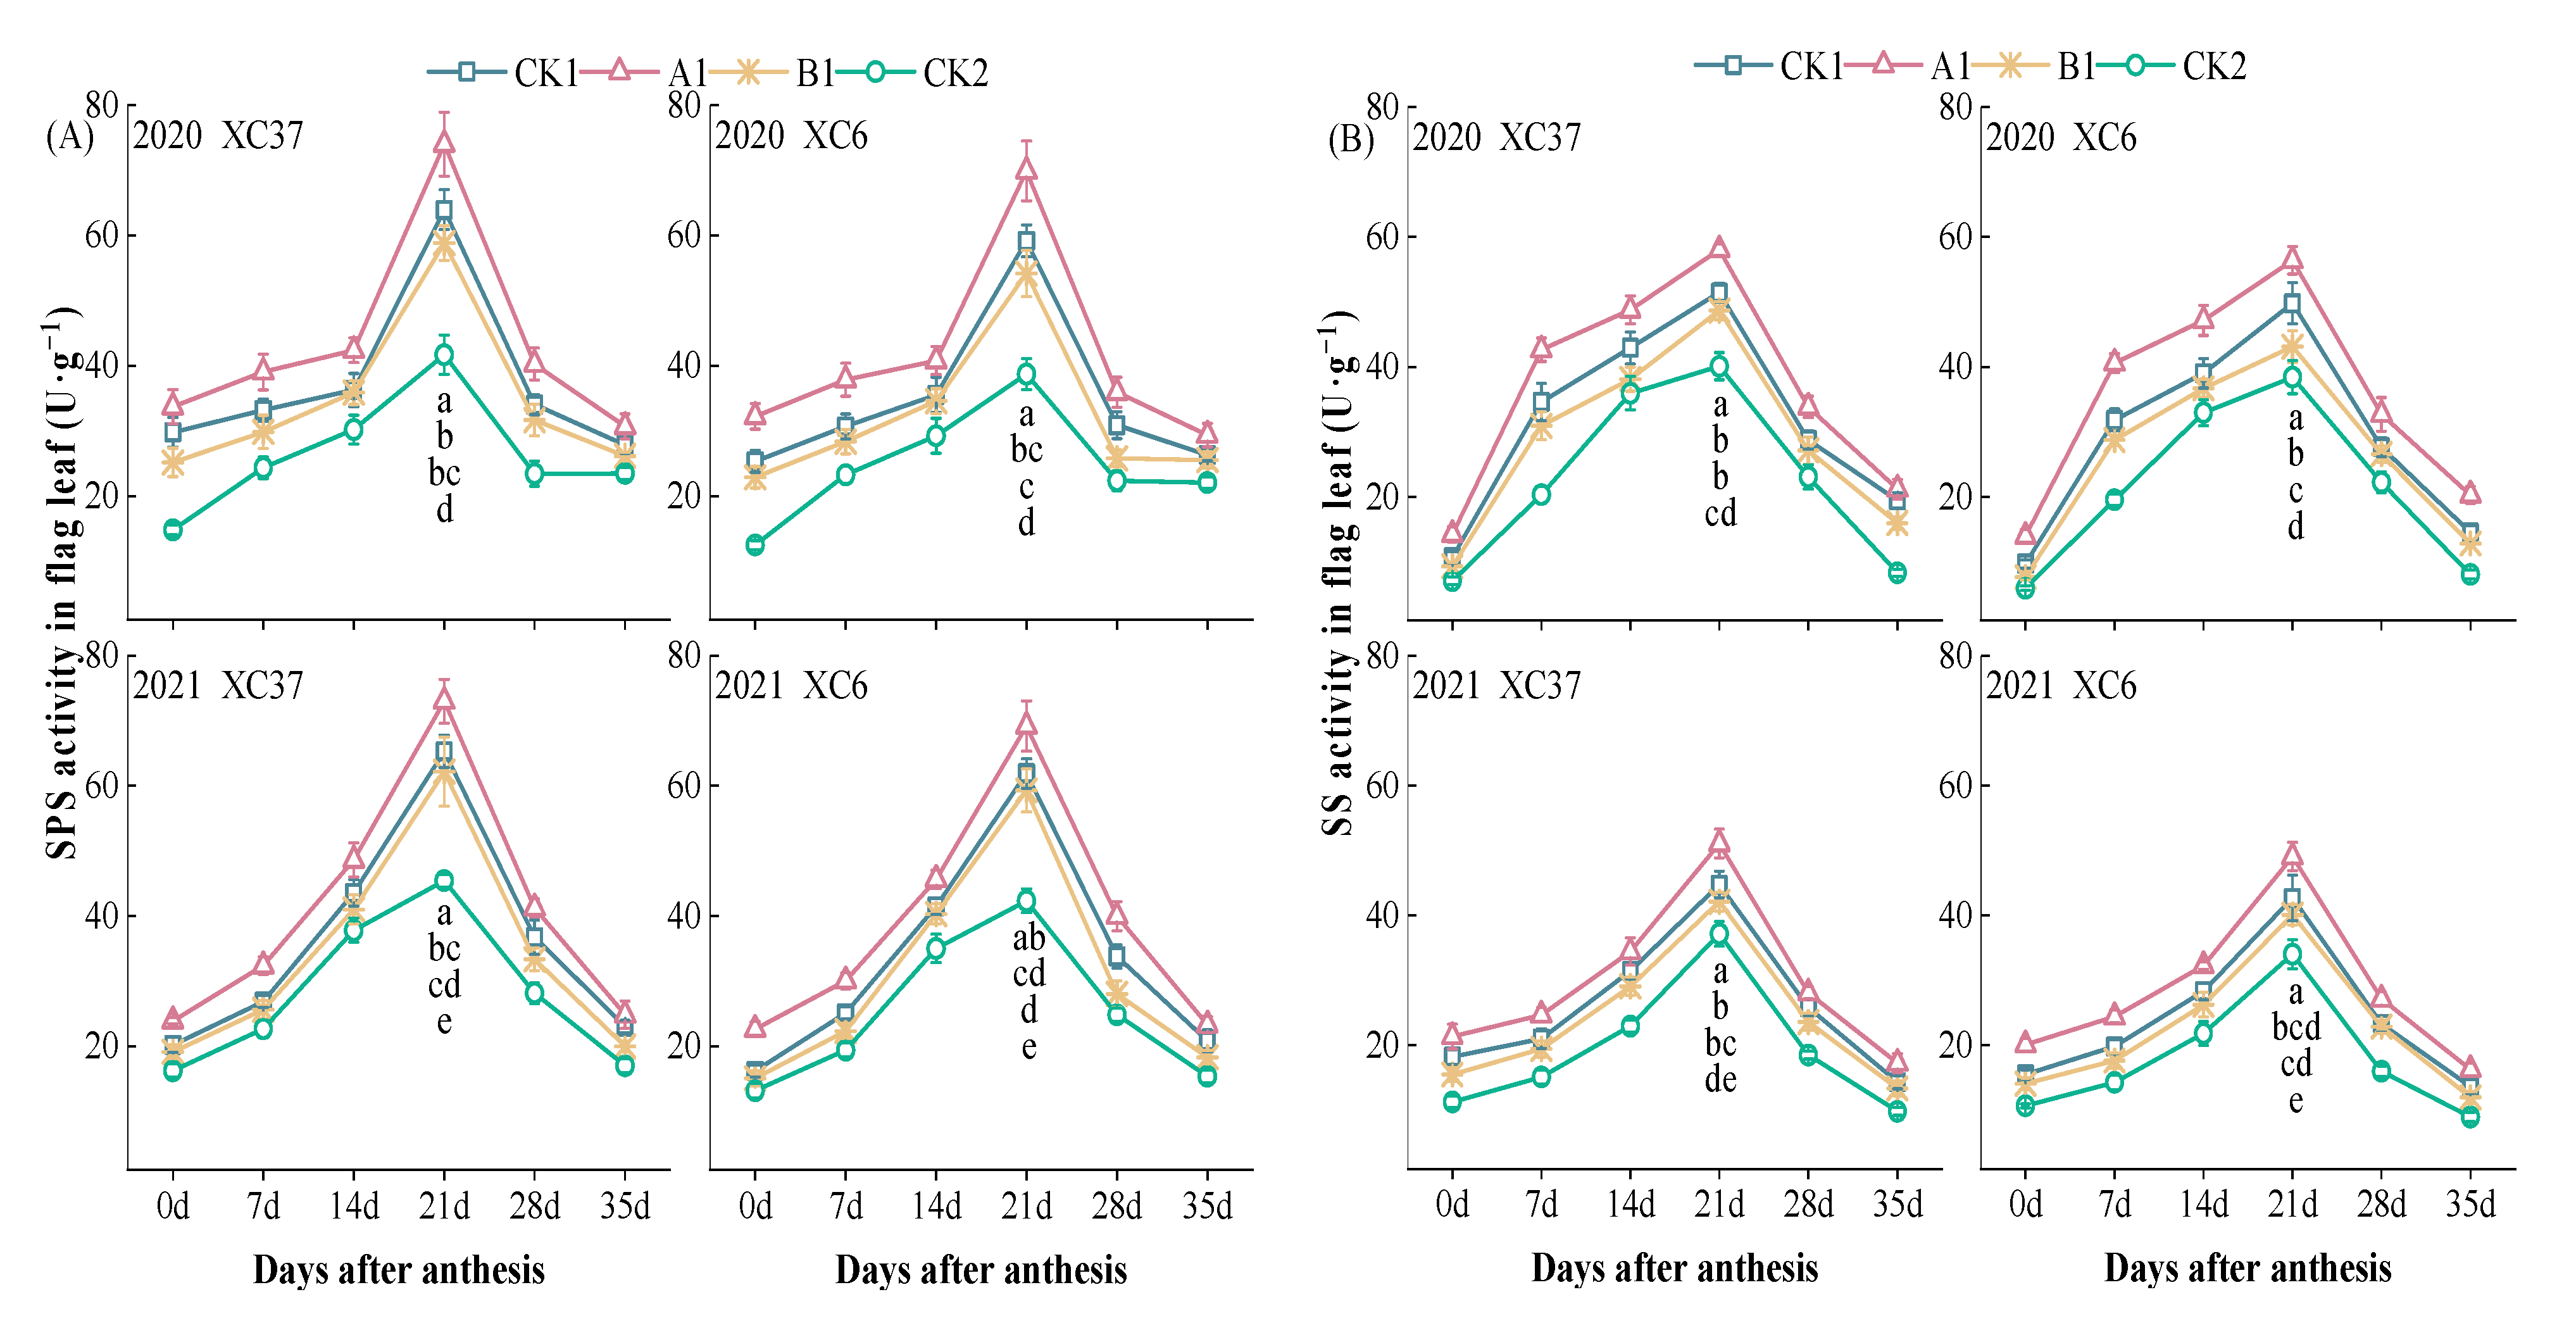
3.1.1. Changes in the Activity of Key Enzymes Involved in Sucrose Metabolism in Flag Leaves

The changes in the SPS and SS activities in the flag leaves after flowering under the nitrogen reduction mode were basically consistent, reaching their peak at 21 days after flowering (Figure 3). The SPS activity in the flag leaves under the A1 treatment was significantly higher than the CK1, B1, and CK2 treatments by 12–18%, 17–29%, and 61–81% at 21 days after flowering, and the decrease from 21 days to 28 days after flowering (38–53%) was greater than the decrease from 28 days to 35 days after flowering (1–42%). Throughout the entire reproductive period, the SPS activity in the flag leaves of XC37 was 2–27% higher than that of XC 6. At 21 days after flowering, the SS activity in the flag leaves under the A1 treatment was significantly higher than the CK1, B1, and CK2 treatments by 13–15%, 19–31%, and 37–47%. In the milky maturity stage, the average decrease in SPS activity (52–66%) was smaller than the average decrease in SS activity (68–71%). Under the A1 treatment, the SS activity was higher by 1–7% in XC37 than in XC 6.

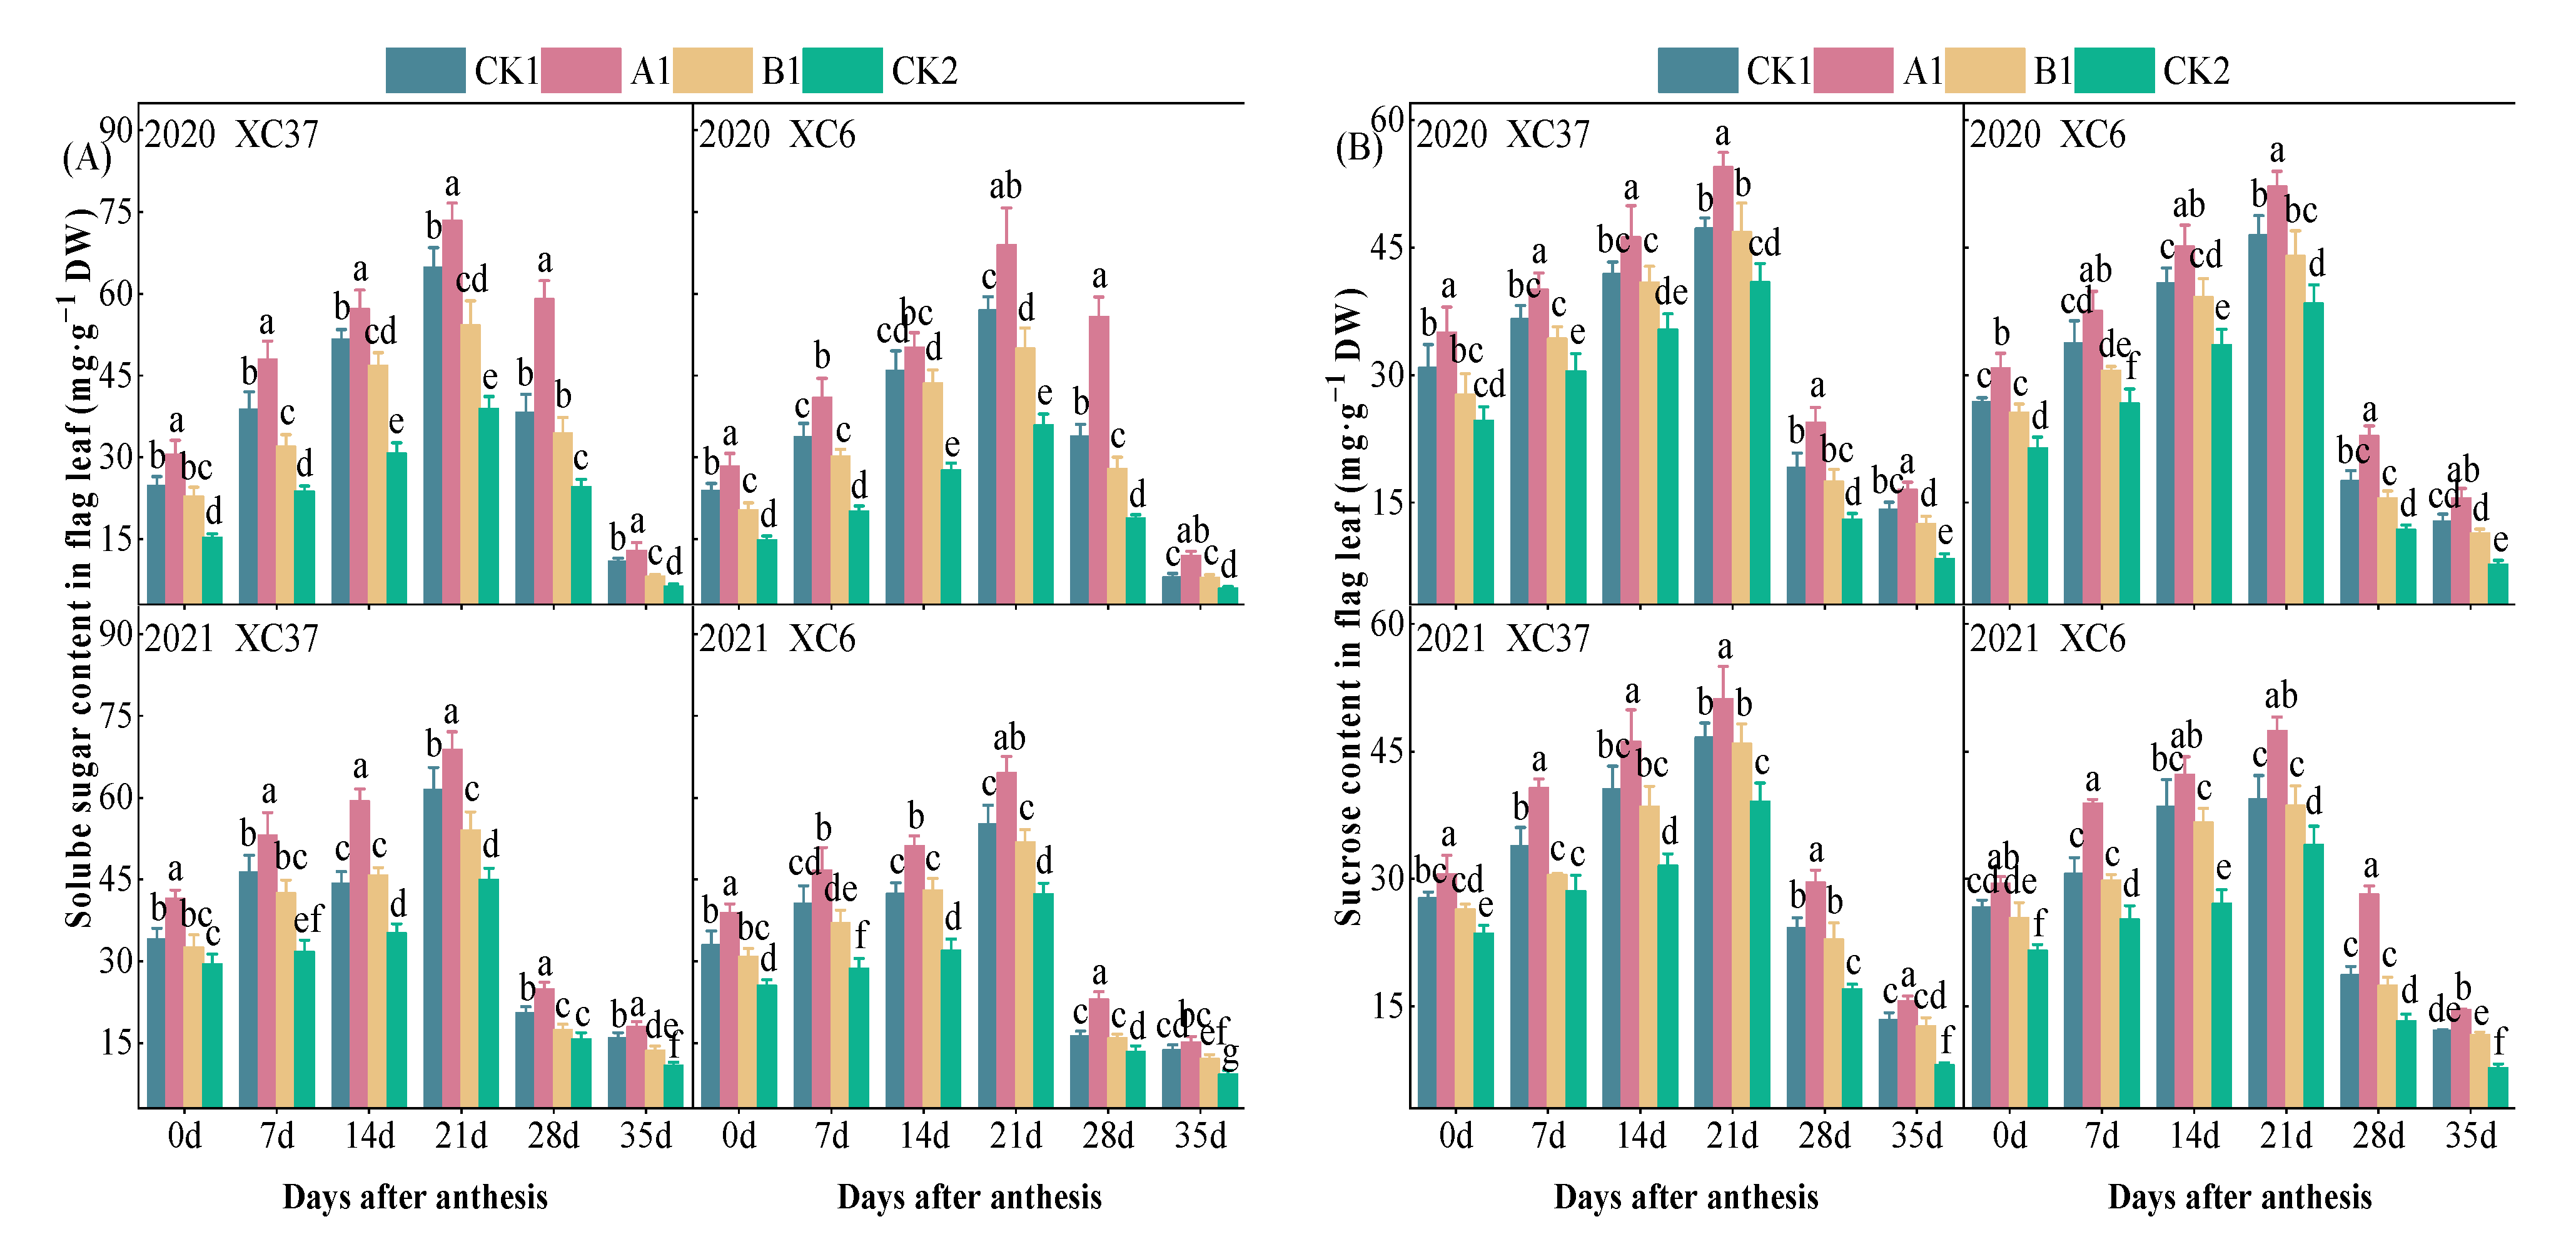
3.1.2. Changes in Soluble Sugar and Sucrose Content in Flag Leaves

As shown in Figure 4, the soluble sugar and sucrose content of the flag leaves of both varieties showed an inverted “V-shaped” trend with the number of days after flowering, reaching a peak at 21 days after flowering. From flowering to 21 days after flowering, the soluble sugar content of XC37 and XC 6 increased by 14–43 mg·g−1 DW and 17–41 mg·g−1 DW, respectively. From 21 days after anthesis to maturity, the soluble sugar content decreased by 33~61 mg·g−1 DW and 19–57 mg·g−1 DW, respectively, indicating that the flag leaves of XC37 accumulated soluble sugar faster and decomposed faster. The content of soluble sugar in the same growth period was as follows: A1 > CK1 > B1 > CK2. A1 differed significantly from the other treatments, with A1 being 12–21%, 25–38%, and 53–92% higher than the other treatments at 21 days after anthesis, and XC37 being 6–7% higher than XC 6. From flowering to 21 days after flowering, the sucrose content in the flag leaves of XC37 and XC 6 increased by 15–21 mg·g−1 DW and 12–21 mg·g−1 DW, respectively. From 21 days after flowering to maturity, the sucrose content in the flag leaves decreased by 31–38 mg·g−1 DW and 26–37 mg·g−1 DW, respectively. This indicates that the decomposition rate of sucrose content in the flag leaves of XC37 was higher than that of XC 6. At 21 days after flowering, the sucrose content in the A1 treatment was 10–20%, 12–23%, and 31–40% higher than the other treatments, and XC37 was 4–8% higher than XC 6.

3.2. Effect of Nitrogen Supply on Carbon Metabolism in Grains of Spring Wheat

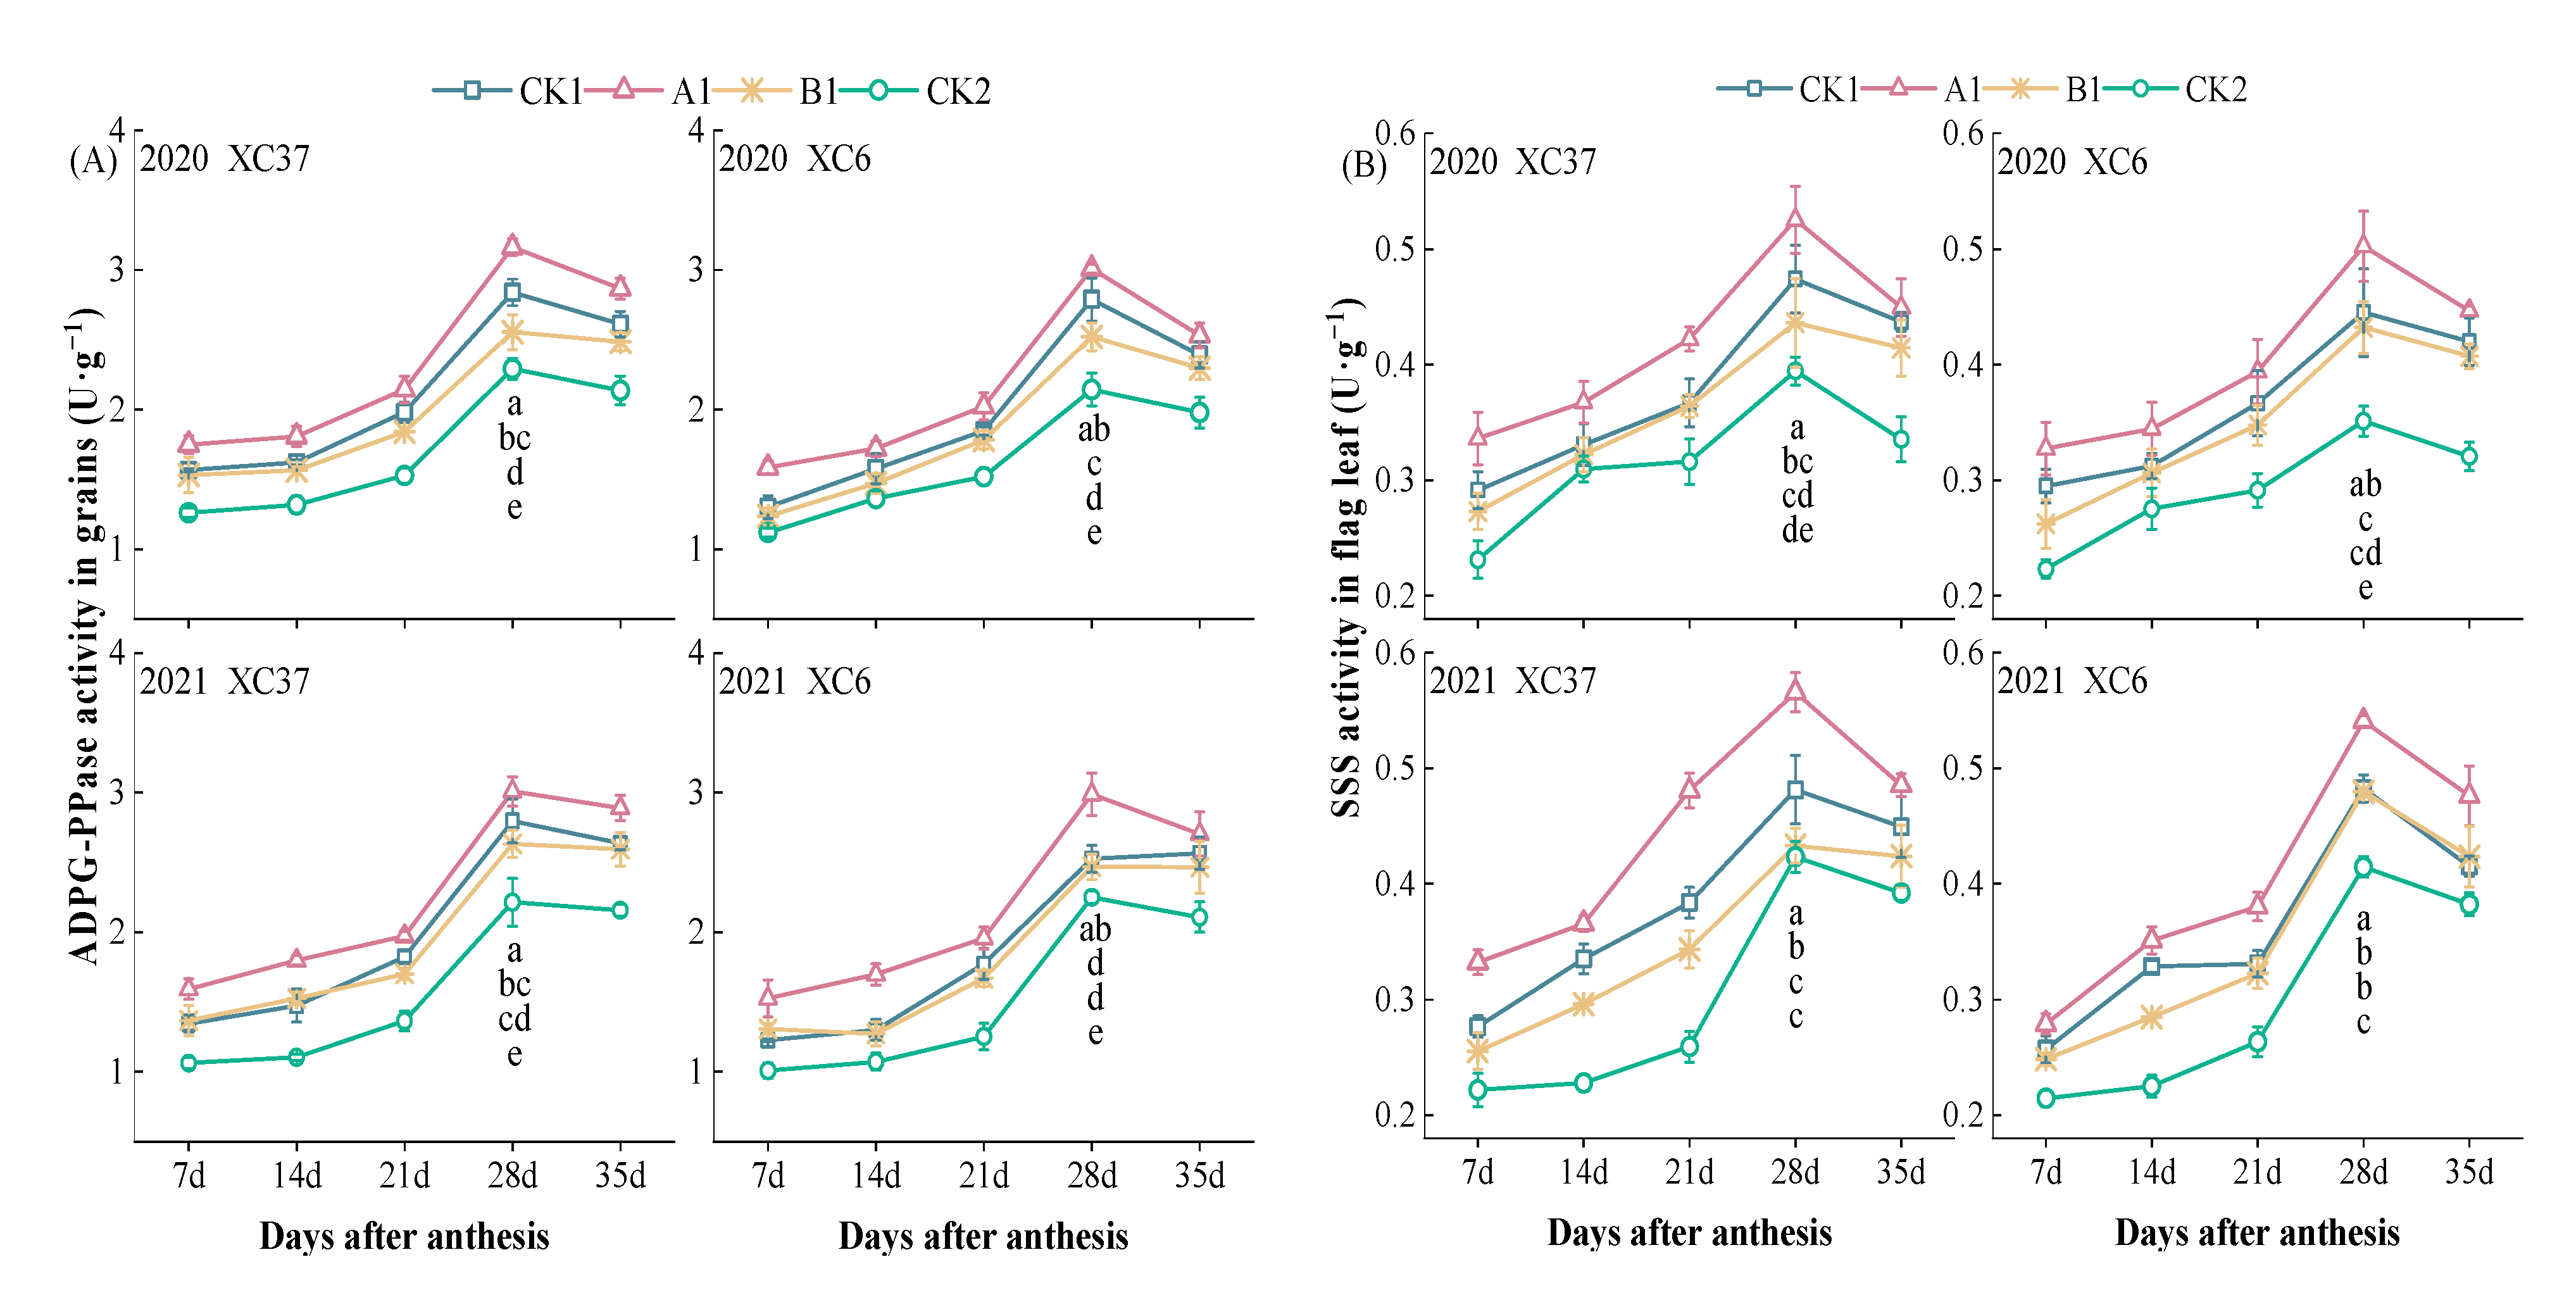
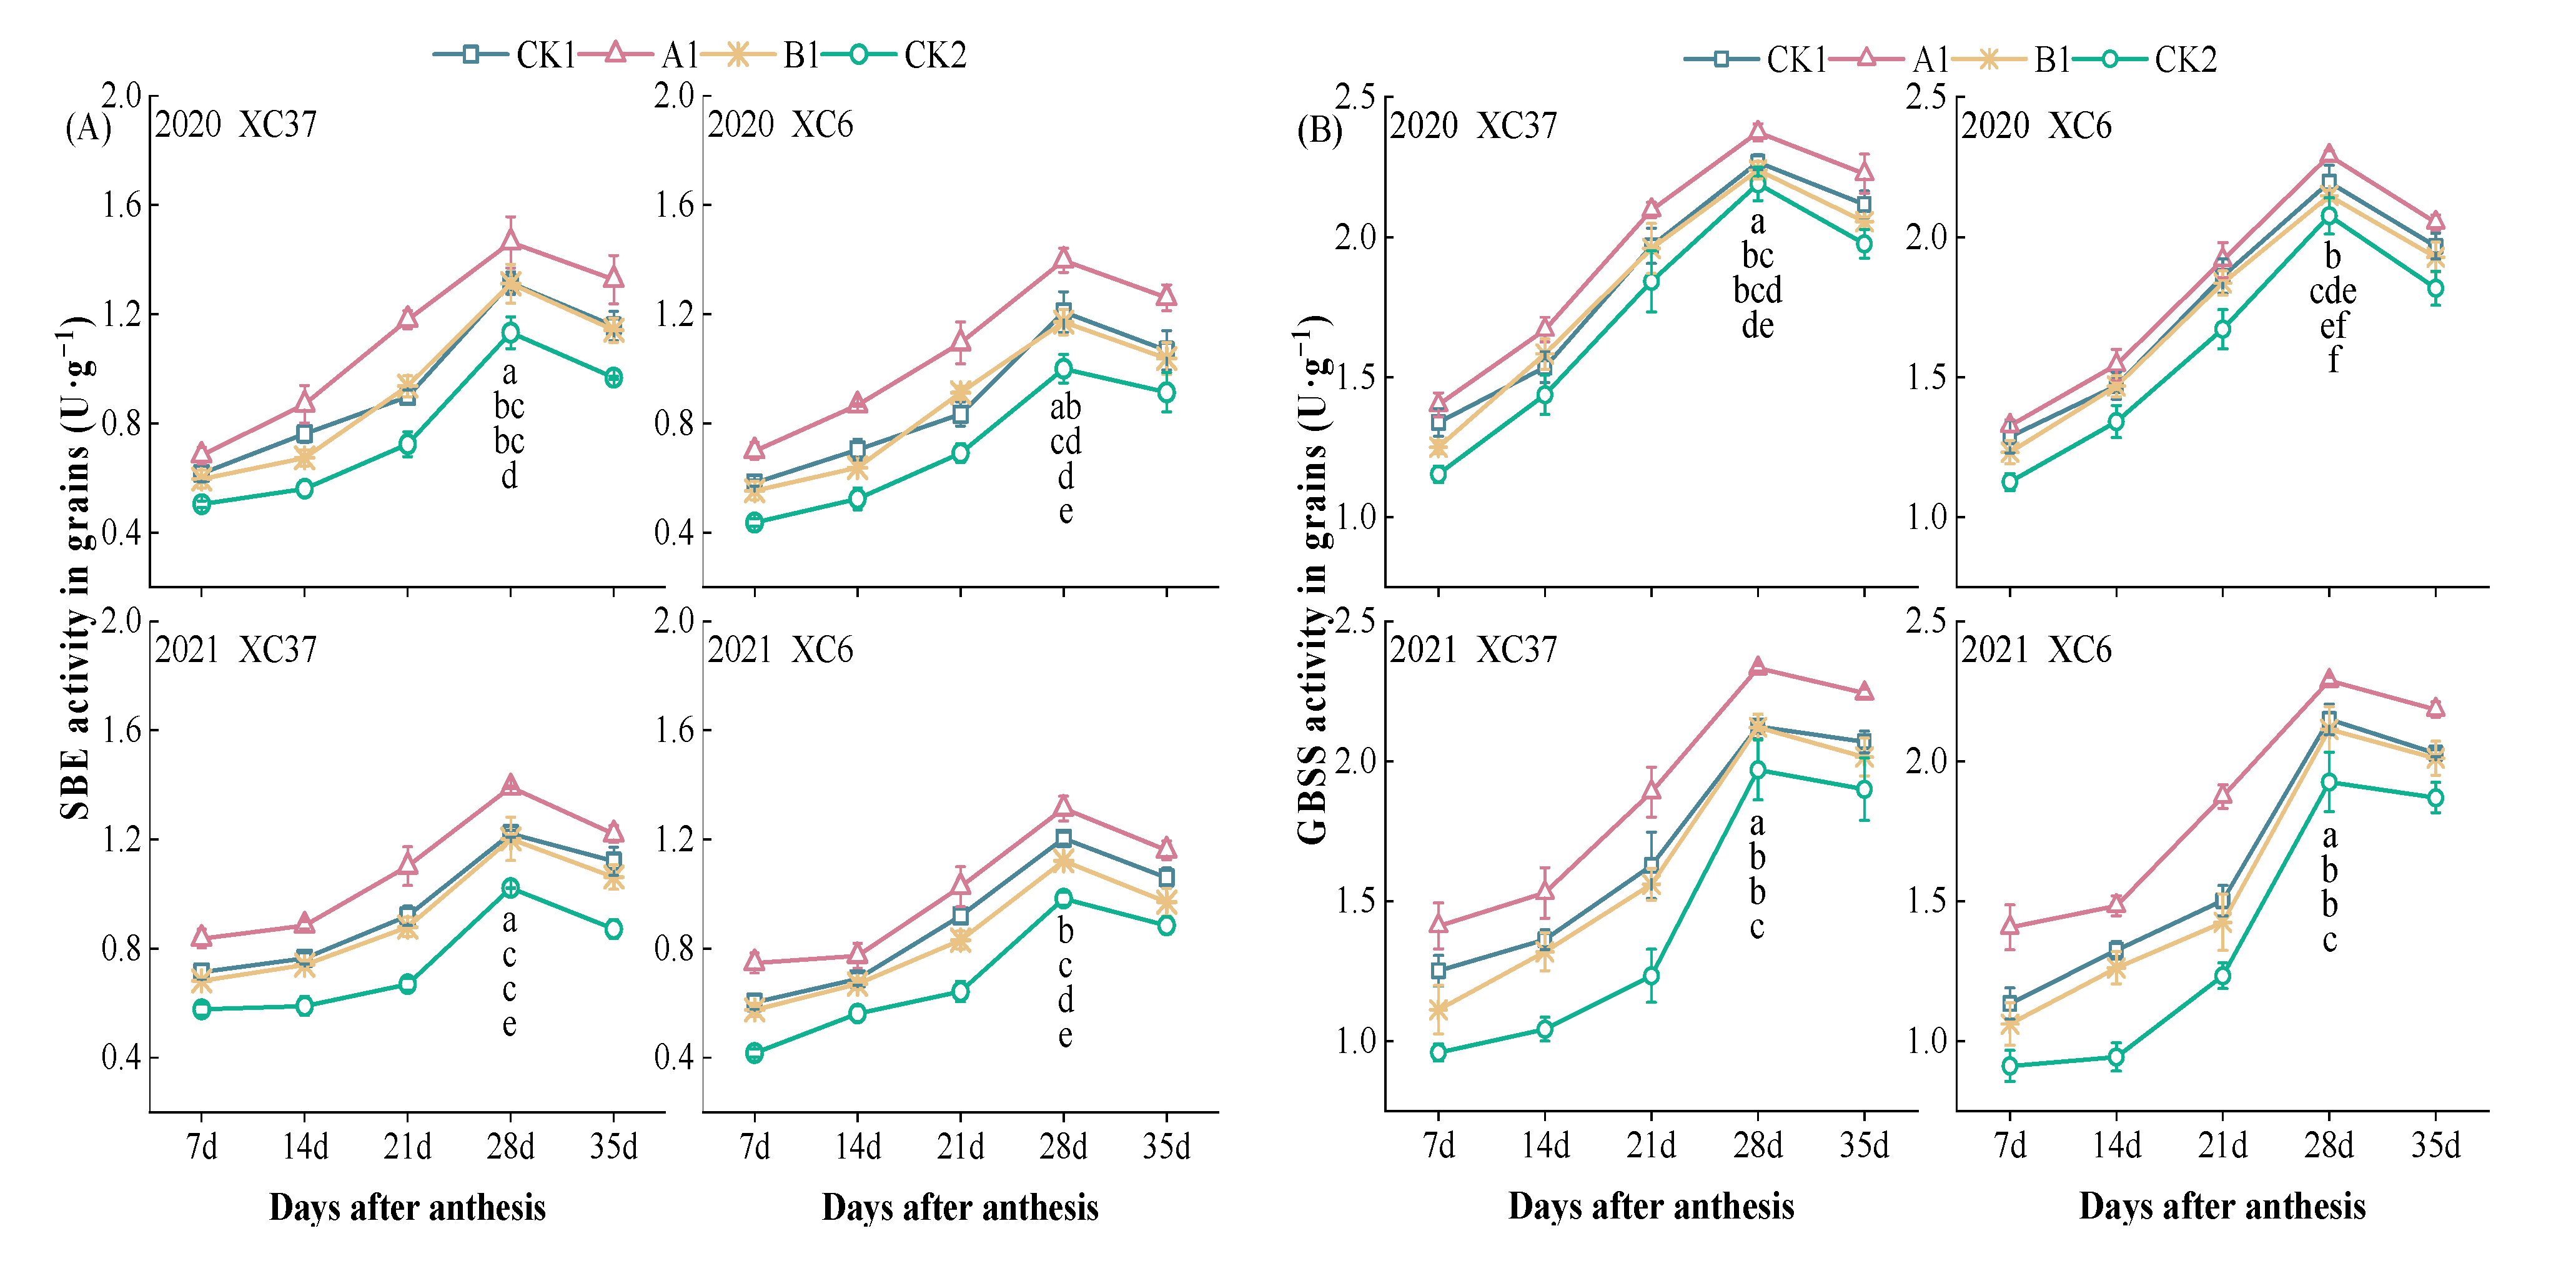
3.2.1. Changes in the Activity of Key Enzymes Involved in Sucrose Metabolism in Grains

The activities of SPS and SS in grains showed a single-peak curve change with the advance of days after anthesis, reaching a maximum at 28 days after flowering (Figure 5). In the same period, the SPS activity of the grains showed a trend of CK1 ≥ A1 > B1 > CK2. At 35 days after flowering, the differences in SPS activity between the treatments were small (2–13 U·g−1), while at other stages, they were large (0–39 U·g−1). Except for the A1 treatment, the differences between CK1 and the other treatments reached a significant level (p < 0.05). After 28 days of flowering, the CK1 treatment was 1–6%, 14–38%, and 24–58% higher than the A1, B1, and CK2 treatments, respectively. Throughout the entire reproductive period, the SPS activity in the grains of XC37 was 3–30% higher than that of XC 6. After 28 days of flowering, the SS activity in the grains under the A1 treatment was significantly higher than the CK1, B1, and CK2 treatments by 11–16%, 11–19%, and 24–35%. Throughout the entire reproductive period, the SS activity in the grains of XC37 was 1–31% higher than that of XC 6.

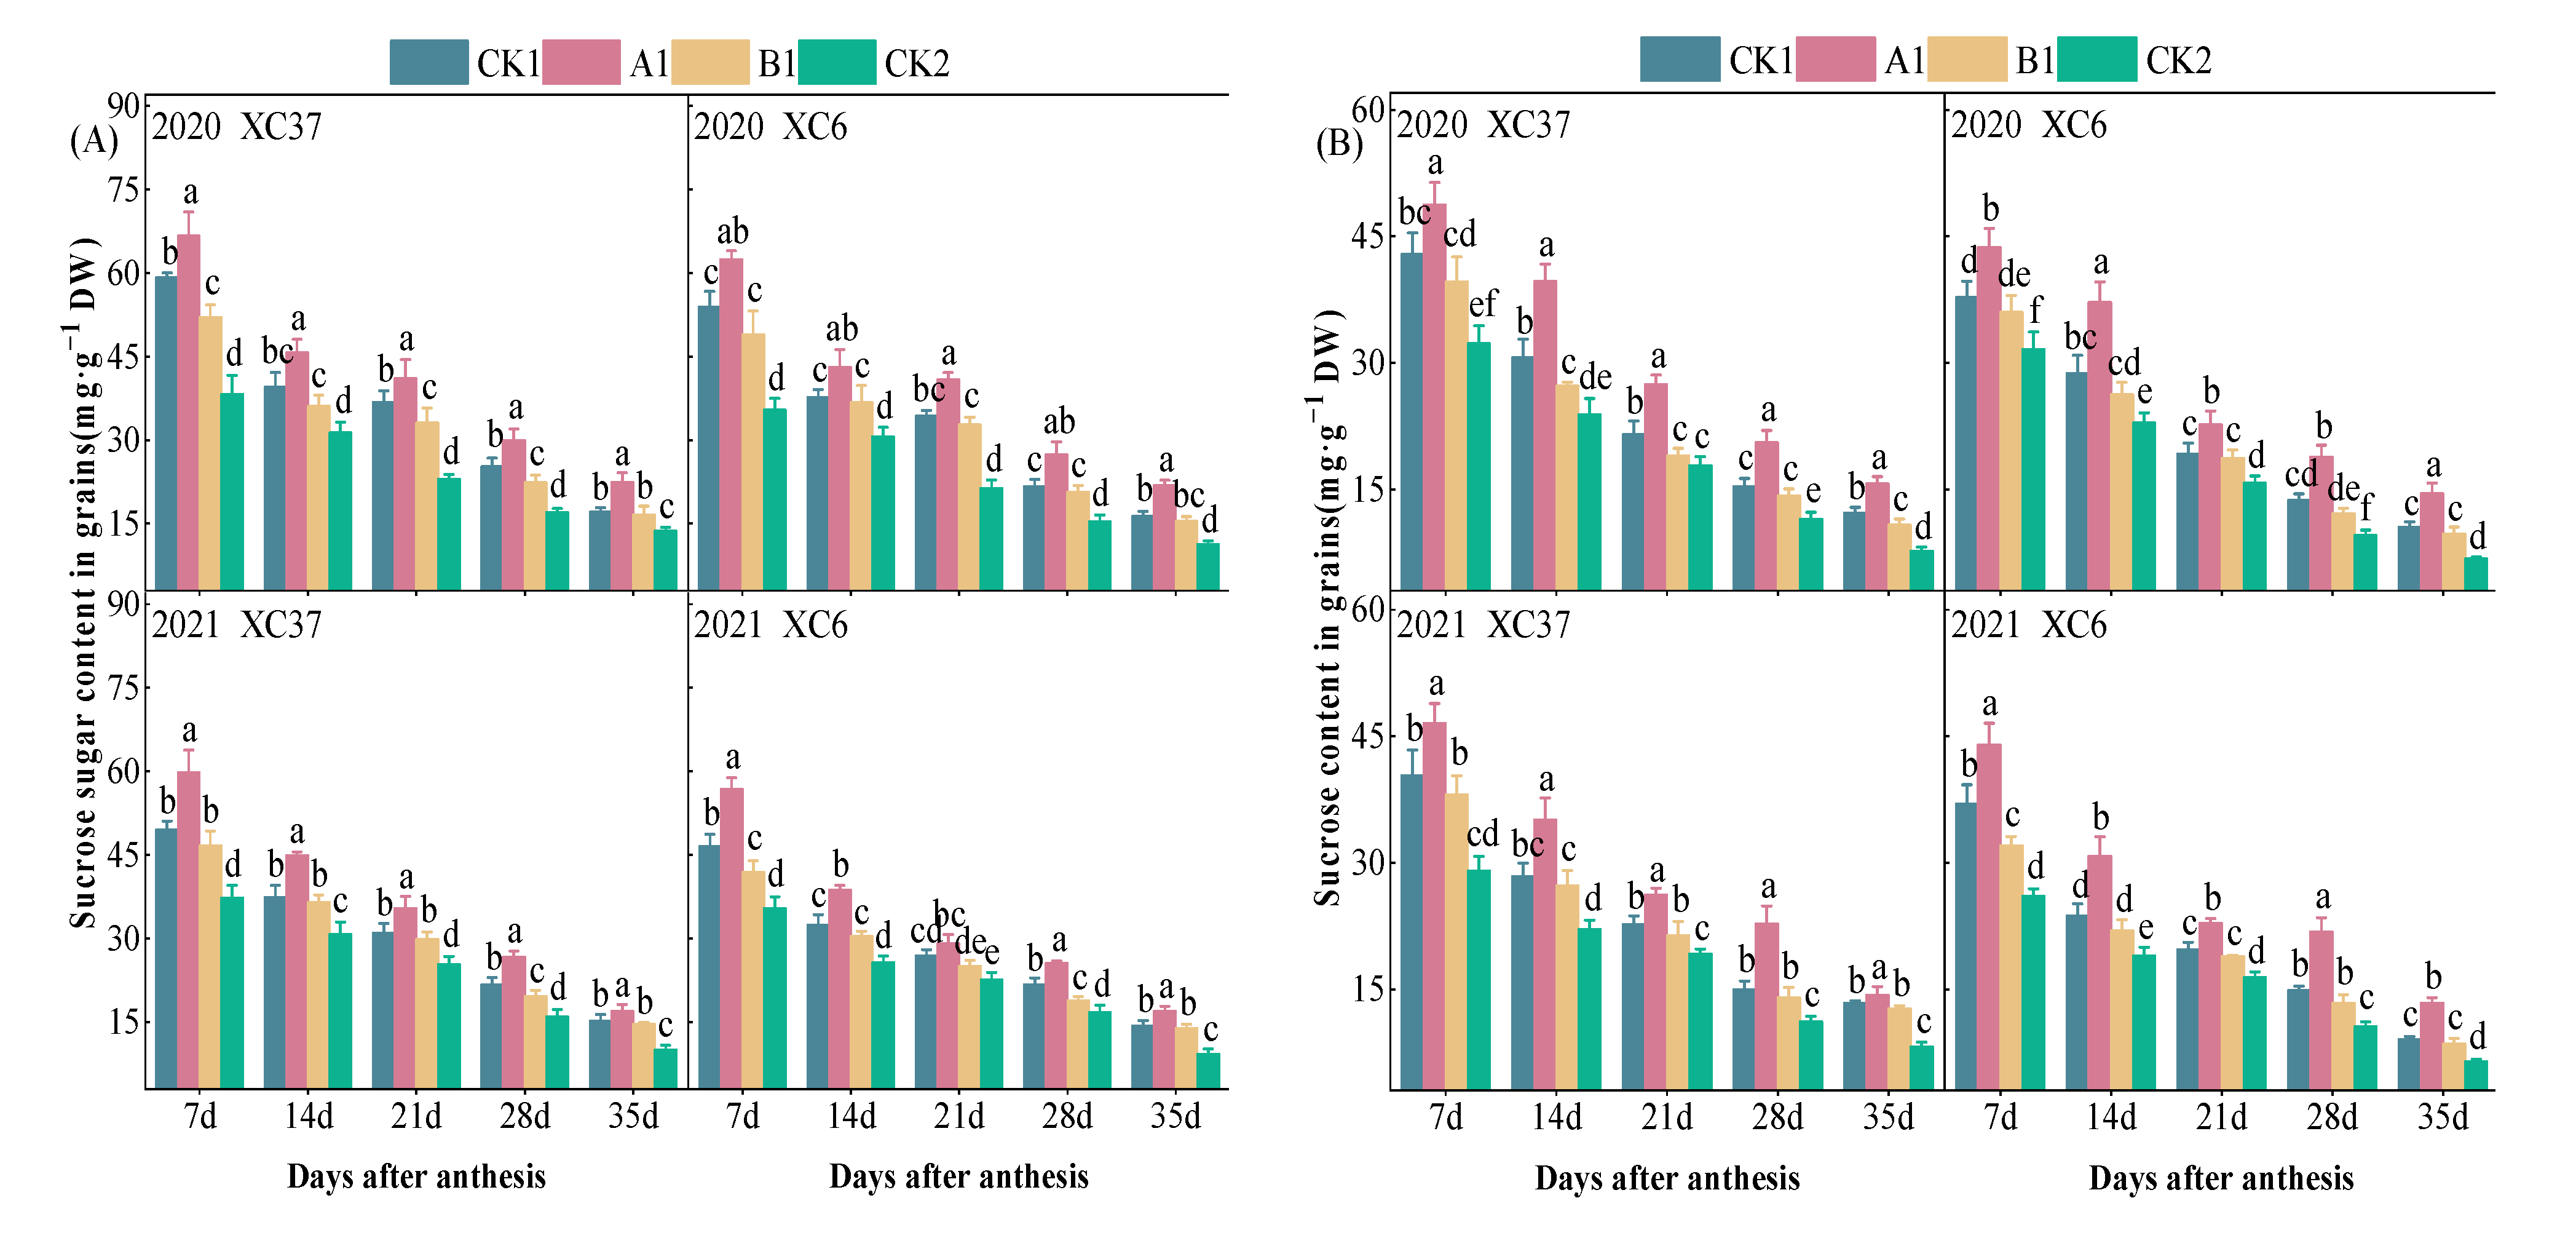
3.2.2. Changes in Soluble Sugar and Sucrose Content in Grains

The trend of changes in the soluble sugar and sucrose content in the grains under different nitrogen application rates was consistent, both showing a decreasing trend with the increase in the number of days after flowering. The maximum value was at 7 days after flowering, showing a trend of A1 > CK1 > B1 > CK2 (Figure 6). From 7 to 35 days after flowering, the soluble sugar content of XC37 and XC 6 decreased by an average of 34–37 mg·g−1 DW and 32–34 mg·g−1 DW. And the soluble sugar content in the grains under the A1 treatment was significantly higher than the CK1, B1, and CK2 treatments by 8–34%, 16–41%, and 28–93%. Throughout the entire reproductive period, the soluble sugar content in the grains of XC37 was 7–22% higher than that of XC 6. From 7 days after flowering to maturity, the sucrose content of XC37 and XC 6 decreased by 21–33 mg·g−1 DW and 20–31 mg·g−1 DW, respectively, indicating that the amplitude of the change in sucrose content in XC37 was slightly higher than that in XC 6. The sucrose content in grains under the A1 treatment was significantly higher than the CK1, B1, and CK2 treatments by 7–53%, 13–63%, and 51–114%. Throughout the entire reproductive period, the sucrose content in the grains of XC37 was 4–21% higher than that of XC 6.

3.2.3. Changes in Key Enzyme Activity of Grain Starch

As shown in Figure 7, the ADPG-PPase and SSS activities in grains under reduced nitrogen application showed a single-peak curve throughout the entire growth period, reaching their peak at 28 days after flowering. At 7, 21, 28, and 35 days after flowering, ADPG-PPase activity showed changes in A1 > CK1 > B1 > CK2. The ADPG-PPase activity in grains under the A1 treatment was significantly higher than the CK1, B1, and CK2 treatments by 8–18%, 14–24%, and 33–40% at 28 days after flowering. Throughout the entire reproductive period, the ADPG-PPase activity in the grains of XC37 was 1–24% higher than that of XC 6. At 28 days after flowering, the SSS activity in grains under the A1 treatment was significantly higher than the CK1, B1, and CK2 treatments by 11–18%, 13–31%, and 30–43%. Under the A1 treatment, the SSS activity was higher by 1–26% in XC37 than in XC 6.
From Figure 8, it can be seen that the SBE and GBSS activities of grains under reduced nitrogen application showed a single-peak curve of first increasing and then decreasing with the filling process, reaching a peak at 28 days after flowering, showing a change trend of A1 > CK1 > B1 > CK2. At 28 days after flowering, the SBE activity of A1 was significantly higher than the other treatments by 9–16%, 12–19%, and 29–40%. Under the A1 treatment, the SBE activity in the grains of XC37 was –2.36–14.39% higher than that of XC 6. The SBE activity remained at a high level from 21 to 35 days after flowering. From 7 to 14 days after flowering, there was a small difference in the SBE activity among the treatments, and at 28 days after flowering, there was a significant difference. The GBSS activity in the grains under the A1 treatment was significantly higher than the CK1, B1, and CK2 treatments by 4–10%, 6–10%, and 8–19% at 28 days after flowering. The GBSS activity remained at a high level (1–2 U·g−1) from 21 to 35 days after flowering. Under the A1 treatment, the GBSS activity in the grains of XC37 was 0–9% higher than that of XC 6. The decrease in GBSS activity in XC37 from peak to maturity (3–11%) was slightly lower than that of XC 6 (3–14%).

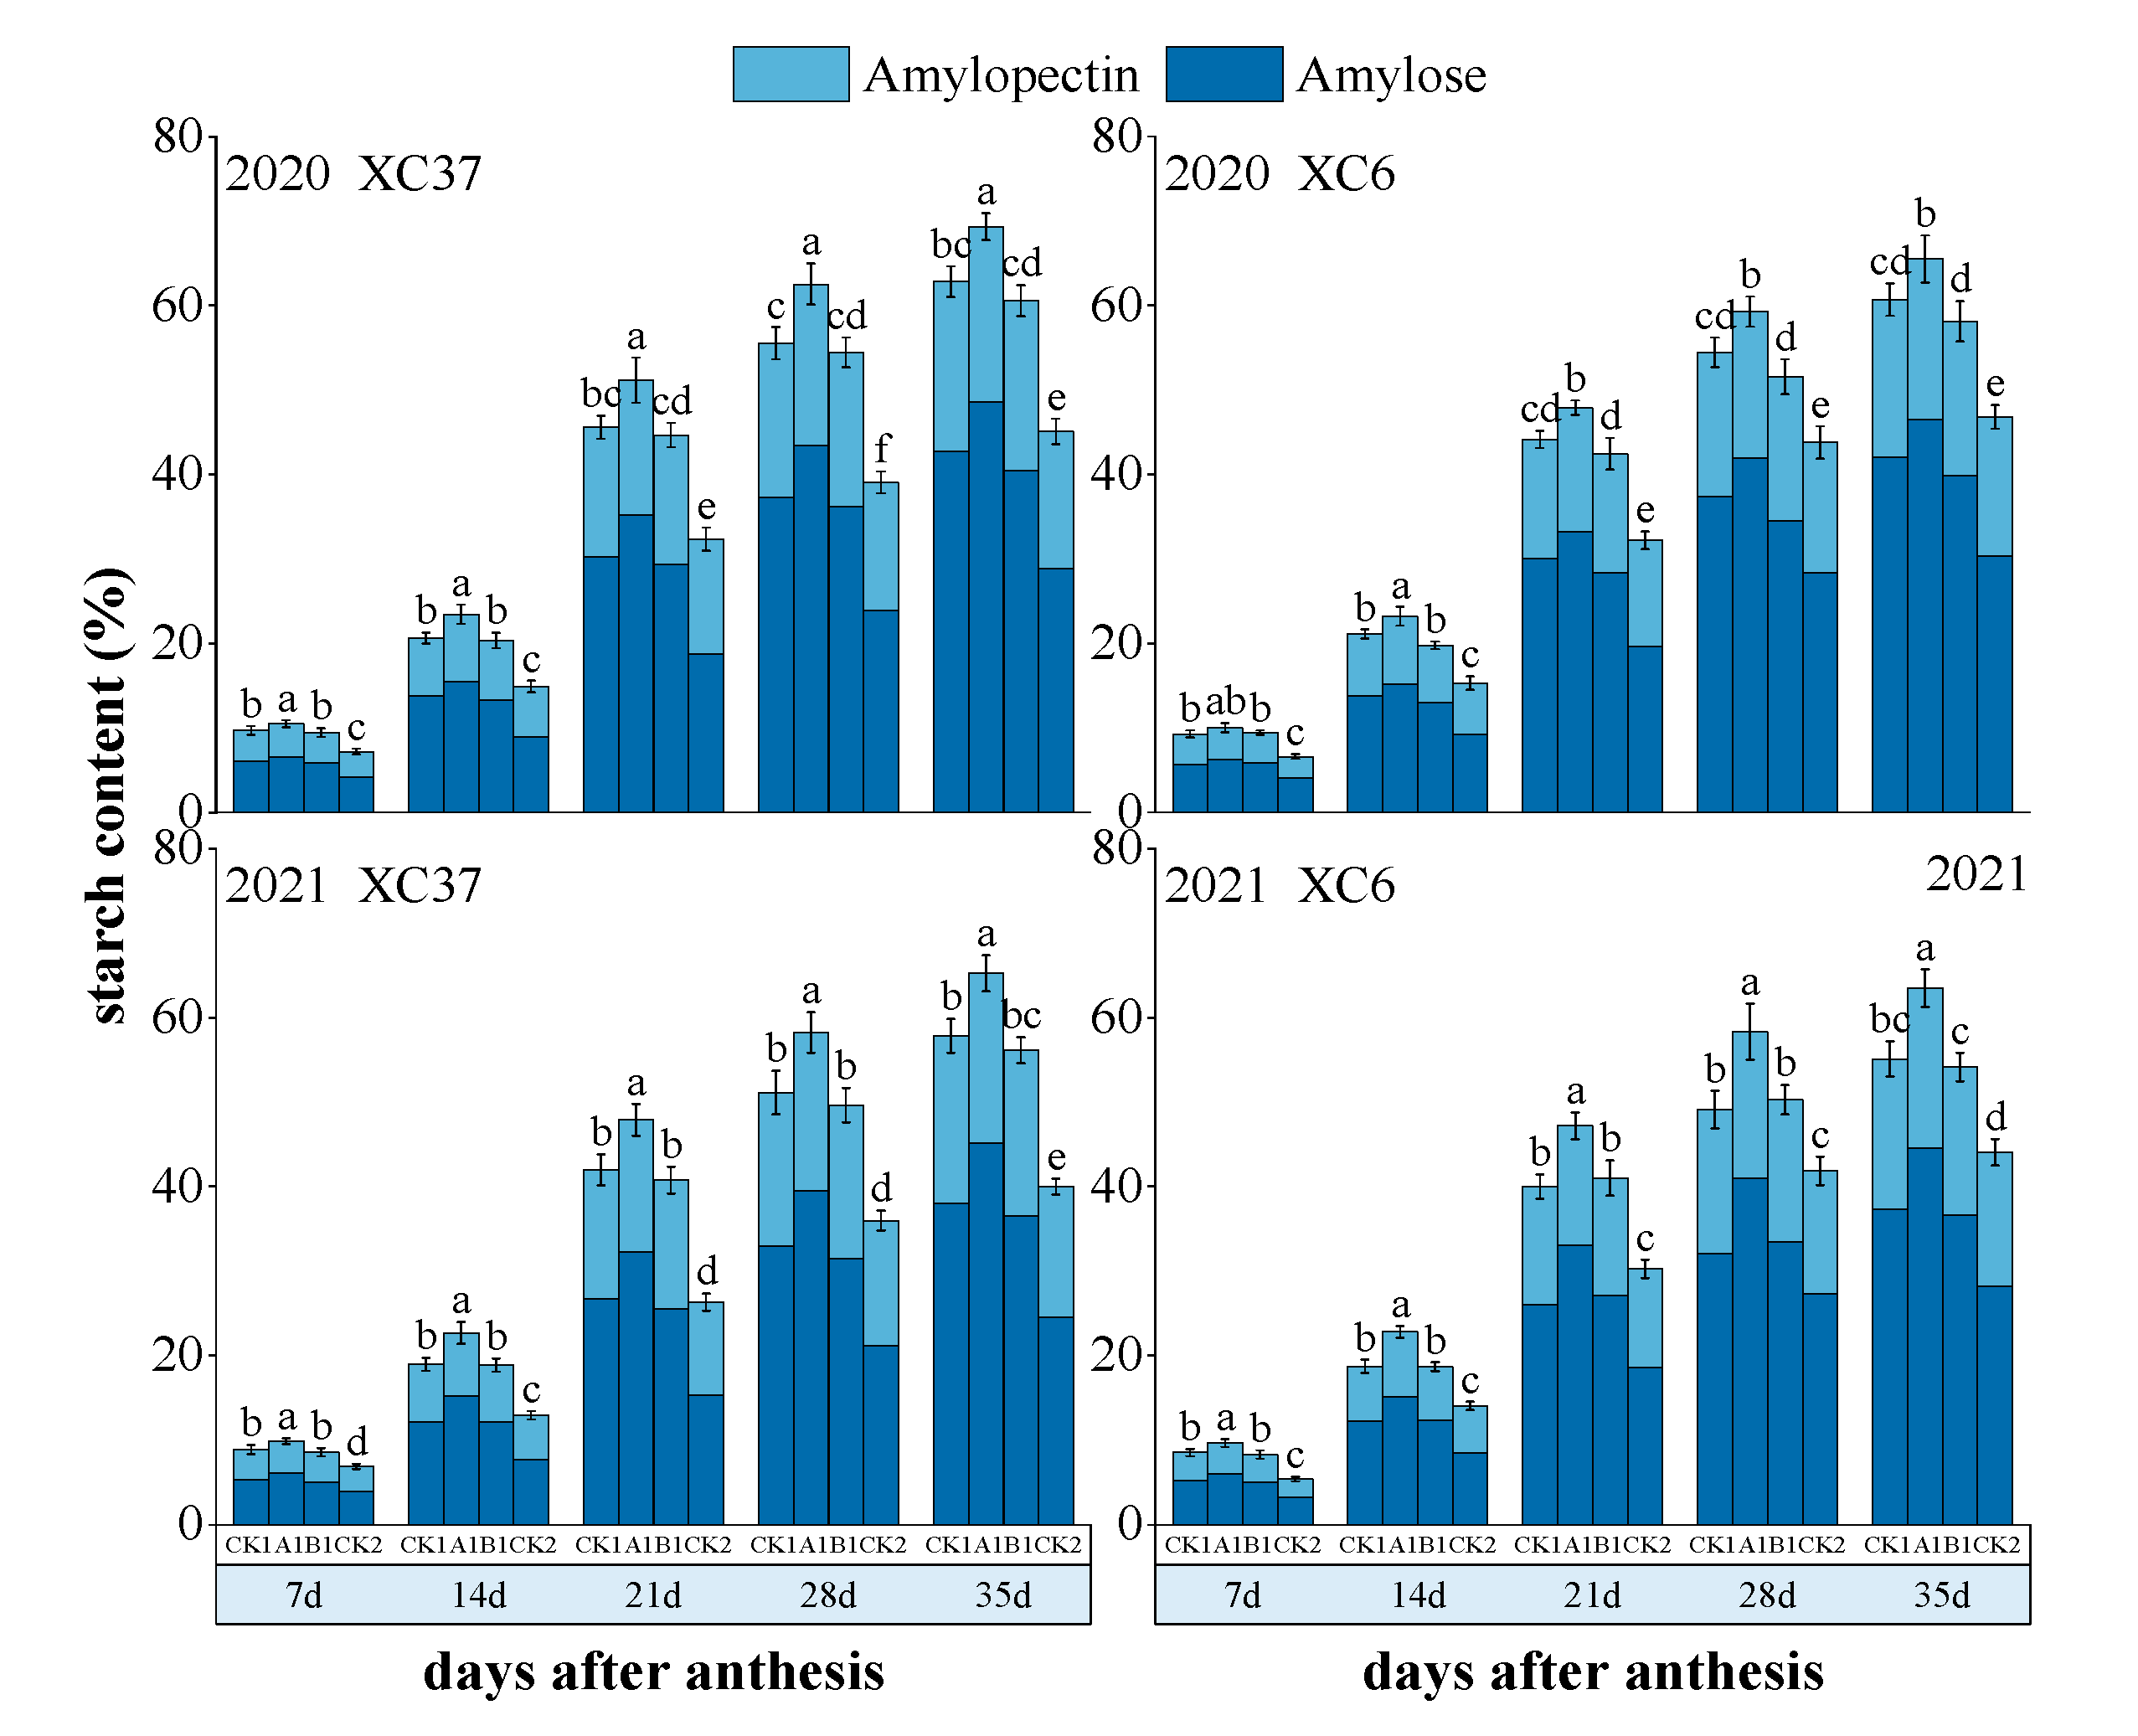
3.3. Effect of Root-Layer Nitrogen Reduction on Starch Composition and Content in Grains

The dynamic changes in the amylose and amylopectin content of XC37 and XC 6 are shown in Figure 9, both of which showed a gradual increase with the advancement of the filling period. Throughout the filling period, there were significant increase in amplitude from 14 to 21 days after flowering. During the same period, the A1 treatment (255 kg·ha−1) showed the best content of amylose and amylopectin. At 35 days of flowering, there was a significant difference in amylose content between A1 and the other treatments (p < 0.05). At 35 days of flowering, under the A1 treatment, the amylose content of XC37 in 2020 and 2021 was 21% and 20%, respectively, which increased by 2–3%, 2–3%, and 28–30% compared to the CK1, B1, and CK2 treatments, respectively. The amylopectin content under the A1 treatment in 2020 and 2021 was 49% and 45%, respectively; compared with the CK1, B1, and CK2 treatments, it increased by 14–18%, 20–24%, and 68–84%, respectively. The amylose content of XC 6 in 2020 and 2021 was 19% and 19%, respectively, which increased by 2–6%, 4–8%, and 15–20% compared to the CK1, B1, and CK2 treatments, respectively. In 2020 and 2021, the content of amylopectin was 47% and 45%, respectively, which increased by 11–20%, 17–22%, and 53–58% compared to the CK1, B1, and CK2 treatments, respectively. There is a quadratic parabolic relationship between the straight chain, branched chain, and total starch content of grains and nitrogen application rate (Figure 10).

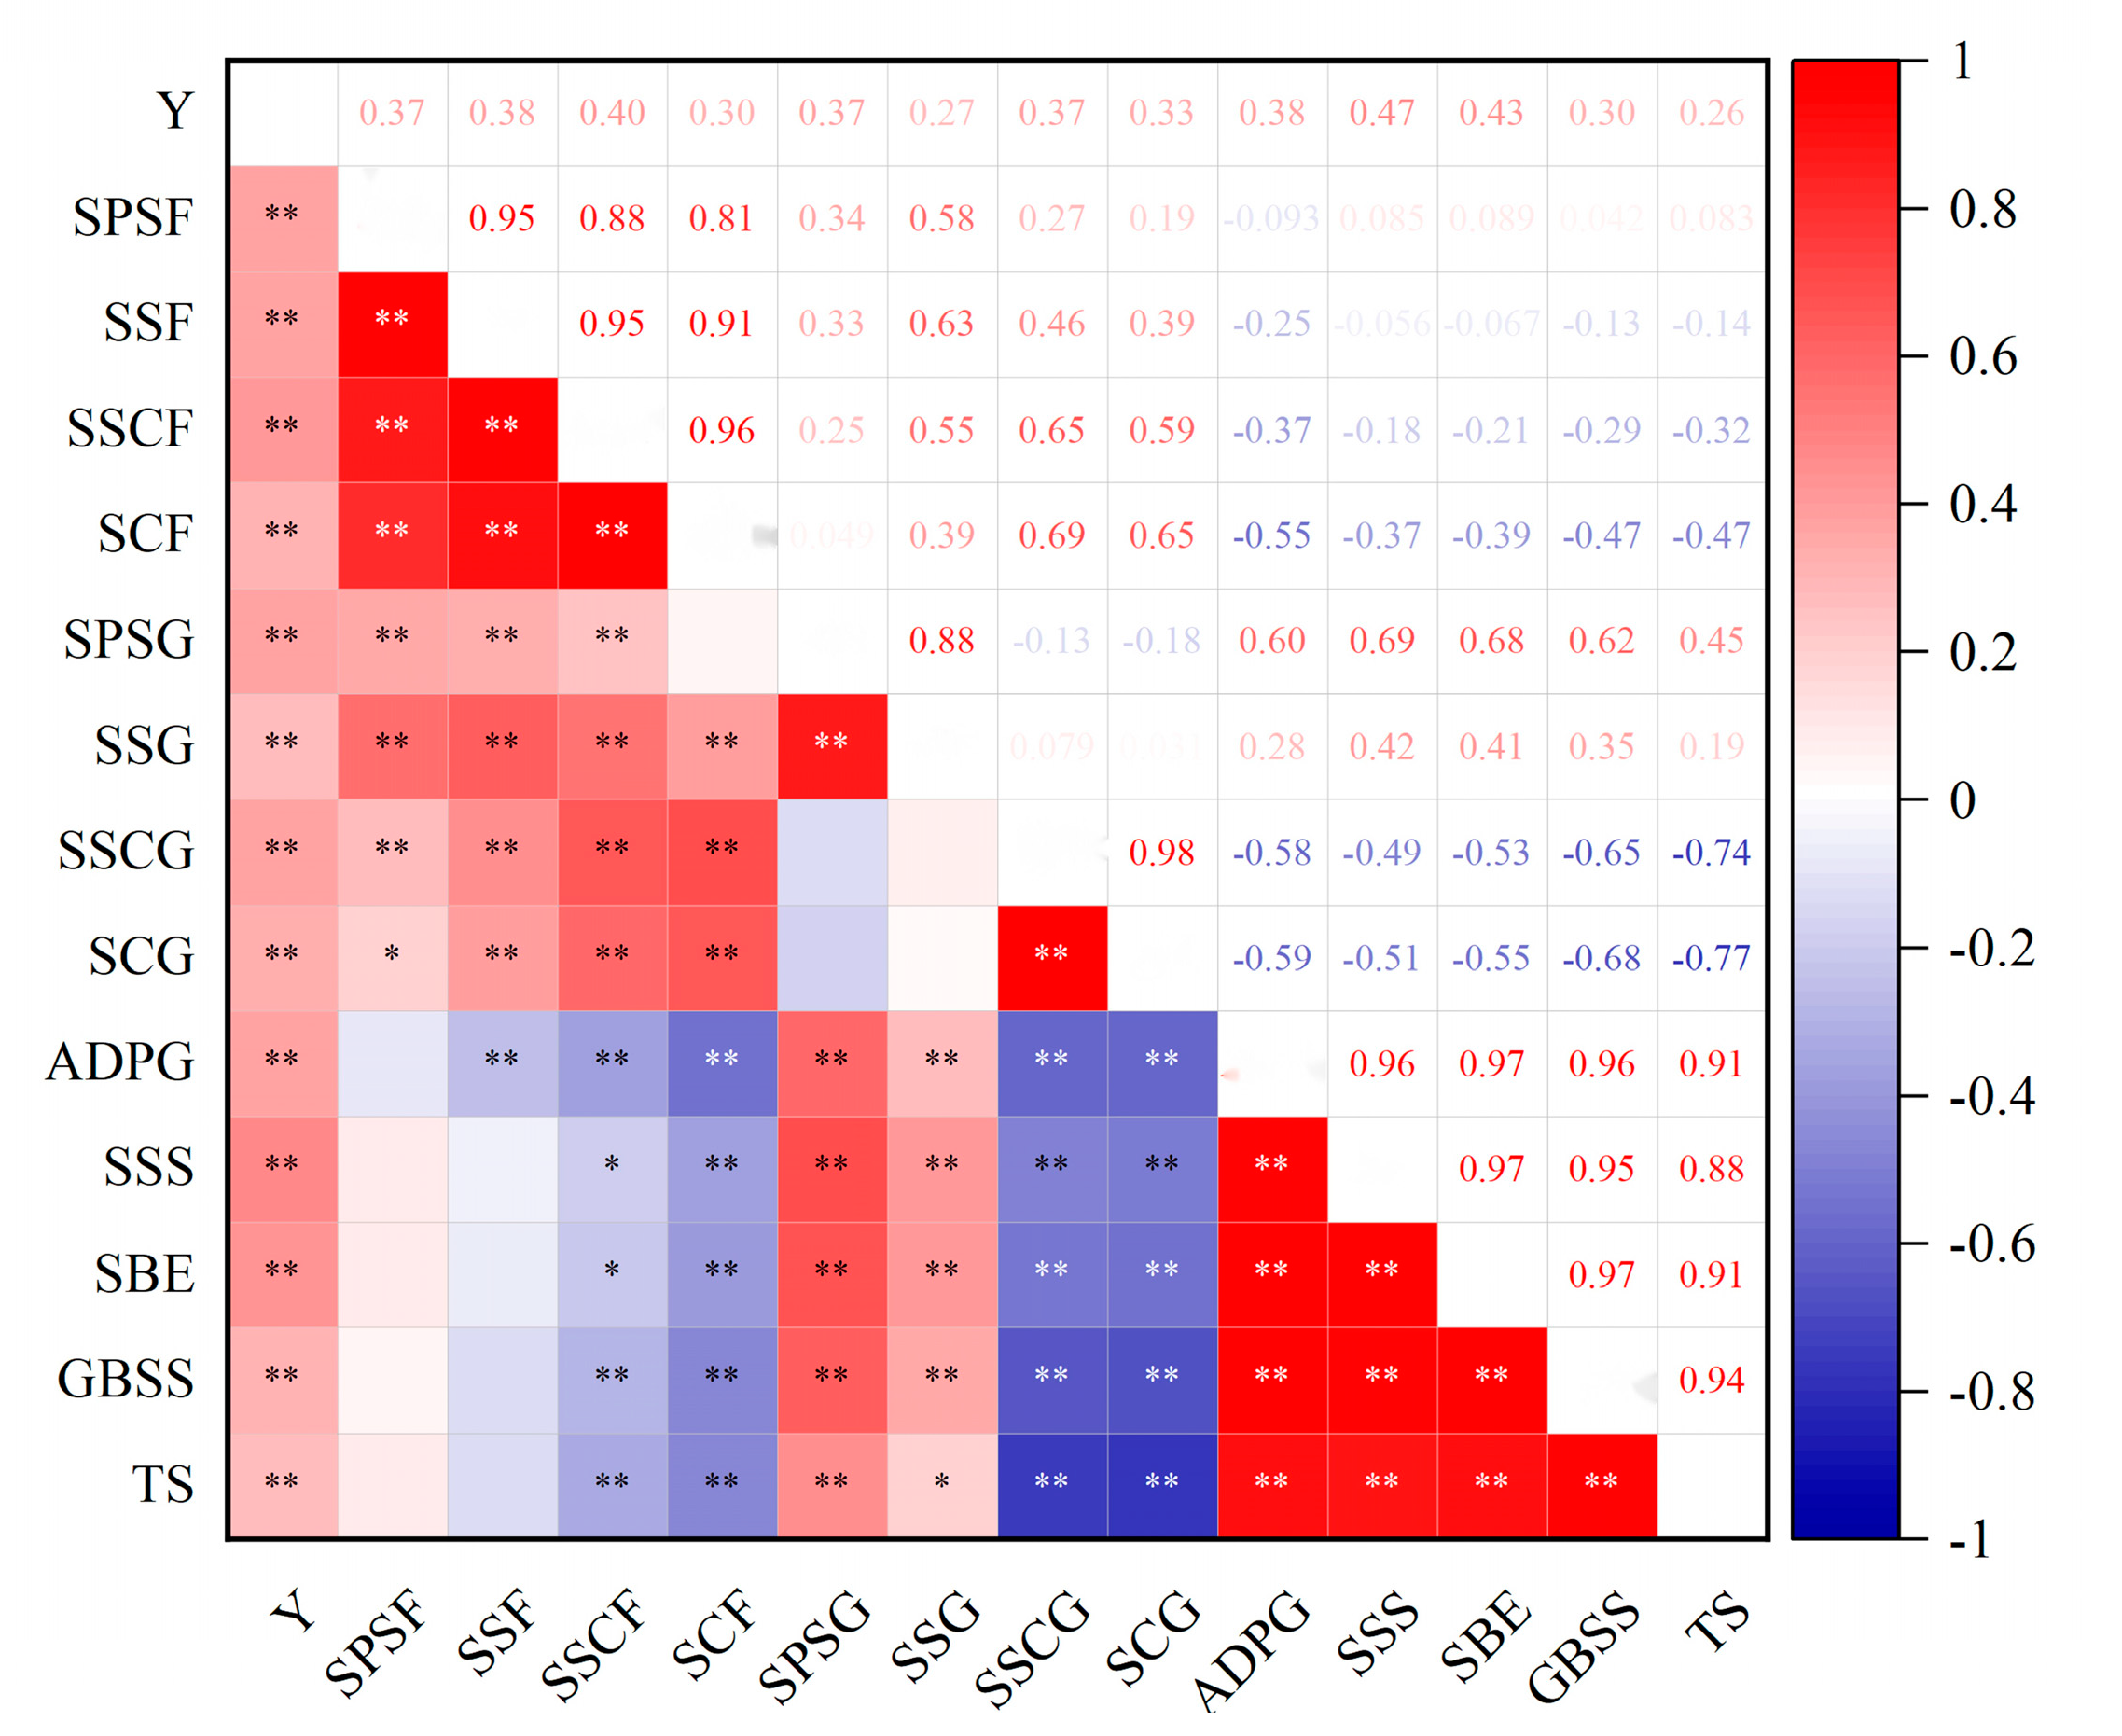
3.4. Correlation Analysis between Yield and Carbon Metabolism Parameters of Flag Leaves and Grains under Root-Layer Nitrogen Reduction

According to Table 3, there was a significant relationship between the N application rate and wheat yield and various yield factors. The N application rate and variety interaction have a significant impact on the yield and its constituent factors of the two varieties (p < 0.05). The trend of changes in the 1000-grain weight, spike number, and grains per spike was consistent, with XC37 and XC 6 having the highest yield and composition under the A1 treatment.
Through a joint yield analysis over the two years, it was found that as the nitrogen application rate decreased, the yield and composition of both varieties showed an initial increase followed by a decrease. A low nitrogen application rate (0–210 kg·ha−1) would lead to a decrease in yield and its composition, while an excessive nitrogen application rate (300 kg·ha−1) had no significant effect on increasing yield. Compared with the CK1 treatment, the 1000-grain weight, spike number, grains per spike, and yield of XC37 under the A1 treatment increased by 2–3%, 4–5%, 2–7%, and 4–5%, respectively; XC 6 increased by 1–4%, 3–4%, 2–2%, and 3–6%. XC37 was 1–2%, 1–3%, 0–6%, and 1–4% higher than XC 6, respectively. In Figure 11, significant correlations were found between the yield and various indicators under different nitrogen reduction treatments (r = 0.26 *~0.47 **). The correlation between the soluble sugar and sucrose content in the flag leaves and SPS and SS was r = 0.81 **~0.95 **, while the correlation between the starch content in the grains and the ADPG-PPase, SSS, SBE, and GBSS activities was r = 0.88 **~0.94 **. Under different N application rates, the activity of sucrose key enzymes in flag leaves can be regulated to regulate sucrose and soluble sugar content, thereby promoting yield improvement. The strength of starch key enzyme activity under nitrogen regulation can also affect the grain quality of drip-irrigated spring wheat.
Using yield (Y) as the dependent variable, the sucrose phosphate synthase in the flag leaves (SPS) (X1), the sucrose synthase in the flag leaves (SS) (X2), the soluble sugar in the flag leaves (X3), the sucrose in the flag leaves (X4), the sucrose phosphate synthase in the grains SPS (X5), the sucrose synthase in the grains (X6), the soluble sugar in the grains (X7), the sucrose in the grains (X8), the adenosine diphosphate glucose pyrophosphorylase (ADPG-PPase) (X9), the soluble starch synthase (SSS) (X10), the starch branching enzyme (SBE) (X11), the granule-bound starch synthase (GBSS) (X12), and the total starch (X13), amylose (X14), and amylopectin (X15) were used as independent variables for a stepwise regression analysis. After analysis, the following stepwise regression equations were obtained:
Y(XC37) = 3545.381 + 28.654X7 + 57.005X15 + 35.634X8 (R2 = 0.845, F = 101.714 **)
Y(XC 6) = 2625.156 + 7967.269X10 + 65.075X7 + 60.927X15 − 2661.218X11 (R2 = 0.804, F = 56.449 **)
(“**” indicate significant difference at 0.05 and 0.01 levels)
The regression analysis results showed that soluble sugars in grains, amylopectin, and sucrose in grains had the greatest impact on the yield of XC37, determining 84.5% of the yield. SSS, soluble sugars in grains, amylopectin, and SBE were significant indicators affecting the yield of XC 6, determining 80.4% of its yield.

4. Discussion

4.1. Effect of Nitrogen Application Rate on Sucrose Metabolism in Flag Leaves and Grains of Spring Wheat

Sucrose is the substrate for starch synthesis, and SPS and SS are key enzymes for the conversion of photosynthetic products to sucrose [28], with SS being a bidirectional catalytic enzyme [29]. The activity of SS in the synthesis direction of flag leaves determines their ability to synthesize sucrose, while the activity of SS in the decomposition direction of grains reflects their ability to degrade sucrose. The higher the SS activity in grains, the faster the degradation rate of sucrose, and the more sufficient the substrate provided for starch synthesis. An appropriate nitrogen fertilizer supply can increase the SPS and SS enzyme activities in wheat flag leaves during the grain filling period, increase the sucrose content in grains, and increase the supply level of starch synthesis substrates, but excessive nitrogen fertilizer is the opposite [30]. In this study, we found that the activities of key enzymes of sucrose metabolism (SPS, SS) in flag leaves and grains after flowering showed a tendency to increase and then decrease with the increase in the number of days after flowering under different treatments, which is in agreement with the results of Zhang et al. [31]. The activities of the flag leaves’ SPS and SS reached their maximum at 21 days, while the activities of the grain SPS and SS reached their maximum at 28 days. Under the treatment with A1 (255 kg·ha−1), the SPS and SS activities of the flag leaves were significantly higher than those of CK1 (300 kg·ha−1), with increases of 8–39% and 9–44%, respectively. The grain SS activity in A1 (255 kg·ha−1) was significantly higher than in CK1 (300 kg·ha−1) by 8–17%, indicating that reducing nitrogen fertilizer appropriately can enhance the activity of key enzymes in sucrose metabolism. Soluble sugars and sucrose are substrates for starch synthesis, and their content is related to starch accumulation. After flowering, the soluble sugar and sucrose of flag leaves increased first and then decreased, which was significantly positively correlated with the SPS and SS activities of the flag leaves, consistent with the results of Yu et al. [32]. The soluble sugars and sucrose in flag leaves continue to increase from 0 to 21 days after flowering, reaching their peak at 21 days. At this time, flag leaves have high SPS and SS activities; after 21 days, the soluble sugar and sucrose content in flag leaves rapidly decreased. This may be due to the aging of flag leaves in the late stage of grain filling, resulting in a decrease in enzyme activity involved in sucrose metabolism, leading to a decrease in sucrose content in the flag leaves. On the other hand, the demand for soluble sugar and sucrose in grain starch synthesis increased. The soluble sugars and sucrose in grains showed a continuous downward trend after flowering, which may be related to the conversion of sucrose starch in grains. Therefore, the application of 255 kg·ha−1 of nitrogen fertilizer could promote sucrose metabolism in flag leaves and grains under drip irrigation in arid areas of Xinjiang. However, further research is needed to investigate the effects of the nitrogen fertilizer application period and proportion on sucrose metabolism in flag leaves and grains during wheat growth under drip irrigation.

4.2. Effect of Nitrogen Application Rate on Starch Metabolism and Synthesis in Spring Wheat Grains

The synthesis and accumulation of starch are regulated by the activities of ADPG-PPase, SSS, GBSS, and SBE [33]. ADPG-PPase is a rate-limiting enzyme for starch synthesis and a determining factor for the grain growth rate. Together with SBE, it controls starch synthesis [34]. SSS and GBSS are the main catalytic enzymes for the synthesis of amylose and amylopectin, respectively [35]. The above enzyme activities are significantly affected by nitrogen application rates. Insufficient or excessive nitrogen application can lead to varying degrees of decreases in key enzymes involved in starch synthesis, with varying impacts on various stages of starch synthesis [15]. This study found that, under different treatments, the activities of key enzymes in grain starch synthesis (ADPG-PPase, SSS, GBSS, SBE) showed a tendency to increase and then decrease with the increase in days after anthesis, which was in agreement with the findings of Li et al. [36]. At 28 days after flowering, the activity of key enzymes in starch synthesis and the starch content showed a trend of A1 (255 kg·ha−1) > CK1 (300 kg·ha−1) > B1 (210 kg·ha−1) > CK2 (0 kg·ha−1), and the starch content was significantly positively correlated with these enzyme activities. Among them, the ADPG-PPase, SSS, GBSS, and SBE under the CK1 (300 kg·ha−1) treatment were significantly lower than those under the A1 (255 kg·ha−1) treatment, with decreases of 5–23%, 3–20%, 3–20%, and 8–24%, respectively, resulting in a decrease of 7–18% in the starch content. Xin et al. [15] believe that wheat can increase ADPG-PPase, SSS, GBSS, and SBE activity and yield at a nitrogen application rate of 240 kg·ha−1. However, when the nitrogen application rate is 300 kg·ha−1, both the enzyme activity and yield mentioned above decrease, which may be due to differences in geographical and climatic conditions. The content of starch components in the grains of the two varieties showed a gradual increase as the number of days after anthesis increased, with the highest growth rate from 14 to 21 days. The content of amylose, amylopectin, and total starch increased by 84–127%, 100–127%, and 103–121%, respectively. The content of straight chains, branched chains, and total starch in the grains showed a quadratic parabolic relationship with the nitrogen application rate.
XC37: yAmylose = −7 × 10−5X2 + 0.0338X + 15.81, yAmylopectin = −2 × 10−4X2 + 0.111X + 26.566,
yTotal starch = −3 × 10−4X2 + 0.1449X + 42.376;
XC 6: yAmylose = −3 × 10−5X2 + 0.0153X + 16.137, yAmylopectin = −2 × 10−4X2 + 0.0887X + 29.137,
yTotal starch = −2 × 10−4X2 + 0.104X + 45.274.
The results indicate that under the A1 (255 kg·ha−1) treatment, both strong- and medium-gluten wheat in arid areas of Xinjiang can enhance the activity of key enzymes involved in starch synthesis, thereby facilitating the accumulation of starch in grains.

4.3. Effect of Nitrogen Application Rate on Spring Wheat Yield and Its Composition

An appropriate nitrogen fertilizer supply is the foundation for high yields of wheat [37]. Yuan et al. [38] proposed that the main reason for the rational application of nitrogen fertilizer to increase wheat yield is the increase in the 1000-grain weight; Wang et al. [39] believe that the rational application of nitrogen fertilizer is beneficial for improving yield and ensuring harvest spikes. Research has shown that as the nitrogen application rate increases, the 1000-grain weight, spike number, grains per panicle, and yield of both varieties show a trend of first increasing and then decreasing. The yield increased from 6649–6833 kg·ha−1 under conventional nitrogen application (300 kg·ha−1) to 7053–7258 kg·ha−1 under the reduced nitrogen application (255 kg·ha−1). Further reductions in nitrogen application (210 kg·ha−1) resulted in a decreasing trend in yield and its composition.
Reducing nitrogen fertilizer application in a certain range can promote wheat yield. When too much or too little nitrogen fertilizer is applied, not only can yields not be increased, but yields may even be reduced, as Si et al. [40] found. The yield of both varieties shows a parabolic relationship with the nitrogen application rate, and the grain yield is yXC37 = −0.0191X2 + 10.581X + 5547.9 (R2 = 0.9575); yXC 6 = −0.0227X2 + 11.741X + 5367.8 (R2 = 0.9679). When the nitrogen application rate was 255 kg·ha−1, the yield of XC37 was 7004.08 kg·ha−1, and the yield of XC 6 was 6885.69 kg·ha−1. There was a significant interaction effect between the nitrogen application rate and variety on the 1000-grain weight, spike number, grains per spike, and yield of wheat, indicating that an appropriate nitrogen application rate is beneficial for improving the 1000-grain weight, spike number, grains per spike, and yield of wheat. The stepwise regression analysis showed that different varieties have different factors affecting their yield. Soluble sugars in grains, amylopectin, and sucrose in grains have the greatest impact on XC37 yield (R2 = 0.845), while SSS, soluble sugars in grains, amylopectin, and SBE have the greatest impact on XC 6 yield (R2 = 0.804). Due to differences in land fertility and other factors in different regions, the optimal nitrogen application rate also varies [21,41]. Therefore, further field evidence is needed to determine the appropriate nitrogen application rate for different regions.

5. Conclusions

Under this experimental condition, compared with 210 kg·ha−1 and 300 kg·ha−1 treatments, 255 kg·ha−1 treatments significantly increased the sucrose content of flag leaves, the key enzymes activities of sucrose metabolism and starch synthesis, and the starch content and grain weight. The 255 kg·ha−1 treatments facilitated the conversion of sucrose into starch substrates and promoted starch synthesis in grains. In addition, the sucrose content, key enzyme activities of carbon metabolism, starch content, and yield of the strong-gluten wheat variety (XC37) were found to be superior to those of the medium-gluten wheat variety (XC 6). Thus, the use of the strong-gluten wheat variety (XC37) and an appropriate regulation of the nitrogen application rate (255 kg·ha−1) can effectively maintain a balance of substance supply and demand between flag leaves and grains, ultimately leading to improved wheat yield.

Author Contributions

Conceptualization, Y.M. and J.L.; methodology, Y.M.; software, Y.M.; validation, H.W., R.W. and Z.C.; formal analysis, Y.M.; investigation, Y.M. and H.W.; resources, J.L.; data curation, Y.M.; writing—original draft preparation, Y.M.; writing—review and editing, J.L.; visualization, Y.M. and H.W.; supervision, J.L.; project administration, J.L.; funding acquisition, J.L. All authors have read and agreed to the published version of the manuscript.

Funding

This research was funded by [Guiying Jiang], grant number (31760346), and the APC was funded by [Guiying Jiang].

Data Availability Statement

The datasets generated for this study are available on request to the corresponding author.

Conflicts of Interest

The authors declare no conflict of interest.

References

  1. Wang, L.; Sun, J.; Zhang, Z.; Xu, P.; Shangguan, Z. Winter wheat grain yield in response to different production practices and soil fertility in northern China. Soil Tillage Res. 2018, 176, 10–17. [Google Scholar] [CrossRef]
  2. Gao, Y.; Wu, P.; Zhao, X.; Wang, Z. Growth, yield, and nitrogen use in the wheat/maize intercropping system in an arid region of northwestern China. Field Crops Res. 2014, 167, 19–30. [Google Scholar] [CrossRef]
  3. Shibata, H.; Galloway, J.N.; Leach, A.M.; Cattaneo, L.R.; Cattell Noll, L.; Erisman, J.W.; Gu, B.J.; Liang, X.; Hayashi, K.; Ma, L.; et al. Nitrogen footprints: Regional realities and options to reduce nitrogen loss to the environment. Ambio 2017, 46, 129–142. [Google Scholar] [CrossRef] [PubMed]
  4. Chen, H.; Huang, Z.J.; Wang, J.C.; Pan, X.J.; Zhang, D.; Xu, Y.L. Effect of Water and Nitrogen Coupling on N Absorption, Translocation and Yield of Winter Wheat under Drip Irrigation. Xinjiang Agric. Sci. 2018, 55, 44–56. [Google Scholar] [CrossRef]
  5. Mahdy, R.E.; Alghamdi, S.A.; Amro, A.; Tammam, S.A. Changes in Carbon and Nitrogen Metabolites before, at, and after Anthesis for Wheat Cultivars in Response to Reduced Soil Water and Zinc Foliar Application. Plants 2022, 11, 1261. [Google Scholar] [CrossRef] [PubMed]
  6. Zhang, W.; Wang, J.; Huang, Z.; Mi, L.; Xu, K.; Wu, J.; Fan, Y.; Ma, S.; Jiang, D. Effects of low temperature at booting stage on sucrose metabolism and endogenous hormone contents in winter wheat spikelet. Front. Plant Sci. 2019, 10, 498. [Google Scholar] [CrossRef] [PubMed]
  7. Kaur, M.; Bhardwaj, R.D.; Singla, P.; Kaur, S.; Kaur Grewal, S. Drought Stress-Induced Alterations in Source–Sink Relationships in Barley During Grain Development. Gesunde Pflanz. 2023, 75, 2401–2412. [Google Scholar] [CrossRef]
  8. Fan, Y.; Lv, Z.; Zhang, Y.; Ma, L.; Qin, B.; Liu, Q.; Zhang, W.; Ma, S.; Ma, C.; Huang, Z. Pre-anthesis night warming improves post-anthesis physiological activity and plant productivity to post-anthesis heat stress in winter wheat (Triticum aestivum L.). Environ. Exp. Bot. 2022, 197, 104819. [Google Scholar] [CrossRef]
  9. Wang, J.F.; Wang, Z.Z.; Gu, F.X.; Mou, H.M.; Wang, Y.; Duan, J.Z.; Feng, W.; Wang, Y.; Guo, T. Effects of nitrogen fertilizer and plant density on carbon metabolism, nitrogen metabolism and grain yield of two winter wheat varieties. Sci. Agric. Sin. 2021, 54, 4070–4083. [Google Scholar] [CrossRef]
  10. Jiang, D.; Fan, X.; Dai, T.; Cao, W. Nitrogen fertiliser rate and post-anthesis waterlogging effects on carbohydrate and nitrogen dynamics in wheat. Plant Soil 2008, 304, 301–314. [Google Scholar] [CrossRef]
  11. Huang, L.; Tan, H.; Zhang, C.; Li, Q.; Liu, Q. Starch biosynthesis in cereal endosperms: An updated review over the last decade. Plant Commun. 2021, 2, 100237. [Google Scholar] [CrossRef] [PubMed]
  12. Zheng, X.G.; Qi, J.C.; Hui, H.S.; Lin, L.H.; Wang, F. Starch accumulation in hulless barley during grain filling. Bot. Stud. 2017, 58, 30. [Google Scholar] [CrossRef] [PubMed]
  13. Zhao, H.; Dai, T.; Jiang, D.; Cao, W. Effects of high temperature on key enzymes involved in starch and protein formation in grains of two wheat cultivars. J. Agron. Crop Sci. 2008, 194, 47–54. [Google Scholar] [CrossRef]
  14. Yang, G.D.; Hu, Z.Y.; Huang, R.D.; Hao, Z.Y.; Li, J.H.; Wang, Q.; Ming, X.; Zhou, Y.F. Effect of nitrogen on the starch formation and yield of high-density sorghum [Sorghum bicolor (L.) Moench] in northern China. Appl. Ecol. Environ. Res. 2020, 18, 5727–5741. [Google Scholar] [CrossRef]
  15. Xin, L.; Fu, Y.; Ma, S.L.C.; Wang, H.; Gao, Y.; Wang, X. Effects of Post-Anthesis Irrigation on the Activity of Starch Synthesis-Related Enzymes and Wheat Grain Quality under Different Nitrogen Conditions. Plants 2023, 12, 4086. [Google Scholar] [CrossRef]
  16. Yue, K.; Li, L.; Xie, J.; Liu, Y.; Xie, J.; Anwar, S.; Fudjoe, S.K. Nitrogen supply affects yield and grain filling of maize by regulating starch metabolizing enzyme activities and endogenous hormone contents. Front. Plant Sci. 2022, 12, 798119. [Google Scholar] [CrossRef]
  17. Gao, L.; Wang, H.; Wan, C.; Wang, P.; Eeckhout, M.; Gao, J. Suitable nitrogen fertilizer application drives the endosperm development and starch synthesis to improve the physicochemical properties of common buckwheat grain. Int. J. Biol. Macromol. 2023, 235, 123837. [Google Scholar] [CrossRef]
  18. Ran, L.; Yu, X.; Li, Y.; Zou, J.; Deng, J.; Pan, J.; Xiong, F. Analysis of development, accumulation and structural characteristics of starch granule in wheat grain under nitrogen application. Int. J. Biol. Macromol. 2020, 164, 3739–3750. [Google Scholar] [CrossRef]
  19. Zhou, T.Y.; Li, Z.K.; Li, E.P.; Wang, W.L.; Yuan, L.M.; Zhang, H.; Liu, L.J.; Wang, Z.Q.; Gu, J.F.; Yang, J.C. Optimization of nitrogen fertilization improves rice quality by affecting the structure and physicochemical properties of starch at high yield levels. J. Integr. Agric. 2022, 21, 1576–1592. [Google Scholar] [CrossRef]
  20. Wang, X.Y.; He, M.R.; Li, F.; Liu, Y.H.; Zhang, H.H.; Liu, C.G. Coupling effects of irrigation and nitrogen fertilizer on grain protein and starch quality of strong-gluten winter wheat. J. Plant Nutr. Fertil. 2007, 13, 361–367. [Google Scholar] [CrossRef]
  21. Khan, G.R.; Akma, M. Nitrogen application rate and timing management for improved grain quality parameters of wheat crop. Pak. J. Agric. Sci. 2021, 58, 1141–1153. [Google Scholar] [CrossRef]
  22. Jing, J.; Li, Z.; Qian, F.; Chang, X.; Li, W. Effects of Different Drip Irrigation Patterns on Grain Yield and Population Structure of Different Water-and Fertilizer-Demanding Wheat (Triticum aestivum L.) Varieties. Agronomy 2023, 13, 3018. [Google Scholar] [CrossRef]
  23. Douglas, C.D.; Tsung, M.K.; Frederick, C.F. 1988. Enzymes of sucrose and hexose metabolism indevelopment kernels of two inbreds of maize. Plant Physiol. 1988, 86, 1013–1019. [Google Scholar] [CrossRef]
  24. Keller, F.; Ludlow, M.M. Carbohydrate metabolism in drought-stressed leaves of pigeonpea (Cajanus cajan). J. Exp. Bot. 1993, 44, 1351–1359. [Google Scholar] [CrossRef]
  25. Nakamura, Y.; Yuki, K.; Park, S.Y.; Ohya, T. Carbohydrate metabolism in the developing endosperm of rice grains. Plant Cell Physiol. 1989, 30, 833–839. [Google Scholar] [CrossRef]
  26. Vila, F.; Sanz, A. A proposal for evaluating laboratory instruction in a plant physiology course. Theor. Exp. Plant Physiol. 2018, 30, 4002–4008. [Google Scholar] [CrossRef]
  27. Jin, Y.H.; Zhang, K.L.; Zhang, X.C.; Du, J.H. Determination of straight chain and branched chain starch content in wheat and wheat sprouts using dual wavelength method. J. Chin. Cereals Oils Assoc. 2009, 24, 137–140. (In Chinese) [Google Scholar]
  28. Verma, A.K.; Upadhyay, S.K.; Verma, P.C.; Solomon, S.; Singh, S.B. Functional analysis of sucrose phosphate synthase (SPS) and sucrose synthase (SS) in sugarcane (Saccharum) cultivars. Plant Biol. 2011, 13, 325–332. [Google Scholar] [CrossRef] [PubMed]
  29. Stein, O.; Granot, D. An overview of sucrose synthases in plants. Front. Plant Sci. 2019, 10, 95. [Google Scholar] [CrossRef] [PubMed]
  30. Ullah, A.; Zhao, C.; Zhang, M.; Sun, C.; Liu, X.; Hu, J.; Zeeshan, M.; Zaid, A.; Dai, T.; Tian, Z. Nitrogen enhances the effect of pre-drought priming against post-anthesis drought stress by regulating starch and protein formation in wheat. Physiol. Plant. 2023, 175, e13907. [Google Scholar] [CrossRef]
  31. Zhang, Z.Q.; Hu, Y.X.; Tung, S.A.; Yang, L.; Wang, Y.; Zhou, X.B. Evaluating the Effects of Water-Nitrogen Interactions on Carbon and Nitrogen Accumulation as Well as Related Metabolic Enzymes Activity in Autumn Maize. J. Soil Sci. Plant Nutr. 2023, 23, 5245–5256. [Google Scholar] [CrossRef]
  32. Yu, H.R.; Guo, Y.; Zhu, A.M.; Lu, F.Y.; Wang, L.; Zhang, Y.X. Effects of nitrogen fertilizer level on non-structural carbon and nitrogen metabolite levels in oats grown in sandy desert soil. Acta Prataculturae Sin. 2018, 27, 61. [Google Scholar] [CrossRef]
  33. Jiang, D.; Cao, W.; Dai, T.; Qi, J. Activities of key enzymes for starch synthesis in relation to growth of superior and inferior grains on winter wheat (Triticum aestivum L.) spike. Plant Growth Regul. 2003, 41, 247–257. [Google Scholar] [CrossRef]
  34. Wang, F.; Chen, S.; Cheng, F.; Liu, Y.; Zhang, G. The differences in grain weight and quality within a rice (Oryza sativa L.) panicle as affected by panicle type and source-sink relation. J. Agron. Crop Sci. 2007, 193, 63–73. [Google Scholar] [CrossRef]
  35. Li, Y.; Lu, W.; Lyu, D.; Su, F.; Liu, S.; Li, H.; Wang, X.; Liu, Z.; Hu, L. Effects of different nitrogen application rates on starch accumulation, starch synthase gene expression and enzyme activity in two distinctive potato cultivars. Potato Res. 2018, 61, 309–326. [Google Scholar] [CrossRef]
  36. Li, G.; Hu, Q.; Shi, Y.; Cui, K.; Nie, L.; Huang, J.; Peng, S. Low nitrogen application enhances starch-metabolizing enzyme activity and improves accumulation and translocation of non-structural carbohydrates in rice stems. Front. Plant Sci. 2018, 9, 1128. [Google Scholar] [CrossRef] [PubMed]
  37. De Lucena Marinho, J.; Silva, S.R.; de Batista Fonseca, I.C.; Zucareli, C. Nitrogen use efficiency and yield of wheat genotypes affected by nitrogen fertilizing and environmental conditions in Southern Brazil. Int. J. Plant Prod. 2022, 16, 495–510. [Google Scholar] [CrossRef]
  38. Yuan, S.; Ling, Y.; Xiong, Y.; Zhang, C.G.; Sha, L.N.; You, M.H.; Lei, X.; Bai, S.Q.; Ma, X. Effect of nitrogen fertilizer on seed yield and quality of Kengyilia melanthera (Triticeae, Poaceae). PeerJ 2022, 10, e14101. [Google Scholar] [CrossRef] [PubMed]
  39. Wang, W.X.; Shen, C.C.; Xu, Q.X.; Zafar, S.; Du, B.; Dang, D.Y. Grain yield, nitrogen use efficiency and antioxidant enzymes of rice under different fertilizer n inputs and planting density. Agronomy 2022, 12, 430. [Google Scholar] [CrossRef]
  40. Si, Z.; Zain, M.; Mehmood, F.; Wang, G.; Gao, Y.; Duan, A. Effects of nitrogen application rate and irrigation regime on growth, yield, and water-nitrogen use efficiency of drip-irrigated winter wheat in the North China Plain. Agric. Water Manag. 2020, 231, 106002. [Google Scholar] [CrossRef]
  41. Zhong, Y.; Chen, Y.; Pan, M.; Wang, H.; Sun, J.; Chen, Y.; Cai, J.; Zhou, Q.; Wang, X.; Jiang, D. Insights into the Functional Components in Wheat Grain: Spatial Pattern, Underlying Mechanism and Cultivation Regulation. Plants 2023, 12, 2192. [Google Scholar] [CrossRef] [PubMed]
Figure 1. The daily average temperature and rainfall over the spring wheat growth seasons from 28 March to 4 July 2020 and 3 April to 10 July 2021.
Agronomy 14 00312 g001
Figure 2. Diagram of field planting of drip irrigation spring wheat in 2020 and 2021.
Agronomy 14 00312 g002
Figure 3. Effects of nitrogen supply on the activities of sucrose phosphate synthase (SPS) (A) and sucrose synthase (SS) (B) activity in flag leaves of drip-irrigated spring wheat. Note: XC37: Xinchun 37; XC 6: Xinchun 6. CK1: 300 kg·ha−1; A1: 255 kg·ha−1; B1: 210 kg·ha−1; CK2: 0 kg·ha−1. Different lowercase letters indicate significant difference at 0.05 level of treatment.
Agronomy 14 00312 g003
Figure 4. Effects of nitrogen supply on soluble sugar content (A) and sucrose content (B) in flag leaves of drip-irrigated spring wheat. Note: XC37: Xinchun 37; XC 6: Xinchun 6. CK1: 300 kg·ha−1; A1: 255 kg·ha−1; B1: 210 kg·ha−1; CK2: 0 kg·ha−1. Different lowercase letters indicate significant difference at 0.05 level of treatment.
Agronomy 14 00312 g004
Figure 5. Effects of nitrogen supply on sucrose phosphate synthase (SPS) (A) and sucrose synthase (SS) (B) activity in flag leaves of drip-irrigated spring wheat. Note: XC37: Xinchun 37; XC 6: Xinchun 6. CK1: 300 kg·ha−1; A1: 255 kg·ha−1; B1: 210 kg·ha−1; CK2: 0 kg·ha−1. Different lowercase letters indicate significant difference at 0.05 level of treatment.
Agronomy 14 00312 g005
Figure 6. Effects of nitrogen supply on soluble sugar content (A) and sucrose content (B) in grains of drip-irrigated spring wheat. Note: XC37: Xinchun 37; XC 6: Xinchun 6. CK1: 300 kg·ha−1; A1: 255 kg·ha−1; B1: 210 kg·ha−1; CK2: 0 kg·ha−1. Different lowercase letters indicate significant difference at 0.05 level of treatment.
Agronomy 14 00312 g006
Figure 7. Effects of nitrogen supply on adenosine diphosphate glucose pyrophosphorylase (ADPG-PPase) (A) and soluble starch synthase (SSS) (B) activity in grains of drip-irrigated spring wheat. Note: XC37: Xinchun 37; XC 6: Xinchun 6. CK1: 300 kg·ha−1; A1: 255 kg·ha−1; B1: 210 kg·ha−1; CK2: 0 kg·ha−1. Different lowercase letters indicate significant difference at 0.05 level of treatment.
Agronomy 14 00312 g007
Figure 8. Effects of nitrogen supply on starch branching enzyme (SBE) (A) and granule-bound starch synthase (GBSS) (B) activity in grains of drip-irrigated spring wheat. Note: XC37: Xinchun 37; XC 6: Xinchun 6. CK1: 300 kg·ha−1; A1: 255 kg·ha−1; B1: 210 kg·ha−1; CK2: 0 kg·ha−1. Different lowercase letters indicate significant difference at 0.05 level of treatment.
Agronomy 14 00312 g008
Figure 9. Effects of nitrogen supply on starch content in grains of drip-irrigated spring wheat. Note: XC37: Xinchun 37; XC 6: Xinchun 6. CK1: 300 kg·ha−1; A1: 255 kg·ha−1; B1: 210 kg·ha−1; CK2: 0 kg·ha−1. Different lowercase letters indicate significant difference at 0.05 level of treatment.
Agronomy 14 00312 g009
Figure 10. Correlation between different nitrogen application rates and starch content. Note: XC37: Xinchun 37; XC 6: Xinchun 6.
Agronomy 14 00312 g010
Figure 11. Interrelationship between carbon metabolism indicators of flag leaves and grains in drip-irrigated spring wheat. Note: Y: yield; SPSF: sucrose phosphate synthase in flag leaf; SSF: sucrose synthase in flag leaf; SSCF: soluble sugar content in flag leaf; SCF: sucrose content in flag leaf; SPSG: sucrose phosphate synthase in grain; SSG: sucrose synthase in grain; SSCG: soluble sugar content in grain; SCG: sucrose content in grain; ADPG: adenosine diphosphate glucose pyrophosphorylase; SSS: soluble starch synthetase; SBE: starch branching enzyme; GBSS: granule-bound starch synthase; TS: total starch; * and ** indicate significant difference at 0.05 and 0.01 levels.
Agronomy 14 00312 g011
Table 1. The major chemical characteristics of the experimental soil.
YearTotal Nitrogen Content/
(g·kg−1)
Availine Hydrolysis
Nitrogen Content/
(mg·kg−1)
Available Phosphorus Content/
(mg·kg−1)
Available Potassium Content/
(mg·kg−1)
Organic Matter Content/
(g·kg−1)
pH
20201.2058.3014.24137.0113.437.8
20211.2755.7115.96132.0212.847.7
Table 2. Nitrogen application rate for each treatment and growth period (kg·ha−1).
TreatmentNitrogen Application AmountBase Fertilizer
(20%)
Top Dressing
Two-Leaf One-Hearted Stage
(8%)
Tillering Stage
(8%)
Jointing Stage
(32%)
Booting Stage
(16%)
Flowering Stage
(12%)
Milky Maturity Stage
(4%)
CK13006024.024.096.048.036.012.0
A12555120.420.481.640.830.610.2
B12104216.816.867.233.625.28.4
CK2000.00.00.00.00.00.0
Table 3. Effect of reduced nitrogen fertilizer treatment on spring wheat yield and its components of spring wheat under drip irrigation.
Variety
(V)
Treatment
(N)
20202021
1000-Grain Weight/(g)Spike Number/(×104·ha−2)Grains per SpikeGrain Yield
/(kg·ha−1)
1000-Grain Weight·(g)Spike Number/
(×104·ha−2)
Grains per SpikeGrain Yield
/(kg·ha−1)
XC37CK146.83 a415.16 bc36.08 b6932.75 c45.67 abcd415.64 b36.63 ab6895.81 c
A147.83 a431.61 a38.78 a7257.5 a47.09 a435.75 a37.39 ab7170.56 a
B145.34 bc413.27 bc37.76 ab6818.6 d46.62 ab410.95 bc38.03 a6782.11 d
CK243.08 d389.08 d33.38 c5444.33 f44.67 cd393.95 cd34.49 c5664.87 f
XC 6CK146.46 ab413.08 bc36.04 b6881.06 c45.14 bcd410.27 bc36.34 b6648.67 e
A147.08 a423.76 ab36.61 b7091.44 b46.84 a427.62 ab37.04 ab7053.33 b
B144.97 c408.77 c37.42 ab6736.09 e46.21 abc407.15 bc37.69 ab6697.73 de
CK242.76 d384.07 d32.91 c5364.23 g44.24 d382.15 d34.07 c5383.47 g
FVns*ns**ns**ns**
N****************
N × V********
Note: XC37: Xinchun 37; XC 6: Xinchun 6. CK1: 300 kg·ha−1; A1: 255 kg·ha−1; B1: 210 kg·ha−1; CK2: 0 kg·ha−1. V: variety, N: different nitrogen treatments. F: effect of two factors simultaneously on the average response in two-way analysis of variance. “*”: (p < 0.05). “**”: (p < 0.01). ns: indicates no significant difference at the 0.05 probability level. Values followed by different letters are significantly different at the 0.05 probability level within a column in the same year.
Disclaimer/Publisher’s Note: The statements, opinions and data contained in all publications are solely those of the individual author(s) and contributor(s) and not of MDPI and/or the editor(s). MDPI and/or the editor(s) disclaim responsibility for any injury to people or property resulting from any ideas, methods, instructions or products referred to in the content.

