Article

Combining Image-Based Phenotyping and Multivariate Analysis to Estimate Fruit Fresh Weight in Segregation Lines of Lowland Tomatoes

1
Department of Agronomy, Faculty of Agriculture, Hasanuddin University, Makassar 90245, Indonesia
2
Department of Agriculture, Food, Environment and Forestry (DAGRI), University of Florence (UNIFI), Piazzale delle Cascine 18, 50144 Florence, Italy
3
Department of Agricultural Technology, Faculty of Agriculture, Hasanuddin University, Makassar 90245, Indonesia
4
Faculty of Vocational, Hasanuddin University, Makassar 90245, Indonesia
5
Agrotechnology Study Program, Faculty of Agriculture, Universitas Sembilanbelas November, Kolaka 93514, Indonesia
6
Department of Biology, State University of Makassar, Makassar 90222, Indonesia
7
Agrotechnology Study Program, Faculty of Agriculture, Hasanuddin University, Makassar 90245, Indonesia
8
Agrotechnology Study Program, Graduate School, Hasanuddin University, Makassar 90245, Indonesia
9
Agricultural Science Study Program, Graduate School, Hasanuddin University, Makassar 90245, Indonesia
*
Author to whom correspondence should be addressed.
Agronomy 2024, 14(2), 338; https://doi.org/10.3390/agronomy14020338
Submission received: 26 October 2023 / Revised: 17 January 2024 / Accepted: 26 January 2024 / Published: 6 February 2024
(This article belongs to the Special Issue Imaging Technology for Detecting Crops and Agricultural Products-II)

Abstract

:
The fruit weight is an important guideline for breeders and farmers to increase marketable productions, although conventionally it requires destructive measurements. The combination of image-based phenotyping (IBP) approaches with multivariate analysis has the potential to further improve the line selection based on economical trait, like fruit weight. Therefore, this study aimed to evaluate the potential of image-derived phenotypic traits as proxies for individual fruits weight estimation using multivariate analysis. To this end, an IBP experimentation was carried out on five populations of low-land tomato. Specifically, the Mawar (M; 10 plants), Karina (K; 10 plants), and F2 generation cross (100 lines) samples were used to extract training data for the proposed estimation model, while data derived from M/K//K backcross population (35 lines) and F5 population (50 lines) plants were used for destructive and non-destructive validation, respectively. Several phenotypic traits were extracted from each imaged tomato fruit, including the slice and whole fruit area (FA), round (FR), width (FW), height (FH), and red (RI), green (GI) and blue index (BI), and used as inputs of a genetic- and multivariate-based method for non-destructively predicting its fresh weight (FFW). Based on this research, the whole FA has the greatest potential in predicting tomato FFW regardless to the analyzed cultivar. The relevant model exhibited high power in predicting FFW, as explained by R2-adjusted, R2-deviation and RMSE statistics obtained for calibration (81.30%, 0.20%, 3.14 g, respectively), destructive (69.80%, 0.90%, 4.46 g, respectively) and non-destructive validation (80.20%, 0.50%, 2.12 g, respectively). These results suggest the potential applicability of the proposed IBP approach in guiding field robots or machines for precision harvesting based on non-destructive estimations of fruit weight from image-derived area, thereby enhancing agricultural practices in lowland tomato cultivation.

1. Introduction

Tomato is one of the most widely cultivated horticultural crops in the world [1]. The well-known health and nutritional benefits of tomato, namely vitamins C and E, carotenoids, phenolic compounds, sucrose, hexoses, citrate, malate and ascorbic acid, have led this fruit to be often present in the daily diet [1,2,3]. Such properties correlate with the increasing demand for tomatoes along with population growth [4,5]. However, the global warming experienced in recent years have caused tomatoes to suffer a decline in production and quality [6]. This is mainly dictated by alterations in the growing environment which favor more intense and frequent attacks by parasites and diseases, as well as increased competition phenomena with other crops [7,8,9]. Therefore, it is necessary to identify genotypes adaptable to warmer conditions, especially within global regions most expose to the effects of climate change (e.g., Tropics) [6,10,11]. In particular, the higher temperatures registered in the areas of Asian countries most suited to tomato cultivation (i.e., highlands) has stimulated interest in new varieties adaptable to the climatic conditions typical of lower altitudes [10]. Consequently, the selection of improved tomato cultivars through innovative and effective plant breeding programs is required to safeguard production standards at different altitudes.
Several genetic efforts have been conducted to increase tomato production and quality in the Asiatic lowlands [6,11,12,13]. Cross-breeding programs have allowed the identification of candidate varieties to generate offspring tomato lines better adaptable to new growth conditions, as previously reported for the Mawar (M) and the Karina (K) cultivars [13,14]. The Mawar variety is well adapted to lowland conditions for the production of fruits with a relatively large wavy shape and a high market value given by the richness in nutrients and antioxidants. On the other hand, Karina is a variety grown mainly in middle plains with round shaped fruits [13,15].
The results of crossing M and K varieties have been analyzed in depth regarding traits that have the potential to be used as selection criteria [13,14]. In several studies, the significance of fruit weight stands out as a key determinant in shaping the direction of selection, closely aligned with considerations of overall productivity [14,16,17,18,19]. Furthermore, in the hybridization of these two varieties, both the shape and weight of the fruit exhibit remarkable similarity [13,14]. Consequently, prioritizing the enhancement of fruit weight attributes emerges as a pivotal strategy in steering the course of selection progress. However, the assessment of tomato fruit weight primarily relies on destructive samplings, demanding considerable energy, time, and streamlined processes, especially when dealing with extensive populations [20,21,22,23]. In addition, inaccuracy during the handling process can adversely impact the fruit weight and, consequently, the breeding process [24,25]. Hence, a meticulous approach is imperative for accurately predicting the potential of segregating line populations. Image-based phenotyping (IBP) represents an effective technique for this purpose.
IBP is a digitalization approach in the 4.0 era, encompassing the accurate and non-destructive screening of imaged objects [24,25,26,27,28,29]. The precision of the analysis is dependent on the type of imaging sensors employed, including Red, Green and Blue (RGB) cameras, multispectral cameras, hyperspectral cameras, Light Detection and Ranging (LiDAR) cameras, and Magnetic Resonance Imaging (MRI) [28,29]. The higher spatial resolution of the camera sensor, the more comprehensive the data obtained, especially when integrated with automation and big data concepts, such as high-throughput phenotyping [28,30,31,32,33,34]. In this context, RGB cameras represent an affordable tool which can be used to indirectly obtain reliable information on the agronomic potential of plants and/or crops [27,29,35,36,37,38]. Therefore, phenotypic traits derived from RGB images can serve as inputs for models aimed at predicting tomato fruit weight. This approach not only helps breeders in selection programs but could also contribute to optimize the subsequent robotic harvesting process in the field.
Previous researches has focused on exploring the potential application of IBP techniques for analyzing both tomato fruits [26,38,39,40] and canopy [41,42]. Specifically, Nyalala et al. [26,38] highlighted the efficacy of IBP in non-destructively predicting tomato fruit weight. Although their results were satisfactory (1.47 ≤ RMSE ≤ 15.84 g and 0.92 ≤ R2 ≤ 0.97), it’s important to note that the proposed predictive models are applicable exclusively to a specific tomato cultivar (i.e., cherry tomato) and lack generalizability to other larger-fruited varieties. Similarly, studies conducted by Taheri-Garavand et al. [43] and de Luna et al. [44] employed IBP for assessing fruit size and weight of specific tomato genotypes (R2 ≥ 0.90), but their method was exclusively destructive. Therefore, evaluating the potential application of IBP for non-destructively predicting tomato fruit weight is an essential research topic, particularly in lowlands F2 lines characterized by high segregation complexity and large population sizes [6,45]. To ensure optimal generalizability, a systematic analysis of the image-derived traits is essential for identifying the appropriate inputs for the predictive model.
Multivariate analysis stands out as a solution for systematically determining potential predictive traits, as reported by [46,47,48,49]. This approach involves gathering all dimensions of an extensive crop data collection to be processed collectively, leading to a more straightforward interpretation [15,50,51]. Although several studies have employed multivariate analysis on image-derive phenotypic traits [37,38,52,53], the joint application of IBP and multivariate analysis in detecting tomato fruit fresh weight has not been extensively tested, particularly in segregated populations.
Building upon previous research efforts, this study aims to address the critical need for a generalized and non-destructive predictive model applicable to lowland tomato varieties. To this end, a multivariate approach was developed to systematically analyze image-derived phenotypic traits, providing a comprehensive understanding of the best predictor for tomato fruit fresh weight.

2. Materials and Methods

2.1. Plant Material and Growing Conditions

The research was conducted from January to May 2022 on the Mawar (M) variety, Karina (K) variety, and their respective crossbreed populations, including F2 and M/K//K backcross Additionally, an investigation into the F5 population was carried out in October 2023. Each parent was represented by 10 plant samples, while the F2 cross-segregation population consisted of 100 lines. In contrast, the backcross population and F5 populations were comprised of 35 lines and 50 lines, respectively. Field experiments were carried out at the Experimental Garden of the Faculty of Agriculture, Hasanuddin University, located in Tamalanrea District, Makassar City, South Sulawesi (Indonesia). The elevation of the location is 22.4 m above sea level.
Sowing was conducted using a planting medium comprising a blend of soil, burnt husks, and compost in a ratio of 2:1:1. The prepared planting medium was then placed in seedling trays and thoroughly saturated with water to ensure even distribution. Subsequently, tomato seeds were sown and treated with Furadan to mitigate potential disturbances or pest attacks. Seedlings maintenance involved daily watering, and after 7 days after sowing (DAS), Goodplant Ab mix fertilizer was applied at a concentration of 5 mL per 1 L. This fertilizer contains essential nutrients such as N Total (20.7%), P2O5 (5.1%), K2O (24.80%), MgO (5.1%), CaO (14.5%), S (8.9%), Fe (0.10%), Mn (0.05%), Cu (0.05%), B (0.03%), Zn (0.02%), and Mo (0.001%).
Upon reaching 30 DAS, transplanting was carried out into beds constructed with a width of 80 cm and a length of 2.5 m, spaced 30 cm apart, and with a height of 30 cm. The beds were covered with silver mulch and perforated according to the planting distance, specifically 50 cm between rows and 80 cm within rows. Watering was conducted twice daily, both in the morning and evening, until the soil achieves a consistently damp appearance. Replanting occurred 7–14 days after transplanting (DAT) for tomato seedlings exhibiting abnormal growth, wilting, or pest and disease infestations. In such cases, affected samples were replaced with new ones matching their genetic code. Plant fertilization was initiated at 7 DAT and subsequently applied weekly. Mutiara NPK (16:16:16) fertilizer, at a concentration of 10 g/L of water, was used initially. During the generative phase, this was replaced with KNO3 at a concentration of 5 g/L. Each plant received 200 mL of the fertilizer solution. Additionally, foliar fertilization was conducted using Gandasil D and Gandasil B during the vegetative and generative phase, respectively. Pruning involved the removal of small shoots in the leaf axils, directing the tomato’s growth towards the main stem, while weeds hindering plant growth were manually removed in the planting area or treated with herbicide between the beds. The final maintenance stage involved controlling pests and diseases weekly. To this end, a combination of 2 cc/L of water of insecticide Curacron 500 EC and 2 g/L of water of fungicide Antracol 70 WP were alternated with Dhitane M-45 WP at a concentration of 2 g/L of water, replacing Antracol 70 WP to enhance efficacy. Pesticides were applied through surface spraying on the plants. Finally, periodic harvests, occurring up to three times over an 8-week span, were conducted to achieve optimal genetic potential in tomatoes, with the readiness for collection indicated by fruits displaying a reddish-yellow color.

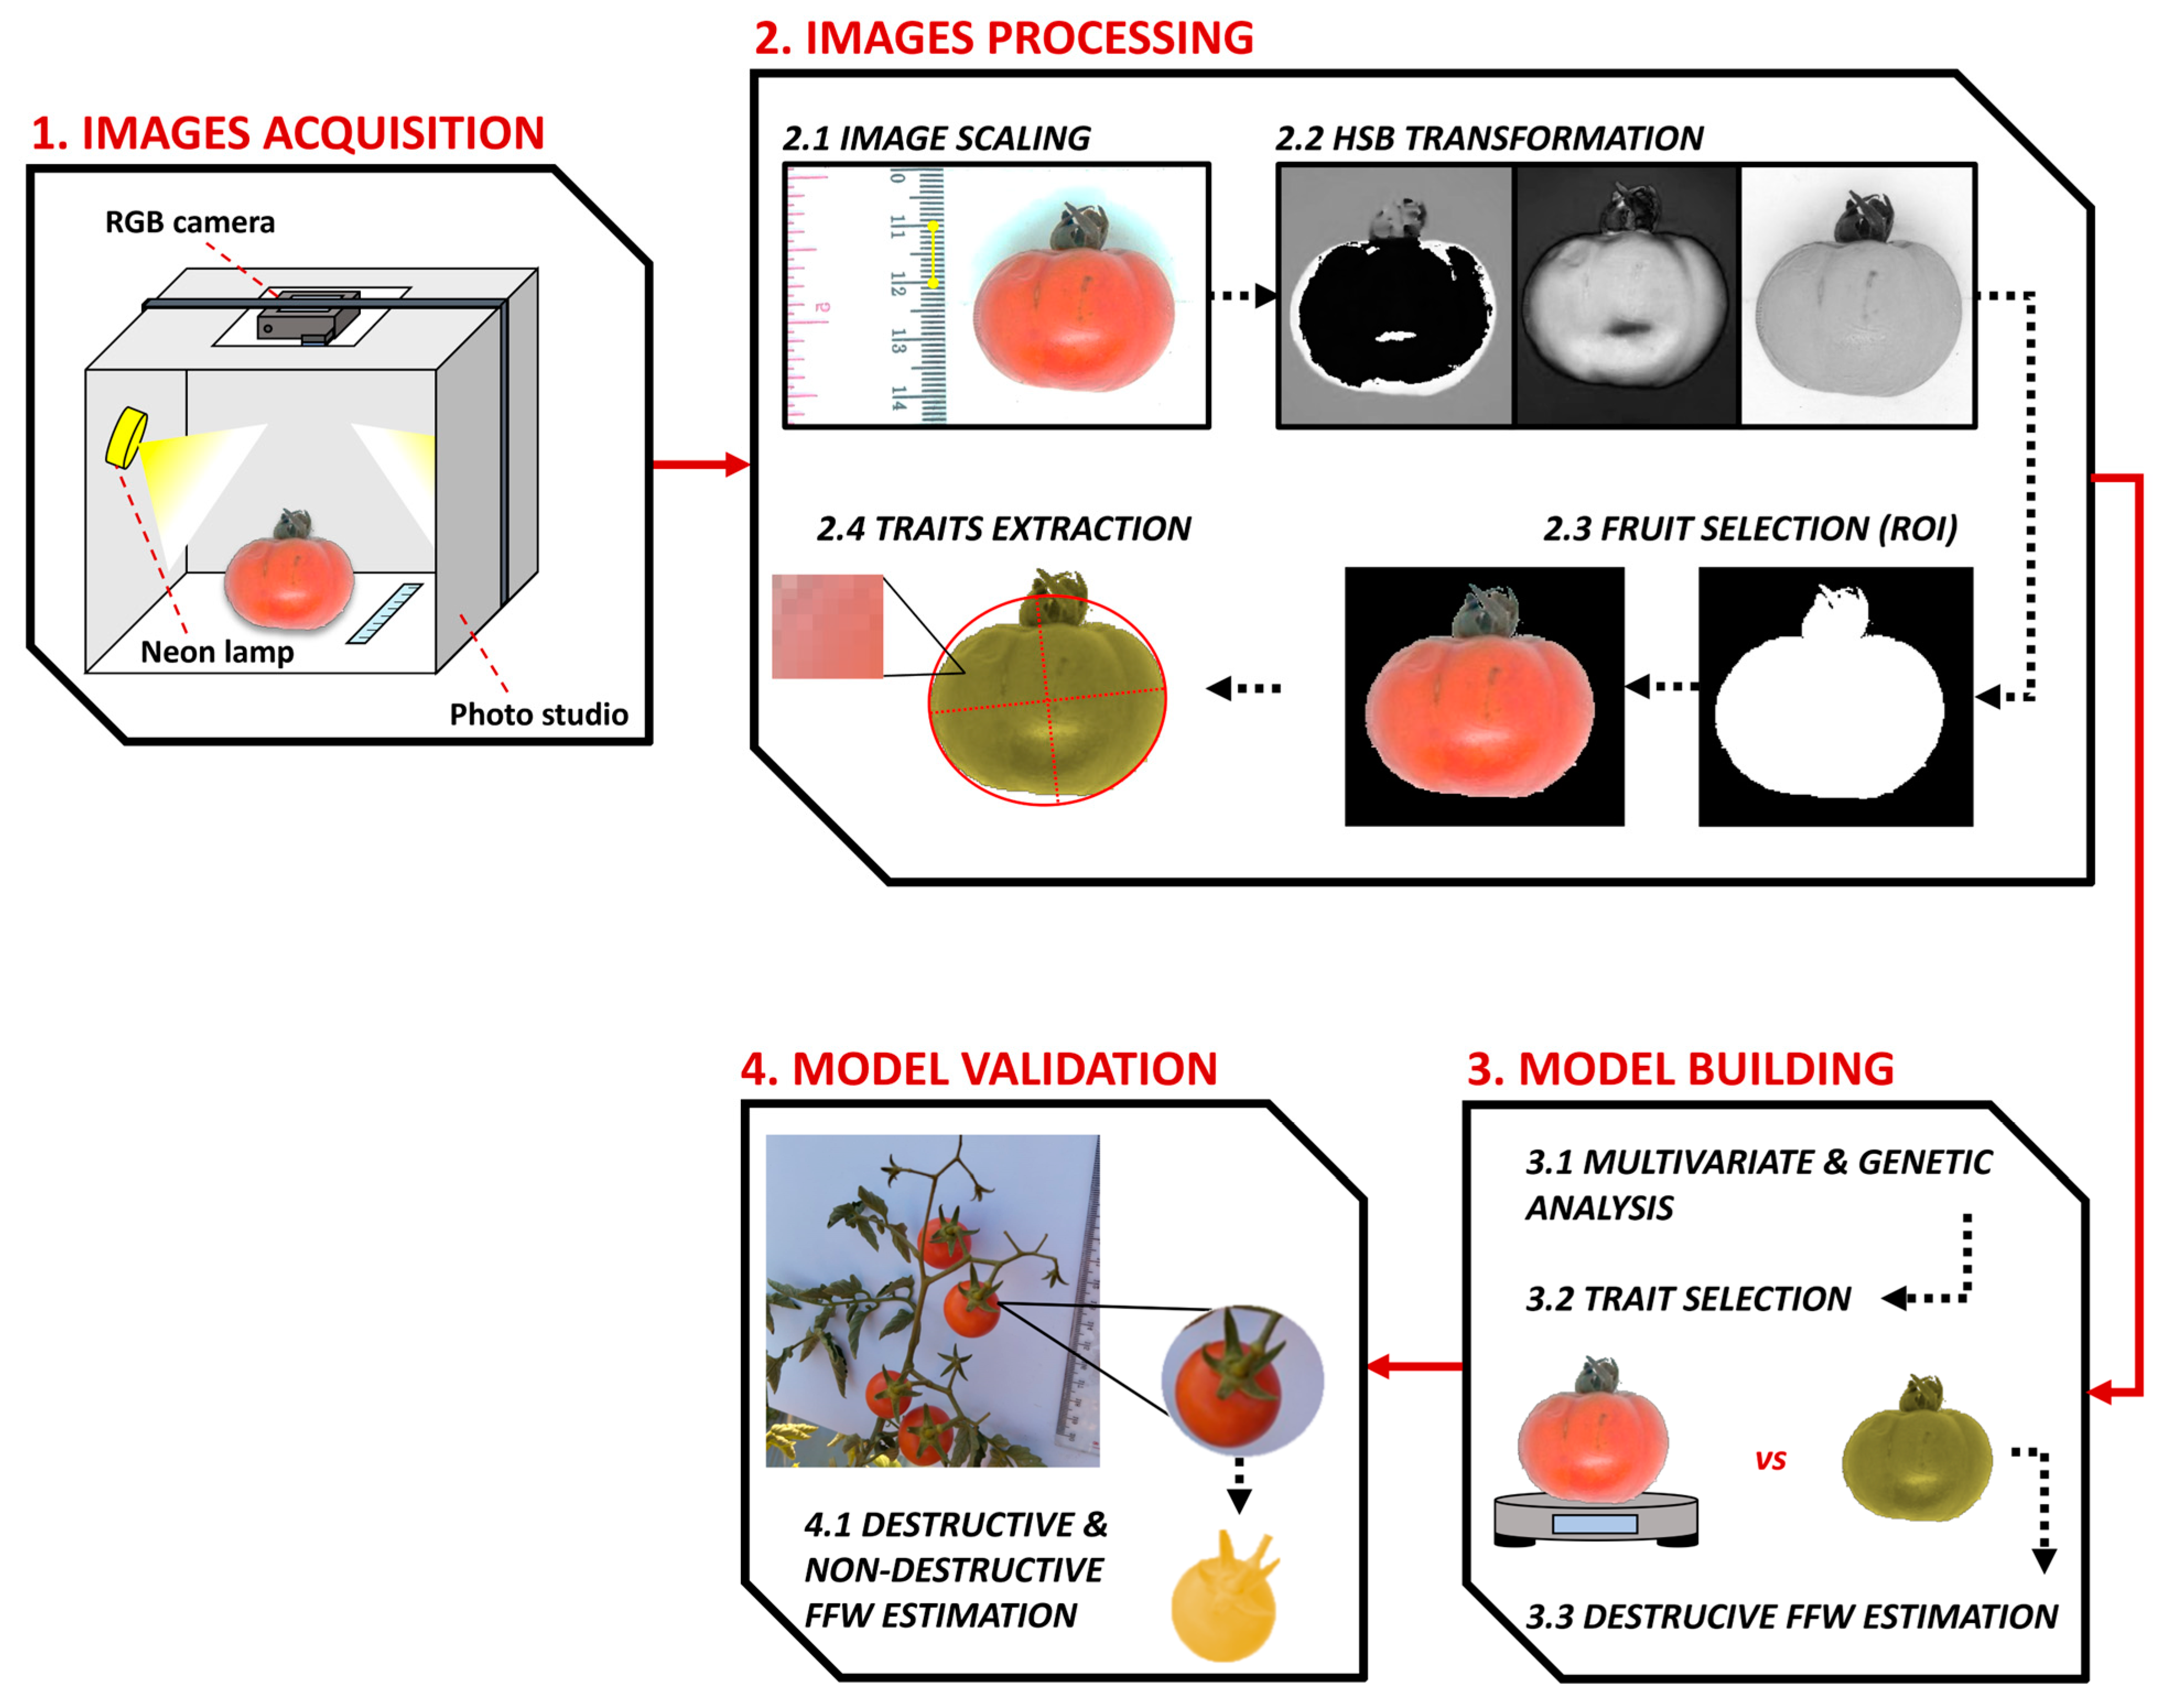
2.2. Fruits Imaging and Traits Extraction

The detached tomato fruits were firstly weight on a precision scale for obtaining the weight of whole and sliced fresh fruit (FFW; g) and subsequently photographed at the Agronomy Department of Hasanuddin University (Indoensia) for phenotypic traits extraction. Five tomato samples were collected from all plants in each generation, except for F5, for which only two samples were directly photographed on the plant. In total, 875 photos were gathered for IBP analysis (Figure 1).
Specifically, each sample was placed onto a portable lightbox photography studio (50 cm × 50 cm × 50 cm) and illuminated with an 8-watt LED light against a white background to better distinguish the fruit shape. Taking photos in destructive concept is also arranged by placing the fruit in the best or widest position, so that the fruit has an optimal area to photograph. This is so that the photo can represent the true trait. A Canon® EF 28–135 mm f/3.5–5.6 commercial camera (Canon Inc., Tokyo, Japan) was fixed on the top-hole of the box ensuring a 90-degree vertical shooting. For each sample, 1 top-view RGB image was collected by setting the camera with 5.6 F-stop, 1/160 s exposure time, ISO 800 and no-flash mode. The scene also included a graduated ruler with markings every 1 mm as a reference scale to xy-metrically calibrate the image. Meanwhile, non-destructive shooting is done with a white background too. This aims to sharpen the ruler scale when taking photos of fruit directly in the field, so that the model could be optimize in prediction. In addition, non-destructive photography is also done by taking the best or widest angle of the target fruit in the field. This also aims to ensure that the model formed at the initial development stage can be optimized in predicting fruit fresh weight (FFW; g) as the primary trait.
Fiji® open-source software [54] was used to semi-automatically obtain phenotypic measurements from individual tomato scans, as similarly reported by Woolf et al. [55] and Ayenan et al. [56]. Firstly, the ruler markings were manually selected and used to calculate a scaling factor for obtaining absolute morphometric values. Subsequently, foreground objects (i.e., fruit) were segmented from the background pixels by applying a triangle thresholding method. In particular, the original RGB colorspace was automatically converted to a Hue, Saturation, Brightness (HSB) stack to emphasize spectral dissimilarities between vegetal and non-vegetal features. In the HSB model, H (0–360°) differentiates pure colors while S (0–100%) and B (0–100%) characterizes the shade and the overall brightness of the color, respectively, offering manipulable indicators for intuitive selection of foreground and background color-fingerprints. To this end, the HSB histogram of the whole stack was computed, and the ideal threshold (THR) automatically identified as the point of maximum distance between the histogram and the line connecting its peak to the farthest end [57]. Thus, the pixels outside THR were labelled as ‘0′ (i.e., background), while the remaining points were coded as ‘1′ (i.e., fruit). The original RGB image was superimposed to the resulted binary mask to retrieve solely the region of interest (ROI). Then, the ROI was automatically analysed to measure the whole and slice fruit area (FA), round (FR), width (FW), height (FH), and red (RI), green (GI) and blue index (BI). Specifically, FA was obtained as the surface of all the selected pixel (cm2), FR was the length of the outside boundary of the ROI (cm), while FW and FH represented the maximum x- and y-axis length of a fitted ellipse (cm), respectively. Finally, RI, GI and BI were calculated as the average red-, blue- and green-channel value of all the ROI pixels. As the fruit’s appearance was categorized into whole and sliced, a total of 14 image-based phenotyping traits per sample was extracted.

2.3. Development of the Fruit Fresh Weight Estimation Model

The analysis of fruit-derived data involved an initial examination of genetic parameters (i.e., heritability analysis), wherein heritability values were categorized into three groups: high (>50%), medium (20–50%), and low (<20%) [58]. Subsequently, Pearson correlation analysis was conducted, and image-based phenotyping traits demonstrating a significant positive correlation proceeded to path and multiple regression analyses using the “agricolae” package in Rstudio® 3.6.3 [59]. The results were then subjected to secondary trait (i.e., phenotypic predictors) validation, encompassing the (i) analysis of selection intensity, (ii) genetic progress percentage, and (iii) effectiveness of secondary traits. The selected secondary traits were combined into a linear regression analysis model for FFW estimation [38,40,59]. Then, destructive and non-destructive data from the backcross M/K//K and F5 samples were used for validating the predicting mode. Such generations were chosen due to their optimal diversity, as they consistently exhibited robust segregation characteristics [60,61,62].

2.3.1. Selection Intensity and Genetic Progress Percentage

Selection intensity (i) represents the mean of the selected proportion in phenotypic standard deviations, enabling the comparison of the effectiveness of each selection when considered collectively (Equation (1)). Following previous researches [21,63], i was employed to assess the effectiveness of selected secondary traits.
i = ( x i x ¯ ) S D
where x i represents the average value of the i-th lines, x ¯ is the general average value, and SD refers to the standard deviation.
The selection progress (ΔG%) was included in the model evaluation process to gain more effective results (Equation (2)). Indeed, the ΔG% explains the extent to which the mean value of the chosen population undergoes alteration upon continuation into the next generation [5,64,65]
G % = x i x ¯ × h 2 x ¯ × 100 %
where h 2 represents the heritability.

2.3.2. Effectiveness of Secondary Traits

The ultimate validation assessment involved the evaluation of the efficacy of secondary traits (Equation (3)). This analysis aims to discern the secondary trait’s effectiveness in indirectly predicting the success of selection on the primary trait [66,67].
C R x R x = r g × ( i y × h y ) ( i x × h x )
where CRx/Rx is the effectiveness of secondary traits, rg represents the genetic correlation between secondary and primary traits, while y indicates the secondary traits and x the primary trait.

2.3.3. Model Sensitivity and Effectivness

The sensitivity and effectiveness of the developed model were further assessed through the analysis of confidence interval (CI), prediction interval (PI), determination value (R2; Equation (4)), determination adjustment value (R2-adjusted; Equation (5)), and root mean square error (RMSE; Equation (6)).
CI and PI are statistics commonly used for evaluating models’ sensitivity. CI indicates the accuracy of model estimates with a certain confidence level from samples, while PI explains the prediction range of a new object entering a population based on a regression analysis. R2 and adjusted R2 show how much the independent variable determines a proportion of the variance in the dependent variable. Adjusted R2 places more emphasis on penalizing the addition of independent variables, measuring the goodness of fit in forming a model [68,69]. Finally, RMSE serves as an error validation method typically conducted by assessing the average standard deviation or the disparity between predicted and actual outcomes [68].
R 2 = 1 S S r e s i d u a l S S t o t a l
A d j u s t e d   R 2 = 1 S S r e s i d u a l ( n K ) S S t o t a l ( n 1 )
R M S E = 1 n i = 1 n ( X i Y i ) 2
where SS is the sum square, n represents number of data, K refers to the number of parameters fit by the regression, while Xi and Yi are the predicted and actual value, respectively.

3. Results

The heritability results of each image-derived phenotypic trait are shown in Table 1. There was no statistically significant difference in the average values ( x ¯ ) across genotype backgrounds for all fruit image-based phenotyping (IBP) traits, including fruit fresh weight (FFW). Although Karina samples (parents) exhibited relatively higher FFW compared to other genotypes, this difference lacked statistical significance. In contrast, there were significant differences in the diversity of values among genotype backgrounds, with the F2 population displaying higher diversity than other samples ( σ 2 ). Notably, traits showing low- to medium-range heritability (H) included fruit fresh weight (34.44), whole fruit area (37.47), whole fruit roundness (27.79), whole fruit width (39.69), whole fruit height (43.73), whole blue index (31.96), wide fruit slices (26.39), area of fruit slices (29.76), height of fruit slices (45.64).
Figure 2 displays the results of the correlation analysis among various image-derived phenotyping traits and destructively collected FFW. In general, the whole fruit height (0.68), slice fruit area (0.66), whole fruit area (0.73), slice fruit height (0.69), whole fruit width (0.71), and slice fruit width (0.68) showed a significant positive correlation both among the traits and with FFW. A significant positive correlation was also observed between the traits’ red index, green index, and blue index in both whole and sliced fruits. Conversely, the whole fruit round negatively correlated with both whole (−0.33) and slice fruit width (−0.31).
The path analysis results revealed that whole fruit width (WFW) has a direct impact on fruit weight, with a coefficient of 0.6 (Table 2). This trait also exerted a substantial indirect influence on other phenotypic traits. In addition to WFW, fruit fresh weight was directly influenced by both whole fruit area and whole fruit height, each having a corresponding coefficient of 0.21. Conversely, the trait with the least direct influence resulted the wide fruit slice (−0.49).
Traits that exhibited positive correlations with FFW were then selected as inputs for the stepwise multiple regression analysis, leading to the development of an estimation model with a reasonably high determination value (0.544; Table 3). The model incorporates three traits for predicting FFW: intercept, whole fruit area (WFA), and WFW. However, upon single component analysis, solely the WFA emerged as significantly significant trait based on the student t-test.
Validation of secondary traits was carried out by the three genetic approaches showed in Table 4. When considering the intensity of selection through direct selection, the fruit fresh weight exhibited the highest intensity (4.09), followed by whole fruit area (4.06) and whole fruit width (0.90). In terms of selection intensity with indirect selection, the WFA resulted, instead, in a selection intensity of 3.66 for fruit weight, while the WFW yielded a lower value (3.53). Examining the percentage of selection progress through direct selection, FFW resulted in the highest progress (39.05%), followed by WFA (29.29%) and WFW (15.90%). Concerning selection progress through indirect selection, FFW showed a progress of 12.53% when selection is focused on the WFA. Conversely, when the focus shifted to the WFW, FFW demonstrated a lower selection intensity of 12.06%. Accordingly, the effectiveness of selection progress based on secondary traits revealed that the WFA has an effectiveness of 0.68 in representing FFW, while the WWF only reached a value of 0.32.
As shown in Figure 3 and Table 5, the derived model for estimating fruit fresh weight based on whole fruit area extracted from the training samples is expressed as: FFW = −4878 + 2619 × WFA. Notably, only 3 points out of 110 total samples fell outside the confidence interval (CI) line, with the majority residing within the prediction interval (PI; Figure 3). In addition, the training model was characterized by high R2 and adjusted-R2 values (81.5 and 81.3, respectively), with a reasonably low error (RMSE = 3.14 g; Table 3).
The model was validated by considering image-derived data from other populations, namely M/K//K backcross crosses and F5 population for destructive and non-destructive validation, respectively. Based on the destructive validation depicted in Figure 4, the whole fruit area exhibited a relatively high model determination value for FFW. This was further corroborated by the absence of samples outside the confidence interval (CI) area, although a few samples extended beyond the prediction interval (PI). Additionally, the robustness of this model was supported by the validation metrics, including R2-Deviation and RMSE, which closely aligned with the training data at 0.9 and 4.46, respectively (Table 5). Similarly, non-destructive validation (Figure 5) demonstrated the high effectiveness of the WFA-driven model in predicting FFW. The determination was notably robust, further validated by R2-Deviation (0.5) and RMSE (2.12 g) values comparable to the training data and destructive validation (Table 5).

4. Discussion

The results of this study revealed noteworthy insights into the distribution of phenotypic traits along different lowland tomato varieties. Although the F2 population’s mean values generally aligned closely with those of its parental counterparts and F1 generation, certain traits exhibited lower averages compared to other background genotypes. This discrepancy suggests that specific F2 genotypes manifest deficient scores in comparison to both parents and F1 line for specific traits. Nevertheless, it is imperative to recognize that the manifestation of phenotypes is not solely governed by the segregation process resulting from the cross. This is evident in the heritability values associated with fruit traits, which consistently fell within the low to medium range. Such results underscored the prevailing influence of environmental factors on the phenotypic expression of tomato fruit traits [6,70,71]. However, the moderate heritability observed in this study provided a valuable reference for the selection of image-derived phenotypic traits as proxies for fruit fresh weight (FFW). Notably, the application of the proposed image-based phenotyping (IBP) pipeline guaranteed the extraction of morphological variables with superior heritability compared to the principal trait (i.e., FFW). According to Acquaah [71], Lozada [67], and Fadhilah et al. [14], this result reflects the essential criterion for a valuable secondary trait to possess a superior heritability than the variable to be estimated. Consequently, the effective IBP-based measurement of secondary traits to estimate FFW in different segregation lines of lowland tomatoes emerges as a notable outcome of this research.
Within the framework of predictive models, the inclusion of numerous predictors unrelated to the primary trait could introduce considerable bias [69,72,73,74]. Indeed, while these additional data may seemingly enhance the estimation accuracy, their contributions often yield variations that lack substantial supplemental information in model development [71]. Therefore, a correlation analysis was performed to systematically minimize the inputs required for an accurate estimate of the FFW. Correlation is a commonly used approach for reducing the number of phenotypic traits that exhibit the potential to be candidates as predictors, as previously stated for maize [51], rice [54] and tomato [15,20,74,75,76]. Results highlighted specific phenotypic traits, namely whole fruit height (WFH), slice fruit area (SFA), whole fruit area (WFA), slice fruit height (SFH), whole fruit width (WFW), and slice fruit width (SFW), as optimal candidates for serving as predictors of the tomato fresh weight.
Aiming to identify the most powerful trait for accurately estimating the FFW, our study employed the convergence of stepwise multiple regression and path analysis, following [46,59,75,76,77]. Accordingly, these methodologies complement each other, performing integrated roles [48,59]. Stepwise multiple regression represents a systematic and gradual reduction analysis which combines information from different variables [46,59,78]. This approach mitigates information loss that can occur when comparing one model with others [78], ensuring that the resulting model effectively encapsulates all relevant information derived from each selected independent variable. Nevertheless, stepwise multiple regression could not fully explain how individual independent variables influence the dependent variable. To address this limitation, path analysis can improve the understanding of how each independent variable contributes to the overall variance of the dependent variables [14,46,59,79], thus resulting essential to validate the established model [80,81]. Here, both analyses identified whole fruit area (WFA) and width (WFW) as potential secondary traits, with crosscheck results revealing a significant direct influence of WFW to the fruit fresh weight, followed by WFA and whole fruit height (WFH). However, the regression analysis presented varying results, emphasizing the importance of further validation to increase the level of confidence in the estimations [40,82,83,84,85].
In this context, the selection intensity [63,86,87], percentage of genetic progress [5,65,88] and the effectiveness of secondary traits [66,67,89] genetic approaches were applied to enhance the precision of identifying optimal predictor in segregating tomato populations. Previous researches consistently underscored the effective shared ability of such genetic methodologies to compare secondary traits, particularly in F2 populations [6,14,90,91]. In this study, despite WFW displaying higher direct influence and heritability values compared to whole fruit area WFA, this superiority was deemed genetically insufficient to consider WFW as a valuable predictor. Conversely, the WFA emerged as a reliable proxy of FFW. This result was consistently observed across various direct and indirect selection methods, highlighting the robust effectiveness of WFA in predicting the FFW within the proposed IBP framework. Such evidence aligns with the findings previously reported by various researchers on several plant species [24,27,37,92,93], including tomato [22,38,39,40].
The accuracy and robustness of the developed WFA-driven estimation model (FFW = −4878 + 2619 × WFA) was both qualitatively and quantitatively ascertained. Moreover, the effective destructive and non-destructive validation of the estimates obtained in different tomato populations reinforced the generalization ability of the model (R2 = 80.7%, Adjusted-R2 = 80.2, and RMSE = 2.12 g). In this context, the proposed non-destructive pipeline achieved a similar or even greater accuracy of existing IBP destructive methods which were exclusively focused on estimating the fruit weight of a specific variety, with errors ranging from 1.27 g [26] to 15.84 g [38]. Encouragingly, the outcome of the non-destructive validation raises promising prospects for the model’s effectiveness in directly evaluating tomato fruit weight within field conditions. Indeed, although the model may not accurately detect very light fruits (i.e., negative estimated values shown in Figure 5), this represents a negligible limitation for the workflow’s applicability considering the size and weight standards of the marketable tomatoes at the harvest time. Accordingly, the proposed model could guide field robots or machines in the efficient harvesting of tomato fruits, ensuring the direct identification of those that do not meet market needs while still on the plant.
Nevertheless, the potentialities of this model invite further optimization through the incorporation of more advanced sensors (e.g., multispectral and/or hyperspectral cameras) or cutting-edge image-based phenotyping technologies (e.g., 3D-modeling). This could led to the comprehensive analysis of more complex phenotypic traits involved in the formation of the fruit weight and quality, as well as in predicting the effects of biotic and/or abiotic stressors on marketable tomato yield [29,33,94,95,96]. Consequently, the proposed pipeline could also serve as an efficient, straightforward, and rapid tool for breeding tomato varieties highly resilient to climate change in lowland areas.

5. Conclusions

In this study, multivariate analysis emerged as a highly efficacious approach for identifying pivotal image-derived phenotypic traits for predicting the final yield of lowland tomato segregation lines. Notably, the whole fruit area (WFA; cm2) displayed considerable potential in estimating single fruit fresh weight (FFW; g). The proposed model, expressed as FFW = −4878 + 2619 × WFA, demonstrated robustness and generalizability. Indeed, methodological rigor characterizes the model’s construction and validation, encompassing a comprehensive array of populations and validations, spanning both destructive and non-destructive paradigms. This model is therefore recommended for the proactive selection of tomato lines most adaptable to novel lowland environmental conditions, with envisioned utility in the realm of automated harvest robotics for discerning marketable fruits during harvesting operations.

Author Contributions

Conceptualization, M.F., M.F.A., R.R., F.H., K.M., A.D., S.H.L. and M.M.; validation, M.F.A. and R.R.; formal analysis, M.F.A., R.R. and A.I.S.; investigation, S.A.M.T., N.A. and M.A.I.A.; resources, A.A. and M.F.; data curation, A.D. and M.F.A.; writing—original draft preparation, M.F.A., M.F. and R.R.; writing—review and editing, M.F., A.D., S.H.L., M.M. and A.A.; visualization, M.F.A.; supervision, M.F., F.H. and K.M. All authors have read and agreed to the published version of the manuscript.

Funding

This research was supported by the Ministry of Education, Culture, Research, and Technology of the Republic of Indonesia through the scheme of Penelitian Fundamental kolaboratif UNHAS (UNHAS Fundamental Research Collaborative) with grant number 1474/UN4.22/PT.01.03/2022.

Data Availability Statement

Data are contained within the article.

Acknowledgments

We are grateful to Hasanuddin University’s publication management center for providing facilities, such as training workshops and Enago proofreading for this article.

Conflicts of Interest

The authors declare no conflict of interest and the funders had no role in the design of the study; in the collection, analyses, or interpretation of data; in the writing of the manuscript; or in the decision to publish the results.

References

  1. Quinet, M.; Angosto, T.; Yuste-Lisbona, F.J.; Blanchard-Gros, R.; Bigot, S.; Martinez, J.P.; Lutts, S. Tomato Fruit Development and Metabolism. Front. Plant Sci. 2019, 10, 1–23. [Google Scholar] [CrossRef] [PubMed]
  2. Martí, R.; Roselló, S.; Cebolla-Cornejo, J. Tomato as a Source of Carotenoids and Polyphenols Targeted to Cancer Prevention. Cancers 2016, 8, 58. [Google Scholar] [CrossRef] [PubMed]
  3. Li, Y.; Wang, H.; Zhang, Y.; Martin, C. Can the World’s Favorite Fruit, Tomato, Provide an Effective Biosynthetic Chassis for High-Value Metabolites? Plant Cell Rep. 2018, 37, 1443–1450. [Google Scholar] [CrossRef] [PubMed]
  4. Airoboman, F.A.; Onobhayedo, A.O. An Inquest into the Impacts of Population Pressure on the Natural Environment and Human Society. KIU J. Humanit. 2022, 7, 211–218. [Google Scholar]
  5. Rasheed, A.; Ilyas, M.; Khan, T.N.; Mahmood, A.; Riaz, U.; Chattha, M.B.; Al Kashgry, N.A.T.; Binothman, N.; Hassan, M.U.; Wu, Z.; et al. Study of Genetic Variability, Heritability, and Genetic Advance for Yield-Related Traits in Tomato (Solanum lycopersicon Mill.). Front. Genet. 2023, 13, 1–13. [Google Scholar] [CrossRef] [PubMed]
  6. Mawasid, F.P.; Syukur, M. Trikoesoemaningtyas Epistatic Gene Control on the Yield of Tomato at Medium Elevation in the Tropical Agroecosystem. Biodiversitas 2019, 20, 1880–1886. [Google Scholar] [CrossRef]
  7. Skendžić, S.; Zovko, M.; Živković, I.P.; Lešić, V.; Lemić, D. The Impact of Climate Change on Agricultural Insect Pests. Insects 2021, 12, 440. [Google Scholar] [CrossRef]
  8. Schneider, P.; Asch, F. Rice Production and Food Security in Asian Mega Deltas—A Review on Characteristics, Vulnerabilities and Agricultural Adaptation Options to Cope with Climate Change. J. Agron. Crop Sci. 2020, 206, 491–503. [Google Scholar] [CrossRef]
  9. Xiao, Y.; Wang, M.; Song, Y. Abiotic and Biotic Stress Cascades in the Era of Climate Change Pose a Challenge to Genetic Improvements in Plants. Forests 2022, 13, 780. [Google Scholar] [CrossRef]
  10. Romadhon, M.R.; Sutjahjo, S.H.; Wirnas, D. Interaction Genetic x Environment Putatif Mutant Lines Tomato M5 on Two Agro Ecosystems. Int. J. Agron. Agric. Res. 2017, 10, 102–112. [Google Scholar]
  11. Yunandra, Y.; Deviona, D.; Zuhry, E.; Syukur, M.; Ardian, A.; Effendi, A.; Nurbaiti, N.; Yoseva, S.; Auliyanda, F.N. Selection Criteria for Lowland Tomatoes (Solanum lycopersicum L.). E3S Web Conf. 2023, 373, 03005. [Google Scholar] [CrossRef]
  12. Mustafa, M.; Syukur, M.; Sutjahjo, S.H. Sobir Inheritance Study for Fruit Characters of Tomato IPBT78 x IPBT73 Using Joint Scaling Test. IOP Conf. Ser. Earth Environ. Sci. 2019, 382, 012009. [Google Scholar] [CrossRef]
  13. Farid, M.; Anshori, M.F.; Ridwan, I. Tomato F3 Lines Development and Its Selection Index Based on Narrow-Sense Heritability and Factor Analysis. Biodiversitas 2022, 23, 5790–5797. [Google Scholar] [CrossRef]
  14. Fadhilah, A.N.; Farid, M.; Ridwan, I.; Anshori, M.F.; Yassi, A. Genetic Parameters and Selection Index of High-Yielding Tomato F2 Population. SABRAO J. Breed. Genet. 2022, 54, 1026–1036. [Google Scholar] [CrossRef]
  15. Farid, M.; Nasaruddin, N.; Musa, Y.; Anshori, M.F.; Ridwan, I.; Hendra, J.; Subroto, G. Genetic Parameters and Multivariate Analysis to Determine Secondary Traits in Selecting Wheat Mutant Adaptive on Tropical Lowlands. Plant Breed. Biotechnol. 2020, 8, 368–377. [Google Scholar] [CrossRef]
  16. Hernández-Bautista, A.; Lobato-Ortiz, R.; Cruz-Izquierdo, S.; García-Zavala, J.J.; Chávez-Servia, J.L.; Hernández-Leal, E.; Bonilla-Barrientos, O. Fruit Size QTLs Affect in a Major Proportion the Yield in Tomato. Chil. J. Agric. Res. 2015, 75, 402. [Google Scholar] [CrossRef]
  17. Cambiaso, V.; Gimenez, M.D.; Pereira da Costa, J.H.; Vazquez, D.V.; Picardi, L.A.; Pratta, G.R.; Rodríguez, G.R. Selected Genome Regions for Fruit Weight and Shelf Life in Tomato RILs Discernible by Markers Based on Genomic Sequence Information. Breed. Sci. 2019, 69, 447–454. [Google Scholar] [CrossRef]
  18. Ene, C.O.; Abtew, W.G.; Oselebe, H.O.; Ozi, F.U.; Ogah, O.; Okechukwu, E.C.; Chukwudi, U.P. Hybrid Vigor and Heritability Estimates in Tomato Crosses Involving Solanum lycopersicum × S. Pimpinellifolium under Cool Tropical Monsoon Climate. Int. J. Agron. 2023, 2023, 3003355. [Google Scholar] [CrossRef]
  19. Donoso, A.; Salazar, E. Yield Components and Development in Indeterminate Tomato Landraces: An Agromorphological Approach to Promoting Their Utilization. Agronomy 2023, 13, 434. [Google Scholar] [CrossRef]
  20. Skolik, P.; Morais, C.L.M.; Martin, F.L.; McAinsh, M.R. Determination of Developmental and Ripening Stages of Whole Tomato Fruit Using Portable Infrared Spectroscopy and Chemometrics. BMC Plant Biol. 2019, 19, 236. [Google Scholar] [CrossRef]
  21. da Silva, É.D.B.; Xavier, A.; Faria, M.V. Impact of Genomic Prediction Model, Selection Intensity, and Breeding Strategy on the Long-Term Genetic Gain and Genetic Erosion in Soybean Breeding. Front. Genet. 2021, 12, 637133. [Google Scholar] [CrossRef]
  22. Bucio, F.J.; Isaza, C.; Gonzalez, E.; De Paz, J.P.Z.; Sierra, J.A.R.; Rivera, E.K.A. Non-Destructive Post-Harvest Tomato Mass Estimation Model Based on Its Area via Computer Vision and Error Minimization Approaches. IEEE Access 2022, 10, 100247–100256. [Google Scholar] [CrossRef]
  23. Tolasa, M.; Gedamu, F.; Woldetsadik, K. Impacts of Harvesting Stages and Pre-Storage Treatments on Shelf Life and Quality of Tomato (Solanum lycopersicum L.). Cogent Food Agric. 2021, 7, 1863620. [Google Scholar] [CrossRef]
  24. Hairmansis, A.; Berger, B.; Tester, M.; Roy, S.J. Image-Based Phenotyping for Non-Destructive Screening of Different Salinity Tolerance Traits in Rice. Rice 2014, 7, 16. [Google Scholar] [CrossRef] [PubMed]
  25. Chen, D.; Shi, R.; Pape, J.M.; Neumann, K.; Arend, D.; Graner, A.; Chen, M.; Klukas, C. Predicting Plant Biomass Accumulation from Image-Derived Parameters. Gigascience 2018, 7, 1–13. [Google Scholar] [CrossRef]
  26. Nyalala, I.; Okinda, C.; Chao, Q.; Mecha, P.; Korohou, T.; Yi, Z.; Nyalala, S.; Jiayu, Z.; Chao, L.; Kunjie, C. Weight and Volume Estimation of Single and Occluded Tomatoes Using Machine Vision. Int. J. Food Prop. 2021, 24, 818–832. [Google Scholar] [CrossRef]
  27. Anshori, M.F.; Farid, M.; Musa, Y.; Iswoyo, H.; Sakinah, A.I.; Arifuddin, M.; Laraswati, A.A. Development of Image-Based Phenotyping for Selection Characters of Rice Adaptability on the Seedling Salinity Screening. IOP Conf. Ser. Earth Environ. Sci. 2021, 807, 032022. [Google Scholar] [CrossRef]
  28. Al-Tamimi, N.; Langan, P.; Bernád, V.; Walsh, J.; Mangina, E.; Negrão, S. Capturing Crop Adaptation to Abiotic Stress Using Image-Based Technologies. Open Biol. 2022, 12, 210353. [Google Scholar] [CrossRef] [PubMed]
  29. Costa, C.; Schurr, U.; Loreto, F.; Menesatti, P.; Carpentier, S. Plant Phenotyping Research Trends, a Science Mapping Approach. Front. Plant Sci. 2019, 9, 1–11. [Google Scholar] [CrossRef] [PubMed]
  30. Li, L.; Zhang, Q.; Huang, D. A Review of Imaging Techniques for Plant Phenotyping. Sensors 2014, 14, 20078–20111. [Google Scholar] [CrossRef] [PubMed]
  31. Fahlgren, N.; Gehan, M.A.; Baxter, I. Lights, Camera, Action: High-Throughput Plant Phenotyping Is Ready for a Close-Up. Curr. Opin. Plant Biol. 2015, 24, 93–99. [Google Scholar] [CrossRef]
  32. Humplík, J.F.; Lazár, D.; Husičková, A.; Spíchal, L. Automated Phenotyping of Plant Shoots Using Imaging Methods for Analysis of Plant Stress Responses—A Review. Plant Methods 2015, 11, 29. [Google Scholar] [CrossRef]
  33. Araus, J.L.; Kefauver, S.C.; Zaman-Allah, M.; Olsen, M.S.; Cairns, J.E. Translating High-Throughput Phenotyping into Genetic Gain. Trends Plant Sci. 2018, 23, 451–466. [Google Scholar] [CrossRef] [PubMed]
  34. Jangra, S.; Chaudhary, V.; Yadav, R.C.; Yadav, N.R. High-Throughput Phenotyping: A Platform to Accelerate Crop Improvement. Phenomics 2021, 1, 31–53. [Google Scholar] [CrossRef]
  35. Anshori, M.F.; Dirpan, A.; Sitaresmi, T.; Rossi, R.; Farid, M.; Hairmansis, A.; Sapta Purwoko, B.; Suwarno, W.B.; Nugraha, Y. An Overview of Image-Based Phenotyping as an Adaptive 4.0 Technology for Studying Plant Abiotic Stress: A Bibliometric and Literature Review. Heliyon 2023, 9, e21650. [Google Scholar] [CrossRef] [PubMed]
  36. Zhou, J.; Chen, H.; Zhou, J.; Fu, X.; Ye, H.; Nguyen, H.T. Development of an Automated Phenotyping Platform for Quantifying Soybean Dynamic Responses to Salinity Stress in Greenhouse Environment. Comput. Electron. Agric. 2018, 151, 319–330. [Google Scholar] [CrossRef]
  37. Laraswati, A.A.; Padjung, R.; Farid, M.; Nasaruddin, N.; Anshori, M.F.; Nur, A.; Sakinah, A.I. Image Based-Phenotyping and Selection Index Based on Multivariate Analysis for Rice Hydroponic Screening under Drought Stress. Plant Breed. Biotechnol. 2021, 9, 272–286. [Google Scholar] [CrossRef]
  38. Nyalala, I.; Okinda, C.; Nyalala, L.; Makange, N.; Chao, Q.; Chao, L.; Yousaf, K.; Chen, K. Tomato Volume and Mass Estimation Using Computer Vision and Machine Learning Algorithms: Cherry Tomato Model. J. Food Eng. 2019, 263, 288–298. [Google Scholar] [CrossRef]
  39. Quispe-Choque, G.; Rojas-Ledezma, S.; Maydana-Marca, A. Diversidad Morfológica de Fruto de Una Colección de Tomate (Solanum lycopersicum L.) Mediante Fenotipado Basado En Imágenes Digitales. J. Selva Andin. Res. Soc. 2022, 13, 51–68. [Google Scholar] [CrossRef]
  40. Zhu, Y.; Gu, Q.; Zhao, Y.; Wan, H.; Wang, R.; Zhang, X.; Cheng, Y. Quantitative Extraction and Evaluation of Tomato Fruit Phenotypes Based on Image Recognition. Front. Plant Sci. 2022, 13, 859290. [Google Scholar] [CrossRef]
  41. Rossi, R.; Costafreda-Aumedes, S.; Leolini, L.; Leolini, C.; Bindi, M.; Moriondo, M. Implementation of an Algorithm for Automated Phenotyping through Plant 3D-Modeling: A Practical Application on the Early Detection of Water Stress. Comput. Electron. Agric. 2022, 197, 106937. [Google Scholar] [CrossRef]
  42. Nankar, A.N.; Tringovska, I.; Grozeva, S.; Ganeva, D.; Kostova, D. Tomato Phenotypic Diversity Determined by Combined Approaches of Conventional and High-Throughput Tomato Analyzer Phenotyping. Plants 2020, 9, 197. [Google Scholar] [CrossRef] [PubMed]
  43. Taheri-Garavand, A.; Rafiee, S.; Keyhani, A. Study on Some Morphological and Physical Characteristics of Tomato Used in Mass Models to Characterize Best Post Harvesting Options. Aust. J. Crop Sci. 2011, 5, 433–438. [Google Scholar]
  44. de Luna, R.G.; Dadios, E.P.; Bandala, A.A.; Vicerra, R.R.P. Size Classification of Tomato Fruit Using Thresholding, Machine Learning and Deep Learning Techniques. Agrivita 2019, 41, 586–596. [Google Scholar] [CrossRef]
  45. Mahfud, M.; Murti, R.H. Inheritance Pattern of Fruit Color and Shape in Multi-Pistil and Purple Tomato Crossing. Agrivita 2020, 42, 572–583. [Google Scholar] [CrossRef]
  46. Bojarian, M.; Asadi-Gharneh, H.A.; Golabadi, M. Factor Analysis, Stepwise Regression and Path Coefficient Analyses of Yield, Yield-Associated Traits, and Fruit Quality in Tomato. Int. J. Veg. Sci. 2019, 25, 542–553. [Google Scholar] [CrossRef]
  47. Alsabah, R.; Purwoko, B.S.; Dewi, I.S.; Wahyu, Y. Selection Index for Selecting Promising Doubled Haploid Lines of Black Rice. Sabrao J. Breed. Genet. 2019, 51, 420–441. [Google Scholar]
  48. Mousavi, S.M.N.; Nagy, J. Evaluation of Plant Characteristics Related to Grain Yield of FAO410 and FAO340 Hybrids Using Regression Models. Cereal Res. Commun. 2021, 49, 161–169. [Google Scholar] [CrossRef]
  49. Padjung, R.; Farid, M.; Musa, Y.; Anshori, M.F.; Nur, A.; Masnenong, A. Drought-Adapted Maize Line Based on Morphophysiological Selection Index. Biodiversitas 2021, 22, 4028–4035. [Google Scholar] [CrossRef]
  50. Yeater, K.M.; Duke, S.E.; Riedell, W.E. Multivariate Analysis: Greater Insights into Complex Systems. Agron. J. 2015, 107, 799–810. [Google Scholar] [CrossRef]
  51. Barth, E.; de Resende, J.T.V.; Mariguele, K.H.; de Resende, M.D.V.; da Silva, A.L.B.R.; Ru, S. Multivariate Analysis Methods Improve the Selection of Strawberry Genotypes with Low Cold Requirement. Sci. Rep. 2022, 12, 11458. [Google Scholar] [CrossRef]
  52. Sakinah, A.I.; Musa, Y.; Farid, M.; Hairmansis, A.; Anshori, M.F.; Nasaruddin, N. Rice Selection Criteria Based on Morphological And Image-Based Phenotyping Under Drought-And Salinity-Stress Conditions. Sabrao J. Breed. Genet. 2022, 54, 686–699. [Google Scholar] [CrossRef]
  53. Duc, N.T.; Ramlal, A.; Rajendran, A.; Raju, D.; Lal, S.K.; Kumar, S.; Sahoo, R.N.; Chinnusamy, V. Image-Based Phenotyping of Seed Architectural Traits and Prediction of Seed Weight Using Machine Learning Models in Soybean. Front. Plant Sci. 2023, 14, 1–15. [Google Scholar] [CrossRef] [PubMed]
  54. Schindelin, J.; Arganda-Carreras, I.; Frise, E.; Kaynig, V.; Longair, M.; Pietzsch, T.; Preibisch, S.; Rueden, C.; Saalfeld, S.; Schmid, B.; et al. Fiji: An Open-Source Platform for Biological-Image Analysis. Nat. Methods 2012, 9, 676–682. [Google Scholar] [CrossRef] [PubMed]
  55. Woolf, M.S.; Dignan, L.M.; Scott, A.T.; Landers, J.P. Digital Postprocessing and Image Segmentation for Objective Analysis of Colorimetric Reactions. Nat. Protoc. 2021, 16, 218–238. [Google Scholar] [CrossRef]
  56. Ayenan, M.A.T.; Danquah, A.; Ampomah-Dwamena, C.; Hanson, P.; Asante, I.K.; Danquah, E.Y. Optimizing Pollencounter for High Throughput Phenotyping of Pollen Quality in Tomatoes. MethodsX 2020, 7, 100977. [Google Scholar] [CrossRef]
  57. Barraj Barraj, R.; Segado, P.; Moreno-González, R.; Heredia, A.; Fernández-Muñoz, R.; Domínguez, E. Genome-Wide QTL Analysis of Tomato Fruit Cuticle Deposition and Composition. Hortic. Res. 2021, 8, 113. [Google Scholar] [CrossRef] [PubMed]
  58. Acquaah, G. Principles of Plant Genetics and Breeding; Blackwell Publishing: Oxford, UK, 2007; ISBN 1405136464. [Google Scholar]
  59. Anshori, M.F.; Purwoko, B.S.; Dewi, I.S.; Ardie, S.W.; Suwarno, W.B.; Safitri, H. Determination of Selection Criteria for Screening of Rice Genotypes for Salinity Tolerance. Sabrao J. Breed. Genet. 2018, 50, 279–294. [Google Scholar]
  60. Reflinur; Kim, B.; Jang, S.M.; Chu, S.H.; Bordiya, Y.; Akter, M.B.; Lee, J.; Chin, J.H.; Koh, H.J. Analysis of Segregation Distortion and Its Relationship to Hybrid Barriers in Rice. Rice 2014, 7, 3. [Google Scholar] [CrossRef]
  61. Nie, X.; Tu, J.; Wang, B.; Zhou, X.; Lin, Z. A BIL Population Derived from G. Hirsutum and G. Barbadense Provides a Resource for Cotton Genetics and Breeding. PLoS ONE 2015, 10, e0141064. [Google Scholar] [CrossRef]
  62. Dos Santos, V.O.; Viana, A.P.; da Costa Preisigke, S.; Santos, E.A. Backcrosses in a Segregating Population of Passiflora Mediated by Morphoagronomic and Resistance Traits. Bragantia 2019, 78, 542–552. [Google Scholar] [CrossRef]
  63. Merrick, L.F.; Herr, A.W.; Sandhu, K.S.; Lozada, D.N.; Carter, A.H. Optimizing Plant Breeding Programs for Genomic Selection. Agronomy 2022, 12, 714. [Google Scholar] [CrossRef]
  64. Schmidt, P.; Hartung, J.; Bennewitz, J.; Hans-Peter, P. Heritability in Plant Breeding on a Genotype-Difference Basis. Genetics 2019, 212, 991–1008. [Google Scholar] [CrossRef]
  65. Tesfaye, A. Genetic Variability, Heritability, and Genetic Advance Estimates in Garlic (Allium sativum) from the Gamo Highlands of Southern Ethiopia. Int. J. Agron. 2021, 2021, 3171642. [Google Scholar] [CrossRef]
  66. Diniz, R.P.; de Oliveira, E.J. Genetic Parameters, Path Analysis and Indirect Selection of Agronomic Traits of Cassava germplasm. An. Acad. Bras. Cienc. 2019, 91, 1–11. [Google Scholar] [CrossRef]
  67. Lozada, D.N.; Godoy, J.V.; Ward, B.P.; Carter, A.H. Genomic Prediction and Indirect Selection for Grain Yield in US Pacific Northwest Winter Wheat Using Spectral Reflectance Indices from High-Throughput Phenotyping. Int. J. Mol. Sci. 2020, 21, 165. [Google Scholar] [CrossRef]
  68. Pham, H. A New Criterion for Model Selection. Mathematics 2019, 7, 1215. [Google Scholar] [CrossRef]
  69. Chicco, D.; Warrens, M.J.; Jurman, G. The Coefficient of Determination R-Squared Is More Informative than SMAPE, MAE, MAPE, MSE and RMSE in Regression Analysis Evaluation. PeerJ Comput. Sci. 2021, 7, e623. [Google Scholar] [CrossRef] [PubMed]
  70. Schauer, N.; Semel, Y.; Balbo, I.; Steinfath, M.; Repsilber, D.; Selbig, J.; Pleban, T.; Zamir, D.; Fernie, A.R. Mode of Inheritance of Primary Metabolic Traits in Tomato. Plant Cell 2008, 20, 509–523. [Google Scholar] [CrossRef] [PubMed]
  71. Acquaah, G. Principles of Plant Genetics and Breeding, 2nd ed.; Wiley: Oxford, UK, 2012; ISBN 9780470664766. [Google Scholar]
  72. Oliveira, G.H.; Amaral, C.B.; Silva, F.A.; Dutra, S.M.; Marconato, M.B.; Môro, G. V Mixed Models and Multivariate Analysis for Selection of Superior Maize Genotypes. Chil. J. Agric. Res. 2016, 76, 427–431. [Google Scholar] [CrossRef]
  73. Nardino, M.; Barros, W.S.; Olivoto, T.; Cruz, C.D.; Silva, F.F.E.; De Pelegrin, A.J.; De Souza, V.Q.; Carvalho, I.R.; Szareski, V.J.; De Oliveira, A.C.; et al. Multivariate Diallel Analysis by Factor Analysis for Establish Mega-Traits. An. Acad. Bras. Cienc. 2020, 92. [Google Scholar] [CrossRef] [PubMed]
  74. Mokhtar, A.; El-Ssawy, W.; He, H.; Al-Anasari, N.; Sammen, S.S.; Gyasi-Agyei, Y.; Abuarab, M. Using Machine Learning Models to Predict Hydroponically Grown Lettuce Yield. Front. Plant Sci. 2022, 13, 706042. [Google Scholar] [CrossRef] [PubMed]
  75. Wu, X.-L.; Bao, W.-K. Statistical Analysis of Leaf Water Use Efficiency and Physiology Traits of Winter Wheat Under Drought Condition. J. Integr. Agric. 2012, 11, 82–89. [Google Scholar] [CrossRef]
  76. Bahmani, K.; Izadi-Darbandi, A.; Noori, S.A.S.; Jafari, A.A.; Moradi, N. Determination of Interrelationships among Phenotypic Traits of Iranian Fennel (Foeniculum vulgare Mill.) Using Correlation, Stepwise Regression and Path Analyses. J. Essent. Oil Bear. Plants 2012, 15, 424–444. [Google Scholar] [CrossRef]
  77. Rameeh, V. Multivariate Regression Analyses of Yield Associated Traits in Rapeseed (Brassica napus L.) Genotypes. Adv. Agric. 2014, 2014, 626434. [Google Scholar] [CrossRef]
  78. Smith, L.N.; Zhang, W.; Hansen, M.F.; Hales, I.J.; Smith, M.L. Innovative 3D and 2D Machine Vision Methods for Analysis of Plants and Crops in the Field. Comput. Ind. 2018, 97, 122–131. [Google Scholar] [CrossRef]
  79. Khan, M.M.H.; Rafii, M.Y.; Ramlee, S.I.; Jusoh, M.; Al Mamun, M. Path-Coefficient and Correlation Analysis in Bambara Groundnut (Vigna subterranea [L.] Verdc.) Accessions over Environments. Sci. Rep. 2022, 12, 245. [Google Scholar] [CrossRef]
  80. Olivoto, T.; de Souza, V.Q.; Nardino, M.; Carvalho, I.R.; Ferrari, M.; de Pelegrin, A.J.; Szareski, V.J.; Schmidt, D. Multicollinearity in Path Analysis: A Simple Method to Reduce Its Effects. Agron. J. 2017, 109, 131–142. [Google Scholar] [CrossRef]
  81. Del Conte, M.V.; Souza Carneiro, P.C.; De Resende, M.D.V.; Da Silva, F.L.; Peternelli, L.A. Overcoming Collinearity in Path Analysis of Soybean [Glycine max (L.) Merr.] Grain Oil Content. PLoS ONE 2020, 15, e0233290. [Google Scholar] [CrossRef]
  82. Patil, P.G.; Bohra, A.; Satheesh, N.S.J.; Dubey, J.; Pandey, P.; Dutta, D.; Singh, F.; Singh, I.P.; Singh, N.P. Validation of QTLs for Plant Ideotype, Earliness and Growth Habit Traits in Pigeonpea (Cajanus cajan Millsp.). Physiol. Mol. Biol. Plants 2018, 24, 1245–1259. [Google Scholar] [CrossRef]
  83. de Jesus Colwell, F.; Souter, J.; Bryan, G.J.; Compton, L.J.; Boonham, N.; Prashar, A. Development and Validation of Methodology for Estimating Potato Canopy Structure for Field Crop Phenotyping and Improved Breeding. Front. Plant Sci. 2021, 12, 612843. [Google Scholar] [CrossRef]
  84. Rahman, M.M.; Crain, J.; Haghighattalab, A.; Singh, R.P.; Poland, J. Improving Wheat Yield Prediction Using Secondary Traits and High-Density Phenotyping Under Heat-Stressed Environments. Front. Plant Sci. 2021, 12, 633651. [Google Scholar] [CrossRef] [PubMed]
  85. Ali, Y.; Raza, A.; Iqbal, S.; Khan, A.A.; Aatif, H.M.; Hassan, Z.; Hanif, C.M.S.; Ali, H.M.; Mosa, W.F.A.; Mubeen, I.; et al. Stepwise Regression Models-Based Prediction for Leaf Rust Severity and Yield Loss in Wheat. Sustainability 2022, 14, 13893. [Google Scholar] [CrossRef]
  86. Cobb, J.N.; Juma, R.U.; Biswas, P.S.; Arbelaez, J.D.; Rutkoski, J.; Atlin, G.; Hagen, T.; Quinn, M.; Ng, E.H. Enhancing the Rate of Genetic Gain in Public-Sector Plant Breeding Programs: Lessons from the Breeder’s Equation. Theor. Appl. Genet. 2019, 132, 627–645. [Google Scholar] [CrossRef] [PubMed]
  87. da Silva, T.R.; Costa, A.G.; Paes, J.L.; de Oliveira, M.V.M.; de Assis de Carvalho Pinto, F. Comparing Quality Parameters Obtained Using Destructive and Optical Methods in Grading Tomatoes. Rev. Cienc. Agron. 2021, 52, e20207475. [Google Scholar] [CrossRef]
  88. Zaki, H.E.M.; Radwan, K.S.A. Estimates of Genotypic and Phenotypic Variance, Heritability, and Genetic Advance of Horticultural Traits in Developed Crosses of Cowpea (Vigna unguiculata [L.] Walp). Front. Plant Sci. 2022, 13, 987985. [Google Scholar] [CrossRef] [PubMed]
  89. Fischer, R.A.; Rebetzke, G.J. Indirect Selection for Potential Yield in Early-Generation, Spaced Plantings of Wheat and Other Small-Grain Cereals: A Review. Crop Pasture Sci. 2018, 69, 439–459. [Google Scholar] [CrossRef]
  90. Del Medico, A.P.; Cabodevila, V.G.; Vitelleschi, M.S.; Pratta, G.R. Characterization of Tomato Generations According to a Three-Way Data Analysis. Bragantia 2020, 79, 8–18. [Google Scholar] [CrossRef]
  91. Mata-Nicolás, E.; Montero-Pau, J.; Gimeno-Paez, E.; Garcia-Carpintero, V.; Ziarsolo, P.; Menda, N.; Mueller, L.A.; Blanca, J.; Cañizares, J.; van der Knaap, E.; et al. Exploiting the Diversity of Tomato: The Development of a Phenotypically and Genetically Detailed Germplasm Collection. Hortic. Res. 2020, 7, 66. [Google Scholar] [CrossRef]
  92. Tausen, M.; Clausen, M.; Moeskjær, S.; Shihavuddin, A.S.M.; Dahl, A.B.; Janss, L.; Andersen, S.U. Greenotyper: Image-Based Plant Phenotyping Using Distributed Computing and Deep Learning. Front. Plant Sci. 2020, 11, 01181. [Google Scholar] [CrossRef]
  93. Hui, F.; Xie, Z.W.; Li, H.G.; Guo, Y.; Li, B.G.; Liu, Y.L.; Ma, Y.T. Image-Based Root Phenotyping for Field-Grown Crops: An Example under Maize/Soybean Intercropping. J. Integr. Agric. 2022, 21, 1606–1619. [Google Scholar] [CrossRef]
  94. Shrestha, S.; Deleuran, L.C.; Olesen, M.H.; Gislum, R. Use of Multispectral Imaging in Varietal Identification of Tomato. Sensors 2015, 15, 4496–4512. [Google Scholar] [CrossRef] [PubMed]
  95. Wang, D.; Vinson, R.; Holmes, M.; Seibel, G.; Bechar, A.; Nof, S.; Tao, Y. Early Detection of Tomato Spotted Wilt Virus by Hyperspectral Imaging and Outlier Removal Auxiliary Classifier Generative Adversarial Nets (OR-AC-GAN). Sci. Rep. 2019, 9, 4377. [Google Scholar] [CrossRef] [PubMed]
  96. Wang, H.; Hu, R.; Zhang, M.; Zhai, Z.; Zhang, R. Identification of Tomatoes with Early Decay Using Visible and near Infrared Hyperspectral Imaging and Image-Spectrum Merging Technique. J. Food Process Eng. 2021, 44, e13654. [Google Scholar] [CrossRef]
Figure 1. Image-based phenotyping workflow for non-destructive fruit fresh weigh (FFW; g) estimation on tomato segregated populations.
Agronomy 14 00338 g001
Figure 2. Correlation analysis of all analyzed traits; a significant correlation at 5% error level is denoted by color and value, while a lack of significance is represented by blank cells; FW = fruit weight, WFA = whole fruit area, WFR = whole fruit round, WFW = whole fruit width, WFH = whole fruit height, WRI = whole red index, WGI = whole green index, WBI = whole blue index, SFA = slice fruit area, SFR = slice fruit round, SFW = slice fruit width, SFH = slice fruit height, SRI = slice red index, SGI = slice green index, SBI = slice blue index.
Agronomy 14 00338 g002
Figure 3. Development of the fruit fresh weight (FW_F2; g) model based on the total whole fruit area (WFA; cm2) through regression analysis. Blue dots are lines from the population.
Agronomy 14 00338 g003
Figure 4. Model destructive validation on M/K//K backcross population validation data. Blue dots are lines from the population.
Agronomy 14 00338 g004
Figure 5. Model non-destructive validation on F5 population validation data. Blue dots are lines from the population.
Agronomy 14 00338 g005
Table 1. Heritability results of all the analyzed phenotypic traits.
GBSFFWWFAWFRWFWWFHWRIWGIWBISFASFRSFWSFHSRISGISBI
K x ¯ 20.719.330.893.533.39125.7244.4333.879.840.943.603.43118.8747.2629.62
σ 2 5.711.980.040.480.2726.3514.5911.742.690.020.540.4625.1615.8612.59
M x ¯ 18.268.900.713.942.97114.2444.0930.246.950.923.943.75114.2444.0930.24
σ 2 5.982.660.110.490.5112.279.975.891.790.040.490.3612.279.975.89
F1 x ¯ 19.919.900.943.563.54115.7344.3732.326.540.933.743.61128.9160.5838.38
σ 2 3.910.960.020.250.1627.3414.9612.230.880.020.330.2225.4824.4511.79
F2 x ¯ 17.328.490.843.563.12114.3540.4931.755.930.933.533.41121.9550.9933.25
σ 2 7.932.980.080.680.5622.5415.8314.632.430.030.640.6422.9518.9612.50
VE5.201.870.060.410.3121.9913.179.951.790.030.450.3520.9716.7610.09
VP7.932.980.080.680.5622.5415.8314.632.430.030.640.6422.9518.9612.50
VG2.731.120.020.270.240.552.664.680.640.010.190.291.982.202.41
H34.4437.4727.7939.6943.732.4416.8231.9626.3918.8629.7645.648.6211.6219.27
Notes: GB = genotype background, S = statistic ( x ¯ = average value; σ 2 = population variance; VE = environmental variance; VP = phenotypic variance; VG = genetic variance; H = heritability), FFW = fruit fresh weight, WFA = whole fruit area, WFR = whole fruit round, WFW = whole fruit width, WFH = whole fruit height, WRI = whole red index, WGI = whole green index, WBI = whole blue index, SFA = slice fruit area, SFR = slice fruit round, SFW = slice fruit width, SFH = slice fruit height, SRI = slice red index, SGI = slice green index, SBI = slice blue index. The bold number shows moderate heritability.
Table 2. Path analysis of traits that remained positive toward results.
TraitDirect EffectIndirect EffectCorrelation
WFAWFWWFHSFASFWSFH
WFA0.21 0.540.190.13−0.440.10.73
WFW0.600.19 0.160.13−0.470.10.71
WFH0.210.190.47 0.12−0.390.080.68
SFA0.150.180.510.17 −0.440.090.66
SFW−0.490.190.580.170.13 0.10.68
SFH0.110.190.570.170.13−0.47 0.69
total 0.942.670.860.63−2.210.47
Notes: WFA = whole fruit area, WFW = whole fruit width, WFH = whole fruit height, SFA = slice fruit area, SFW = slice fruit width, SFH = slice fruit height.
Table 3. Stepwise multiple regression analysis of traits that resulted positively correlated with the fruit fresh weight.
ParametersEstimateStd. Errort ValuePr (>|t|)
(Intercept)−4.94563.7527−1.3180.19071
WFA1.29110.42173.0620.00286 **
WFW3.20151.85201.7290.08711
Notes: R2: 0.554, Adjusted R2: 0.5446, ** significant effect at 1% error level, WFA = whole fruit area, WFW = whole fruit width.
Table 4. Validation analysis of secondary traits using genetic approaches.
GroupingTraitsSGSi G G % (Cr/Rx)
IndependentWFW4.450.901.810.5715.90
WFA12.564.062.352.4929.29
FFW28.8511.534.096.7639.05
DependentWFA12.562.652.700.9910.030.68
FFW27.167.253.662.5012.53
WFW4.450.891.090.359.950.32
FFW26.896.983.532.4012.06
Notes: WFA = whole fruit area, WFW = whole fruit width, FFW = fruit fresh weight, SG = selected genotypes, S = selection differential, I = selection intensity, G = selection progress, Cr/Rx = effectiveness of secondary traits.
Table 5. Analysis of model sensitivity on training and validation data.
Datanp-ValueR2Adjusted-R2R2-Deviation RMSE
Training960.00081.581.30.23.14
Destructive Validation 300.00070.769.80.94.46
Non-destructive Validation 450.00080.780.20.52.12
Notes: n = number of genotypes, R2 = determination value, RMSE = root mean square error.
Disclaimer/Publisher’s Note: The statements, opinions and data contained in all publications are solely those of the individual author(s) and contributor(s) and not of MDPI and/or the editor(s). MDPI and/or the editor(s) disclaim responsibility for any injury to people or property resulting from any ideas, methods, instructions or products referred to in the content.

