Article

An Explanatory Model of Red Lentil Seed Coat Colour to Manage Degradation in Quality during Storage

by
Bhawana Bhattarai
1,2,*,
James G. Nuttall
1,2,
Cassandra K. Walker
1,2,
Ashley J. Wallace
1,2,
Glenn J. Fitzgerald
1,2 and
Garry J. O’Leary
1,2
1
Faculty of Science, The University of Melbourne, Parkville, VIC 3010, Australia
2
Agriculture Victoria, Grains Innovation Park, Horsham, VIC 3400, Australia
*
Author to whom correspondence should be addressed.
Agronomy 2024, 14(2), 373; https://doi.org/10.3390/agronomy14020373
Submission received: 12 January 2024 / Revised: 12 February 2024 / Accepted: 13 February 2024 / Published: 15 February 2024
(This article belongs to the Special Issue Advances in Data, Models, and Their Applications in Agriculture)

Abstract

:
This study presents an explanatory biophysical model developed and validated to simulate seed coat colour traits including CIE L*, a*, and b* changes over time for stored lentil cultivars PBA Hallmark, PBA Hurricane, PBA Bolt, and PBA Jumbo2 under diverse storage conditions. The model showed robust performance for all cultivars, with R2 values ≥ 0.89 and RMSE values ≤ 0.0019 for all seed coat colour traits. Laboratory validation at 35 °C demonstrated a high agreement (Lin’s Concordance Correlation Coefficient, CCC ≥ 0.82) between simulated and observed values of all colour traits for PBA Jumbo2 and strong agreement (CCC ≥ 0.81) for PBA Hallmark in brightness (CIE L*) and redness (CIE a*), but not in yellowness (CIE b*). At 15 °C, both cultivars exhibited moderate to weak agreement between simulated and observed values of all colour traits (CCC ≤ 0.47), as very little change was recorded in the observed values over the 360 days of storage. Bulk storage system validation for PBA Hallmark showed moderate performance (CCC ≥ 0.46) between simulated and observed values of all colour traits. Modelling to simulate changes in seed coat colour traits of lentils over time will equip growers and traders to make informed managerial decisions when storing lentils for long periods.

1. Introduction

The seed coat colour of lentil is an economic determinant for growers and traders as it strongly influences the marketability and value of the grain. The colour of the seed coat darkens over time particularly under extreme storage conditions and is primarily attributed to environmental factors such as temperature and grain moisture content [1]. Depending on the lentil grain moisture content and temperature at harvest as well as external weather conditions such as seasonal and daily variation in temperature during storage, the lentil seed coat can substantially darken. This can result in reduced marketability, the downgrading of the stored grain and, consequently, lower profits for growers [1].
Seed colour can be quantified objectively in terms of brightness (CIE L*), redness (CIE a*), and yellowness (CIE b*), where darkening may be visually observable with a 0.4 to 1 unit change in brightness, redness, or yellowness as determined in the field of pathology [2] and in the paint industry [3]. Therefore, quantifying seed coat colour traits when storing grain over extended periods, using CIE L*, a*, and b* values, can offer a way to determine rates of deterioration in colour. These data can assist in informing economic strategies for growers and traders to minimise changes in quality from harvest to the time of sale by optimising storage practices and the length of time in storage. There is an opportunity to develop an explanatory objective model to predict the change in seed coat colour in response to the measurable storage conditions of temperature and grain moisture over time. Such a model should have applications across diverse environments to forecast the change in seed coat colour traits as an economic decision support tool in pulse grain storage systems.
In seed storage systems, real-time environmental monitoring has been widely used to maintain the quality of food products [4], fruit [5], maize grains [6,7], and a wide range of food grains [8]. Such monitoring includes various in situ sensors coupled with various statistical prediction methods using multiple linear regression [7,9] and artificial intelligence (AI) approaches [6,10,11]. However, these statistical methods rely on large quantities of data that comprise nearly all possible interpolative combinations to cover the expected environmental variance. The development of an explanatory model based on the key biophysical properties of variables that change in state over time (e.g., seed coat colour traits) driven by environmental variables (e.g., temperature and grain moisture content) that vary over time provides a more universally applicable model that can be extrapolative in nature rather than interpolative. Such a model, with sufficiently low error margins, should find utility in the management of grain storage systems aimed at maintaining high quality grain.
Currently available models monitor storage conditions (such as temperature and humidity), predict chemical properties, and assess and predict insect populations in the stored cereal grains [12]. However, the monitoring of the quality of the grain, such as the decline in seed coat colour, is limited. There were two aims of this study: (1) to develop and validate an explanatory biophysical model which predicts the changes in seed coat brightness (CIE L*), redness (CIE a*), and yellowness (CIE b*) of stored lentil grains over time across diverse storage conditions and (2) to simulate the impact of several storage scenarios on lentil grain quality in order to understand the broad sensitivity analysis of lentil seed coats under various storage conditions.

2. Materials and Methods

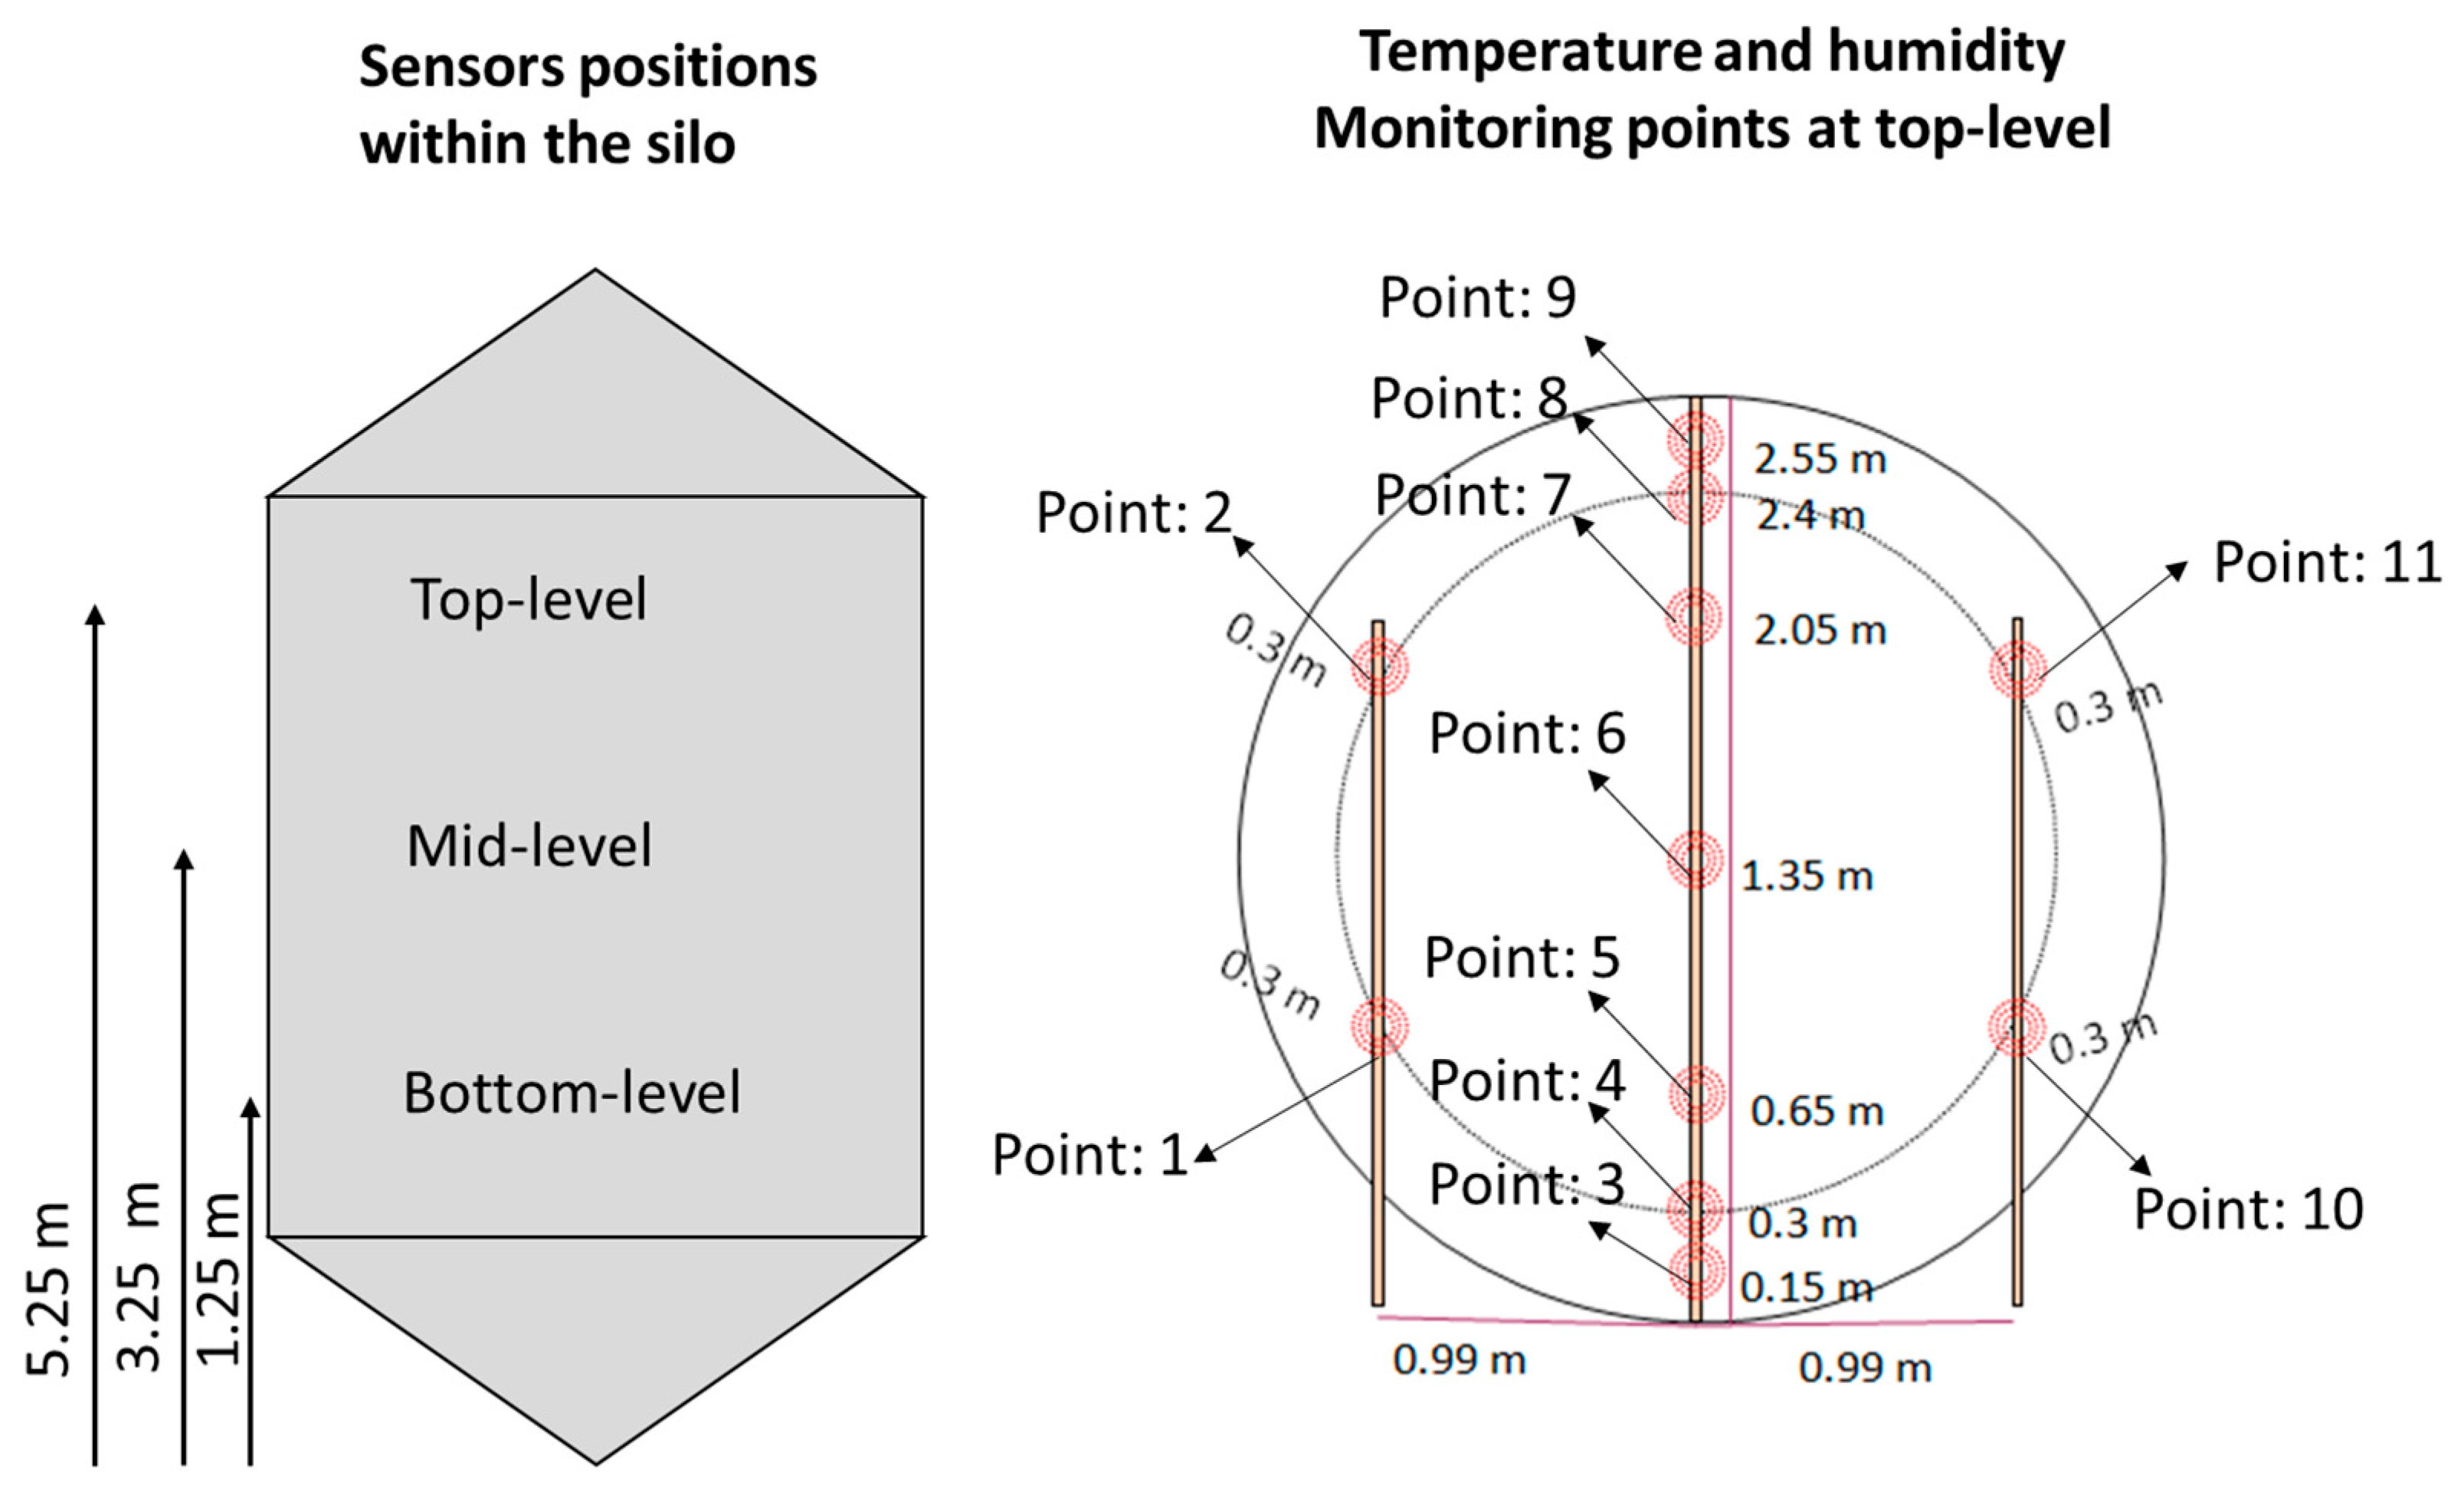
2.1. Measurement of Seed Coat Colour

The construction of the biophysical model was based on data recorded in a previous study [1] where grain samples from four red lentil cultivars (PBA Hallmark, PBA Hurricane, PBA Bolt, and PBA Jumbo2) grown in the Western Victorian region, representing a semi-arid climatic environment, were stored for 360 days at two different grain moisture contents (10 and 14% w/w) and four storage temperatures (4, 15, 25, and 35 °C). The grain, in harvest condition, from selected cultivars grown in individual paddocks in the Wimmera region of Horsham, VIC, Australia, were sourced from a commercial trader in December at the end of the 2019 growing season. The 10% moisture content represents typical harvest moisture levels in the harvested grain, while 14% represents the highest recommended harvest moisture content. Temperatures of 15, 25, and 35 °C represent a range of grain storage conditions in a semi-arid climatic environment, with 4 °C as the control temperature treatment. The seed coat brightness (CIE L*), redness (CIE a*), and yellowness (CIE b*) of these four red lentil cultivars were measured over time using a Minolta Spectrophotometer (CM5, Hamburg, Germany) based on the Commission Internationale l’Elcairage (CIE) values L*, a*, and b* systems as described by Wrolstad and Smith [13]. An increase in the L* value signifies brighter grain, and a decrease in value signifies darker grain. A positive increase in both the a* and b* values indicate a more brown/yellow grain, while negative values of a* and b* denote a more green/blue grain. This data set has not previously been used to construct an explanatory biophysical model.

2.2. Development of Equations for the Model

The rate of change in seed coat colour per day was derived from linear regression independently for all cultivars at four temperatures (4, 15, 25, and 35 °C) and two grain moisture contents (10 and 14%, w/w); the details of the linear regressions are provided in Supplementary Figures S1–S3. This rate of change in seed coat colour traits was observed as a non-linear function with temperature and grain moisture content (Figure 1, Figure 2 and Figure 3). A composite quadratic function of temperature and moisture content provided a good fit to the observed rate of change data (Supplementary Figures S1–S3). However, the rate of change in CIE b*, measured at the 14% (w/w) moisture content and temperatures of 4, 15, 25, and 35 °C, showed a linear increase up to 25 °C, followed by a subsequent decrease (Figure 3). Therefore, in this study, the average rate of change in CIE b* over the storage period was applied to build the rate function for the model.

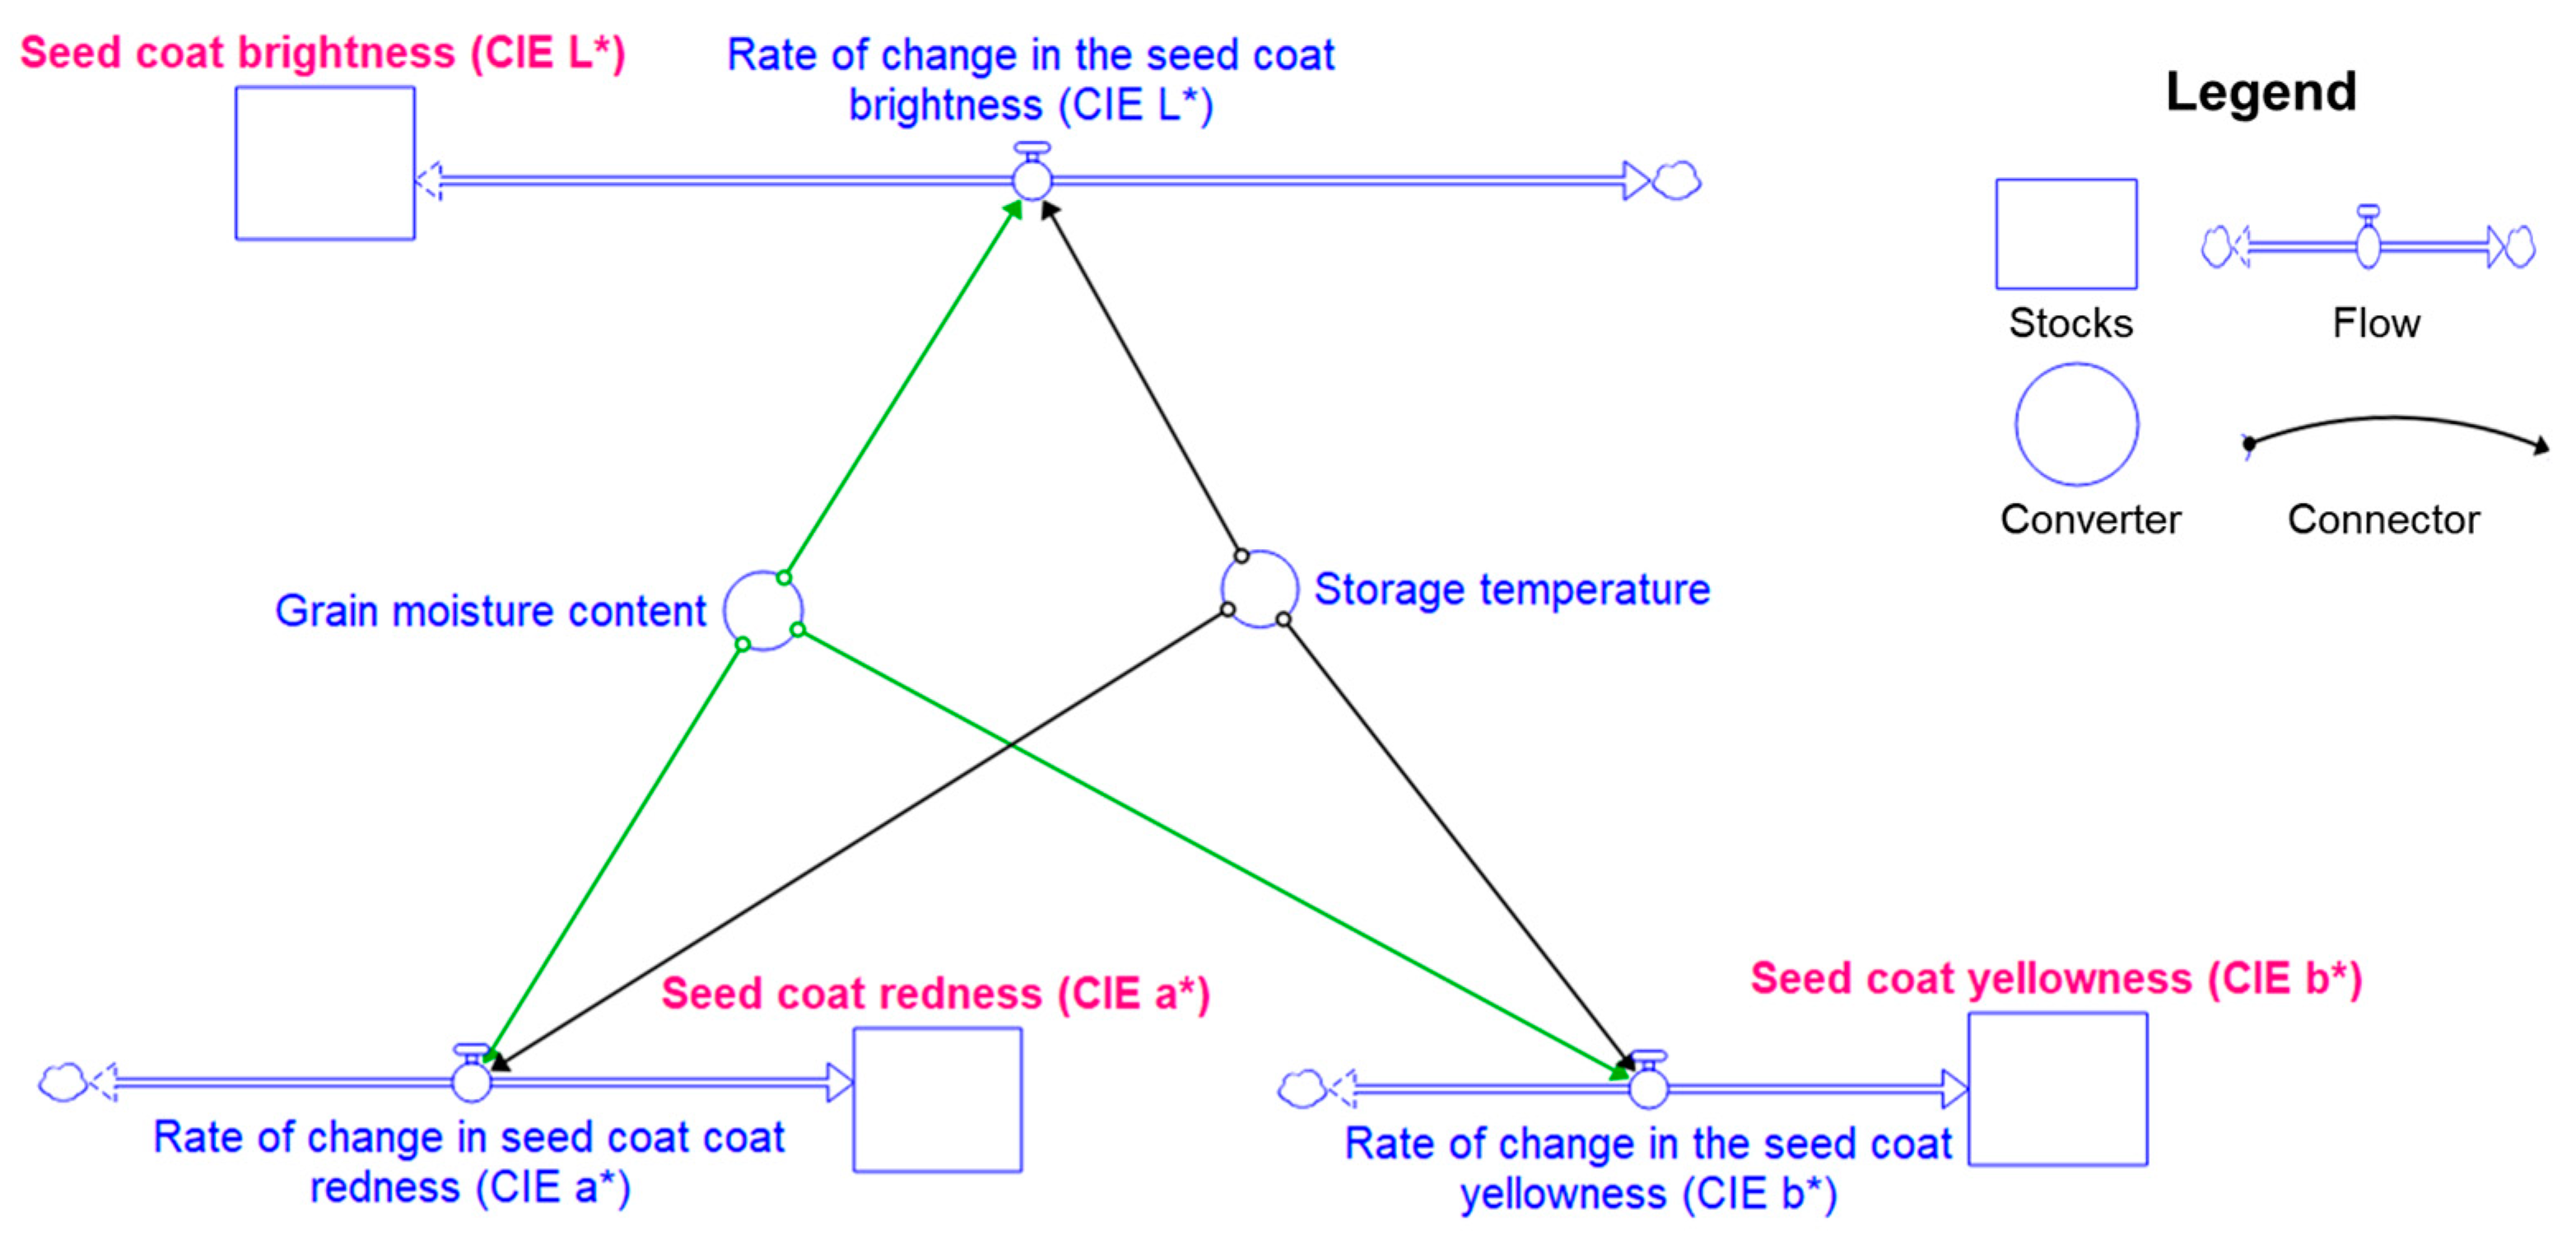
2.3. Development of the Model

The observed changes in seed coat colour point to a simple rate and state model, whereby the seed coat colour (state) changes over time, either decreasing or increasing, driven by grain moisture content and temperature. The design, validation, and testing of such a model can be facilitated using the commercially available model development software “Structural Thinking, Experimental Learning Laboratory with Animation” (STELLA) [14]. This package has been successfully used in developing explanatory models in biology [15], ecology [16], and the environmental sciences [17]. The advantage of such structural systems thinking it that is allows rapid separation of state variables from rate variables and allows feedbacks and feedforwards to be explored with graphical interpretation. In this description, the state variables are given initial values that change over a period of daily time steps. The rate of change per day is derived from rate constant functions and environmental conditions over the storage period (Figures S1–S3). The rate constants need to be defined from experimental data. Under long-term storage at high temperatures and grain moisture contents, brightness (CIE L*) is expected to decrease with redness (CIE a*), and yellowness (CIE b*) is expected to increase. Applying the model across a range of expected environmental conditions provides a predicted colour state.
An explanatory biophysical model for predicting the change in seed coat colour of red lentils by accounting the change in brightness (CIE L*), redness (CIE a*), and yellowness (CIE b*) of the seed coat is defined in Figure 4. This model was developed using the STELLA software version 3.0.1 available from iSSE systems. STELLA constituents four core components: (1) stocks, which are the state variables responsible for accumulating and preserving information inflows and outflows; (2) flows, which serve as exchange variables, orchestrating the movement and transfer of information between these state variables; (3) converters, which are versatile auxiliary variables that incorporate constant values or values contingent upon other variables, curves, or functions spanning various categories; and (4) connectors, builds vital links between modelling features, variables, and elements, thereby facilitating seamless integration and interaction within the system.

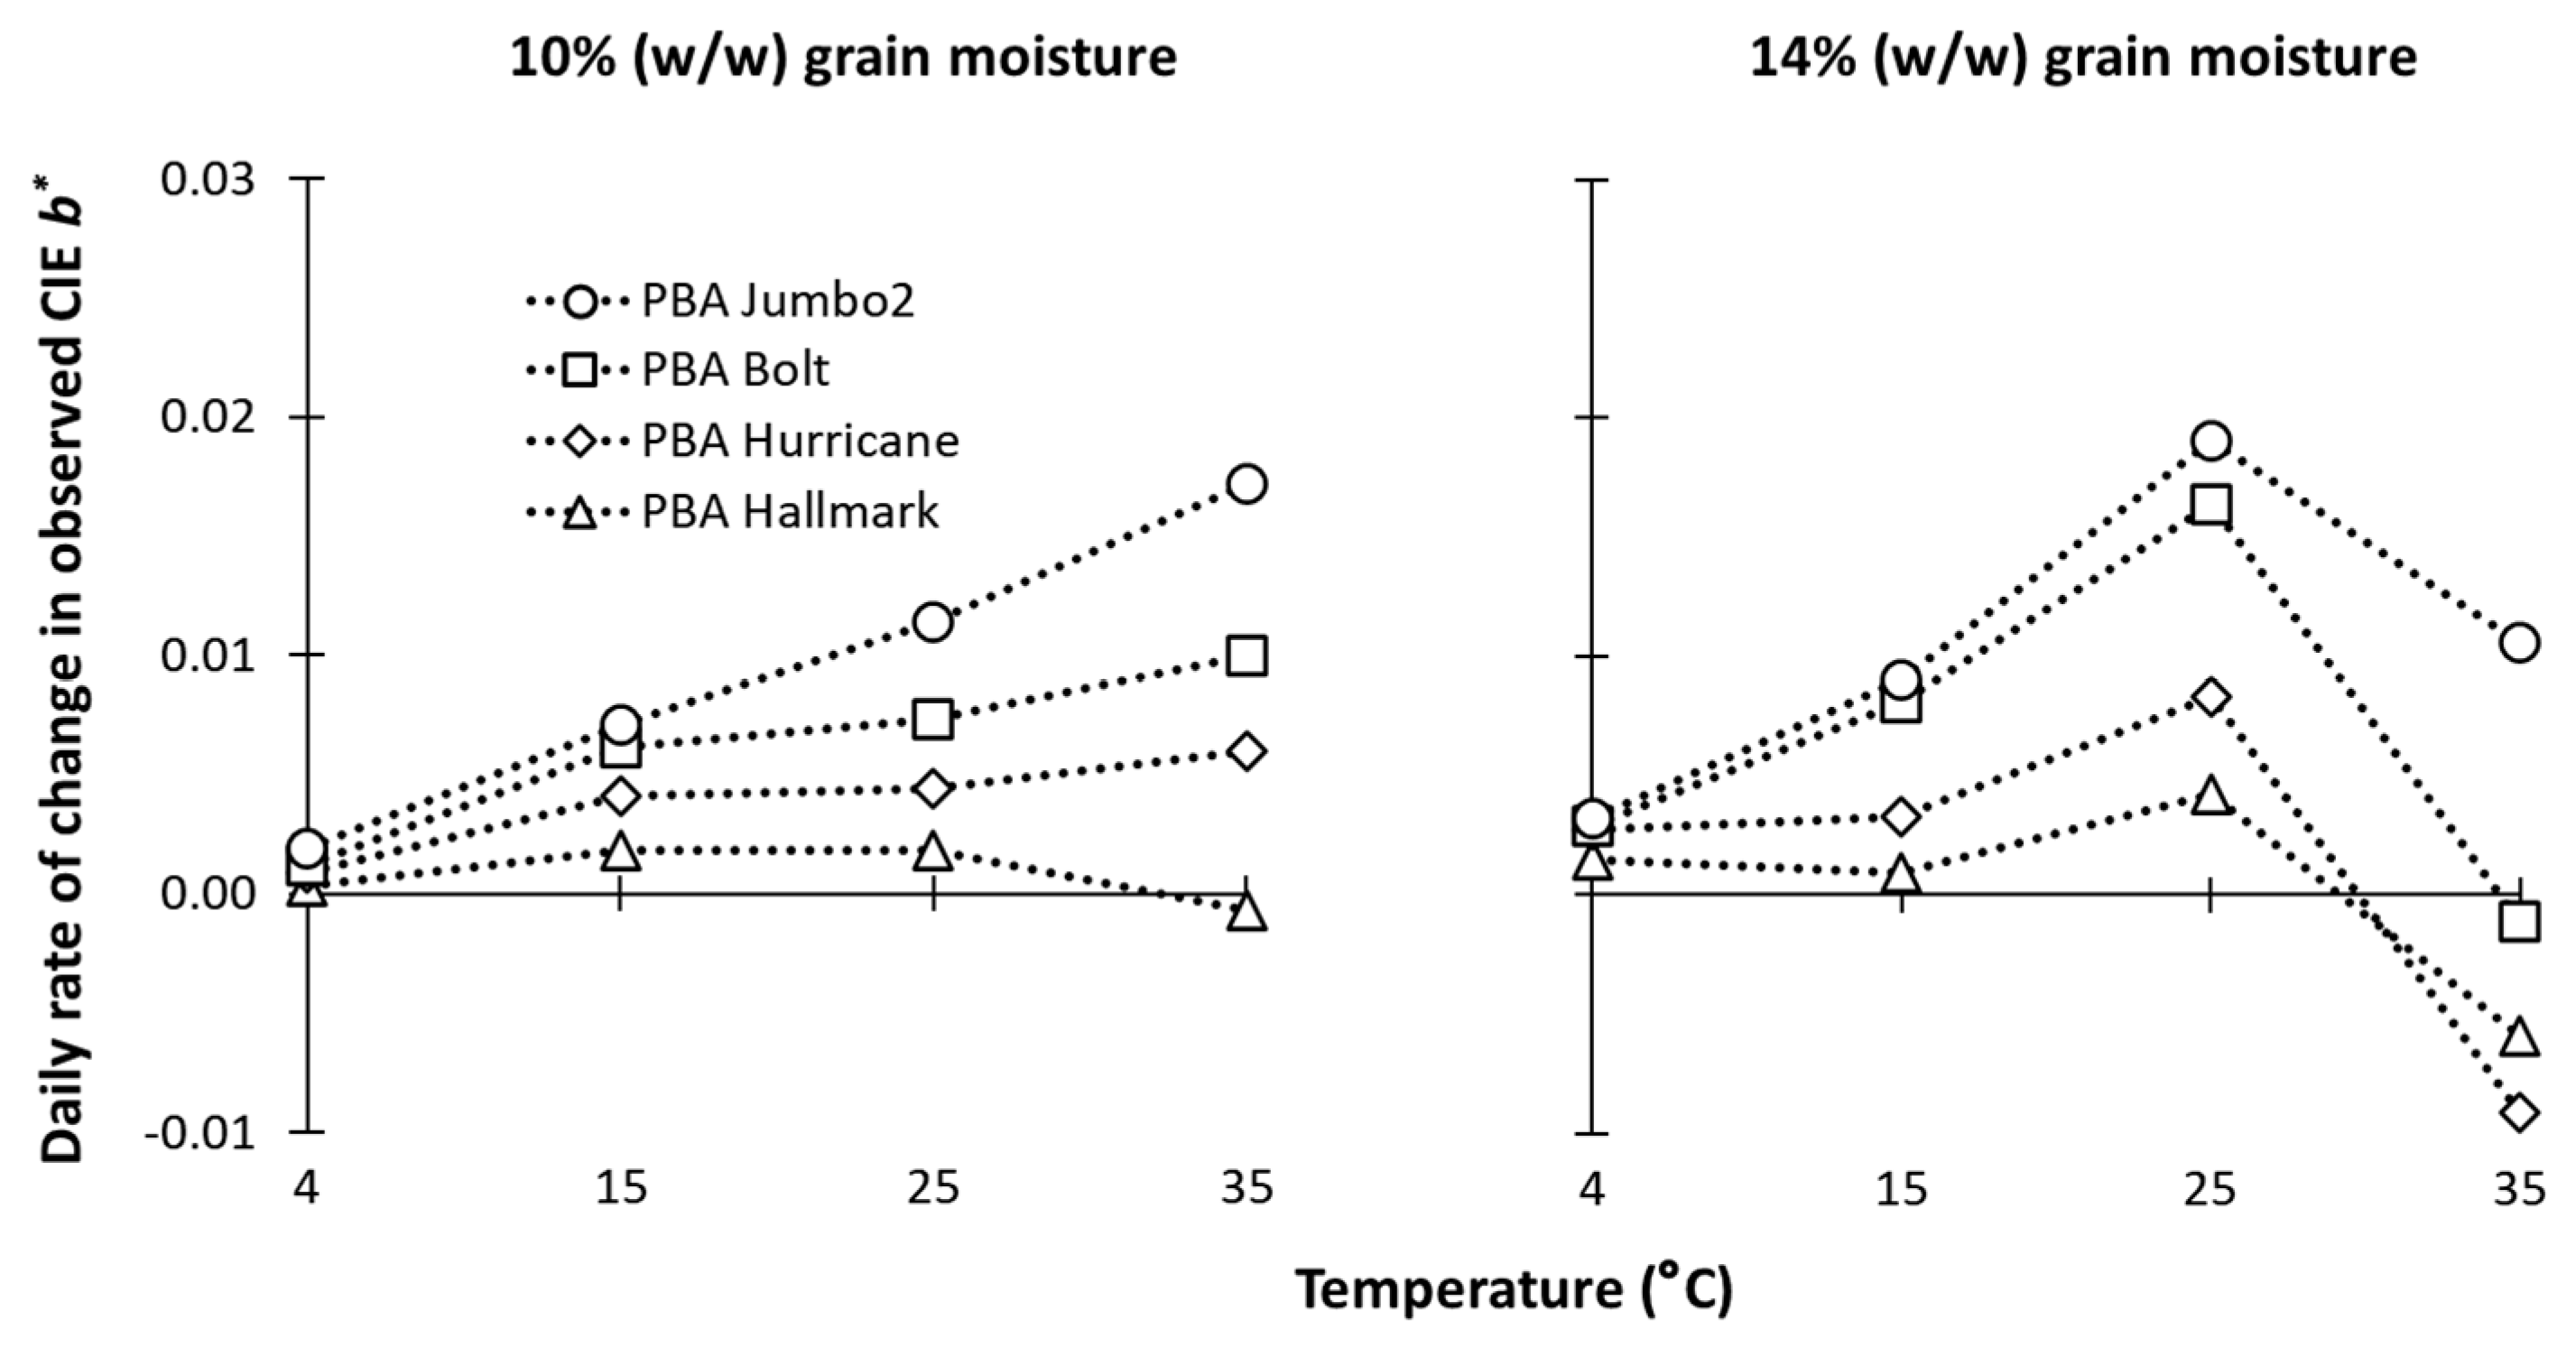
2.4. Determination of Rate Constants

Rate constants (A, B, a1, a2, and b1 and b2) are parameters that derive daily rate of change together with environmental variables for each cultivar and three colour states. The daily rates of change in seed coat colour states were calculated using the equation (Equation (1) as described below) at each moisture content. To obtain a single equation that will apply to the fitted range of both temperature and moisture content, simultaneous equations were solved by algebraic solution or fitting regression equations. These equations apply a temperature function that is influenced by moisture driven coefficients (Equation (2) as described below). A quadratic equation is the simplest non-linear function to explore three equations to solve the four coefficients.
A two-step process comprised of firstly fitting the change in seed coat colour per day to temperature for the two levels of moisture content measured (10 and 14%) with an assumed third moisture content of zero percent providing a zero rate of change:
Rate of change in seed coat colour per day = At2 + Bt + C
where:
  • ‘A’ represents a squared temperature coefficient.
  • ‘B’ represents a linear temperature coefficient.
  • ‘C’ represents the rate of change at 0 °C (which is assumed to be zero).
The second step required fitting the A and B coefficients to moisture content resulting in the single rate equation:
Rate of change in seed coat colour per day = (a1m2 + a2m) × t2 + (b1m2 + b2m) × t
where ‘a1’ and ‘a2’ are new coefficients of the square temperature term, ‘b1’ and ‘b2’ are coefficients of the linear temperature term, ‘m’ is the grain gravimetric moisture content (%), and ‘t’ is temperature (°C). Because a quadratic function was fitted with three levels of moisture content, the ‘a’ and ‘b’ fitted coefficients become perfect fits with zero standard error. However, the full equation provides an acceptable fit and with high accuracy (high R2 and low errors, Table 1) for each cultivar. Details of the quadratic equations developed for the red lentil cultivars PBA Hallmark, PBA Hurricane, PBA Bolt, and PBA Jumbo2 and their performance are provided in Table 1.

2.5. Model Verification and Validation

Repetitive testing of the model was conducted to establish that the model performs as designed, where the model correctly calculated the rate and state as programmed across the diverse storage conditions. The modelled state variables of brightness (CIE L*), redness (CIE a*), and yellowness (CIE b*) were subsequently tested against the measured data that were used to derive the rate variables. Unbiased validation of the model was assessed using two independent data sets.
The first dataset monitored seed coat colour of PBA Hallmark and PBA Jumbo2 stored at either 15 or 35 °C in a laboratory setting [18]. In this case, initial colour values were (± standard error) CIE L*, a*, and b* (42.7 ± 0.170, 8.7 ± 0.124, and 14.6 ± 0.774) for PBA Hallmark and (48.4 ± 0.249, 7.2 ± 0.181, and 12.3 ± 0.608) for PBA Jumbo2.
The second dataset comprised observations of PBA Hallmark stored within a bulk storage system under ambient environmental conditions. An experiment was conducted for 150 days where the lentil grain of PBA Hallmark was stored in a small, commercial silo with an approximately 15 tonne capacity. PBA Hallmark grown in the Horsham district (located in southeastern Australia) were harvested during December 2022, before being stored in an on-farm silo without aeration. On 28 February 2023, this grain was moved to a silo situated in a north-facing position at the Agriculture Victoria Horsham SmartFarm experimental site in Victoria, Australia. The silo was fully exposed to the sun and was located at coordinates 36°45′07″ S latitude and 142°06′52″ longitude [19].
Temperatures within the silo were monitored at 33 different points using continuous logging temperature and humidity sensors including Telesense [20] and Elitech [21]. Sensors were placed at three heights within the silo: 1.25 m from the base of the silo (bottom), in the centre of silo which was 3.5 m from the base of the silo (middle) and 5.25 m from the base of the silo (top) (Figure 5). Within each level, two Telesense spears [20] with embedded temperature and humidity sensors, within a cylindrical metal pipe, were positioned horizontally at equidistant intervals of 0.99 metres from the centre of the silo wall. The placement of these sensors (points 1, 2, 10, and 11) within the silo was carefully selected to maintain 0.3 metres distance from the silo wall (Figure 5). At each level of the silo, one spear assembled with seven temperature and humidity sensors of the Elitech brand (model number RC-51H) [21] were horizontally positioned at the centreline of the silo. The Elitech sensors were manually assembled within a metal pipe, to ensure symmetry of sensor placement at the centre of the silo. Four sensors (points 3, 4, 8, and 9) were positioned close to the silo wall (0.15 and 0.3 metres from both the north and south end of the silo), two sensors (points 5 and 7) were positioned in the middle (0.65 metres from both ends of the silo), and one sensor (point 6) was positioned at the centre of the silo (Figure 5). The sensors near the silo wall (points 1, 2, 3, 4, 8, 9, 10, and 11) were expected to experience a greater influence from external temperatures, with the potential to observe greater change in seed coat colour. In contrast, the sensors in the middle and at the centre were expected to exhibit lower influence from external temperatures and have a greater buffering capacity. This, in turn, was expected to have a lesser impact on seed coat colour.
The daily average temperature was collected at each point over the course of 150 days (Supplementary Tables S1–S3). Grain samples were collected within close proximity to the sensors at 30-day intervals and tested in a laboratory for grain moisture content (Supplementary Table S4) with near infrared technology using a rapid content analyser (Model XDS manufactured by FOSS Hilleroed, Denmark). Seed coat brightness (CIE L*), redness (CIE a*), and yellowness (CIE b*) were also measured using a Minolta Spectrophotometer (CR-410, Hamburg, Germany) based on the Commission Internationale l’Elcairage (CIE) values under the L*, a*, and b* systems. The seed coat colour traits of the PBA Hallmark stored in the silos including CIE L*, a*, and b*, had initial values (± standard error) of 39.5 ± 0.311, 8.2 ± 0.149, and 13.0 ± 0.204, respectively.
The temperature, grain moisture content, and colour traits were averaged across 33 monitoring points as no significant difference in the rate of change in colour traits was observed across these points. Averaged temperature and grain moisture values were used as inputs to the same equation (Equation (2) and Table 1) that was developed to simulate the change in seed coat colour of PBA Hallmark. The simulations were verified by comparing the averaged observed changes in seed coat colour traits. The agreement between the observed and simulated values for model validation in both laboratory and bulk storage settings was assessed using Lin’s Concordance Correlation Coefficient (CCC) as described by Steichen and Cox [22]. The CCC is a numerical measure that ranges from -1 to 1, with perfect agreement at 1.

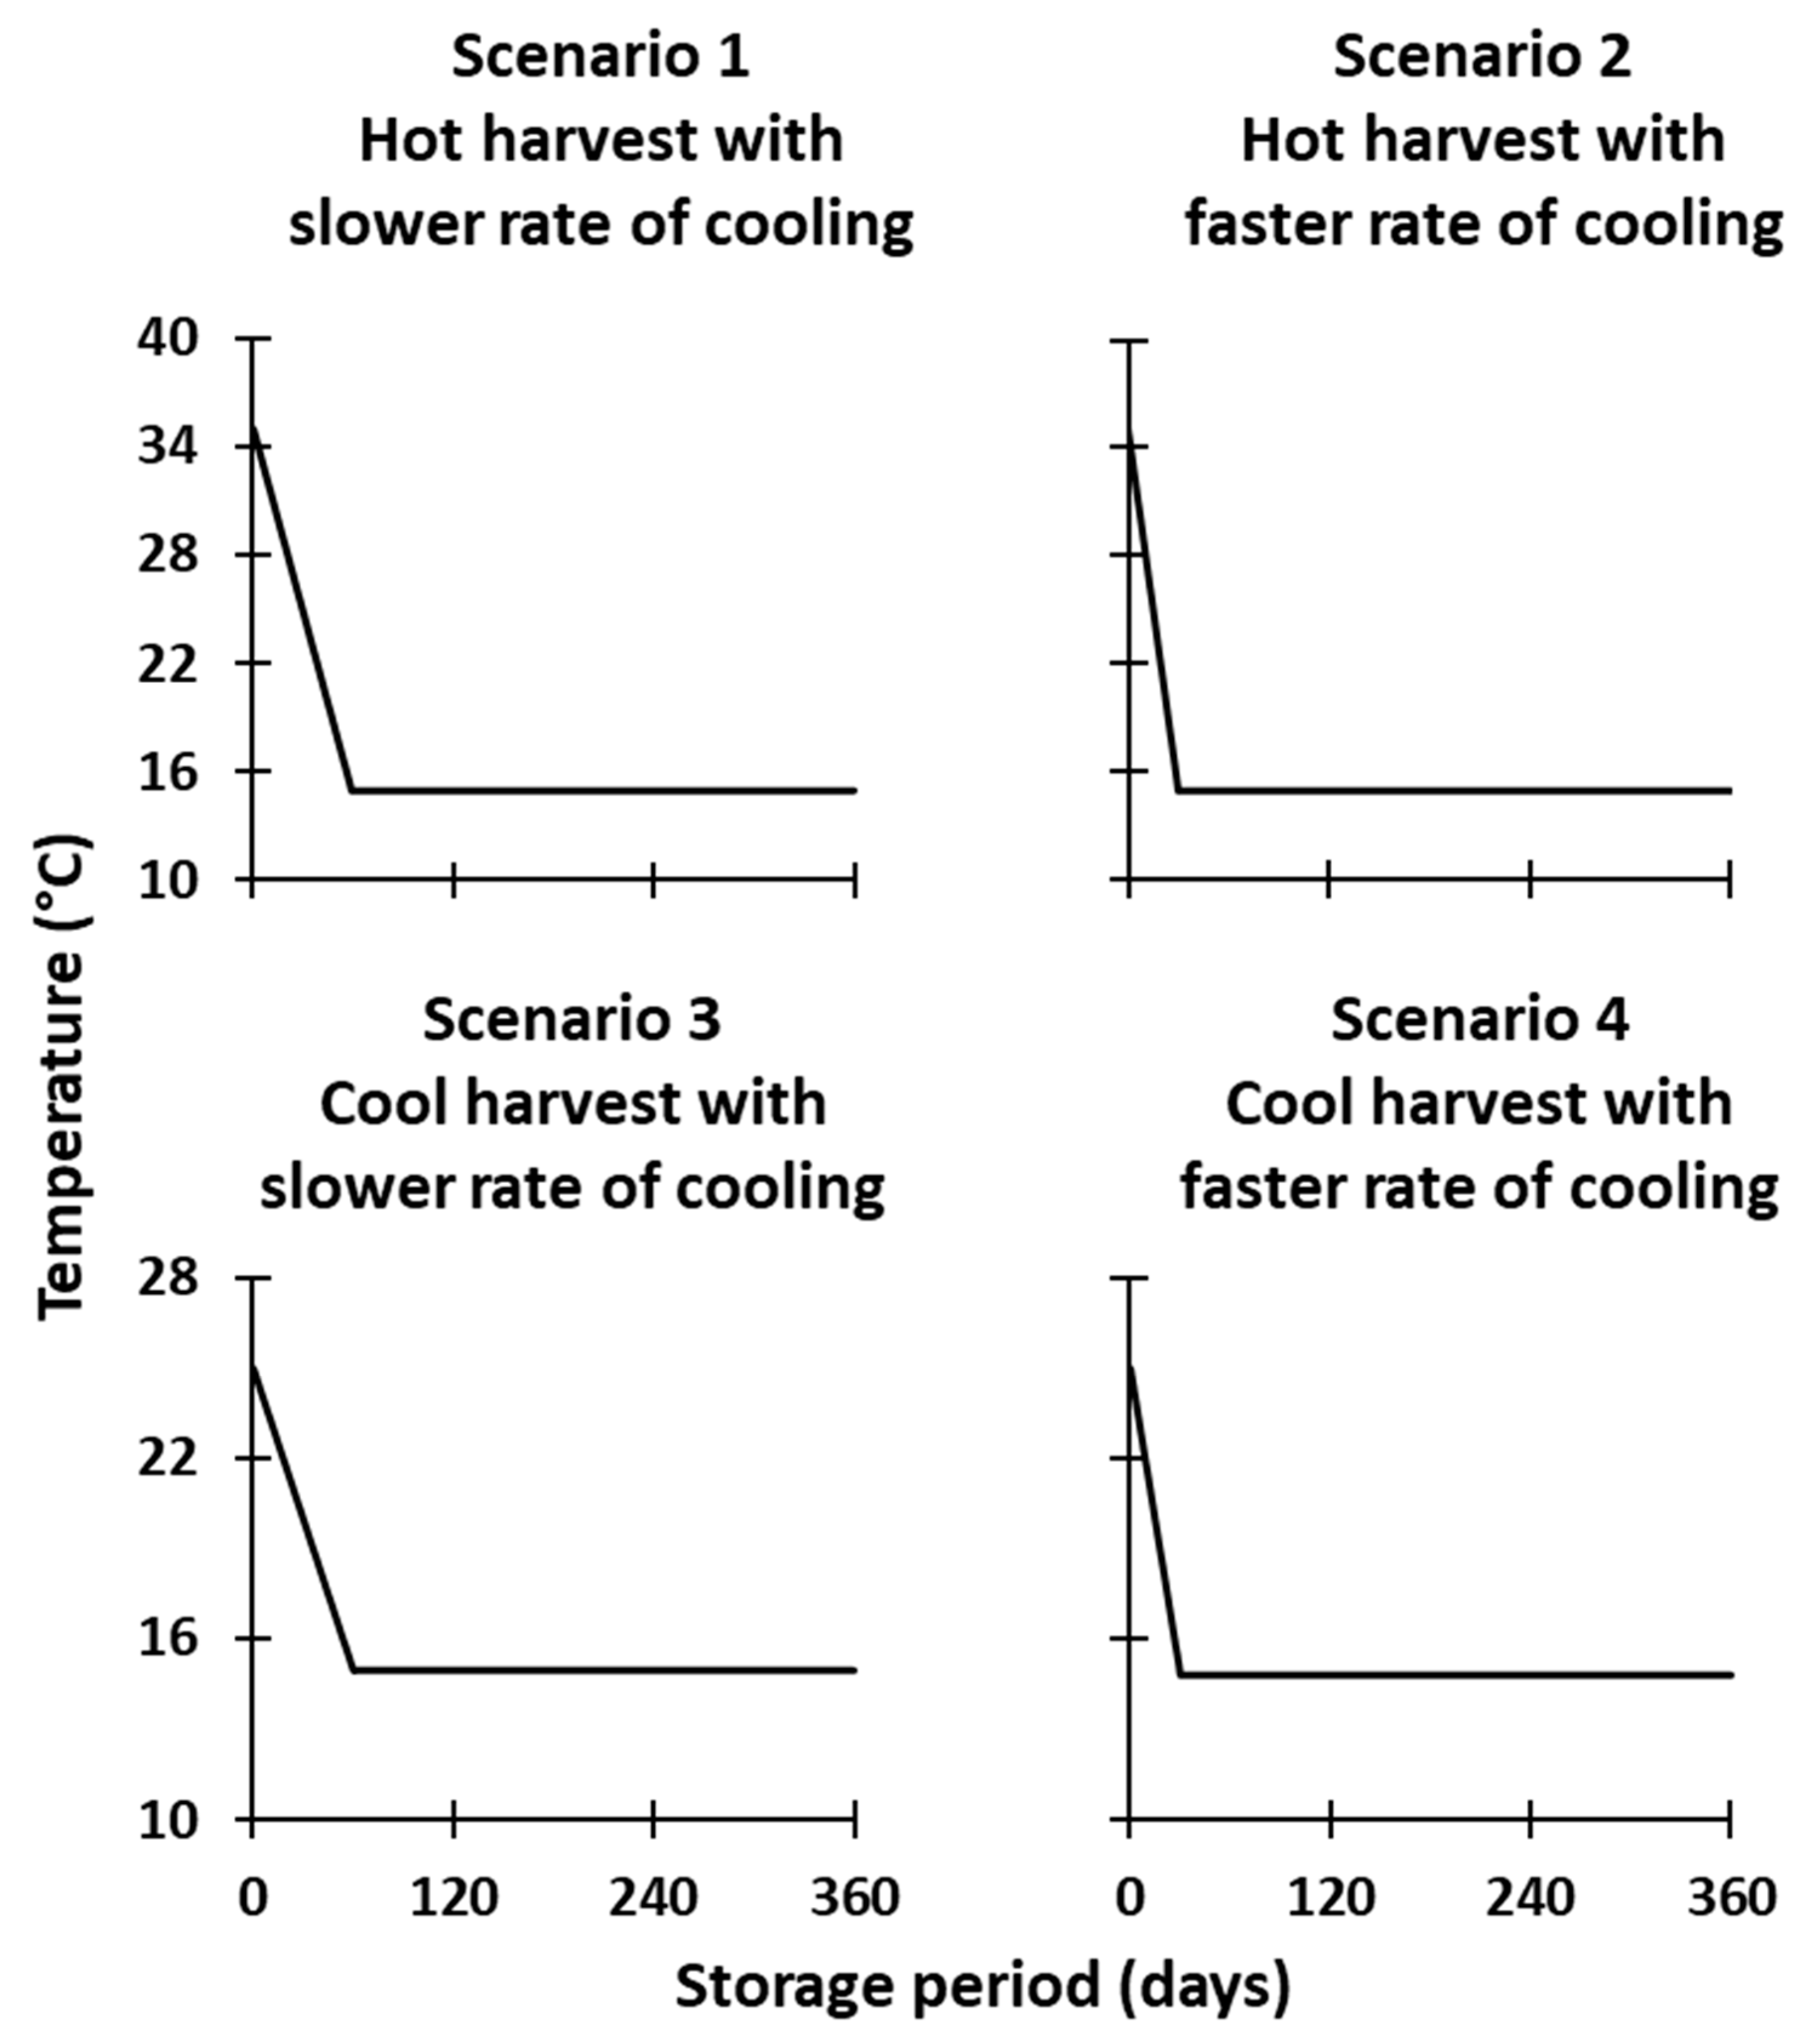
2.6. Simulation under Different Storage Scenarios

The previous study [1] indicated that storing lentil grain at or above 25 °C results in deterioration in seed coat colour, while storage temperatures at or below 15 °C result in limited change in seed coat colour. Drawing on this reference, four hypothetical scenarios were developed to test the hypothesis that either harvesting lentils under cool conditions prior to storage or actively cooling the stored grain can help to minimise the degradation in seed coat colour. The rate of cooling for these scenarios was determined by reducing the harvest temperature to 15 °C within either a 30-day or 60-day period, based on the findings of a previous study [1]. To explore these hypothetical scenarios, the final, validated model was run for PBA Hallmark, assuming a grain moisture content of 10% (w/w). The first scenario represents a year where the grain is harvested at a hot temperature of 35 °C and placed in storage where a slow rate of cooling, 0.34 °C per day, occurred until a temperature of 15 °C was reached and then maintained (Figure 6). The second scenario represents a hot harvest (35 °C) where the grain was stored and a faster rate of cooling was applied to the system, 0.67 °C per day until 15 °C was reached and maintained. Similarly, the third scenario reflected a cool harvest temperature of 25 °C with a slower rate of cooling (0.16 °C per day) until 15 °C was reached and maintained. The fourth scenario represents a cool harvest (25 °C), and a fast rate of cooling was applied to the stored grain (0.34 °C per day) until 15 °C was reached and maintained. Since the grain with higher temperatures requires higher rates of cooling to equilibrate with the ambient temperature compared to the grain with lower temperatures, a higher rate of cooling was applied to the hot harvest and lower rates were used for the cool harvest scenario. Seed coat brightness (CIE L*), redness (CIE a*), and yellowness (CIE b*) were simulated against these scenarios for a storage duration of 360 days, considering the same initial values of CIE L*, a*, and b* (43.7, 10.5, and 17.6) for model simulation and comparison purposes.

3. Results

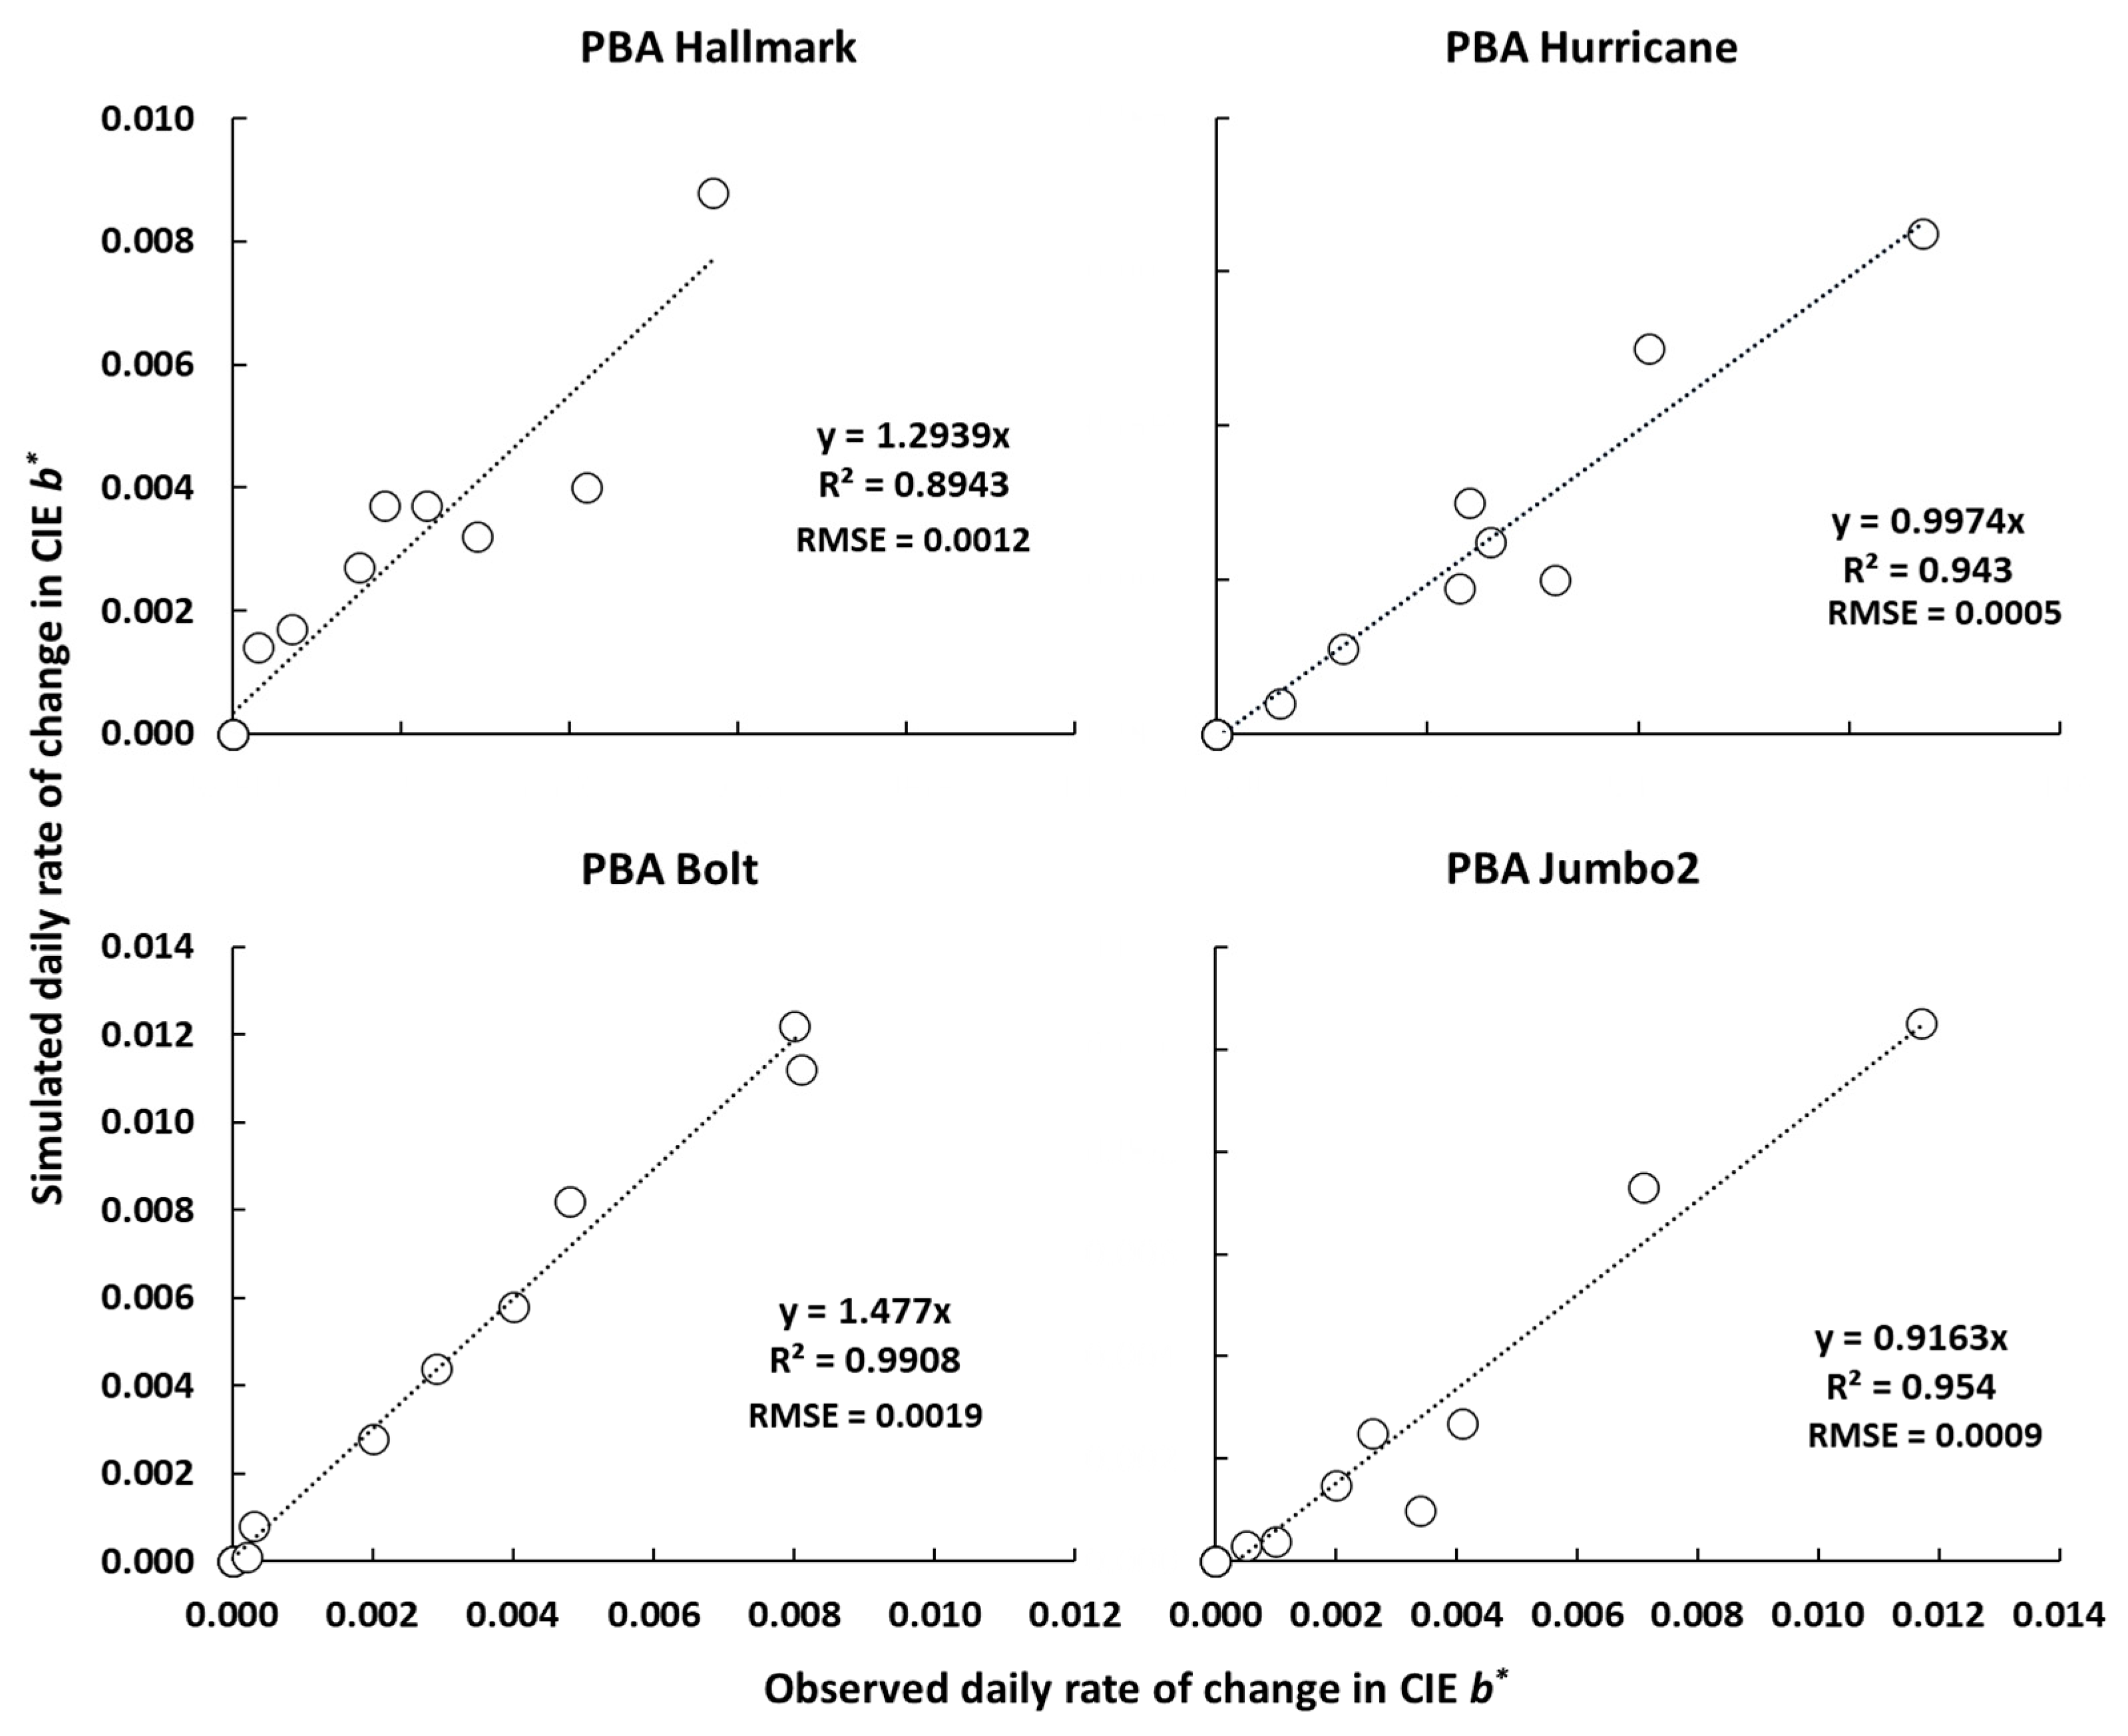
3.1. Performance of the Model

Performance test of the explanatory model was carried out by simulating the change in seed coat colour traits for all tested cultivars (PBA Hallmark, PBA Hurricane, PBA Bolt, and PBA Jumbo2) using the same data set from which the model was developed. While fitting the observed (measured in the experiment) rate of change in seed coat colour traits (brightness CIE L*, redness CIE a*, and yellowness CIE b*) against the simulated rate of change, the regression line exhibited a close fit, with R2 values at or above 0.89 and with low associated root mean square errors (RMSE) (≤0.0019) (Figure 7, Figure 8 and Figure 9) across all tested cultivars. This observation shows a high level of accuracy in simulating rates of change in colour traits, indicating that the model demonstrates good explanatory performance in the primary driving variables for modelling seed coat colour traits in red lentils.

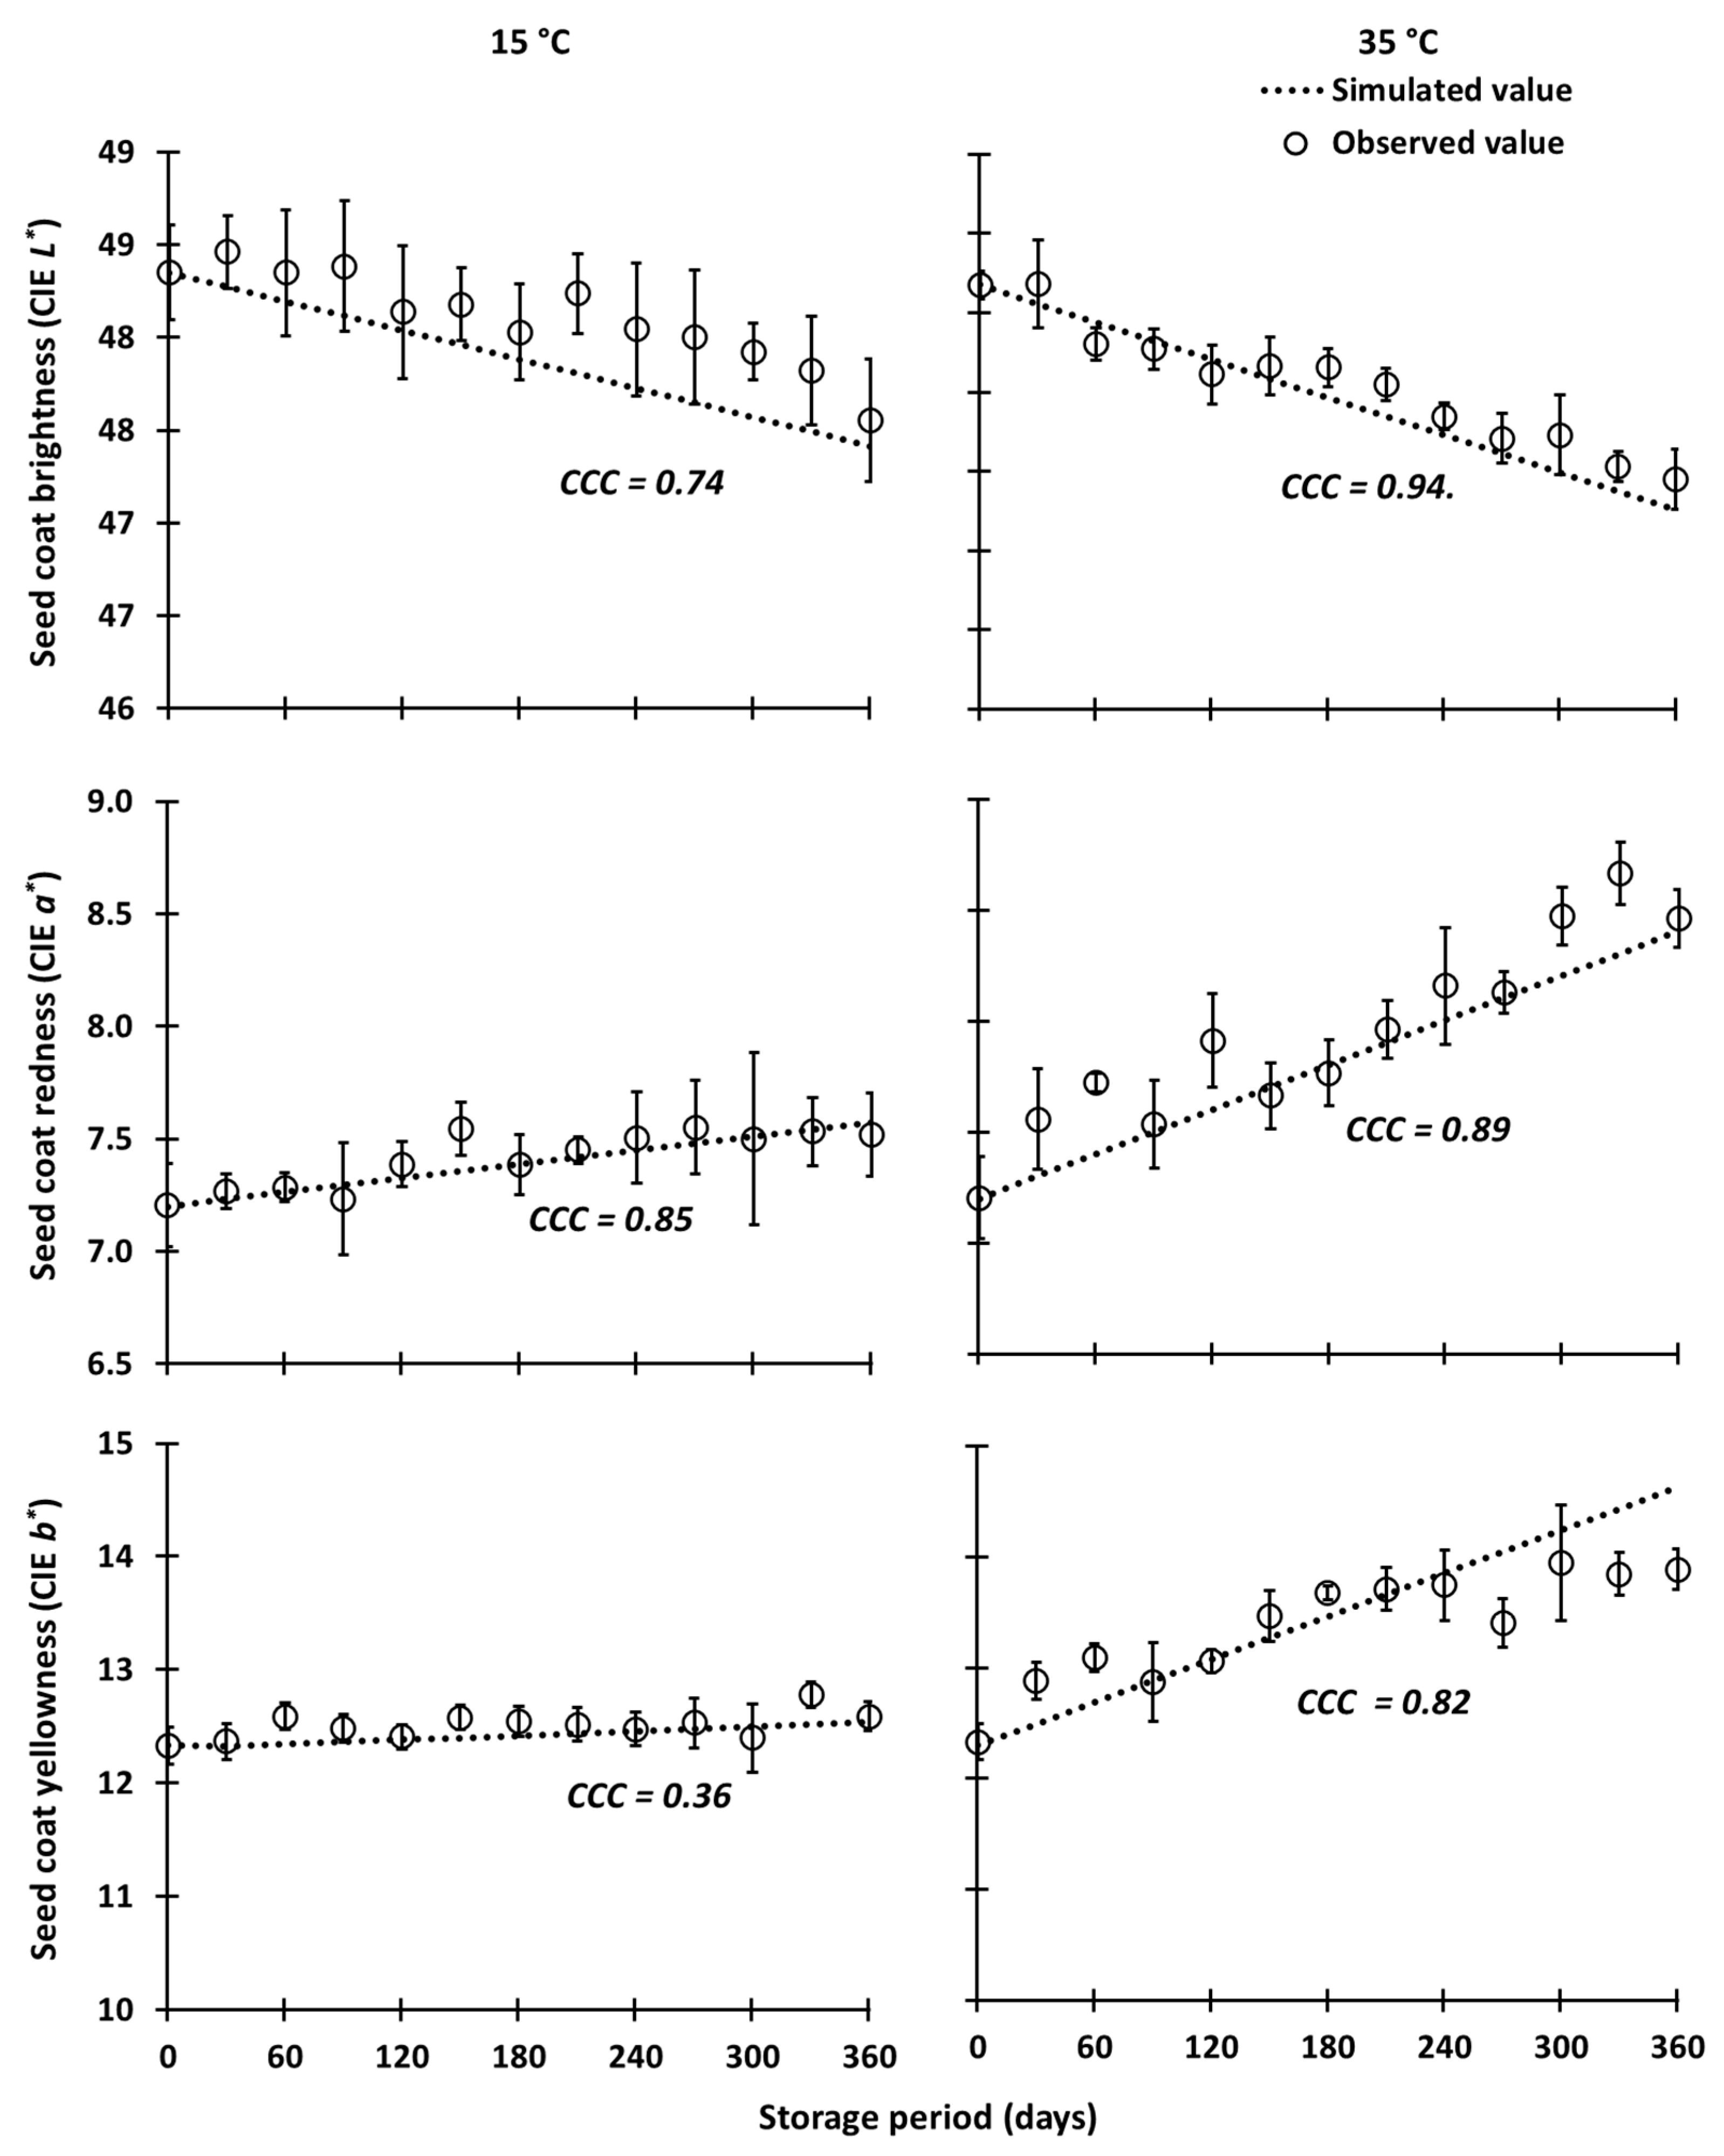
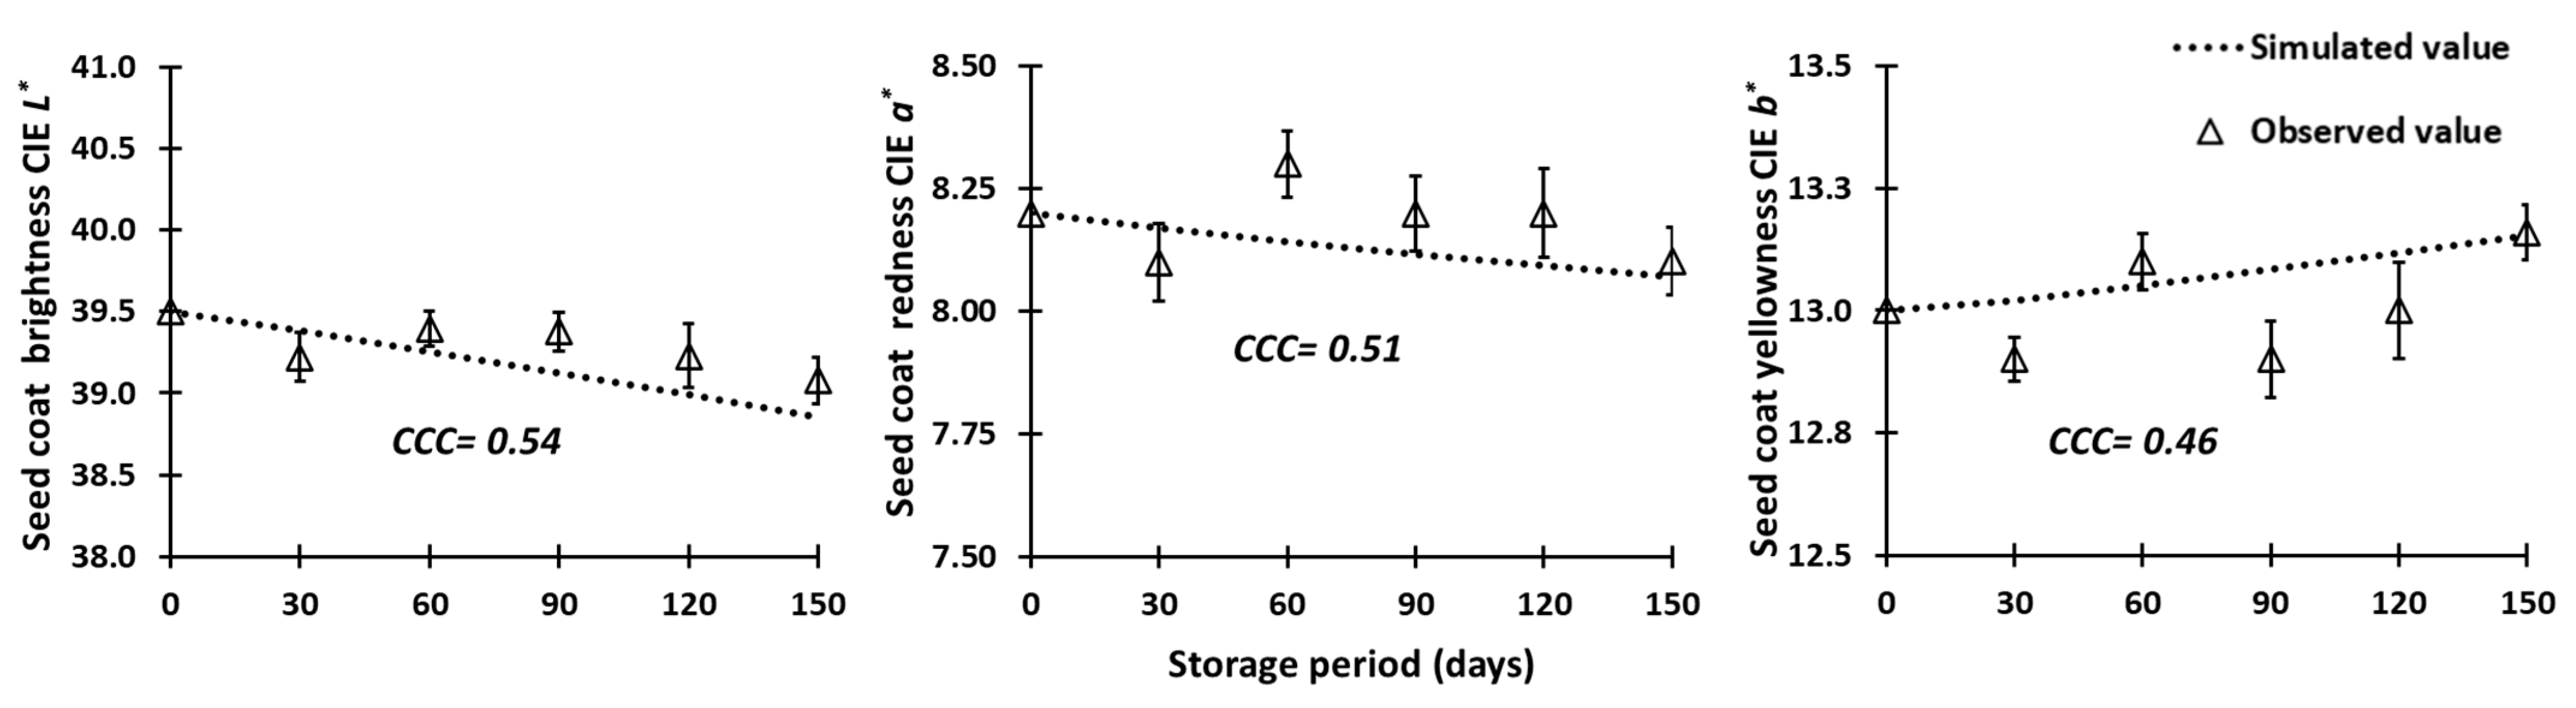
3.2. Model Validation

After achieving reasonable performance in the rate variables, this model was validated against: (1) an independent data set consisting of changes in seed coat colour traits for PBA Hallmark and PBA Jumbo2 [18], and (2) for PBA Hallmark, in an independent bulk storage experiment in a field condition.
Validation of model performance using laboratory experiment data sets revealed that the simulated values of changes in seed coat colour (CIE L* and a*) across cultivars and temperatures were not greatly different from the observed values, as indicated by Lin’s Concordance Correlation Coefficient (CCC) and the observed standard errors (Figure 10 and Figure 11). The CCC is a useful performance indicator, but it assumes that a “gold” standard reference measurement is available to test another model against it. In our case, we assumed that the mean of the three colour measurements in each point for all colour traits is a sufficient reference standard; Figure 10 and Figure 11 support this. The seed coat colour trait, CIE b* for PBA Jumbo2 exhibited a minimal difference between the simulated and observed values (Figure 11), while PBA Hallmark stored at a 14% grain moisture content and 35 °C did not show an agreement between simulated and observed values (Figure 10). However, the average simulated value for the change in CIE b* of PBA Hallmark at a 14% grain moisture content and 35 °C across time closely aligned with the average observed values. The CCC between the simulated and observed values across seed coat colour traits for PBA Jumbo2 suggest a moderate correlation at 15 °C (CCC = 0.82–0.74) and strong correlation at 35 °C (CCC = 0.82–0.94). In the case of PBA Hallmark, the CCC for CIE L*, a*, and b* at 15 °C (CCC = 0.47–0.71) suggests a moderate correlation, while it was strongly correlated at 35 °C (CCC = 0.81–0.90), except for CIE b* at a 14% grain moisture content, which exhibited no strong correlation (CCC = 0.01).
Validation under the bulk storage system for PBA Hallmark showed reasonable performance of the model, whereby no great differences between observed and simulated values across traits occurred as indicated by CCC and the observed standard error (Figure 12). The CCC values between the simulated and observed values across the traits were observed as a moderate correlation (CCC = 0.46–0.54).
The combination of the observed low standard error and moderate CCC between the observed and simulated values in both the laboratory and bulk storage system suggests a reasonable agreement between the model simulations and the observed measurements of the independent data for both cultivars across the traits CIE L* and CIE a* but not for CIE b* in PBA Hallmark at 35 °C. This indicates that the model’s performance is generally acceptable for all colour traits across the cultivars tested.

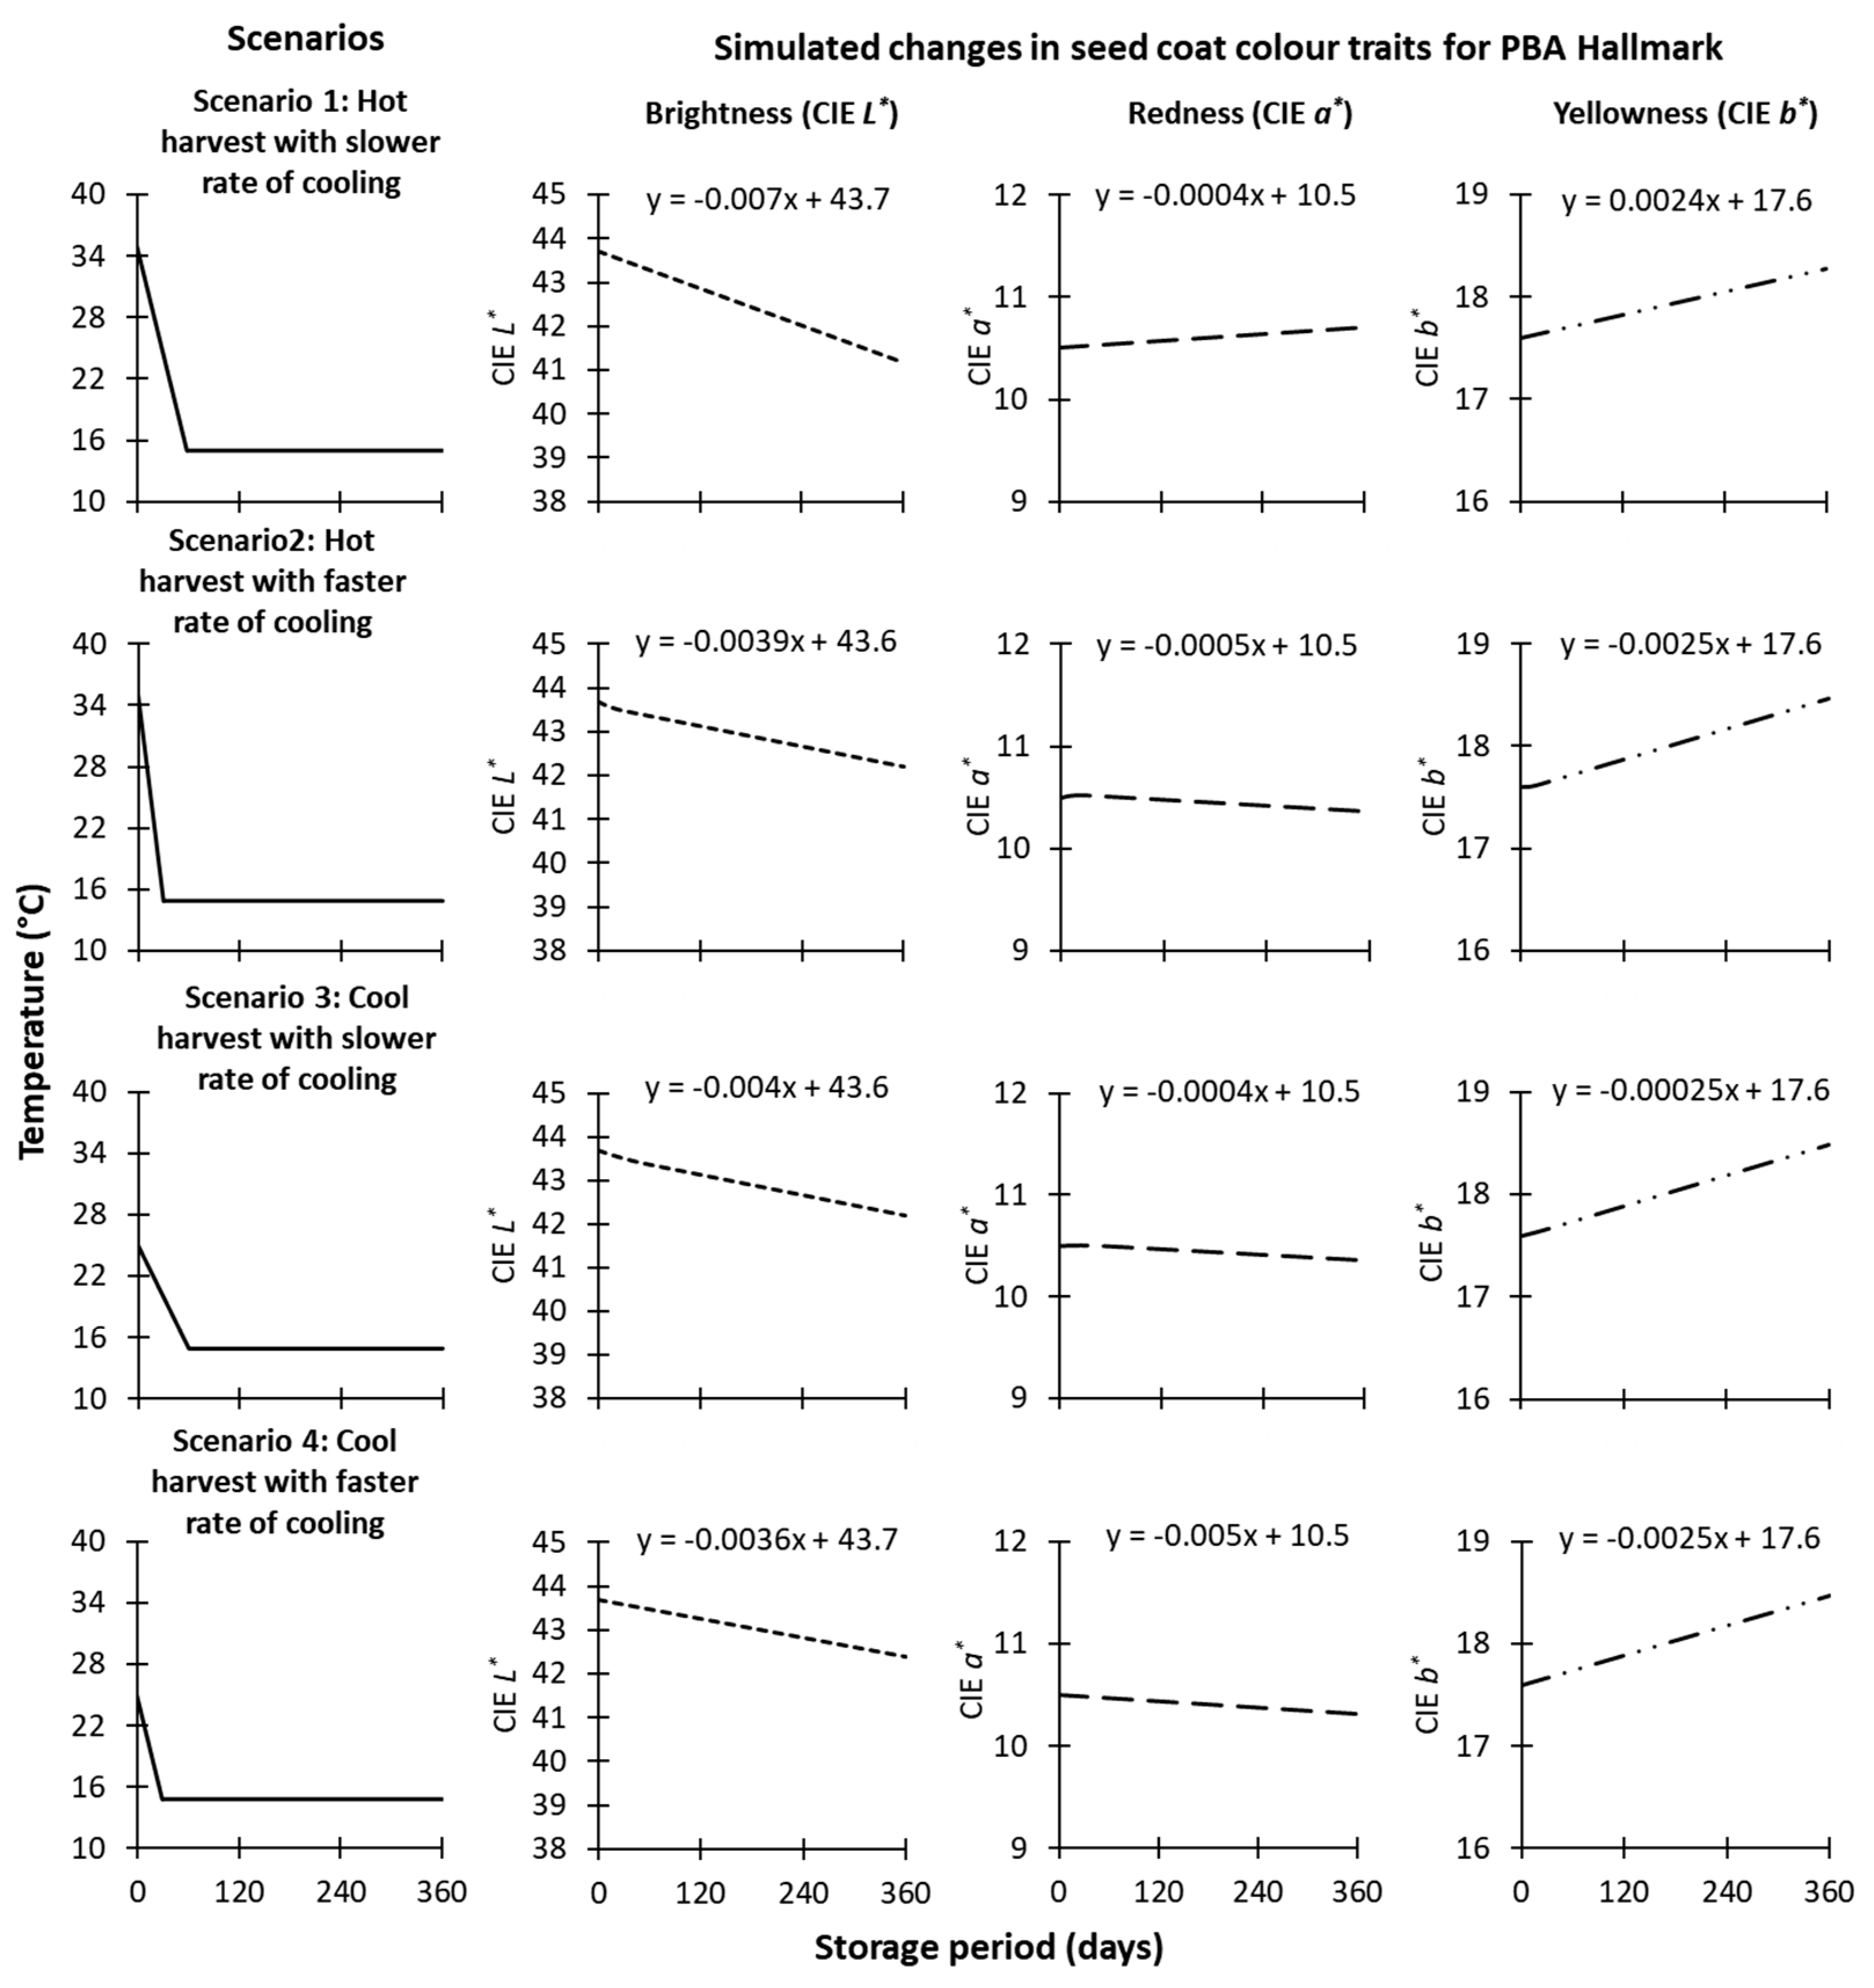
3.3. Simulation of Storage Scenarios

The developed explanatory model demonstrated acceptable performance when a range of validation tests were undertaken for the red lentil cultivar PBA Hallmark. The current simulation test was used to understand how lentil colour would be expected to response under various potential storage scenarios relevant to industry. If PBA Hallmark were harvested at a hot temperature scenario of 35 °C at a 10% (w/w) grain moisture content and stored for 360 days, and a slow rate of cooling (0.34 °C cooling/day) was applied after storage until 15 °C was reached and maintained, the simulated seed coat brightness suggests that the brightness would reduce by 0.007 CIE L* per day (Figure 13). In contrast, the simulated rate of reduction in brightness in grains stored under hot harvest conditions with a faster rate of cooling (0.67 °C cooling/day until 15 °C was reached and maintained) was nearly half the rate (0.0039 CIE L*/day) compared with the slower rate of cooling (0.007 CIE L*/day). Two scenarios, a hot harvest with fast cooling (0.67 °C cooling/day) and a cool harvest (25 °C) with slow cooling (0.16 °C/day until 15 °C was reached and maintained), demonstrated similar rates of change in seed coat brightness (~0.004 CIE L*/day). Furthermore, the scenario with the cool harvest (25 °C) and fast cooling (0.34 °C/day until 15 °C was reached and maintained) further reduced the rate of reduction in brightness compared with the other three scenarios tested. Simulated rates of change in seed coat redness (CIE a*) and yellowness (CIE b*) for these four scenarios suggested that these traits undergo minimal changes, with the same rate of change in each trait regardless of cooling treatments (Figure 13).
Harvesting at a cool temperature or increasing the cooling rate delayed seed coat darkening, suggesting an extended storage period without degradation compared to grain harvested at a hot temperature and not cooled. For example, the simulated rate of reduction in brightness for hot harvests with a slow rate of cooling was predicted to take 140 days to reduce one unit of CIE L*. On the other hand, both hot harvests with fast rates of cooling and cool harvests with slow rates of cooling extended storage time for an additional 90 days by delaying the one-unit reduction in CIE L*. Lentils harvested at cool temperatures and stored with a fast rate of cooling were predicted to be able to be stored up to 270 days without a one-unit reduction in CIE L*.

4. Discussion

With uncertainty in lentil grain prices, demand, and supply, lentil growers are opting to store lentils on-farm to mitigate financial risk. However, environmental conditions such as grain moisture content and temperatures within the storage systems, can downgrade lentils by darkening their seed coat colour [1]. Predicting changes to the seed coat colour of lentils ensures that grain traders comply with established standards and ensure that the grain colour meets export customer expectations of a clean bright grain product at the time of purchase [23,24]. A biophysical model, which predicts the change in seed coat colour under given storage management and environmental conditions, may be useful in optimising on-farm storage practices and retaining the economic value of grain.
The simulation tests conducted on the model under different harvest temperatures and cooling scenarios suggest that a model can be applied to inform a wide range of harvest and storage scenarios to mitigate the risk in seed coat colour decline. Simulation tests also underpin sensitivity analysis for defining important management factors within optimal storage systems.
This simulation test supports the proposal that active cooling [1] can have a positive impact on maintaining seed coat colour of lentils harvested at high temperatures. In addition to hot harvests with active cooling, harvesting lentils at cool temperatures and/or with subsequent cooling can be beneficial for preventing degradation in seed coat colour during long-term storage.
The value of testing the potential storage scenarios encountered within the industry, allows for a sensitivity analysis to perform the likely effect of different storage conditions on lentil quality, such as assessing the seed coat colour. The simulation test also highlights the principles that are important for optimal storage conditions and supports industry education on best management practices. For example, if lentil grains are harvested under high-temperature conditions, the model can assist growers in determining optimal rates and duration of cooling to prevent the deterioration of the lentil seed coat in storage over time. This biophysical model can assist growers or traders to identify the appropriate temperatures and grain moisture within the storage facilities required to extend storage or for transporting the grain.
While the comprehensive STELLA systems modelling framework was employed, a very simple model without feedbacks or feedforwards was initially constructed (Figure 4). This model was quite accurate despite the performance in CIE b*, as CIE L* and a* were more representative of the change in seed coat colour over time than CIE b*. The prediction of CIE b* across cultivars was developed through an average rate of change over the storage period. This led to a mismatch between the observed and simulated values for PBA Hallmark at 35 °C. Therefore, a more comprehensive model may be necessary if CIE b* is required. A biophysical model which includes CIE b* may involve positive and negative exponential behaviour that is modelled with feedbacks in STELLA. Nevertheless, additional data are required across a range of moisture contents and temperatures to the expected extremes, which are likely to occur in storage systems in dry and hot environments. A much longer period of storage (~2 years) also needs considering. In this study, independence between the colour traits was assumed; however, there is a possibility of co-dependence between the colour traits that maybe important in long-term storage. Investigating the relationship of co-dependence in the colour values will strengthen the nature of the response of the rate of change, thus providing robust utility in the management of colour in lentil over time in storage.
The model developed in this study was derived from a critical set of observations; specifically, changes in seed coat colour were measured at 30-day intervals over a period of 360 days stored at two moisture contents (10 and 14% w/w) and four temperatures (4, 15, 25, and 35 °C). To enhance the explanatory capabilities of the model, it is important to consider a more comprehensive range of environmental factors. This includes grain moisture content (e.g., at zero and greater than 20%), temperatures (at zero and greater than 35 °C), the storage system size and shape, insect infestation, storage atmospheres, storage elevation, changes in bioactive compounds, and the availability of light within the storage system. The model was exclusively developed for four red lentil cultivars. Expanding the scope to encompass a broader range of cultivars would be advantageous for both growers and traders as this study demonstrated different rates of change in seed coat colour traits in the cultivars tested (Figure 1, Figure 2 and Figure 3). In addition, spatial variation associated with storage environmental conditions over time within larger storage systems needs to be quantified; therefore, enabling the colour values to be mapped within the grain storage system. Mapping spatial variation could inform high-risk zones within current storage systems, such as along the walls, which may be exposed to external temperature fluctuations. These maps may assist in informing optimal design approaches for new storage systems.
The biophysical model also provides the possibility to simulate storage temperature by linking the real-time monitoring temperature from a large-scale storage system with meteorological ambient temperature. This has been reported in barley, where there was a time lag between seasonal and ambient temperature and the temperature within the centre of the bulk grain storage system [25]. If the relationship between meteorological temperature data and the temperature within a storage system is established, then the simulated storage conditions using meteorological data can be incorporated as inputs to the model. However, other variables may impact model performance, including the spatial and temporal variability within the storage system, the relationship to daily temperatures, the elevation of the storage system, consideration of the various types and sizes of storage systems, and grain size and packing density within the storage system. Similarly, as humidity directly influences the grain moisture content within the storage system [26], the biophysical model offers an opportunity to transform the explanatory model developed in this study by directly incorporating humidity data instead of grain moisture content. This is particularly relevant as timely monitoring of humidity using real-time sensors [27] within storage systems is more practical than monitoring grain moisture content.

5. Conclusions

The explanatory biophysical model developed in this study can predict the change in seed coat colour of lentils with reasonable concordance to the observed data, based on the provided temperature and grain moisture content during storage. This predictive capability can assist growers and traders in making well-informed managerial decisions to improve storage conditions, thereby preventing degradation and retaining the economic value of the grain. The model can also be applied to perform sensitivity analysis for various storage scenarios, providing insights into optimal storage conditions and management practices to prevent degradation or to extend the storage period. Upscaling this model to the commercial scale and validating it across a range of storage systems and conditions in the next step can enhance its effectiveness as an economic decision tool in the pulse grain industry in the future.
Further research is required to scale up and validate the model for predicting changes in the seed coat colour of stored lentils in commercial-scale storage facilities of varying types, sizes, and shapes. This research should be conducted at both spatial and temporal scales to ensure the accuracy of the model’s performance and its applicability to a range of real-world scenarios. Similarly, this opens avenues for adapting and modifying the model to predict other quality traits in lentils or other grain types in storage facilities.

Supplementary Materials

Supporting information can be downloaded at: https://www.mdpi.com/article/10.3390/agronomy14020373/s1, data s1: Figure S1: Change in seed coat brightness (CIE L*) in four red lentil cultivars stored at two moisture and four temperatures level for 360 days; Figure S2: Change in seed coat redness (CIE a*) in four red lentil cultivars stored at two moisture and four temperatures level for 360 days; Figure S3: Change in seed coat yellowness (CIE b*) in four red lentil cultivars stored at two moisture and four temperatures level for 360 days; Table S1: Daily average temperatures recorded over a period of 150 days at different points at the top level of the silo; Table S2: Daily average temperatures recorded over a period of 150 days at different points at the mid-level of the silo; Table S3: Daily average temperatures recorded over a period of 150 days at different points at the bottom level of the silo, Table S4: The moisture content of the grain samples at various points within the top, middle, and bottom levels of the silo, measured at 30-day intervals over a period of 150 days.

Author Contributions

B.B.: investigation, data collection, data analysis, modelling, statistical analysis writing—original draft and subsequent editing J.G.N.: supervision, conceptualization methodology, review and editing; and C.K.W., A.J.W. and G.J.F.: supervision, review and editing, G.J.O.: mentoring, methodology, modelling, statistical analysis, review and editing. All authors have read and agreed to the published version of the manuscript.

Funding

This research was funded by the Victorian Grains Innovation Partnership as a part of the “Capturing the Value of Grains On-Farm” project under a collaboration between Agriculture Victoria and the Australian Grains Research Development Corporation (GRDC), grant ID GRDC 8049295.

Data Availability Statement

All data or analyses generated during this study are presented in this article.

Acknowledgments

This research was funded through the Victorian Grains Innovation Partnership, a collaboration between Agriculture Victoria and the Australian Grains Research Development Corporation (GRDC). This work is a part of the PhD study of the senior author, for which the authors would like to acknowledge The University of Melbourne for supporting this PhD program. The authors also would like to acknowledge the helpful guidance of the PhD Chair Dr Kate Howell. The authors would like to acknowledge the technical assistance provided by Rusal Argall, Janaka Puran Kumburage, and Darryl Blair in conducting the experiment and sampling. The authors are also grateful to the Crop Quality and Crop Agronomy technical teams at the Grains Innovation Park for providing the necessary technological and technical support.

Conflicts of Interest

The authors declare no conflicts of interest.

References

  1. Bhattarai, B.; Walker, C.K.; Wallace, A.J.; Nuttall, J.G.; Hepworth, G.; Panozzo, J.F.; Partington, D.L.; Fitzgerald, G.J. Storage Temperature and grain moisture effects on market and end use properties of red lentil. Agronomy 2023, 13, 2261. [Google Scholar] [CrossRef]
  2. Belasco, R.; Edwards, T.; Munoz, A.J.; Rayo, V.; Buono, M.J. The effect of hydration on urine color objectively evaluated in CIE L*a*b* color space. Front. Nutr. 2020, 7, 576974. [Google Scholar] [CrossRef] [PubMed]
  3. Kim, H.-K.; Kim, S.-H. Effect of the number of coloring liquid applications on the optical properties of monolithic zirconia. Dent. Mater. 2014, 30, e229–e237. [Google Scholar] [CrossRef] [PubMed]
  4. Karim, A.; Hassan, A.; Akanda, M.; Mallik, A. Monitoring food storage humidity and temperature data using IoT. MOJ Food Process Technol. 2018, 6, 400–404. [Google Scholar]
  5. Junxiang, G.; Jingtao, X. Fruit cold storage environment monitoring system based on wireless sensor network. Procedia Eng. 2011, 15, 3466–3470. [Google Scholar] [CrossRef]
  6. Lutz, É.; Coradi, P.C.; Jaques, L.B.A.; de Oliveira Carneiro, L.; Teodoro, L.P.R.; Teodoro, P.E.; Meneghetti, V.L.; de Souza, G.A.C. Real-time equilibrium moisture content monitoring to predict grain quality of corn stored in silo and raffia bags. J. Food Process Eng. 2022, 45, e14076. [Google Scholar] [CrossRef]
  7. Coradi, P.C.; Lutz, É.; dos Santos Bilhalva, N.; Jaques, L.B.A.; Leal, M.M.; Teodoro, L.P.R. Prototype wireless sensor network and internet of things platform for real-time monitoring of intergranular equilibrium moisture content and predict the quality corn stored in silos bags. Expert Syst. Appl. 2022, 208, 118242. [Google Scholar] [CrossRef]
  8. Zhao, L.; Wang, J.; Li, Z.; Hou, M.; Dong, G.; Liu, T.; Sun, T.; Grattan, K.T.V. Quasi-distributed fiber optic temperature and humidity sensor system for monitoring of grain storage in granaries. IEEE Sens. J. 2020, 20, 9226–9233. [Google Scholar] [CrossRef]
  9. Faree, A.; Wang, Y.; Li, G. Modeling Grain Storage Quality with Linear Regression. In Proceedings of the 2017 3rd IEEE International Conference on Computer and Communications (ICCC), Chengdu, China, 13–16 December 2017; pp. 2904–2909. [Google Scholar]
  10. Zhang, Q.; Li, Z.; Dong, W.; Wei, S.; Liu, Y.; Zuo, M. A model for predicting and grading the quality of grain storage processes affected by microorganisms under different environments. Int. J. Environ. Res. Public Health 2023, 20, 4120. [Google Scholar] [CrossRef] [PubMed]
  11. Szwedziak, K. The Use of Vision Techniques for the Evaluation of Selected Quality Parameters of Maize Grain during Storage. In Proceedings of the XXII International Scientific Conference POLSITA 2019 “Progress of Mechanical Engineering Supported by Information Technology, E3S Web of Conferences, Milan, Italy, 22 November 2019; p. 01026. [Google Scholar]
  12. Wawrzyniak, J. Prediction of fungal infestation in stored barley ecosystems using artificial neural networks. Lebensm.-Wiss. Technol. 2021, 137, 110367. [Google Scholar] [CrossRef]
  13. Wrolstad, R.E.; Smith, D.E. Color Analysis. In Food Analysis; Nielsen, S.S., Ed.; Springer International Publishing: Cham, Switzerland, 2017; pp. 545–555. [Google Scholar]
  14. ISSE_Systems. Technical Document for iTHINK and STELLA Software. Available online: https://www.iseesystems.com (accessed on 1 December 2023).
  15. Ouyang, Y.; Zhang, J.E.; Lin, D.; Liu, G.D. A STELLA model for the estimation of atrazine runoff, leaching, adsorption, and degradation from an agricultural land. J. Soils Sediments 2010, 10, 263–271. [Google Scholar] [CrossRef]
  16. Aassine, S.; El Jai, M.C. Vegetation dynamics modelling: A method for coupling local and space dynamics. Ecol. Model. 2002, 154, 237–249. [Google Scholar] [CrossRef]
  17. Costanza, R.; Voinov, A.; Boumans, R.; Maxwell, T.; Villa, F.; Wainger, L.; Voinov, H. Integrated ecological economic modeling of the patuxent river watershed, maryland. Ecol. Monogr. 2002, 72, 203–231. [Google Scholar] [CrossRef]
  18. Bhattarai, B.; Walker, C.K.; Wallace, A.J.; Nuttall, J.G.; Hepworth, G.; Panozzo, J.F.; Partington, D.L.; Fitzgerald, G.J. Modified storage atmosphere prevents the degradation of key grain quality traits in lentil. Agronomy 2023, 13, 2160. [Google Scholar] [CrossRef]
  19. Panozzo, J.F.; Walker, C.K.; Partington, D.L.; Neumann, N.C.; Tausz, M.; Seneweera, S.; Fitzgerald, G.J. Elevated carbon dioxide changes grain protein concentration and composition and compromises baking quality. A FACE study. J. Cereal Sci. 2014, 60, 461–470. [Google Scholar] [CrossRef]
  20. Telesense. Information Sheet for Telesense Spear. Available online: https://telesense.com (accessed on 1 December 2023).
  21. Elitech. RC-51H PDF Temperature & Humidity Data Logger. Available online: https://www.elitechus.com (accessed on 1 December 2023).
  22. Steichen, T.J.; Cox, N.J. A note on the concordance correlation coefficient. Stata J. 2002, 2, 183–189. [Google Scholar] [CrossRef]
  23. CGC. Official Grain Grading Guide. Available online: https://www.grainscanada.gc.ca/en/grain-quality/official-grain-grading-guide (accessed on 1 December 2023).
  24. GTA. Australian Pulse Standards. Available online: https://www.graintrade.org.au/commodity_standards (accessed on 1 December 2023).
  25. Jayas, D.; Alagusundaram, K.; Shunmugam, G.; Muir, W.; White, N. Simulated temperatures of stored grain bulks. Can. Agric. Eng. 1994, 36, 239–246. [Google Scholar]
  26. Sathya, G.; Jayasl, D.S.; White, N.D.G. Safe storage guidelines for rye. Can. Biosyst. Eng. J. 2008, 50, 3.1–3.8. [Google Scholar]
  27. Plumier, B.; Maier, D. Effect of temperature sensor numbers and placement on aeration cooling of a stored grain mass using a 3d finite element model. Agriculture 2021, 11, 231. [Google Scholar] [CrossRef]
Figure 1. Rate of change in seed coat brightness (CIE L*) for red lentil cultivars stored at 4, 15, 25, and 35 °C and at 10 and 14% (w/w) grain moisture content for 360 days. Error bars across the points were similar and smaller than the symbol size (SE ≤ 0.009).
Agronomy 14 00373 g001
Figure 2. Rate of change in seed coat redness (CIE a*) for red lentil cultivars stored at 4, 15, 25, and 35 °C and at 10 and 14% (w/w) grain moisture content. Error bars across the points were similar and smaller than the symbol size (SE ≤ 0.004).
Agronomy 14 00373 g002
Figure 3. Rate of change in seed coat yellowness (CIE b*) for red lentil cultivars stored at 4, 15, 25, and 35 °C and at 10 and 14% (w/w) grain moisture content. Error bars across the points were similar and smaller than the symbol size (SE ≤ 0.003).
Agronomy 14 00373 g003
Figure 4. Explanatory biophysical model of three seed coat state variables (□, brightness CIE L*, redness CIE a*, and yellowness CIE b*) developed with STELLA and showing the rate of change drivers that reduce or increase colour over time and according to the storage conditions (grain moisture content and temperature, ).
Agronomy 14 00373 g004
Figure 5. Schematic diagram illustrating the positions of sensors at different heights within the silo and subsequent eleven monitoring points of temperature and humidity at the top level (5.25 m from the base). The same number of monitoring points were applied at the same positions at the mid- (3.25 m from the base) and bottom levels (1.25 m from the base).
Agronomy 14 00373 g005
Figure 6. Hypothetical scenarios used to test the sensitivity response of contrasting storage conditions on lentil seed coat colour traits. Both hot and cool harvests with subsequent faster and slower rates of cooling for red lentil grains were considered.
Agronomy 14 00373 g006
Figure 7. Comparison of the simulated and observed rates of change in seed coat brightness (CIE L*) for four red lentil cultivars. Where RMSE is the root mean square of error indicating the performance of the model.
Agronomy 14 00373 g007
Figure 8. Comparison of the simulated and observed rates of change in seed coat redness (CIE a*) for four red lentil cultivars. Where, RMSE is the root mean square of error indicating the performance of the model.
Agronomy 14 00373 g008
Figure 9. Comparison of the simulated and observed rates of change in seed coat yellowness (CIE b*) for four red lentil cultivars. Where RMSE is the root mean square of error indicating the performance of the model.
Agronomy 14 00373 g009
Figure 10. Comparison of change in seed coat colour traits of PBA Hallmark grain. Comparison of simulated and measured values of changes in seed coat colour traits (brightness CIE L*, redness CIE a*, and yellowness CIE b*) of grain stored over a 360-day period at controlled temperatures of 15 and 35 °C and a 10% (w/w) grain moisture content. The error bars represent the 2 × standard error (n = 3) on observed data together with Lin’s CCC.
Agronomy 14 00373 g010
Figure 11. Comparison of change in seed coat colour traits of PBA Jumbo2 grain. Comparison of simulated and measured values of changes in seed coat colour traits (brightness CIE L*, redness CIE a*, and yellowness CIE b*) of grain stored over a 360-day period at controlled temperatures of 15 and 35 °C at 10% (w/w) grain moisture content. The error bars represent the 2 × standard error (n = 3) on observed data together with Lin’s CCC.
Agronomy 14 00373 g011
Figure 12. Comparison of change in seed coat colour traits of PBA Hallmark grain stored at silo condition. Comparison between simulated and measured values of changes in seed coat colour traits (brightness CIE L*, redness CIE a*, and yellowness CIE b*) of grain stored in silo under natural weather conditions over a 150-day period. The error bars represent 2 × standard error (n = 3) on observed data together with Lin’s CCC.
Agronomy 14 00373 g012
Figure 13. Simulation scenarios and predicted change in lentil seed coat colour traits. Predicted change in seed coat brightness (CIE L*), redness (CIE a*), and yellowness (CIE b*), for PBA Hallmark maintained at a 10% (w/w) grain moisture content under different simulation scenarios.
Agronomy 14 00373 g013
Table 1. Initial values of colour traits (seed coat brightness CIE L*, redness CIE a*, and yellowness CIE b*) and fitted rate constant parameters for four red lentil cultivars to the quadratic equations for moisture (m). Number of observations per moisture parameter (n) and R2 and RMSE for the combined moisture and temperature (t) function of the rate of change in seed coat colour trait per day = (a1m2 + a2m) × t2 + (b1m2 + b2m) × t.
Colour TraitsCultivarsInitial Coloura1a2b1b2nR2RMSE
CIE L*PBA Hallmark43.7 (0.86) 1−0.008570.000840.17724−0.0200530.980.0013
PBA Hurricane44.7 (0.15)−0.001700.00005−0.01529−0.0007130.990.0004
PBA Bolt46.5 (0.13)−0.005710.000500.09067−0.0096030.990.0010
PBA Jumbo248.3 (0.09)−0.002720.000250.00641−0.0019931.000.0005
CIE a*PBA Hallmark10.5 (0.13)0.00273−0.00023−0.039320.0031330.980.0005
PBA Hurricane10.1 (0.15)0.000690.000070.00666−0.0036730.990.0001
PBA Bolt9.50 (0.12)0.00160−0.00006−0.00181−0.0022830.990.0005
PBA Jumbo28.00 (0.13)0.00114−0.00009−0.015280.0016130.990.0002
CIE b*PBA Hallmark17.6 (0.14)−0.001320.0004210.05000−0.0020030.890.0012
PBA Hurricane18.5 (0.18)−0.005070.000570.13750−0.0142530.940.0005
PBA Bolt16.4 (0.18)−0.001540.000140.07500−0.0055030.990.0019
PBA Jumbo214.2 (0.86)0.00182−0.00011−0.056430.0050430.950.0009
1 Standard errors for the initial values of the colour traits are in parentheses.
Disclaimer/Publisher’s Note: The statements, opinions and data contained in all publications are solely those of the individual author(s) and contributor(s) and not of MDPI and/or the editor(s). MDPI and/or the editor(s) disclaim responsibility for any injury to people or property resulting from any ideas, methods, instructions or products referred to in the content.

