Article

Metabolomics Analysis of Variation in Grain Quality of High-Quality Japonica Rice

1
Jiangsu Key Laboratory of Crop Genetics and Physiology/Jiangsu Key Laboratory of Crop Cultivation and Physiology, Agricultural College, Yangzhou University, Yangzhou 225009, China
2
Jiangsu Co-Innovation Center for Modern Production Technology of Grain Crops, Yangzhou University, Yangzhou 225009, China
*
Author to whom correspondence should be addressed.
Agronomy 2024, 14(3), 430; https://doi.org/10.3390/agronomy14030430
Submission received: 18 January 2024 / Revised: 18 February 2024 / Accepted: 20 February 2024 / Published: 23 February 2024
(This article belongs to the Section Crop Breeding and Genetics)

Abstract

:
In recent years, the semi-glutinous japonica rice variety has been extensively utilized in Jiangsu Province to greatly increase rice quality. Nevertheless, the increasing occurrence of seed variation presented a major threat to rice quality. Enhancing the quality of rice grains has emerged as a critical factor in guaranteeing consumer acceptance. Throughout this investigation, five lines (VJ1, VJ2, VJ3, VJ4, and VJ5) selected from the Nanjing9108 population in Liyang were used as research materials, and original cultivars of Nanjing9108 (CKJ1) provided by the original breeder were utilized as control materials to compare rice quality and differential metabolites. VJ4 and VJ3 demonstrated a significant reduction in milled rice rate and head milled rice rate when contrasted to CKJ1. Compared with CKJ1, the amylose content of the five strains was significantly increased. Only VJ3 amplified the 106 bp target band, and its 2-AP content was 0 ng/g. Most metabolites are mainly enriched in cutin, suberine, wax biosynthesis, histidine, and tryptophan metabolism. The primary metabolites throughout the metabolic pathway involve lipids and lipid-like molecules (mono palmitin, alpha-eleostearic, and palmitic acid) and amino acid metabolites (L-glutamate, L-tryptophan, and L-serine). The identification of these key metabolites helps in the discovery of prospective biomarkers for screening seed variation throughout seed production.

1. Introduction

Rice (Oryza sativa L.) is among the most crucial food commodities. China holds the distinction of being the foremost producer of japonica rice globally, with the highest yield and the greatest planting area of japonica rice. According to the National Statistical Yearbook (2021), China’s rice planting area was about 29,921 thousand hectares in 2021, ranking second globally, and its total production was about 21,842 million tons, ranking first in the world. Jiangsu Province is the highest japonica rice-producing area in the southern rice area [1]. In the past 20 years, semi-glutinous japonica varieties with outstanding taste quality have been gradually promoted in production and recognized by the public, and 34 varieties with excellent taste had been approved by 2021. The proportion of high-quality varieties in large-scale production reached more than 95%, of which the proportion of japonica rice with good taste accounted for 50% [2]. However, recently, the problem of seed degradation in large-scale production has greatly affected the industrialization of high-quality rice.
Because of Chinese advancements in terms of its economy and the progress of reform of agricultural supply-side structure, improving rice quality is of great significance for stabilizing the balance of agricultural supply and demand and improving agricultural economic benefits [3]. Rice quality is the basic characteristic of commodity circulation. Usually, rice quality characteristics include milling qualities (milled rice, brown rice, and head rice rates), appearance qualities (chalky grain percentage), cooking and eating quality (taste value, texture properties, and pasting properties), and nutritional qualities (protein content) [4]. Chen et al. [3] investigated the chemical constitution and gelatinization characteristics of 36 rice varieties and revealed that the amylose content had a variation of 38.6% in taste value. A negative relationship was observed between the taste value and protein content (r = −0.953, p < 0.01) and amylose composition (r = −0.915, p < 0.05) [5]. Furthermore, the aroma is a crucial diagnostic attribute of rice consumption quality, which can significantly influence the pre-evaluation acceptance or rejection of rice [6]. Throughout the past few years, with the advancement of numerous studies, it has been confirmed that 2-acetyl-1-pyrroline (2-AP) represents the most significant part of the aroma of aromatic rice [7,8].
The primary constituents of rice, including protein, amylose, lipid, vitamin, and amino acid metabolites, are also strongly associated with rice quality [9]. Therefore, investigating variations in rice quality and related metabolites between various lines of the same variety is beneficial in maintaining seed quality and improving rice quality. As an important branch of system biology, metabolomics is a science and technology that qualitatively and quantitatively analyzes all endogenous small molecule compounds with molecular weight less than 1000 Da in organisms to explore plant metabolic networks and related gene functions. The traceability analysis of plants with different growth environments and producing areas was carried out by metabolomics technology. In recent years, metabolomics has also made great advancements in plant research and has made great progress in crop nutrients and quality evaluation [10,11,12,13]. A large-scale metabolomics study was conducted using GC-MS and UHPLC-MS/MS on a diverse set of rice genotypes, and 121 metabolites were identified that significantly distinguished the two subspecies. The metabolomics data clearly showed that the contents of gamma-tocopherol, gamma-tocotrienol, and pyridoxine in indica grain were higher than those in japonica grain, but the contents of phytic acid, gluconate, and niacinamide were lower than those of japonica grain [14]. To determine the function of lipids in cooked rice textural quality, Jeanaflor et al. [15] used UPLC-MS and related software and online databases to observe significant differences in lipids between waxy rice and non-waxy rice. Significant associations were identified between putative lipids that constitute the amylose-lipid complex and the amylose content and viscosity parameters [15].
In this investigation, Nanjing9108 from the same provenance was collected as the material, and the quality differences among different lines were systematically compared. This study employed a non-targeted metabolomics approach to examine the metabolomics profiles of various lines. The quality degradation reasons among different lines of the same source were further revealed, which served as the foundation for the degradation of high-quality rice and provided new technical support for improving the quality and efficiency of high-quality rice.

2. Materials and Methods

2.1. Test Materials and Field Design

We selected five lines (VJ1, VJ2, VJ3, VJ4, and VJ5) with similar agronomic traits in the field from the original production field of Nanjing9108 in Liyang as test materials, and the control variety (CKJ1) was the Nanjing9108 original seed supplied by the primitive seed unit. The study was performed in 2022 at the Innovation Experimental Base of Zhang Hongcheng, Yangzhou City, Jiangsu Province. The planting process started on the eighteenth of May, followed by transplantation on the seventeenth of June. The cultivation method is blanket seedling raising. Each line was planted with a 30 cm × 17 cm row spacing, and the basic seedlings were 19,500 holes/ha. One seedling was planted per hole. The implementation of fertilizer and pest control, water management, and other cultivation procedures were carried out based on the conditions of high-yield cultivation.

2.2. Sample Collection

After the ripening of five lines and the control line, three biological replicates were obtained for each line, and brown rice was produced from the rice. In total, 18 samples of brown rice were produced for non-targeted metabolomics experiments. The remaining rice was harvested, threshed, and dried to determine rice quality.

2.3. Determination of Agronomic Traits and Yield Traits

The heading stage refers to the date on which 80% of the rice panicles revealed the flag leaf sheath. The maturation stage is the stage when more than 95% of the solid kernels are yellow and ripe. Plant height is the height from the ground to the top of the spike (excluding the awn). Ten plants were measured consecutively in the field before harvest. At the time of rice maturity, 10 holes were surveyed in each line to determine the number of spikes per hole, the number of spikelets per panicle, and the percentage of filled grains. After the rice harvest, when the moisture content was 14.5%, the 1000-grain weight was determined (1000 grains were weighed, 5 replications).

2.4. Determination of Rice Quality

The brown rice (BR), the milled rice (MR), and the head milled rice (HMR) rates were estimated based on the National Guidelines of the People’s Republic of China (GB/T 17891-2017) [1]. The study employed the rice appearance scanner (MRS-9600TFU2L, Shanghai, China) to assess the chalkiness rate (CHR) and chalkiness degree (CD) of the rice. The taste quality of the prepared rice was assessed using a taste analyzer (STA1A, SATAKE, Hiroshima, Japan), with the ‘Japanese japonica rice’ preset selection being utilized for the identification line. According to the method of Ma et al. [1], the physical properties of cool rice, namely its hardness, springiness, stickiness, and balance, were evaluated using the SMS Texture Analyzer (TA. Xt. Plus, Stable Micro Systems, Godalming, UK) with a P/36R probe as per the manufacturer’s instructions.
The amylose content (AC) of the rice was determined using the method of Liu et al. [9] with some modifications. The nitrogen composition of the sample was identified using the Kjeldahl nitrogen estimation method, and the findings were then multiplied by a conversion factor of 6.25 to calculate the crude protein composition, driving at the national standard of the People’s Republic of China (GB 5009.6-2016) [1]. Sucrose (M1201A) and plant starch contents (M1101A) were determined using the kit instructions of Suzhou Mengxi Biological Medicine Technology Co., Ltd. (Suzhou, China).

2.5. Determination of Starch Extraction Content

The isolation of starch was conducted based on Zhang et al.’s technique with slight changes [16]. To eliminate the protein composition, a solution of sodium hydroxide (30 mL, PH = 9–11) was used to steep 20 g of rice flour with 10 mg·g−1 alkaline protease and shaken out for a period of 24 h at room temperature. The rice flour and protease solution were homogenized by a sieve of 200 meshes and placed in a 50 mL centrifuge tube. The starch slurry that underwent filtration was subjected to centrifugation at a speed of 7100 g for a period of 20 min. The supernatant was neglected, and the upper residual layer with a faint color was eliminated; subsequently, the re-suspension of the residual white layer was performed by means of 20 mL of deionized water, followed by centrifugation again at a speed of 7100 g for a period of 10 min. This supernatant was eliminated, and the above centrifugal steps were performed five times to guarantee the complete elimination of impurities. Eventually, starch was dehydrated at a temperature of 30 °C under ambient pressure and extracted with a sieve of 200 meshes.

2.6. Determination of Swelling Power and Water Solubility

The swelling power and expansion potential of starch were identified by the Konik-Rose et al. method [17]. After weighing about 30 mg of pure starch sample (m0), we put it in a 2 mL Eppendorf centrifuge tube (m1). Consequently, 1 mL of ultrapure water was supplemented, and the sample was shaken for 1 h at 90 °C. Subsequently, this mixture underwent centrifugation at 4000 g for a period of 10 min. The total weight (m2) of the supernatant was weighed using a pipette gun, and it was dried and weighed at a temperature of 60 °C (m3). The colloid adhered to the tube wall was utilized as its water swelling weight.
Solubility (%) = 100 × (m0 + m1 − m3)/m0 × 100%;
Swelling power (g/g) = (m2 − m1)/(m3 − m1).

2.7. DNA Marker Analysis

According to the results of previous reports, the genotypes of each line were identified by InDel-E2 functional markers [18]. Specific primer sequences are shown in Table S1. Leaves were taken from the middle ten plants of each plant in the field, and DNA was extracted by a conventional method [19]. PCR amplification was conducted in accordance with Shi et al., and on 3% agarose gels, the PCR products were resolved and observed [20].

2.8. Determination of 2-AP Content

Combined with Yang et al. and other methods [21], the extraction of 2-AP pre-processing was improved. The brown rice under test was taken from the refrigerator at −80 °C and put in the mortar. At the same time, an appropriate amount of liquid nitrogen was added to keep a certain low temperature and quickly grind it into powder.
Sample extraction: 2.0 g of ground samples were weighed and placed in a clamp bottle, and 10 mL of chromatographically pure dichloromethane was added. The sealing ring was affixed, secured, and shaken thoroughly. Subsequently, the numerical identifier was inscribed, and the serial number on the bottle was repeated. The repeated bottles of the same treatment were fixed with a rubber band and put into a water-filled ultrasonic cleaning machine, 40 kHz, 40 °C, ultrasonic 8 h after removal. Following the cooling of the sample bottle to room temperature, 2 g anhydrous sodium sulfite was supplemented, and the supernatant was immediately sucked using a 1 mL sterile syringe and inserted into the headspace sample bottle via an organic needle filter membrane (pore size 0.22 μm, 13 mm). Subsequently, a quantity of 0.2 mg·kg−1 2,4,6-Trimethylpyridine (TMP) was added as an internal standard, and GC-MS was performed immediately.
Gas chromatography-mass spectrometry (GC-MS): the relative composition of 2-AP was calibrated by Shimadzu GC-MS QP 2010 plus gas chromatography-mass spectrometry and the standard internal technique 2,4,6-trimethylpyrimidine (TMP). Chromatographic conditions: the chromatographic column was RTX-5MS (30 m × 0.32 mm × 0.25 μm). The RTX-5MS column’s temperature was planned to initiate at 40 °C subsequent to injection. Following 1 min, the temperature was raised to 65 °C at incremental rates of 2 °C min−1 for a period of 1 min. Subsequently, the temperature was raised to 220 °C at 10 °C min−1. The carrier gas was high-purity helium (≥99.999%). The volume of injection administered was 2 μL. The mass spectrometer was operated using an electron impact (EI) ionization mode with an electron energy of 70 eV. The ion source temperature was set to 200 °C. The temperature of the interface was recorded as 250 °C, while the quadrupole temperature was measured at 150 °C. The process of acquiring mass spectra involved a scan ranging from m/z 30 to 350.

2.9. Sample Metabolite Obtaining

Six samples of rice varieties were harvested in time. Three biological replicates were acquired for every rice variety. Rice grain samples were stored in an ice box. Upon arrival at the laboratory, the rice undergoes the milling process, which yields the production of brown rice. After being flash-frozen in liquid nitrogen, the samples were stored in a refrigerator at −80 °C for detection. A set of 18 brown rice specimens was acquired.
A 50 mg sample of brown rice was introduced into a centrifugal tube with a volume of 2 mL, followed by the addition of a 6 mm diameter bead. The metabolites were extracted from the 400 μL extract solution using a mixture of methanol and water in a 4:1 (v:v) ratio, along with an internal standard of L-2-chlorophenyl alanine at a concentration of 0.02 mg·mL−1. The specimen was subjected to reduced-temperature ultrasound-assisted extraction for a duration of 6 min (−10 °C, 50 Hz) and subsequently gathered through low-temperature ultrasonic means for a duration of 30 min (5 °C, 40 kHz). Following a preservation period of 30 min at −20 °C, the specimens were subjected to centrifugation for 15 min at 4 °C and 13,000 g. The liquid portion of the sample was then transferred into a sampling container that was outfitted with an internal tube for the purpose of machine-based analysis.
Furthermore, 20 µL supernatant was obtained from each specimen and pipetted together as a quality control (QC) sample. Throughout the instrumental analysis, a QC sample was injected into each of the three samples to examine the repeatability of the entire analysis process.

2.10. LC-MS/MS Analysis

Thermo Fisher Scientific’s UHPLC-Q Exactive system functions as the analytical framework for performing LC-MS investigations. The 2 μL samples were separated using an HSS T3 chromatographic column with dimensions of 100 mm by 2.1 mm inner diameter and a particle size of 1.8 µm. The samples were then analyzed using mass spectrometry. The composition of mobile phase A comprises 95% water and 5% acetonitrile, with the inclusion of 0.1% formic acid. On the other hand, mobile phase B is composed of 47.5% acetonitrile, 47.5% isopropyl alcohol, and 5% water, with the addition of 0.1% formic acid. The separation gradient was characterized by a gradual increase in mobile phase B composition from 0 to 5% over a period of 0–0.1 min. Within a timeframe of 0.1 to 2 min, there was an observed increase in the proportion of phase B in the mobile phase from 5 to 25%. The mobile phase B composition was increased linearly from 25 to 100% over a period of 2–9 min. Between 9 and 13 min, the mobile phase B exhibited complete linearity. The linearity of the composition of mobile phase B experiences a decrease from 100 to 0% within the time frame of 13.0–13.1 min. Between 13.1 and 16 min, the linearity of the mobile phase B composition did not show any significant change. The recorded flow rate was 0.40 milliliters per min, while the temperature of the column was documented at 40 °C.
The mass spectrometric data were obtained using the Thermo UHPLC-Q exacting mass spectrometer. The apparatus was outfitted with an electrospray ionization (ESI) source that has the capability to function in either positive or negative ion mode. The parameters were modified in an optimal manner as follows: The study’s experimental parameters were set as follows: a sheath gas flow rate of 40 arb, an auxiliary gas flow rate of 10 arb, a heater temperature of 400 °C, a capillary temperature of 320 °C, ion-spray voltage floating (ISVF) at −2800 V in negative mode and 3500 V in positive mode, respectively, and a normalized collision energy of 20–40–60 V rolling for MS/MS. The respective resolutions for MS1 and MS2 were 70,000 and 17,500. The data acquisition procedure was executed utilizing the data-dependent acquisition (DDA) mode. The process of determination was employed in a mass spectrum that covered a range of 70 to 1050 m/z.

2.11. Metabolome Data Analysis

The statistical analysis employed in this study was multivariate and conducted using the ropls software (Version 1.6.2, http://bioconductor.org/packages/release/bioc/html/ropls.html, accessed on 28 July 2023). The establishment commenced operations on the first day of March in the year 2023. An R package sourced from Bioconductor is available on the Majorbio Cloud Platform (https://cloud.majorbio.com, accessed on 15 August 2023), which was launched on the fifteenth day of March 2022. The methodology employed by Xiong et al. was followed in the execution of principal component analysis (PCA), orthogonal partial least squares discriminate analysis (OPLS-DA), and differential metabolites (DMs) [22]. Statistically significant variations between groups were chosen for VIP values > 1 and p-values < 0.05. Summarizing the differential metabolites among the two groups was conducted, followed by mapping their biochemical pathways via metabolic enrichment and pathway analysis according to a database search (KEGG, http://www.genome.jp/kegg/, accessed on 22 August 2023).

2.12. Statistical Analysis

When characterizing the various parameters of rice, a minimum of three duplicate measurements were obtained unless otherwise specified. The software application Microsoft Excel 2016, developed by Microsoft Corporation and headquartered in Redmond, WA, USA, was employed to arrange and calculate the average of the data related to rice quality. The experiments were conducted on two separate occasions. The statistical procedures employed in this study included a one-way analysis of variance (ANOVA), Duncan’s test, and a post hoc test. These analyses were conducted using SPSS statistical software (Version 22.0, IBM, Armonk, New York, NY, USA). This experiment used SCIMA14.1 for PLS-DA analysis and Origin2021 for image plotting.

3. Results

3.1. Analysis of Agronomic Traits and Yield Traits between Five Lines and Control Varieties

The analysis of agronomic traits and yield traits between the five lines and control varieties was carried out in 2021 and 2022 (Table 1). Compared with CKJ1, there were no significant differences in the key growth period, plant height, and yield traits among the five lines. However, there were significant differences between the years.

3.2. Analysis of Rice Quality Traits Was between Five Lines and Control Varieties

The analysis of rice quality traits between the five lines and control varieties was carried out (Table 2). The brown rice and milled rice rates of VJ4 and VJ3 showed a significant decrease compared to those of CKJ1, 0.94%, 0.35%, and 12.55%, 2.74%, respectively. The head-milled rice rate was VJ2 > CKJ1 > VJ5 > VJ1 > VJ4 > VJ3. Among them, CKJ1 was 4.47% lower than VJ2, and 6.54%, 13.40%, and 15.31% higher than VJ1, VJ4, and VJ3, respectively. The chalkiness rate of VJ2 and VJ3 was significantly lower than that of CKJ1. The chalkiness degree of five lines was CKJ1 > VJ5 > VJ3 > VJ1 > VJ4 > VJ2, which was significantly different from CKJ1.
The taste value of VJ2 and VJ1 exhibited a significant elevation in comparison to that of CKJ1, and no significant variation was found among the other three lines and CKJ1. The hardness, sprining, stickiness, and balance of VJ3 were the highest, which were 51.46%, 14.52%, 20.60%, and 32.08% higher than CKJ1, respectively. The other four lines were not significantly different from CKJ1.
The total starch composition of VJ1 was significantly greater than that of CKJ1, up to 12.56%. The amylose composition of CKJ1 was the lowest, which was 10.70%. The amylose composition of VJ3, VJ5, VJ1, VJ2, and VJ4 was 107.48%, 36.45%, 29.91%, 18.69%, and 16.82% higher than that of CKJ1, respectively, and all showed significant differences. No significant variation was found within the crude protein between the five lines and CKJ1. The sucrose composition of VJ4 was significantly less than that of CKJ1 by 13.59%. The 2-AP content of VJ3 was 0, which was significantly different from other lines and CKJ1. This was consistent with the identification results of functional markers. Only VJ3 amplified a 106 bp DNA band. Although VJ2 amplified a 100 bp target band, its 2-AP content was significantly lower than that of CKJ1 (Table 2).

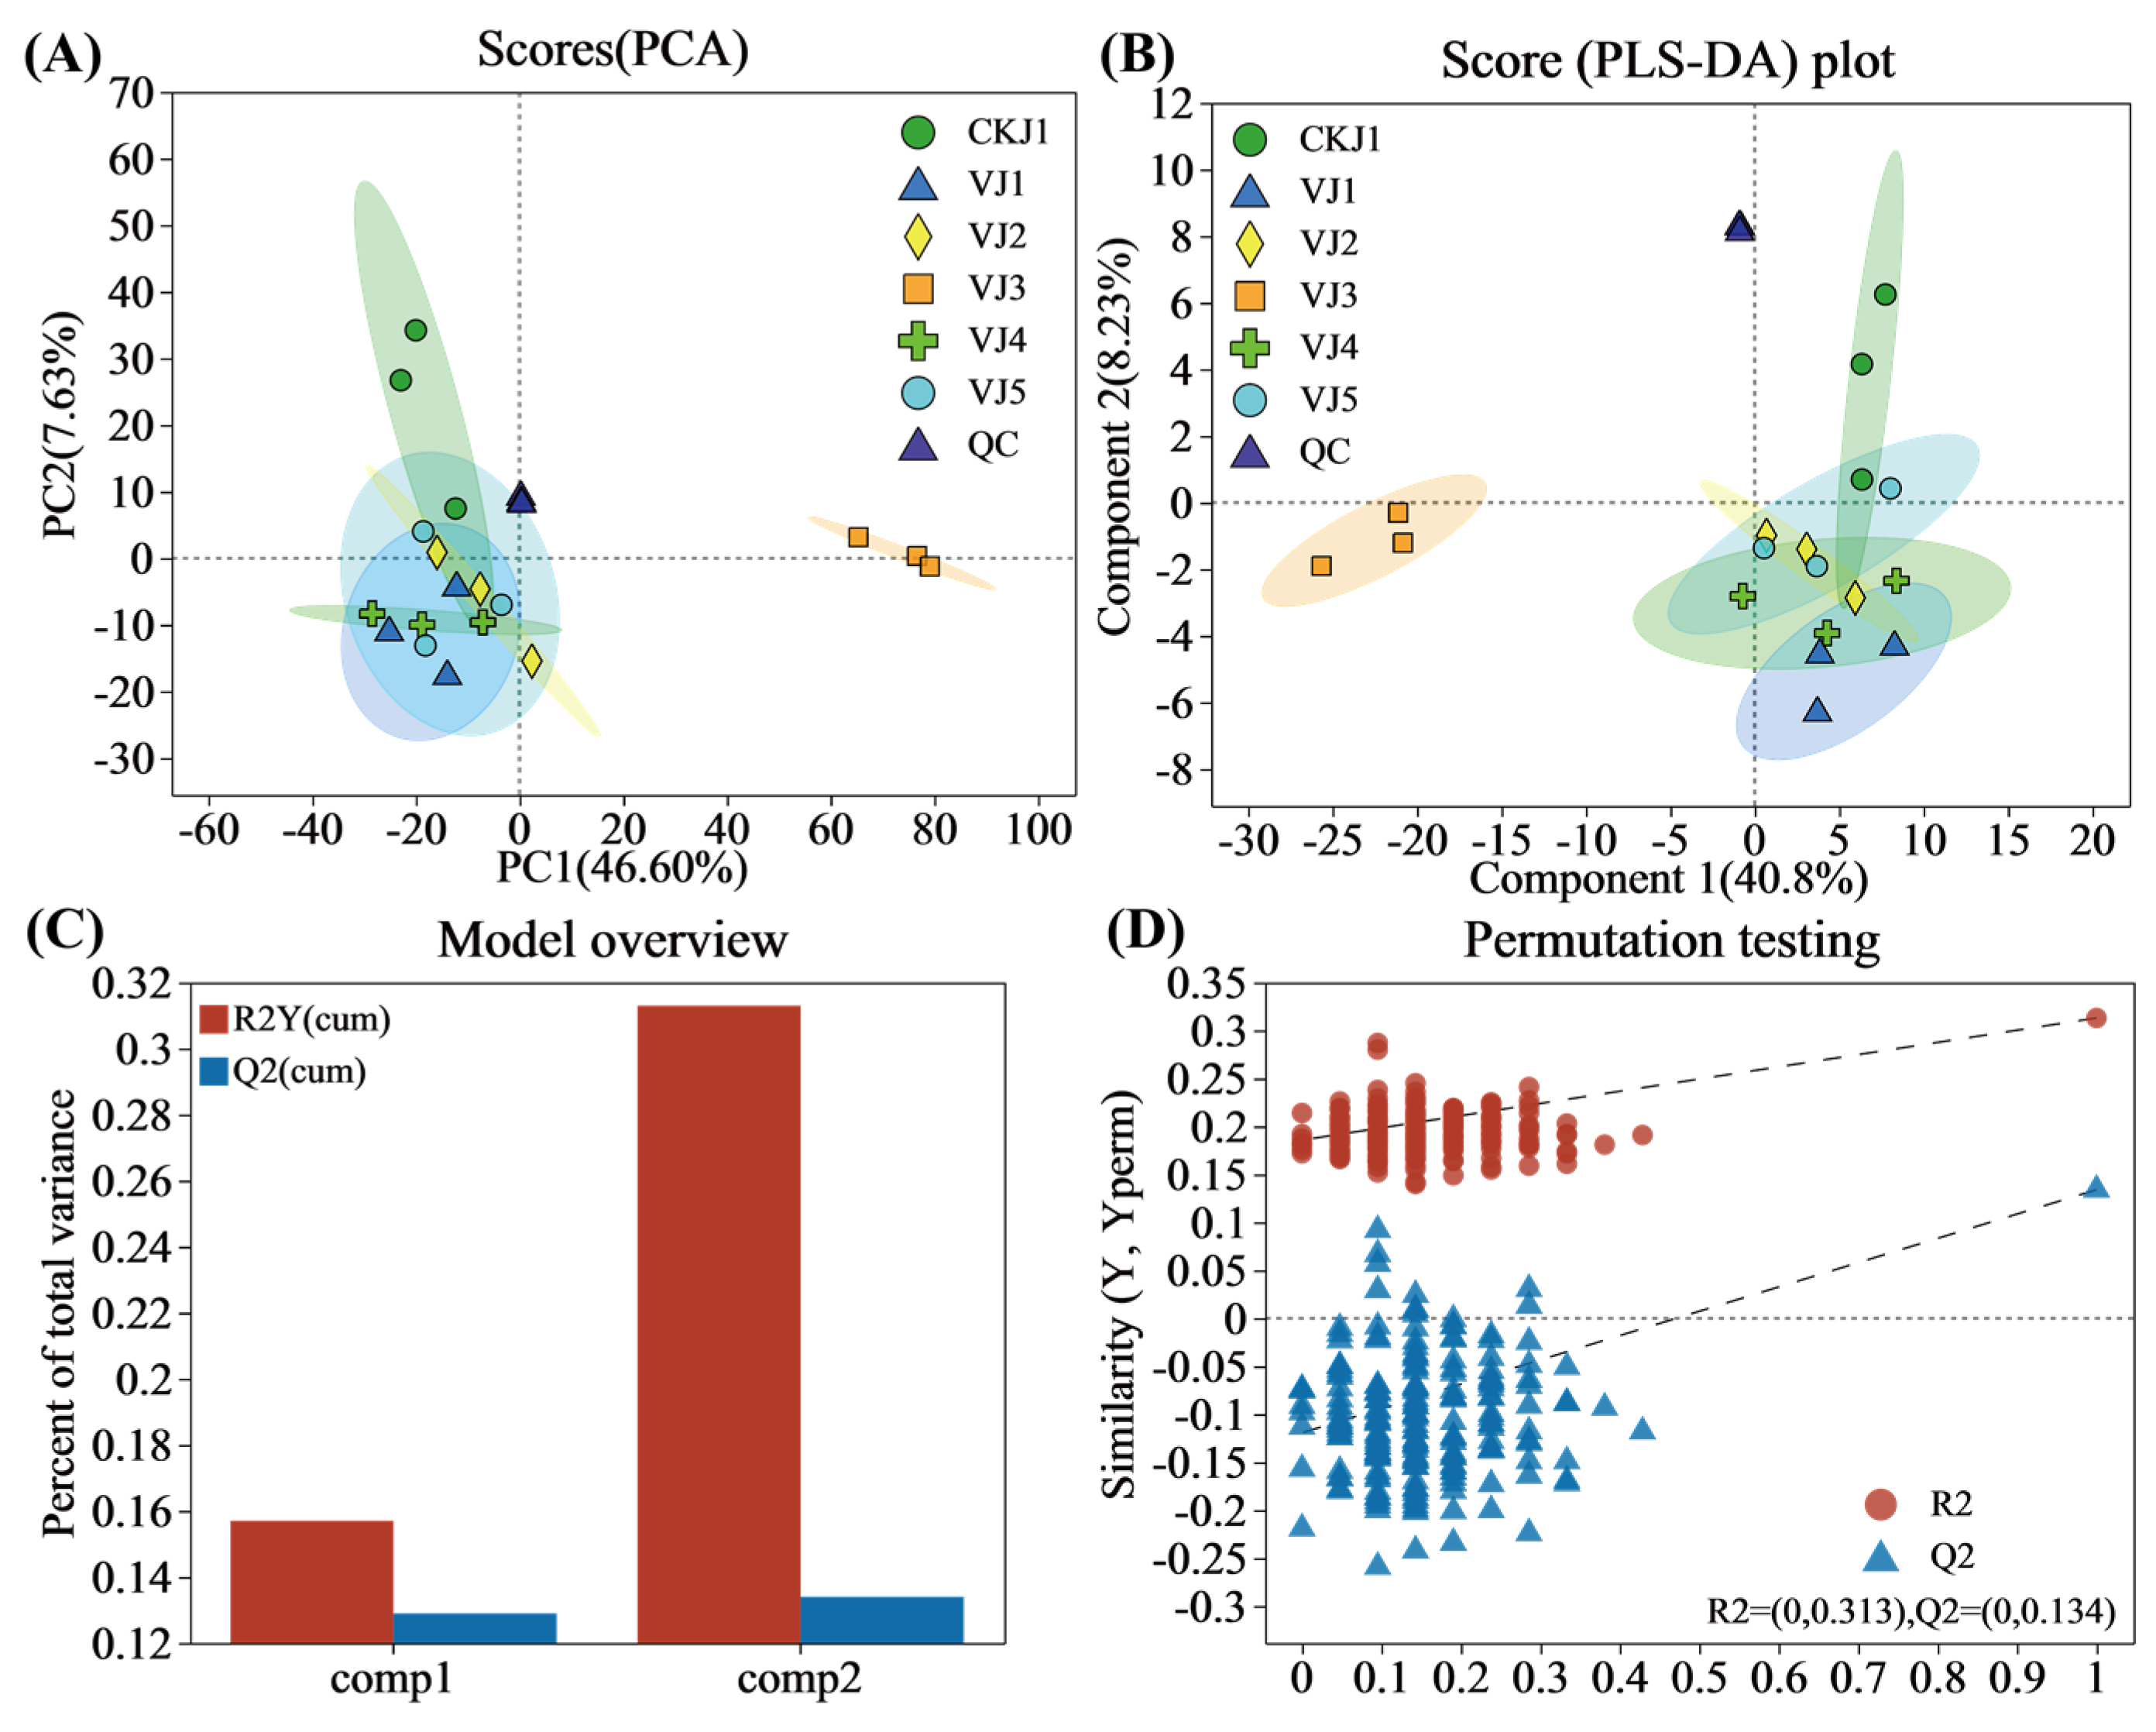
3.3. Multivariate Statistical Analysis

First, PCA was performed on the metabolite data of five lines and control varieties. Within the PCA score plot, the two primary constitutions, PC1 and PC2, were 46.60% and 7.63%, respectively (Figure 1A). Partial least squares discriminant analysis (PLS-DA) showed that composition 1 and composition 2 could elucidate 40.8% and 8.23% of the difference, respectively (Figure 1B). Following 200 permutation tests, the R2 and Q2 values generated by random permutation in any permutation test are lower than the original values, and the slope of the line is large (Figure 1D). Since Q2 < 0.5, we performed a double crossover analysis of the metabolome data with reference to Triba, M. N. et al. [23]. (Figure S1). The result shows that PLS-DA does not show model over-fitting and differential metabolites can be identified according to VIP values.

3.4. Metabolic Profiling
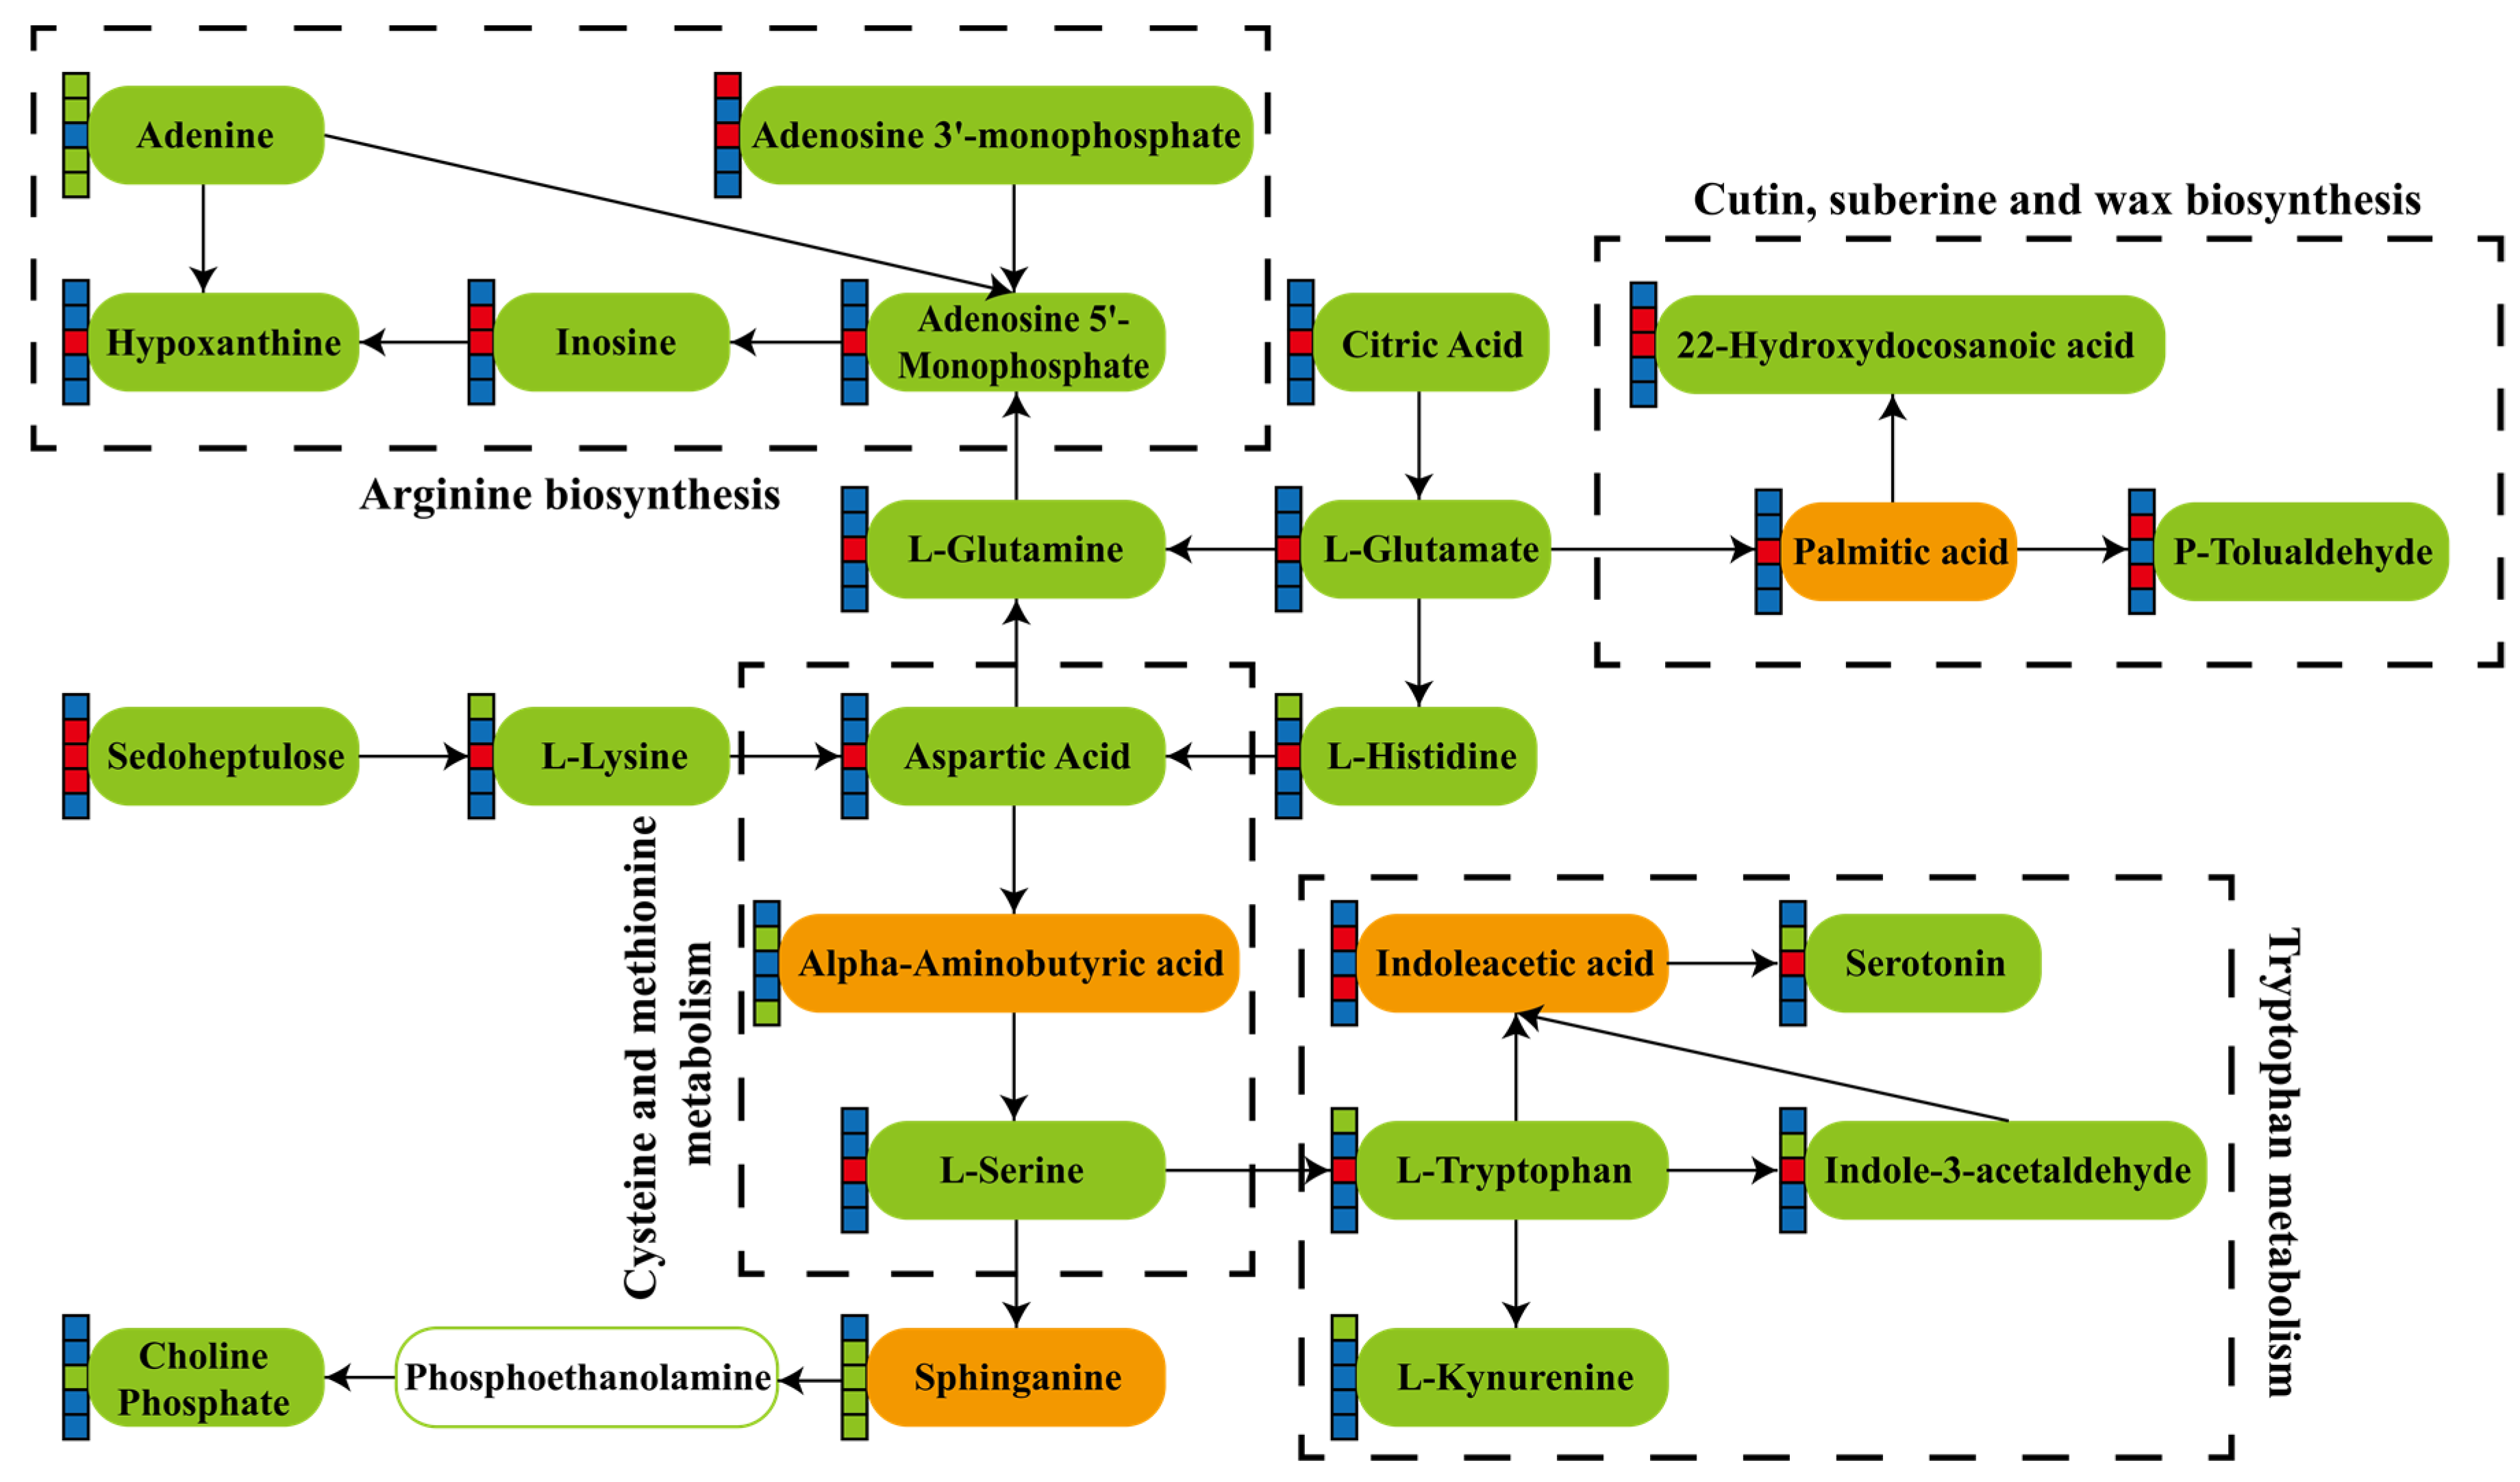
In the VJ3 and CKJ1 comparison group, 164 DMs were identified (Figure 2B; Table S4). There were 56 species of lipids and lipid-like molecules, comprising 36.13%. Organic acids and derivatives comprised 17.42% of the distinguished DMs. Organic oxygen compounds formed 11.61% of the total DMs. Organoheterocylic compounds comprised 11.61% of the total DMs. Phenylpropanoids and polyketides accounted for 9.68%. Benzenoids represented 5.16% (Figure S2C). Thirty DMs were detected among VJ5 and CKJ1 (Figure 2B; Table S6). There were nine types of lipids and lipid-like molecules, accounting for 31.03%. Organic acids and derivatives comprised 17.24% of the detected DMs. Organic acids and derivatives accounted for 13.79%, and organic oxygen compounds accounted for 10.34% of the total DMs (Figure S2E). Thirty-nine DMs were detected among VJ2 and CKJ1 (Figure 2B; Table S3). Lipids and lipid-like molecules comprised 39.47%. Organic acids and derivatives comprised 15.79%. Organoheterocylic compounds comprised 15.79%. Benzenoids accounted for 7.89%. Organic oxygen compounds accounted for 7.89% (Figure S2B). In the VJ1 and CKJ1 comparison group, 36 DMs were identified (Figure 2B; Table S2). Organic acids and derivatives comprised 25.71%. Lipids and lipid-like molecules comprised 22.86%. Organoheterocylic compounds accounted for 14.29%. Organic oxygen compounds accounted for 11.43%. Phenylpropanoids and polyketides accounted for 11.43% (Figure S2A). A total of 49 DMs were determined between VJ4 and CKJ1 (Figure 2B; Table S5). There were 15 lipid and lipid-like molecules, accounting for 33.33%. Organoheterocylic compounds accounted for 15.56%. Phenylpropanoids and polyketides accounted for 15.56%. Organic oxygen compounds accounted for 11.11%. Organic acids and derivatives accounted for 8.89% (Figure S2D). Compared to CKJ1, the five strains had their own unique metabolites and the comparison group VJ3 and CKJ1 had the most differential metabolites. We also highlight this in the form of a metabolite clustering tree and VIP metabolite bar graph (Figure S3). The metabolites of each comparison group were visualized in the form of volcanic maps of DMs (Figure S4).

3.5. KEGG Pathway

Plant metabolism often forms complex pathways and networks through different molecules, which eventually leads to systematic changes in the metabolome. Through the Kyoto Encyclopedia of Genes and Genomes (KEGG) pathway database (http://www.kegg.jp/kegg/pathway.html, accessed on 22 August 2023), we found that differential metabolites of the comparative VJ1 and CKJ1 group were mainly included in amino acid biosynthesis, linoleic acid metabolism, tryptophan metabolism, purine metabolism, glucosinolate biosynthesis, and indole alkaloid biosynthesis (Table 4 and Table S7). Differential metabolites of the comparative group VJ2 and CKJ1 mainly participated in the biosynthesis of amino acids, glycerophospholipid, tryptophan, and linoleic acid metabolisms (Table 4 and Table S8). The differential metabolites of the comparative group VJ3 and CKJ1 participated in linoleic acid metabolism, glycerophospholipid metabolism, glucosinolate biosynthesis, pantothenate and CoA biosynthesis, starch and fatty acid biosynthesis, sucrose metabolism, and unsaturated fatty acid biosynthesis (Table 4 and Table S9). The differential metabolites of the comparative group VJ4 and CKJ1 participated in glycerophospholipid metabolism, flavone and flavonol biosynthesis, and amino acid biosynthesis (Table 4 and Table S10). The differential metabolites of the comparative group VJ5 and CKJ1 were involved in the metabolism of linoleic acid, nicotinate and nicotinamide, and glucosinolate biosynthesis (Table 4 and Table S11).

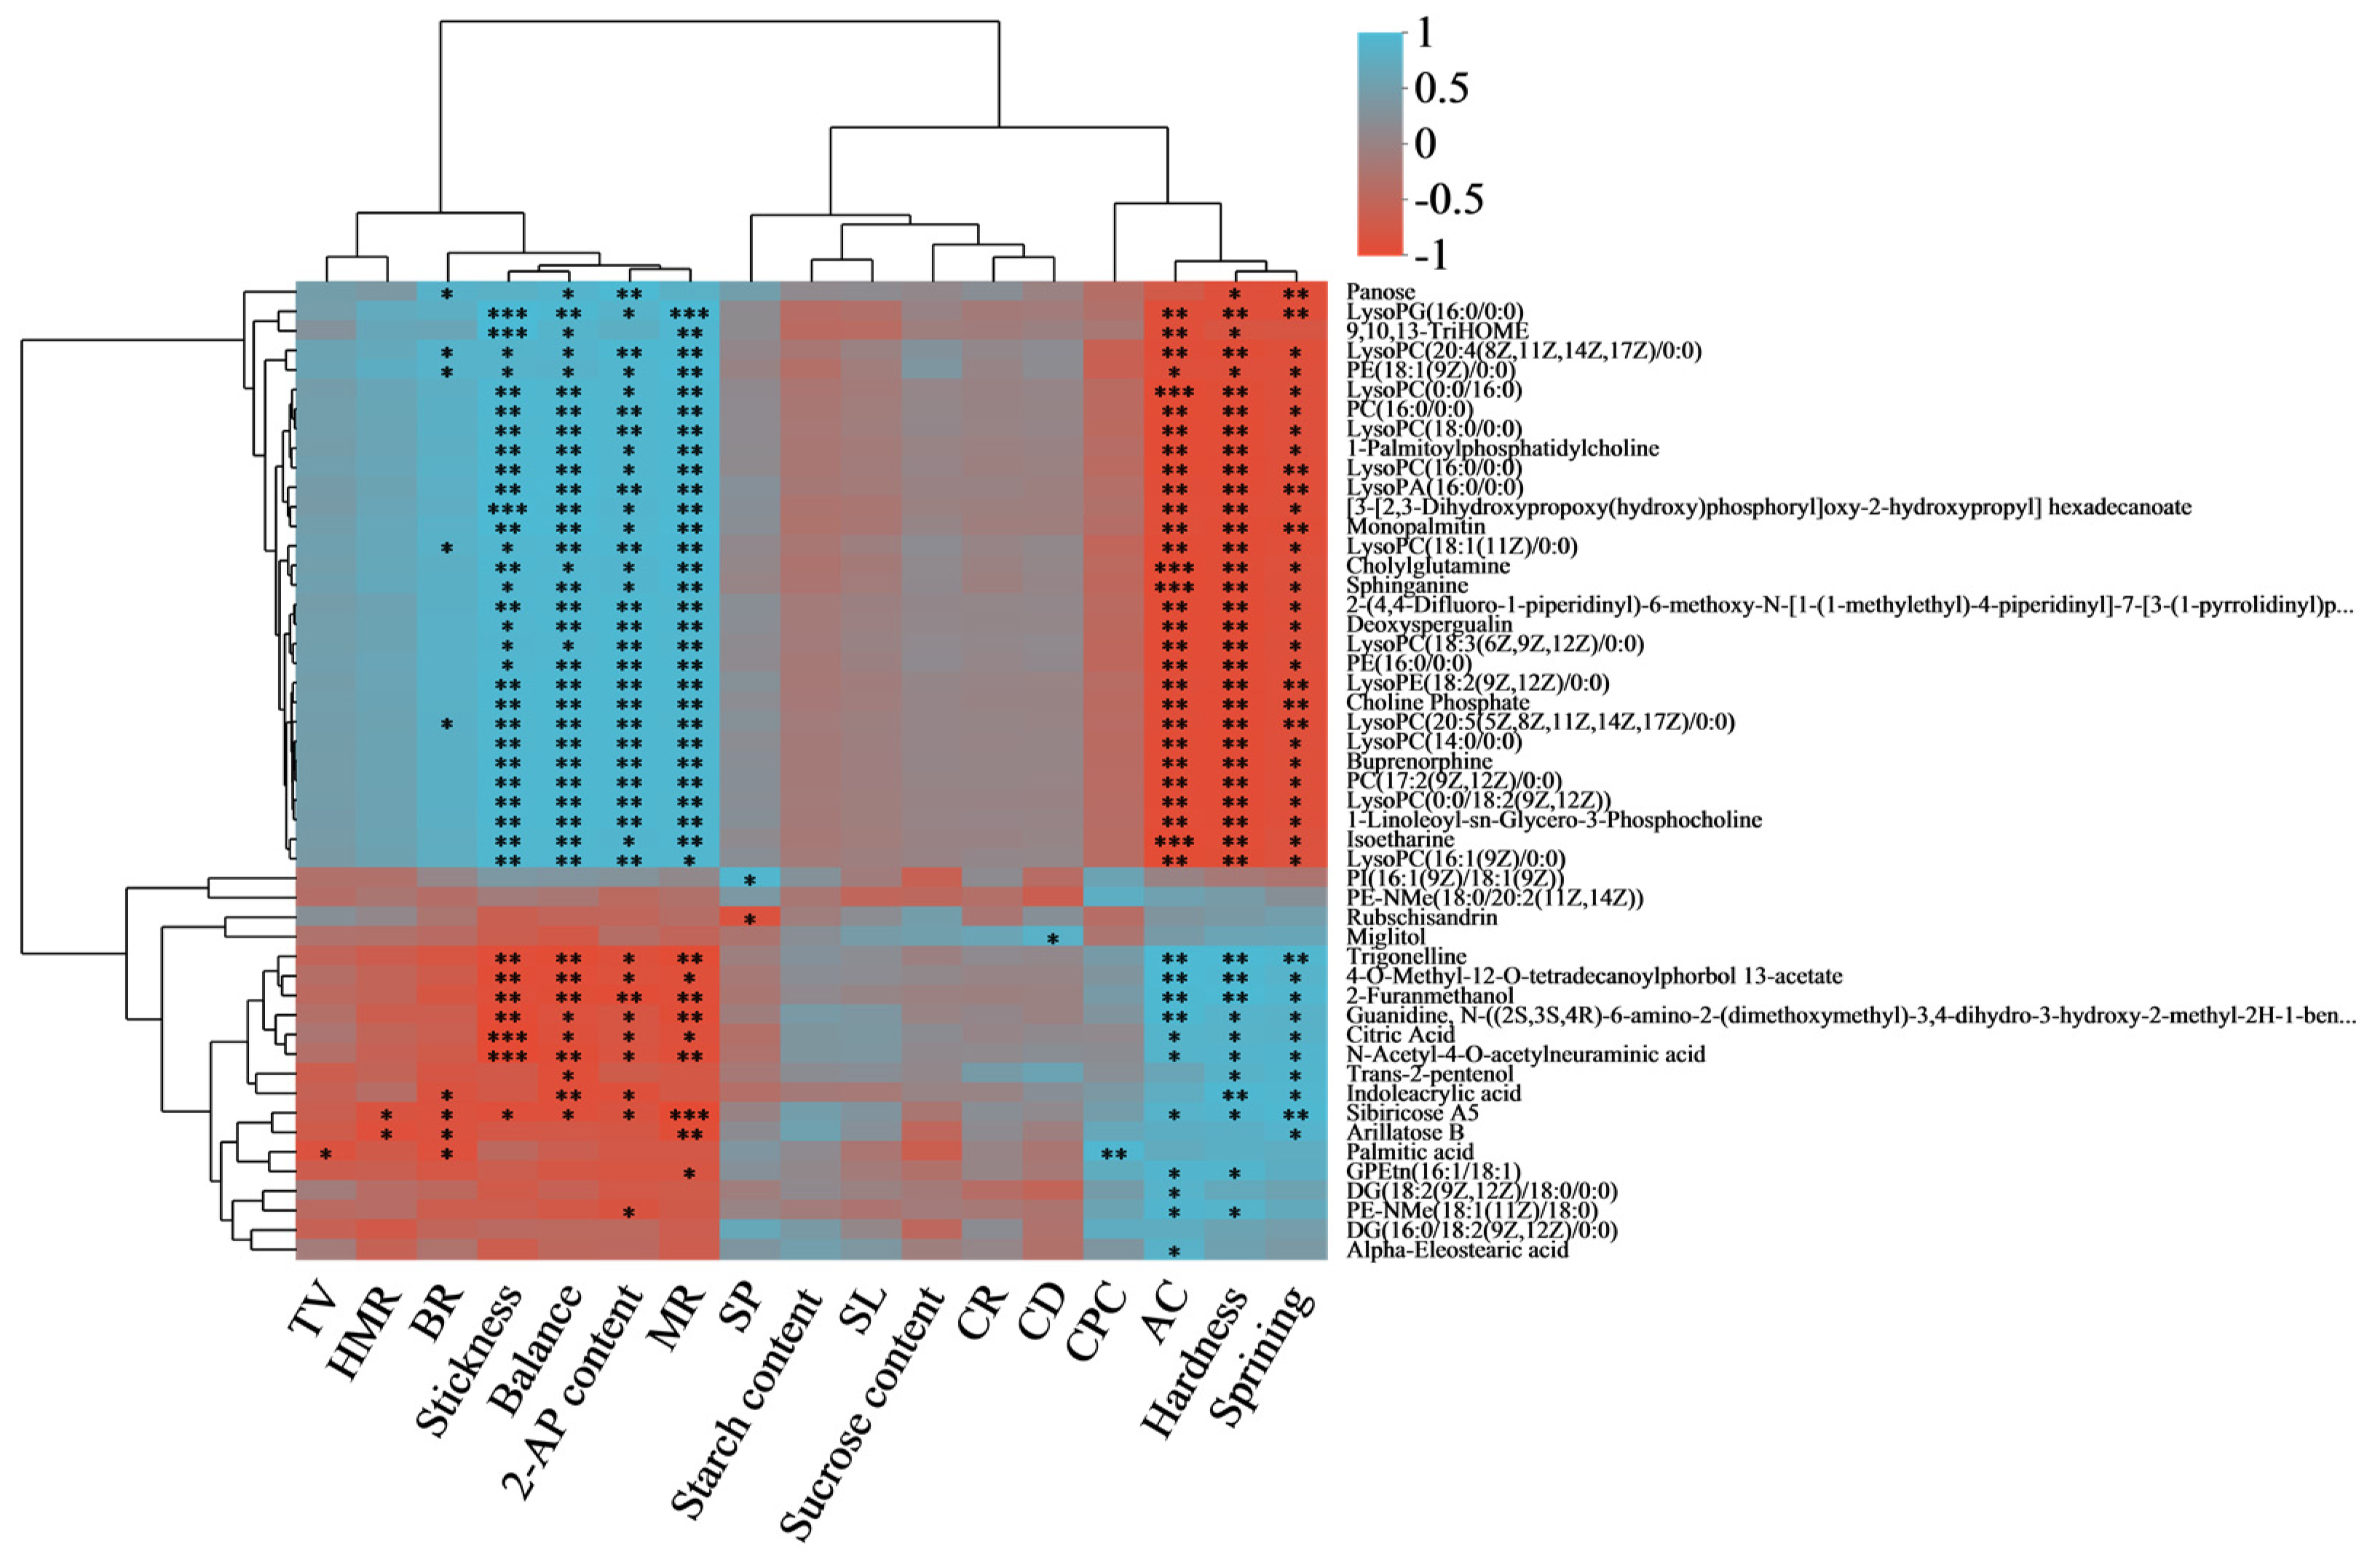
3.6. Correlation Analysis among Rice Quality Character and Differential Metabolites

According to the correlation analysis between detected metabolites and rice quality, palmitic acid, sphinganine, indole acrylic acid, and alpha-eleostearic acid are highly associated and can be used as potential biomarkers for rice quality evaluation (Figure 3). Furthermore, to further analyze the association between rice quality traits and differential metabolites, a correlation analysis was performed to study the interaction between rice quality traits and differential metabolites (Figure 3). Mono palmitin, isoetharine, buprenorphine, cholylglutamine, and sphinganine levels were significantly negatively associated with hardness, springiness, and AC. Furthermore, those had a significant positive association with MR,2-AP composition, stickiness, and balance. The panose level was significantly negatively associated with springiness and stickiness. There was a positive association between panose level and BR, 2-AP content, and balance. BR was substantially positively correlated with levels of sibiricose A5, arillatose B, palmitic acid, and acrylic acid indole. The levels of sibiricose A5 and citric acid were considerably positively associated with hardness and springiness. Furthermore, those were significantly negatively associated with 2-AP content, stickiness, and balance. Significant negative relationships were observed between the level of arillatose B and the quality of rice grain grinding. The palmitic acid level was positively related to CPC and negatively related to TV. AC had a significant positive correlation with sibiricose A5, citric acid, and alpha-eleostearic acid levels. There is a positive association between the rubschisandrin level and SP. Additionally, we performed a mapping of the metabolic pathways that regulate several crucial metabolites (Figure 4).

4. Discussion

Rice quality mainly includes processing quality, appearance quality, nutrition quality, and taste quality, among which appearance quality and processing quality are two of the main traits that people pay attention to when choosing and purchasing rice [5]. The deteriorated processing quality and appearance quality affect not only the commodity value of rice but also the edible quality for consumers. Previous studies have found that processing and appearance qualities are influenced by genetic and cultivation conditions [9,23]. In this study, differences in rice quality between five strains and control strains were analyzed (Table 2). The MR and HMR of VJ3 were found to be significantly lower than those of CKJ1, while the appearance quality showed a significant improvement. The CR and CD of VJ2 were noticeably enhanced compared with those of CKJ1. This indicates that there are still some variations in processing and appearance quality despite the fact that the plant-type structure is similar in the field. It is worth studying that this variation exists in the rice population yet it is not easy to be observed in the field. Therefore, new quality indicators should be added to the breeding of high-quality rice in the future. Good-tasting rice is characterized by low hardness and high elasticity [24]. In this study, although the TV of VJ1 and VJ2 was significantly different from that of other strains, the texture did not show the same situation. However, the hardness, springiness, stickiness, and balance of VJ3 were significantly greater than those of the four remaining strains and CKJ1, which was not completely in accordance with the research results of Li et al. [25]. This may be due to the fact that although degradation occurred among the same varieties, the genetic background among the lines is similar and thus the difference is not significant. In spite of the differences in starch content, CPC, and sucrose content among the lines, the differences between the five lines and CKJ1 were not significant. Previous studies have shown that differences in flavor stem mainly from differences in the composition of the rice [9]. Previous studies suggested that rice with higher AC and protein content is usually associated with a harder texture of cooked rice, and lower AC and protein content can increase the viscosity of cooked rice. In this study, AC showed such differences among strains and between strains and controls, indicating that AC plays a good role and has extremely high discrimination in the study of variety variation. As a key quality attribute that determines the market value of rice, the application of fragrance in breeding has attracted the attention of crop scientists in recent years [26]. 2-acetyl-1-pyrroline (2-AP) is reported to be the primary molecule responsible for the aroma in fragrant rice cultivars [27,28]. Throughout this investigation, the fragrance gene was not detected only in VJ3; the 2-AP composition of VJ3 and VJ2 was significantly less than that of CKJ1, and the other three lines were not significantly different from CKJ1. It can be seen that the disappearance of the aroma of fragrant rice is accompanied by the degradation of the varieties. Therefore, the addition of 2-AP measurement in seed production can ensure the quality of rice breeding. The InDel-E2 functional marker can clearly distinguish the presence or absence of Nanjing9108 aroma substance 2-AP, which can be used as the main method for the rapid identification of aroma substances.
Metabolomics has the potential to offer an extensive perspective on the benefits of biological systems and physiological conditions. Recently, it has provided new techniques for the classification and differential analysis of nutritional compositions of agricultural products, origin traceability, and authenticity identification [29,30,31]. Analysis of differential metabolites in rice is also one of the important methods to study variety degradation. Previous studies extensively studied the relationship between rice quality differences and metabolite differences between different varieties. There are few reports on the differences between different strains of the same variety. In this study, five lines of the same source and the same variety were selected as experimental materials for metabolomics studies. It was observed that each strain exhibited its own specific metabolites with respect to the control material (Figure 2), while the changes in the number and proportion of metabolites in different comparison groups (Figure S2) provide unique insights into the compositional differences and diversity of the mutated Nanjing9108. The VJ3 and CKJ1 group were found to have the most abundant DMs (Figure 2B). Through correlation analysis, palmitic acid, sphinganine, indole acrylic acid, and alpha-eleostearic acid are highly associated and can be used as significant biomarkers for rice quality evaluation. Alpha-eleostearic and palmitic acids belong to lipids and lipid-like molecules (Table S9). The alpha-eleostearic level was significantly associated with AC. Palmitic acid levels showed a significant negative association with BR and TV and were extremely positively correlated with the composition of crude protein composition. This is consistent with the conclusion of Concepcion Jeanaflor T et al. This further indicates that palmitic acid and alpha-eleostearic can be used as potential key metabolites to assess variety degradation. Indoleacetic acid, as an important auxin substance in plants, can effectively increase the accumulation and transport of metabolites. In the process of tobacco breeding, it is an important part of the early selection of tobacco breeding materials to know the growth and development of new varieties by measuring plant hormones. In this study, indoleacrylic acid levels showed a significant increase in both the VJ2 and CKJ1 and VJ4 and CKJ1 groups (Figure 4). Indoleacrylic acid level was correlated with hardness, sprining, and balance, which also verified that the measuring of plant hormones could be used to study the degradation of plant varieties. L-glutamate, L-tryptophan, and L-serine are the main metabolites in the amino acid synthesis pathway (Figure 4), which can potentially offer a greater amount of basic data for breeding and identification of breed purity.

5. Conclusions

In this study, although the five lines were all from Liyang, their rice quality had changed. The BR and MR of VJ4 and VJ3 were 0.94%, 0.35%, and 12.55%, 2.74% lower than those of CKJ1, respectively. The CR of VJ2 and VJ3 was significantly less than that of CKJ1, and the CD of five lines was different from that of CKJ1. The TV of VJ2 and VJ1 showed a significant increase compared to that of CKJ1, and there was no significant variation between the other three lines and CKJ1. Most metabolites are mainly enriched in histidine metabolism, cutin, suberine, wax biosynthesis, and tryptophan metabolism. Essential metabolites within the metabolic pathway involve lipids and lipid-like molecules (mono palmitin, alpha-eleostearic, and palmitic acid) and amino acid metabolites (L-glutamate, L-tryptophan, and L-serine). These metabolites perform vital regulatory functions in metabolic pathways. The current investigation offers significant insights into the mechanisms underlying rice qualities in various rice varieties. The measuring of these key metabolites helps the progression of potential biomarkers to detect seed variation throughout seed production. However, additional research is needed to investigate the extensive effect of particular secondary metabolites on the deterioration of rice quality.

Supplementary Materials

The following supporting information can be downloaded at: https://www.mdpi.com/article/10.3390/agronomy14030430/s1, Figure S1. (A) Summary of fit Plot. Plot cumulative R2 and Q2 per component for the entire model; (B) Plot the scores of a model. The scores summarize the relationship among the observations (the rows) of a model. Figure S2. Statistical map of compounds. The name and percentage of the metabolites of the selected HMDB hierarchy (Class) are displayed in a high to low order, depending on the number of metabolites (A) VJ1 and CKJ1. (B) VJ2 and CKJ1. (C) VJ3 and CKJ1. (D) VJ4 and CKJ1. (E) VJ5 and CKJ1. Figure S3. Expression Profile and VIP of Metabolites. On the left is the metabolite cluster tree diagram, and on the right is the metabolite VIP bar diagram, *, **, and *** indicate significant differences at p < 0.05, p < 0.01, and p < 0.001, respectively. (A) VJ1 and CKJ1. (B) VJ2 and CKJ1. (C) VJ3 and CKJ1. (D) VJ4 and CKJ1. (E) VJ5 and CKJ1. Figure S4. DMs volcano map. All dots demonstrate specific metabolites, and the dot’s size demonstrates the VIP value. On the left are the metabolites with different down-regulation, and on the right are the metabolites with different up-regulation; the greater the left and right are, the greater the significance of the above point. (A) VJ1 and CKJ1. (B) VJ2 and CKJ1. (C) VJ3 and CKJ1. (D) VJ4 and CKJ1. (E) VJ5 and CKJ1. Table S1. The names of primers, primer sequences, target fragment lengths, and references for identification of target genes. Table S2. DM identification information between VJ1 and CKJ1. Table S3. DM identification information between VJ2 and CKJ1. Table S4. DM identification information between VJ3 and CKJ1. Table S5. DM identification information between VJ4 and CKJ1. Table S6. DM identification information between VJ5 and CKJ1. Table S7. Detailed information on key metabolites associated with rice quality between VJ1 and CKJ1. Table S8. Detailed information on key metabolites associated with rice quality between VJ2 and CKJ1. Table S9. Detailed information on key metabolites associated with rice quality between VJ3 and CKJ1. Table S10. Detailed information on key metabolites associated with rice quality between VJ4 and CKJ1. Table S11. Detailed information on key metabolites associated with rice quality between VJ5 and CKJ1.

Author Contributions

Formal analysis, investigation, and writing—original draft, Q.S.; investigation and project administration, R.W. and W.L.; funding acquisition and writing—review and editing, J.Z., H.Z. and Q.X.; resources, validation and writing—review and editing, N.Z. All authors have read and agreed to the published version of the manuscript.

Funding

This work was supported by the Open Project of Key Laboratory of Crop Physiology, Ecology and Genetic Breeding, Ministry of Education, Jiangxi Agricultural University (202303); the Jiangsu Province Seed Industry Revitalization Project (JBGS (2021) 036); and the Priority Academic Program Development of Jiangsu Higher Education Institutions (PAPD).

Data Availability Statement

Data will be made available on request.

Conflicts of Interest

The authors declare that they have no known competing financial interests or personal relationships that could have appeared to influence the work reported in this paper.

References

  1. Ma, Z.; Ma, H.; Chen, Z.; Chen, X.; Liu, G.; Hu, Q.; Xu, F.; Wei, H.; Zhang, H. Quality Characteristics of Japonica Rice in Southern and Northern China and the Effect of Environments on Its Quality. Agronomy 2022, 12, 2757. [Google Scholar] [CrossRef]
  2. Wang, C.L.; Zhang, Y.D.; Zhao, C.F.; Wei, X.D.; Yao, S.; Zhou, L.H.; Zhu, Z.; Chen, T.; Zhao, Q.Y.; Zhao, L.; et al. Inheritance and breeding of japonica rice with good eating quality in Jiangsu province. Yi Chuan 2021, 43, 442–458. [Google Scholar] [CrossRef] [PubMed]
  3. Chen, S.; Tang, L.; Sun, J.; Xu, Q.; Xu, Z.; Chen, W. Contribution and Prospect of Erect Panicle Type to japonica Super Rice. Rice Sci. 2021, 28, 431–441. [Google Scholar] [CrossRef]
  4. Zhang, C.; Zhao, D.; Li, Q.; Gu, M.; Liu, Q. Progresses in Research on Cloning and Functional Analysis of Key Genes Involving in Rice Grain Quality. Sci. Agric. Sin. 2016, 49, 4267–4283. [Google Scholar] [CrossRef]
  5. Li, S.; Ren, X.; Zhang, M.; Asimi, S.; Lv, Q.; Wang, Z.; Liang, S.; Wang, Z.; Meng, L. New perspective to guide rice breeding: Evaluating the eating quality of japonica rice. Cereal Chem. 2022, 99, 603–614. [Google Scholar] [CrossRef]
  6. Ch, R.; Chevallier, O.; McCarron, P.; McGrath, T.F.; Wu, D.; Nguyen Doan Duy, L.; Kapil, A.P.; McBride, M.; Elliott, C.T. Metabolomic fingerprinting of volatile organic compounds for the geographical discrimination of rice samples from China, Vietnam and India. Food Chem. 2021, 334, 127553. [Google Scholar] [CrossRef] [PubMed]
  7. Lee, Y.S.; Oh, Y.; Kim, T.H.; Cho, Y.H. Quantitation of 2-acetyl-1-pyrroline in aseptic-packaged cooked fragrant rice by HS-SPME/GC-MS. Food Sci. Nutr. 2019, 7, 266–272. [Google Scholar] [CrossRef]
  8. Okpala, N.E.; Mo, Z.; Duan, M.; Tang, X. The genetics and biosynthesis of 2-acetyl-1-pyrroline in fragrant rice. Plant Physiol. Biochem. 2019, 135, 272–276. [Google Scholar] [CrossRef]
  9. Liu, Q.; Chen, S.; Zhou, L.; Tao, Y.; Tian, J.; Xing, Z.; Wei, H.; Zhang, H. Characteristics of Population Quality and Rice Quality of Semi-Waxy japonica Rice Varieties with Different Grain Yields. Agriculture 2022, 12, 241. [Google Scholar] [CrossRef]
  10. Chen, L.; Zhou, F.; Chen, Y.; Fan, Y.; Zhang, K.; Liu, Q.; Tu, W.; Jiang, F.; Li, G.; Zhao, H.; et al. Salicylic Acid Improves the Constitutive Freezing Tolerance of Potato as Revealed by Transcriptomics and Metabolomics Analyses. Int. J. Mol. Sci. 2022, 24, 609. [Google Scholar] [CrossRef]
  11. Luo, Z.; Liu, L.; Nie, Q.; Huang, M.; Luo, C.; Sun, Y.; Ma, Y.; Yu, J.; Du, F. HPLC-based metabolomics of Dendrobium officinale revealing its antioxidant ability. Front. Plant Sci. 2023, 14, 1060242. [Google Scholar] [CrossRef]
  12. Qu, S.L.; Xie, J.; Wang, J.T.; Li, G.H.; Pan, X.R.; Zhao, P.J. Activities and metabolomics of Cordyceps gunnii under different culture conditions. Front. Microbiol. 2022, 13, 1076577. [Google Scholar] [CrossRef]
  13. Yu, X.; Qi, Q.; Li, Y.; Li, N.; Xie, Y.; Ding, A.; Shi, J.; Du, Y.; Liu, X.; Zhang, Z.; et al. Metabolomics and proteomics reveal the molecular basis of colour formation in the pericarp of Chinese wild rice (Zizania latifolia). Food Res. Int. 2022, 162, 112082. [Google Scholar] [CrossRef]
  14. Hu, C.; Shi, J.; Quan, S.; Cui, B.; Kleessen, S.; Nikoloski, Z.; Tohge, T.; Alexander, D.; Guo, L.; Lin, H.; et al. Metabolic variation between japonica and indica rice cultivars as revealed by non-targeted metabolomics. Sci. Rep. 2014, 4, 5067. [Google Scholar] [CrossRef] [PubMed]
  15. Concepcion, J.C.T.; Calingacion, M.; Garson, M.J.; Fitzgerald, M.A. Lipidomics reveals associations between rice quality traits. Metabolomics 2020, 16, 54. [Google Scholar] [CrossRef]
  16. Zhang, C.; Zhu, L.; Shao, K.; Gu, M.; Liu, Q. Toward underlying reasons for rice starches having low viscosity and high amylose: Physiochemical and structural characteristics. J. Sci. Food Agric. 2013, 93, 1543–1551. [Google Scholar] [CrossRef]
  17. Konik-Rose, C.M.; Moss, R.; Rahman, S.; Appels, R.; Stoddard, F.; McMaster, G. Evaluation of the 40 mg Swelling Test for Measuring Starch Functionality. Starch Stärke 2001, 53, 14–20. [Google Scholar] [CrossRef]
  18. Wang, J.; Yang, J.; Chen, Z.; Zhong, W. Development and Application of Fragrance Gene Markers in Rice. Mol. Plant Breed. 2008, 6, 1209–1212. [Google Scholar]
  19. Lu, Y.; Zhang, K. A Simple Method for Isolation of Rice DNA. Chin. J. Rice Sci. 1992, 6, 47–48. [Google Scholar]
  20. Shi, Y.; Chen, J.; Liu, W.; Huang, Q.; Shen, B.; Leung, H.; Wu, J. Genetic analysis and gene mapping of a new rolled-leaf mutant in rice (Oryza sativa L.). Sci. China C Life Sci. 2009, 52, 885–890. [Google Scholar] [CrossRef] [PubMed]
  21. Yang, S.; Zhu, Y.; Zhang, R.; Liu, G.; Wei, H.; Zhang, H.; Zhang, H. Mid-stage nitrogen application timing regulates yield formation, quality traits and 2-acetyl-1-pyrroline biosynthesis of fragrant rice. Field Crops Res. 2022, 287, 108667. [Google Scholar] [CrossRef]
  22. Xiong, Q.; Sun, C.; Li, A.; Zhang, J.; Shi, Q.; Zhang, Y.; Hu, J.; Zhou, N.; Wei, H.; Liu, B.; et al. Metabolomics and biochemical analyses revealed metabolites important for the antioxidant properties of purple glutinous rice. Food Chem. 2022, 389, 133080. [Google Scholar] [CrossRef]
  23. Fahad, S.; Hussain, S.; Saud, S.; Hassan, S.; Chauhan, B.S.; Khan, F.; Ihsan, M.Z.; Ullah, A.; Wu, C.; Bajwa, A.A.; et al. Responses of Rapid Viscoanalyzer Profile and Other Rice Grain Qualities to Exogenously Applied Plant Growth Regulators under High Day and High Night Temperatures. PLoS ONE 2016, 11, e0159590. [Google Scholar] [CrossRef] [PubMed]
  24. Shi, S.; Wang, E.; Li, C.; Cai, M.; Cheng, B.; Cao, C.; Jiang, Y. Use of Protein Content, Amylose Content, and RVA Parameters to Evaluate the Taste Quality of Rice. Front. Nutr. 2022, 8, 758547. [Google Scholar] [CrossRef] [PubMed]
  25. Li, C.; Ji, Y.; Li, E. Understanding the Influences of Rice Starch Fine Structure and Protein Content on Cooked Rice Texture. Starch Stärke 2022, 74, 2100253. [Google Scholar] [CrossRef]
  26. Starkenmann, C.; Niclass, Y.; Vuichoud, B.; Schweizer, S.; He, X.F. Occurrence of 2-Acetyl-1-pyrroline and Its Nonvolatile Precursors in Celtuce (Lactuca sativa L. var. augustana). J. Agric. Food Chem. 2019, 67, 11710–11717. [Google Scholar] [CrossRef] [PubMed]
  27. Vaclavik, L.; Lacina, O.; Hajslova, J.; Zweigenbaum, J. The use of high performance liquid chromatography-quadrupole time-of-flight mass spectrometry coupled to advanced data mining and chemometric tools for discrimination and classification of red wines according to their variety. Anal. Chim. Acta 2011, 685, 45–51. [Google Scholar] [CrossRef] [PubMed]
  28. Ron, G.B.; Louisa, C.L.; Bienvenido, O.J.; Jean, G.T. Cooked Rice Aroma and 2-Acetyl-1-pyrroline. Food Chem. 1983, 31, 823–826. [Google Scholar]
  29. Zotti, M.; De Pascali, S.A.; Del Coco, L.; Migoni, D.; Carrozzo, L.; Mancinelli, G.; Fanizzi, F.P. 1H NMR metabolomic profiling of the blue crab (Callinectes sapidus) from the Adriatic Sea (SE Italy): A comparison with warty crab (Eriphia verrucosa), and edible crab (Cancer pagurus). Food Chem. 2016, 196, 601–609. [Google Scholar] [CrossRef] [PubMed]
  30. Chen, J.; Chan, P.H.; Lam, C.T.; Li, Z.; Lam, K.Y.; Yao, P.; Dong, T.T.; Lin, H.; Lam, H.; Tsim, K.W. Fruit of Ziziphus jujuba (Jujube) at two stages of maturity: Distinction by metabolic profiling and biological assessment. J. Agric. Food Chem. 2015, 63, 739–744. [Google Scholar] [CrossRef]
  31. Wang, Q.; Zhang, D.; Zhao, L.; Liu, J.; Shang, B.; Yang, W.; Duan, X.; Sun, H. Metabolomic Analysis Reveals Insights into Deterioration of Rice Quality during Storage. Foods 2022, 11, 1729. [Google Scholar] [CrossRef] [PubMed]
Figure 1. Conducting an analysis of permutations and multivariate statistical scores among different strains. (A) PCA, (B) PLS−DA, (C) review of the PLS-DA model, and (D) permutation testing of PLS−DA. PCA, principal component analysis; PC, principal compound; PLS−DA, partial least squares discriminant analysis.
Agronomy 14 00430 g001
Figure 2. Metabolite analysis. (A) Venn distribution of metabolites. (B) Comparison of different metabolites between strains and CK.
Agronomy 14 00430 g002
Figure 3. A correlation analysis between rice quality traits and DMs. The results indicate that variables *, **, and *** exhibit statistically significant differences at p < 0.05, p < 0.01, and p < 0.001 levels, respectively.
Agronomy 14 00430 g003
Figure 4. An overview of a few key metabolites that play a critical role in various metabolic pathways. The orange rectangles represent crucial metabolites. Red represents overexpression, green indicates underexpression, and blue indicates no significant variation.
Agronomy 14 00430 g004
Table 1. Analysis of the difference in agronomic traits and yield traits among strains.
YearCultivarHeading
Date
Maturation
Date
Plant Height (cm)Number of Panicles Per Hill (No.)Number of Spikelets Per Panicle (No.)Percentage of
Filled Grains (%)
1000-Grain
Weight (g)
2021CKJ1August 25October 1296.82 ± 0.99 ab5.00 ± 1.41 a107.36 ± 1.62 a84.85 ± 1.09 a23.90 ± 0.23 a
VJ1August 26 October 1396.40 ± 1.12 b4.80 ± 1.10 a109.42 ± 3.05 a86.35 ± 2.05 a23.87 ± 0.39 a
VJ2August 25 October 1397.16 ± 0.63 a5.40 ± 1.14 a108.72 ± 2.69 a85.22 ± 2.26 a23.81 ± 0.30 a
VJ3August 25 October 1496.52 ± 0.83 ab5.20 ± 1.30 a106.42 ± 1.44 a86.86 ± 2.10 a24.02 ± 0.35 a
VJ4August 24 October 1297.10 ± 0.46 ab5.00 ± 0.71 a109.60 ± 3.55 a86.20 ± 2.07 a23.98 ± 0.39 a
VJ5August 26 October 1397.00 ± 0.71 ab5.40 ± 1.14 a107.60 ± 2.96 a85.58 ± 1.40 a23.72 ± 0.18 a
2022CKJ1August 27 October 1395.26 ± 0.66 a6.40 ± 1.14 a110.52 ± 3.21 a85.88 ± 1.92 a24.25 ± 0.33 a
VJ1August 27 October 1294.84 ± 1.38 a6.60 ± 0.55 a109.86 ± 2.64 a85.45 ± 1.54 a24.21 ± 0.21 a
VJ2August 28 October 1395.88 ± 0.83 a6.00 ± 1.87 a109.28 ± 3.68 a85.84 ± 2.45 a24.24 ± 0.24 a
VJ3August 28 October 1495.10 ± 1.07 a6.40 ± 1.14 a109.76 ± 4.54 a84.60 ± 1.27 a24.29 ± 0.37 a
VJ4August 25 October 1194.78 ± 1.07 a7.00 ± 1.41 a112.26 ± 1.93 a85.12 ± 1.52 a24.17 ± 0.19 a
VJ5August 26 October 1494.16 ± 0.90 a6.20 ± 1.30 a109.66 ± 3.36 a86.15 ± 1.53 a24.32 ± 0.37 a
Analysis of variance
Year *****NS**
Cultivar NSNSNSNSNS
Year × Cultivar NSNSNSNSNS
Different letters indicate statistical significance at the p = 0.05 level. “NS” means no different. * and ** reveal Significant difference at p = 0.05 and p = 0.01, respectively.
Table 2. Analysis of the difference in rice quality traits among strains.
VarietiesBR
(%)
MR
(%)
HMR
(%)
CRCDTVHardness
(g)
Sprining
(%)
Stickiness
(g)
BalanceStarch Content
(mg/g)
AC
(%)
CPC
(g/kg)
Sucrose Content
(mg/g)
2-AP Content
(ng/g)
SLSPGenotype
CKJ10.854
ab
0.693
ab
0.627
b
87.107
ab
44.270
a
76.267
b
122.096
b
0.489
b
−913.696
b
−0.212
b
480.527
bc
0.107
e
60.202
a
12.818
a
51.534
a
0.06
b
8.903
a
N
VJ10.858
a
0.679
bc
0.586
c
86.123
bc
37.043
cd
83.667
a
108.592
b
0.464
b
−869.64
b
−0.232
b
540.858
a
0.139
c
60.294
a
12.623
a
61.366
a
0.078
a
9.219
a
N
VJ20.855
ab
0.702
a
0.655
a
76.557
d
29.820
e
84.433
a
117.814
b
0.466
b
−955.816
b
−0.240
b
446.612
c
0.127
d
63.802
a
11.974
ab
39.218
b
0.038
c
8.951
a
N
VJ30.846
c
0.606
d
0.531
d
85.420
c
37.770
c
75.200
b
184.925
a
0.560
a
−725.440
a
−0.144
a
509.786
ab
0.222
a
65.358
a
12.144
ab
0c0.061
b
9.112
a
P
VJ40.851
b
0.674
c
0.543
d
87.400
ab
36.517
d
76.967
b
122.756
b
0.488
b
−958.134
b
−0.230
b
521.005
ab
0.125
d
66.369
a
11.076
b
51.455
a
0.057
b
9.566
a
N
VJ50.857
a
0.697
a
0.619
b
88.093
a
39.353
b
75.567
b
123.107
b
0.459
b
−938.624
b
−0.222
b
482.712
bc
0.146
b
62.219
a
12.821
a
61.12
a
0.057
b
9.431
a
N
The lowercase letters that succeed the data in the same column denote a statistically significant difference with a p-value of 0.05. The following abbreviations are commonly used in academic literature to refer to specific rice quality attributes: BR for brown rice rate, MR for milled rice rate, HMR for head milled rice rate, CR for chalkiness rate, CD for chalkiness degree, and TV for taste value. The variables under consideration in this study are AC, CPC, SL, and SP. The notation “N” represents a negative value, while “P” represents a positive value. Correlation analysis revealed that (Table 3) there is a significant positive association between total starch composition and solubility. The composition of amylose was positively correlated with hardness, stickiness, and balance. A significant negative association was detected between the crude protein content and the sucrose content.
Table 3. Correlation analysis of rice quality characters.
ACSucrose ContentCPCTVHardnessSpriningStickinessBalanceSLSP
Starch Content0.259−0.1480.021−0.2280.0930.2170.3860.1870.875 *0.511
AC −0.0220.426−0.4170.904 *0.7930.891 *0.872 *0.1620.034
Sucrose Content −0.862 *0.624−0.112−0.2100.1580.0710.337−0.432
CPC −0.7870.5090.4880.1360.306−0.4340.420
TV −0.640−0.696−0.299−0.5590.098−0.413
Hardness 0.952 **0.854 *0.969 **−0.012−0.113
Sprining 0.850 *0.946 **0.087−0.168
Stickiness 0.915 *0.406−0.231
Balance 0.176−0.179
SL 0.233
* and ** reveal Significant difference at p = 0.05 and p = 0.01, respectively.
Table 4. KEGG pathways associated with DM.
Pathway DescriptionPathway_IDRatio_in_Popp-ValueMetabolites
KEGG pathways between VJ1 and CKJ1
Cysteine and Methionine Metabolismmap0027064/48340.2216C00041
Tryptophan metabolismmap0038083/48340.1005C00078; C00328
KEGG pathways between VJ2 and CKJ1
Cutin, suberine, and wax biosynthesismap0007327/48340.1431C19623
Cysteine and Methionine Metabolismmap0027064/48340.1225C00041; C02356
Tryptophan metabolismmap0038083/48340.0465C00780; C00637; C00954
Glycerophospholipid metabolismmap0056456/48340.1893C04230
KEGG pathways between VJ3 and CKJ1
Cutin, suberine, and wax biosynthesismap0007327/48340.1127C00249; C19623
Tryptophan metabolismmap0038083/48340.1748C00780; C00078; C00637
Arginine Biosynthesismap0022023/48340.0231C00025; C00049; C00064
Cysteine and Methionine Metabolismmap0027064/48340.0353C00073; C00049; C00170; C00065
Glycerophospholipid metabolismmap0056456/48340.0316C00065; C00588; C04230; C00350
KEGG pathways between VJ4 and CKJ1
Cutin, suberine, and wax biosynthesismap0007327/48340.1661C19623
Tryptophan metabolismmap0038083/48340.3076C00954
Cysteine and Methionine Metabolismmap0027064/48340.0979C00041; C00170
Metabolism of Glycerophospholipidmap0056456/48340.0914C04230; C00350
KEGG pathways between VJ5 and CKJ1
Zeatin biosynthesismap0090839/48340.0326C00147; C15546
Metabolism of Linoleic acidmap0059128/48340.0338C14827; C14828
Cysteine and Methionine Metabolismmap0027064/48340.0567C00073; C02356
The present study involves the characterization of pathways, including KEGG pathway name characterization, pathway ID, KEGG pathway ID, and ratio_in_pop, which denotes the percentage of background pathway-annotated metabolites in background metabolites. The count of KEGG compound IDs in this pathway on the left of the diagonal and the count of all KEGG compound IDs in the pathway in each pathway on the right of the diagonal were also considered. A p-value of less than 0.05 was used to determine significant enrichment terms.
Disclaimer/Publisher’s Note: The statements, opinions and data contained in all publications are solely those of the individual author(s) and contributor(s) and not of MDPI and/or the editor(s). MDPI and/or the editor(s) disclaim responsibility for any injury to people or property resulting from any ideas, methods, instructions or products referred to in the content.

