Abstract
Peanut is a leguminous crop with an indeterminate growth habit that will continuously flower during the entire reproductive development stage. Flowering redundancy adversely affects the yield and quality of peanut. In this study, eight flowering and five yield-related traits were collected and comprehensively evaluated from a diverse germplasm panel consisting of 232 peanut accessions, aiming to provide a theoretical basis for improving the flowering habit and yield for future peanut breeding efforts. As a result, large phenotypic diversity was observed in 13 traits. Most of the traits suggested high heritability, except high effective flowering duration (HEFD), days to 100% flower cessation (DTC100), and yield per plant (YPP). Days to 90% flower cessation (DTC90), days to DTC100, flowering duration (FD), and low effective flowering duration (LEFD) showed significant negative correlations with 100-seed weight, 100-pod weight, YPP, average weight per pod, and shelling percentage. Principal component analysis (PCA) suggested that flowering redundancy traits as well as yield-related traits contributed more to the first three PCs when compared to other traits. This study addresses the lack of peanut flowering phenotypic and genetic diversity and lays the foundation for in-depth research on redundancy-related genes in peanut flowering.
1. Introduction
Cultivated peanut (Arachis hypogaea L.) is an important source of vegetable protein and high-quality oil for human beings. It is also a common raw material for food and feed production. Peanut plays a significant role in poverty eradication and the empowerment of women in Africa [1]. Peanut originated from South America and is cultivated in over one hundred countries in places such as Asia, Africa, and America due to its strong adaptability [2].
An indeterminate growth habit, where the main stem and leaves continue to grow, is observed in lots of field crops [3]. It shows yield potential for soybean [4] and horse gram [5], but the long-term coexistence of vegetative and reproductive growth will adversely affect nutrient distribution, plant maturity [3], seed quality [6], and economic benefits [3] and potentially cause plant lodging [7]. Unlike other major field crops, peanut flowers aboveground and penetrates into the soil through pegs, which finally set the pods underground. The indeterminate growth habit in peanut usually lasts for 105–150 days, whereas flowering duration lasts for 50–90 days, accounting for 47.6–60.0% of the entire growth. During the long flowering period, only 4.0–12.3% of flowers effectively set pods [8]. Peanut flowering starts from the bottom to top and continues with the growth of stem and leaves. The flowers generated during the mid-to-late flowering stage are usually the flowers in a higher position on the stem, developing high pegs that hardly penetrate into the soil, which results in podding failure [9]. Therefore, the flowering redundancy represents the consumption of photosynthetic products in the peanut.
Flowering time is a major factor in crop yield [10], e.g., days to 50% flowering (DTF50) is negatively correlated with green pod yield per plant in pigeon pea [11], 100-seed weight (HSW) in chickpea [12], and yield in canola [13]. DTF50 is positively correlated with yield per plant (YPP) in chickpea [12]. DTF50 and yield are closely associated at the gene level. It was shown that FLOWERING LOCUS T (FT) paralogs have multifaceted roles in canola DTF50 and productivity traits [14], TOE4b being pleiotropic in the regulation of DTF50 and yield in soybeans [15] and Vrn-H1 and Ppd-H1 affecting flowering in barley along with significantly affecting yield [16].
The majority of peanut studies have been focused on plant architecture and pod and kernel yield components, with little attention on flowering time [17,18,19]. Previous studies regarding flowering time have only briefly focused on days to 10% flowering (DTF10) [20,21], DTF50 [22], and the concentration degree of floret flowering date [23]. There are strong correlations between early flowering progress (DTF10, DTF50) and shelling percentage (SP), 100-pod weight (HPW), HSW, and YPP; however, their relationships are not consistent across studies [19,24,25,26]. Even though a long flowering duration (FD) was observed to negatively affect yield and its related traits [27,28], flowering redundancy has long been ignored by previous groundnut researchers. Therefore, evaluating and dissecting the flowering time will give a solid foundation to understand its effects on pod yield, as well as unveiling the relative molecular mechanisms and regulatory pathways for future peanut breeding efforts.
In the current study, the phenotypic and genetic diversity of flowering time traits and yield-related traits were identified in four environments using a diversity germplasm panel consisting of 232 peanut accessions. The correlation analysis, principal component analysis, and cluster analysis were performed to clarify the relationship between flowering traits and yield-related traits. This study aims to provide ideas for high-yield and high-efficiency peanut molecular design breeding at the level of reducing flowering redundancy, as well as provide theoretical support for the subsequent mining of the genes related to the flowering time traits.
2. Materials and Methods
2.1. Plant Materials and Field Trials
A diverse germplasm panel consisting of 232 peanut accessions was collected from 15 provinces in China, including Hunan, Shandong, Henan, and Hubei, etc., with a wide range of geographical and botanical categories (Table S1). The 232 genotypes were planted in Yongzhou (113°07′ E, 28°97′ N) and Yueyang (112°10′ E, 25°35′ N), Hunan Province, China, in the spring of 2021 and planted in Changsha (113°32′ E, 28°24′ N), Hunan Province, China, in the spring and summer of 2022. These 3 cities have subtropical monsoon climates (Table S2), creating 4 distinct environments due to variations in location, sowing seasons, and soil conditions. The physicochemical properties of the soils at each site are shown in Table 1; each of the 4 environments has acidic, calcium-deficient soils.

Table 1.
Physical and chemical properties of soil in the 4 environments.
Prior to sowing, a basal application of nitrogen, phosphorus pentoxide, and potassium oxide (15:15:15) compound fertilizer at a rate of 600 kg·hm−2 was applied, along with 750 kg·hm−2 of lime. Peanut was single-seed precision sown and spaced with 0.1 m between plants in 1 row. Each ridge (width 0.5 m) had 2 rows with a spacing of 0.3 m, and there was a spacing of 0.8 m between the ridges. Each plot was sown with 50 seeds in 2 replications. The experimental plots were arranged in a randomized complete block design (RCBD), with consecutive plots planted and no empty rows left. Management was carried out according to conventional field practices.
2.2. Phenotypic Data Collection
Flowering-time-related traits were measured and recorded throughout the entire reproductive period. The yield and its related traits were measured after maturity. All the phenotypic traits were evaluated according to the methods described by Jiang and Duan [29]. The specific criteria are as follows.
2.2.1. Flowering Time Traits
Days to 10% flowering (DTF10): the number of days from the sowing date until 10% of the population is flowering.
Days to 50% flowering (DTF50): the number of days from the sowing date until 50% of the population is flowering.
Days to 100% flowering (DTF100): the number of days from the sowing date until 100% of the population is flowering.
Days to 90% flower cessation (DTC90): the number of days from the date of sowing until 90% of the population has stopped flowering.
Days to 100% flower cessation (DTC100): the number of days from the date of sowing until 100% of population has stopped flowering.
Flowering duration (FD): the time between DTF10 and DTC90.
High effective flowering duration (HEFD): the time between DTF10 and DTF100.
Low effective flowering duration (LEFD): the time between DTF100 and DTC90.
The specific embodiment of each flowering time trait is shown in Figure 1.
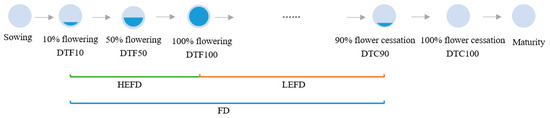
Figure 1.
Schematic diagram of flowering time traits. Note: DTF10: Days to 10% flowering; DTF50: Days to 50% flowering; DTF100: Days to 100% flowering; DTC90: Days to 90% flower cessation; DTC100: Days to 100% flower cessation; FD: Flowering duration; HEFD: High effective flowering duration; LEFD: Low effective flowering duration.
2.2.2. Yield and Its Related Traits
Yield per plant (YPP): total weight of both fully and nearly fully mature pods on a single plant.
100-pod weight (HPW): weight of 100 fully developed pods.
100-seed weight (HSW): weight of 100 fully developed seeds.
Shelling percentage (SP): the seed weights as a percentage of the pod weights counted in the yield.
Average weight per pod (AWPP): the ratio of the total weight to the total number of fully and nearly fully mature pods.
2.3. Data Analysis
2.3.1. Descriptive Statistics Analyses and Shannon–Weaver Index
Descriptive statistics for the 13 traits were performed using the pastecs package of R4.2.0; the Shannon-Wiener index (H′) was calculated using Microsoft Excel 2019 [30]; the ggplot2 package was used to graphically compare the differences of the 13 traits among different environments.
2.3.2. Phenotypic Variation Partitioning and Heritability Estimation
Data processing and multivariate statistical analysis of the 13 traits were performed using R4.2.0. The linear mixed effects model (LME) was fitted using the lme4 package [31], where all the effects were assumed as random. The LME was used to estimate the best linear unbiased predictors (BLUPs) and broad-sense heritability (H2) [32] for the 13 traits. Analysis of variance (ANOVA) was used to test the genetic variations in genotype, the environment, and the genotype-by-environment interaction.
2.3.3. Correlation Analysis and Principal Component Analysis (PCA)
Correlation analyses were performed using the corrplot package, where the Pearson correlation coefficient matrix was computed and plotted [33]. PCA was performed using the princomp function, where the correlation coefficient matrix was computed after standardizing the BLUP values, the covariance matrix of the correlation coefficients was computed, and then a principal component decomposition was performed where the first 2 or 3 principal components (PCs) usually explained the different traits with the greatest variation [34]. The results of the PCA were visualized using the FactoMineR package and the factoextra package to plot the fragmentation map, the cos2 (squared coordinates) of all traits in the PCA results, and the contribution of the traits to the principal components [35].
2.3.4. Clustering Analysis
Clustering analysis was performed using the factoextra package for systematic clustering and plotting; Euclidean distance was chosen for distance determination between observations, the longest distance method (complete) was chosen for clustering, and multiple comparisons were made between clusters for each trait using the Student-Newman-Keuls (SNK) test method using the agricolae package [36]. The clustering results were plotted using OriginPro 2023.
3. Results
3.1. Phenotypic Diversity Analysis of Flowering and Yield-Related Traits
Large variations were observed in all the collected phenotypic traits, indicating a large phenotypic diversity in the accessions (Table 2). The FD averaged 59.05 d, whereas the HEFD averaged 5.65 d and the LEFD accounted for about 90.44% of the FD, with an average duration of 53.40 d. The coefficient of variation (CV) of flowering time traits ranged from 8.20% (DTC100) to 53.43% (HEFD), with an average CV of 22.83% among these traits. As for the yield-related traits, the YPP showed highest CV (39.74%), whereas the SP showed the lowest CV (12.98%), with an average SP of 63.95%, suggesting good stability. H′ represents the degree of phenotypic diversity. The H′ of the 13 traits varied from 0.841 to 1.982, with an average H′ value of 1.504. The H′ values of all the yield-related traits were smaller than the flowering traits, with the FD being the largest and the AWPP being the smallest.
Table 2.
Descriptive statistics analyses and Shannon–Weaver diversity index (H′) regarding the 13 traits.
3.2. Phenotypic Variation Partitioning and Heritability Estimation
A mixed linear model was fitted to partition the phenotypic variation and estimate H2. Significant differences were observed among the population for all the traits under different environments (Figure 2 and Figure 3), whereas significant genotypic (G) effects, environmental (E) effects, and genotype-by-environment interaction (G × E) effects were observed for all the traits (Table 3). The HEFD, YPP, HSW, HPW and AWPP had the highest genetic coefficient of variation (GCV) (Table 3), indicating a large genetic diversity among these traits. A moderate to high heritability (H2) was observed in the majority of the phenotypic traits. The highest H2 values belonged to the HSW, SP, HPW, AWPP, DTF50, and DTF10, with the H2 values being greater than 70%, whereas the lowest H2 values were observed for the DTC100, HEFD, and YPP (51.838–54.543%) (Table 3). The BLUPs for each accession (Table S3) were predicated to suggest their breeding value.
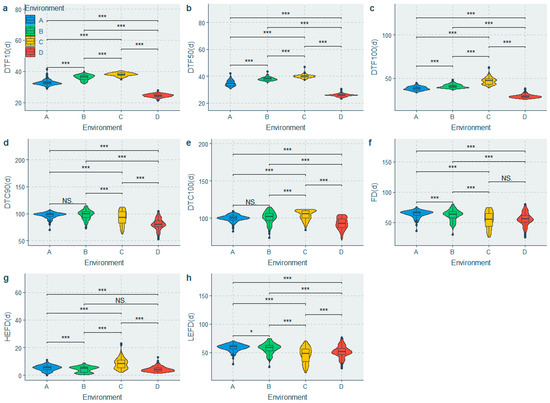
Figure 2.
Comparison of flowering time traits in the 4 environments. (a) Difference in days to 10% flowering in the 4 environments; (b) Difference in days to 50% flowering in the 4 environments; (c) Difference in days to 100% flowering in the 4 environments; (d) Difference in days to 90% flower cessation in the 4 environments; (e) Difference in days to 100% flower cessation in the 4 environments; (f) Difference in flowering duration in the 4 environments; (g) Difference in high effective flowering duration in the 4 environments; (h) Difference in low effective flowering duration in the 4 environments. Note: A: Yongzhou-spring; B: Yueyang-spring; C: Changsha-spring; D: Changsha-summer; NS: Not significant; * Significant at p ≤ 0.05; *** Significant at p ≤ 0.001.
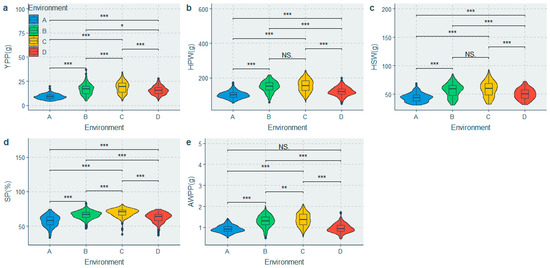
Figure 3.
Comparison of yield and its related traits in the 4 environments. (a) Difference in yield per plant in the 4 environments; (b) Difference in 100-pod weight in the 4 environments; (c) Difference in 100-seed weight in the 4 environments; (d) Difference in shelling percentage in the 4 environments; (e) Difference in average weight per pod in the 4 environments. Note: A: Yongzhou-spring; B: Yueyang-spring; C: Changsha-spring; D: Changsha-summer; NS: Not significant; * Significant at p ≤ 0.05; ** Significant at p ≤ 0.01; *** Significant at p ≤ 0.001.
Table 3.
Phenotypic variation partitioning and the estimation of broad sense heritability (H2).
The BLUPs for the 232 peanut germplasm explained the variations within the collection for 13 traits (Table S3). For example, there was no significant difference between the peanut germplasm for DTF10, which ranged from 31.00 to 35.60 d (Table S3). There was a large range for the LEFD. HN013 (64.12 d) had the longest LEFD, whereas HN195 (39.75 d) had the shortest; these values accounted for about 92.54% (HN013) and 85.63% (HN195) of the FD (Table S3). HN033, HN206, HN161, and HN010 had the highest YPPs, which were more than 60% higher than the lowest variations (HN094, HN086, HN084, and HN064) (Table S3).
3.3. Correlation Analysis between Flowering Time and Yield—Related Traits
Correlation analysis based on the BLUP values is displayed in Figure 4. When compared to the DF and HEFD, the flowering redundancy traits (DTC90, DTC100, and LEFD) suggested negative correlations with the yield-related traits such as HSW, HPW, YPP, AWPP, and SP, suggesting significant adverse effects for flowering redundancy on pod yield.
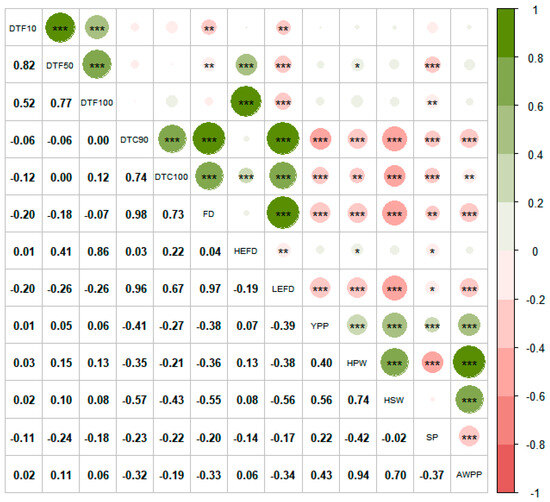
Figure 4.
Correlation analysis of the 13 traits. Note: DTF10: Days to 10% flowering; DTF50: Days to 50% flowering; DTF100: Days to 100% flowering; DTC90: Days to 90% flower cessation; DTC100: Days to 100% flower cessation; FD: Flowering duration; HEFD: High effective flowering duration; LEFD: Low effective flowering duration; YPP: Yield per plant; HPW: 100-pod weight; HSW: 100-seed weight; SP: Shelling percentage; AWPP: Average weight per pod. * Significant at p ≤ 0.05; ** Significant at p ≤ 0.01; *** Significant at p ≤ 0.001.
3.4. PCA of Flowering Time and Yield Related Traits
The first three PCs accounted for 94.8% of the phenotypic variation (Figure 5a). The contributions of the LEFD, FD, DTC90, HSW, HPW, and AWPP were greater than the average (Figure 5b). Among the top six contributory traits, the flowering redundancy traits (LEFD, FD, and DTC90) showed a greater contribution to the yield-related traits (HSW, HPW, and AWPP), with the LEFD showing the highest contribution (Figure 5b). The traits with highest contributions also had the highest cos2 of variables on PC1–3 (Figure 5c). PC1 accounted for 67.8% of the phenotypic variation (Figure 5a) and was explained primarily by the flowering redundancy traits (LEFD, FD, DTC90, and DTC100), followed by the explanation of yield-related traits (HSW, HPW, AWPP, and YPP) (Figure 5d,e). PC2, accounting for 17.0% of phenotypic variation (Figure 5a), was mainly explained by flowering traits during the early stage (DTF10, DTF50, DTF100, and HEFD) (Figure 5d,e).
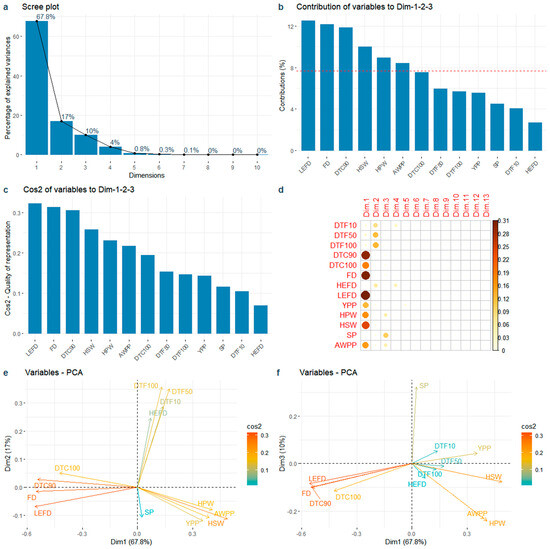
Figure 5.
Principal component analysis of the 13 traits. (a) Variance proportion of the first 10 PCs; (b) Total contribution of variables in accounting for the variability in PC1, PC2, and PC3. The red dashed line on the graph indicates the expected average contribution; (c) Quality of representation (cos2) of accumulate variables to the first 3 PCs; (d) The cos2 of variables on all the dimensions; (e) Relationship between the 13 traits and PC1 and PC2; (f) Relationship between the 13 traits and PC1 and PC3. Note: DTF10: Days to 10% flowering; DTF50: Days to 50% flowering; DTF100: Days to 100% flowering; DTC90: Days to 90% flower cessation; DTC100: Days to 100% flower cessation; FD: Flowering duration; HEFD: High effective flowering duration; LEFD: Low effective flowering duration; YPP: Yield per plant; HPW: 100-pod weight; HSW: 100-seed weight; SP: Shelling percentage; AWPP: Average weight per pod.
3.5. Cluster Analysis of Peanut Accessions
Cluster analysis classified the diversity panel into six clusters with 32, 17, 65, 16, 35, and 67 accessions in each cluster at an Euclidean distance of 45 (Figure 6). Multiple comparisons for the 13 traits were performed among the six clusters using the SNK test and significant differences were observed in the majority of traits (Table S4).
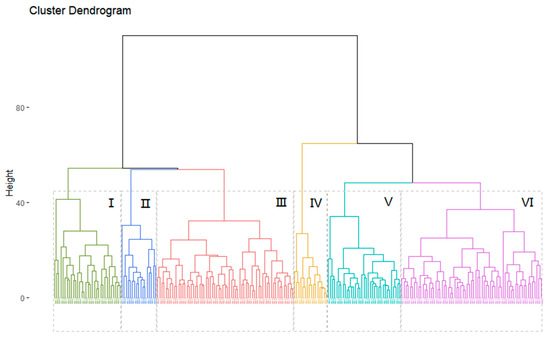
Figure 6.
Clustering analysis of 232 peanut accessions.
The longest DTF50, DTF100, and DTC100 values and the lowest SP values were observed in cluster I. Cluster II had the largest HPW, HSW, and AWPP values, indicating that these accessions had the largest pod and seed weights. Cluster III had the shortest DTC90, DTC100, FD, and LEFD vales and the highest YPP. Cluster IV contained the longest DTC90, FD, and LEFD values, whereas it had the lowest YPP, HPW, HSW, and AWPP values. Clusters V and VI contained the shortest DTF50 and DTF100 values. A declining trend in FD, DTC90, and LEFD and an ascending trend in YPP were observed from cluster I to III, as well as from cluster IV to VI (Figure 7). The result of the correlation analysis and PCA was further validated by the character and trend of the six clusters (Table S4 and Figure 7), indicating that the accessions with flowering redundancy usually had a lower yield and lower yield-related traits.
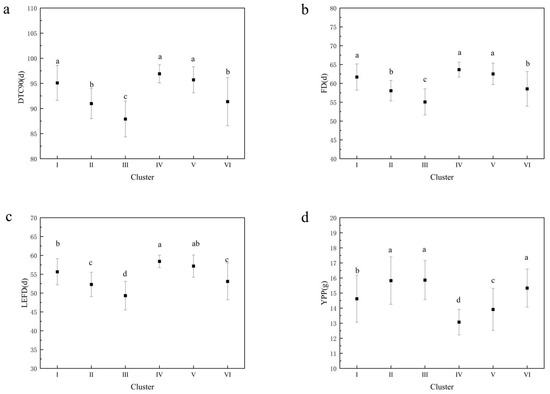
Figure 7.
Mean and significance of the different variables in the 6 clusters. (a) Mean and significance of days to 90% flower cessation (DTC90) in the 6 clusters; (b) Mean and significance of flowering duration (FD) in the 6 clusters; (c) Mean and significance of low effective flowering duration (LEFD) in the 6 clusters; (d) Mean and significance of yield per plant (YPP) in the 6 clusters. Note: Different letters are significantly different at p ≤ 0.05 using the SNK test.
4. Discussion
The BLUPs of the HPW and SP for HN118 (Huayu 22) in this study were 137.07 g and 61.47%, respectively, which were similar to the P0 treatment (HPW, 120–140 g; SP, 65–68%) in the study by Chen et al. [37]. The BLUPs of the HPW (180.93 g) and HSW (66.34 g) for HN121 (Huayu 36) were within the range of values reported in a previous study (HPW, 161.17–185.87 g; HSW, 63.20–67.96 g) [38]. The same results for the HPW and HSW were observed for HN224 (Zhonghua 16) in the study by Zheng et al. [39] and ours. This indicates that the accessions could exhibit normal growth and development in the four environments used in our study.
4.1. Phenotypic Diversity Analysis of Flowering and Yield Traits in the Germplasm Panel
Accurate and comprehensive characterization of agronomic traits is an important prerequisite for further breeding efforts. The phenotypic diversity had been studied extensively in different peanut germplasm panels in terms of plant architecture, growth duration, and pod yield and quality [40,41], as well as resistance in response to biotic and abiotic stresses such as late leaf spot, rust [42,43], stem rot [44], heat [45], cold [46], and drought [47,48].
The majority of published studies on flower developmental timing have focused on DTF10 and DTF50, with no attention paid to redundant flower development. Yield has been the focus of phenotyping research in peanut, its related traits have usually been considered in combination by breeders to improve the efficiency of breeding selection. The means of the DTF10, DTF50, YPP, HSW, and SP in these germplasm accessions were consistent with the studies of Holbrook et al. [49], Upadhyaya [50], and Yol et al. [25]. The YPP and HSW usually have higher phenotypic diversity than the DTF10, DTF50, and SP, as reflected by wider difference of CV among them, and this relationship was also observed in the studies of Upadhyaya et al. [51] and Yol et al. [25]. In a comprehensive comparison with the result of previous studies [25,27,52,53], this study shows that the CVs for the DTF10, DTF50, DTC100, FD, HPW, HSW, SP, and H′ of this population were at a higher level generally. There was no corroboration of the other flowering time traits from the earlier study, but they showed rich phenotypic diversity and higher H′ values (Table 2), which may still indicate that the germplasm resources chosen for this study spanned a sufficiently broad range of flowering phenotypes. The germplasm resource also has a more enriched phenotypic diversity of yield−related traits, larger differences between the different genotypes, and is a highly representative germplasm panel composition, which indicates that there is great potential for selection in variety breeding and excavating superior phenotypes.
4.2. Genetic Diversity Analysis of Flowering and Yield Traits in the Germplasm Panel
Flowering and yield−related trait expression can be affected by many factors in peanut. Significant genotypic effects were found for the DTF10 and yield-related traits in a study by Kumar et al. [54]; those traits were also influenced by the genotype-by-environment interaction and the environment [45]. There were large differences in the DTF50 of the same genotypes observed in different environment [10,25]. Significant differences were found for the FD, YPP, SP, and HSW [50] and for DTF10, DTC100, YPP, HSW, and SP [27] in different environments. The same results were observed for the 13 traits in this study (Figure 2 and Figure 3 and Table 3). These studies indicate that the performance of flowering and yield-related traits in peanut are highly susceptible to genotype, the environment, and genotype-by-environment interaction. Large populations over multiple years and locations are necessary for measuring the phenotypic diversity.
A moderate to high H2 was observed in the majority of the phenotypic traits, which was the same result as in other studies. But, the H2 of some traits in previous studies, e.g., the DTF10 (67.9%) in the study by Kumar et al. [54] and the DTF50 (61.593%, 63.408%) and SP (60.194%, 45.714%) in the study by Patil et al. [18], were lower than those in this study (Table 3). This may be due to the fact that the study population was small and less representative, as in [54], or because the H2 was calculated in one environment and the effect of the genotype-by-environment was not taken into account [18]. Yield-related traits usually have a high H2, as shown in the previous studies by Kumar et al. (HSW—86.4%, HPW—78.98%) [54] and Zaman et al. (HSW—87.01%, SP—70.00%) [40], whereas the HPW (0.79, 0.80) and HSW (0.90, 0.77) had consistently high H2 values even under water-limited and well-watered conditions [20]. The same result was found in this study (Table 3). All of these studies indicate that the HPW, HSW, and SP are less affected by the environment, their rich genetic diversity was primarily controlled by genes. It can be observed that the YPP was lower than the other yield-related traits (Table 3); this result also appeared in the phenotypic diversity studies by Jiang et al. [55] and Banla et al. [26] and might be because the YPP is a more complex quantitative trait compared to the other yield-related traits, is directly or indirectly influenced by several other traits [56,57], and is also likely to be subject to environmental influences [27,50].
4.3. Flowering Redundancy Has Significant Adverse Effects on Pod Yield
4.3.1. Correlation Analysis of Flowering Time and Yield Traits
Strong correlations were found between some of the flowering traits in this study (Figure 4). The FD had a significant negative correlation (p < 0.01) with both the DTF10 and DTF50, which is in agreement with the results of Cheong et al. [52]. Figure 4 indicates that early flowering varieties had short HEFDs, long FDs and LEFDs, and serious flowering redundancies. The FD and LEFD had higher correlation coefficients with DTC90 and DTC100 than DTF10, DTF50, and DTF100, indicating that while flowering redundancy was related to the early flowering process, it was mainly caused by the late termination of flowering.
The flowering time was closely related to peanut maturity [58] and was considered to be one of the important agronomic traits affecting peanut yield and quality [54]. Most previous workers had investigated the diversity of DTF10 and DTF50 together with plant type and yield-related traits in peanut populations [24,25,26]. In this study, it was found that the DTF10, DTF50, and DTF100 were negatively correlated with the SP, which is in agreement with the results of Vasanthi et al. [24], Yol et al. [25], and Banla et al. [26] and in contrast to the result of Zaman et al. [40]. A significant positive correlation was found between the DTF50 and the HPW in the study by Vasanthi et al. [24], which is in agreement with the results of this study. It was observed that DTF10 and DTF50 were negatively correlated with the seed yield in the study of Yol et al. [25]. But, there was a positive correlation between DTF50 and YPP and between DTF10 or DTF50 and seed yield [18,19]; DTF10, DTF50, DTF100, and HEFD had the same relationship with YPP in this study. There were differences in the results between these studies, but all the correlation coefficients were low, which means that the effect of the DTF10, DTF50, DTF100, and HEFD on the yield was relatively small. The YPP would be more variable and the correlation between it and the other traits would become uncertain when environment fluctuation was encountered; this phenomenon has been shown in chickpeas [59,60].
The DTC90, DTC100, FD, and LEFD, which characterize flowering redundancy, were significantly negatively correlated (p < 0.01 or p < 0.001) with the YPP, HPW, HSW, SP, and AWPP in this study (Figure 4), which is consistent with other studies. It was found that the DTC100 was significantly negatively correlated with the HSW in two seasons at two locations in the study by Swamy et al. [27]. Additionally, seed yield was found to be negatively correlated with the FD and positively correlated with the duration from the end of flowering to pod maturation [28]. In a study concerning chickpea, Monpara and Dhameliya [59] found that the FD has a significant positive correlation with maturity but a weak correlation with YPP; it is possible that as the study performed the correlation analysis using hybrid combinations as boundaries, this lead to smaller populations, and the means for chickpea FD ranged from 25.40 to 36.60 d, which is much lower than that for peanut (58.83 d); the low level of flowering redundancy has softer impact on yield. Such a significant negative effect for excess FD on yield could be because the increased inefficiency sink caused by flowering redundancy consumes a large amount of photosynthates and nutrients that would be needed to be transported to the formed pods, which became a major factor limiting the yield and pod quality; the same principle in sugarcane has shown that non-essential flowering had a negative effect on sugarcane yield and sugar content [61,62]. In addition, excessive FD has been shown to increase the number of immature pods as well as the number of ill-filled pods [63], which is detrimental to the formation of high-quality pods, and that early DTC90 and FD shortening, which were created by artificially removing flowers, may promote an increase in both the HSW and maturity seed weight [64].
4.3.2. PCA of Peanut Germplasm Resources
There were some correlations among parts of the 13 traits in this study, and the direct use of phenotypes to assess the group will result in a more complex investigation of the problem and affect the actual results of the assessment. PCA can convert the original number of indicators that are related to one another into new global indicators that are less numerous and independent of one another, with little or no loss of original information [34]. PCA has been used to conduct a comprehensive assessment in peanut germplasm resources [26,55,65]. There were three new factors that were extracted following PCA in this study (Figure 5), which were yield and its constraints, the early flowering process, and the fullness of the seed. PCA has shown that the seed and pod traits are usually the major traits influencing the variation in peanut populations [26,53] and that the HSW usually becomes one of the important sources of population phenotypic variation in common bean [66], cowpea [67], pigeonpea [68], and soybean [69]. In the first three PCs of this study, the LEFD, FD, DTC90, HSW, HPW, and AWPP had a high cumulative contribution and high cos2 values, indicating that these 6 traits were contributing to the variation of the 13 traits in these peanut germplasm accessions, and the importance degree of the HSW was consistent with previous studies. Furthermore, the LEFD had the highest contribution and the FD and DTC90 also had higher contributions than the HSW, HPW, and AWPP of the 13 traits in this study, which differed from the results of previous studies, suggesting that flowering redundancy was the main difference source of the differences in the 13 traits in these germplasm accessions.
4.3.3. Cluster Analysis of Peanut Germplasm Resources
In this study, the 232 germplasm accessions were categorized into six clusters based on the combined performance of the 13 traits at an Euclidean distance of 45. The clusters have 13.79%, 7.33%, 28.02%, 6.90%, 15.09%, and 28.88% of the total accessions. Accessions from the Hunan Province of China were found in all clusters, and resources from the Shandong, Henan, Hubei and Fujian Provinces of China were all distributed in multiple clusters, indicating that accessions from all areas have richer diversity and that differences in the phenotypes of accessions are unrelated to their geographical origin; this is similar to the phenomenon reported for peanut in the study by Mubai et al. [57] and the phenomena for mungbean [70], common bean [66], and cowpea [71]. For this phenomenon, in the case of bred varieties, it is a reflection of the use of the same high-quality parents by breeders in different parts of the world or of breeding programs that coincide with each other; in the case of the landrace varieties, the roles of genetic drift, selective pressures, and the environment, among others, may be greater than the geographic distance [72,73].
The differences among the six clusters were primarily in the HPW, HSW, AWPP, FD, and LEFD (Table S4 and Figure 7), which corresponded to the traits that were significant contributors to differences in the phenotypic traits in PCA (Figure 5). A declining trend in the FD, DTC90, and LEFD and an ascending trend in the YPP were observed from clusters I to III as well as from clusters IV to VI (Figure 7). The germplasm accessions with late DTC90 and DTC100 and long FDs and LEFDs, which have low YPPs, HPWs, HSWs, and AWPPs (Cluster IV and V) (Table S4), further indicate that flowering redundancy was extremely tightly associated with the yield and its related traits. The majority of traits are significantly different between clusters. The accessions with extreme flowering redundancy and yield can be screened from clusters III, IV, and V to further elucidate the mechanism of correlation between flowering redundancy and yield through transcriptome, metabolome, or multi−omics analyses.
Flowering redundancy was the manifestation of reproductive growth redundancy and the result of vegetative growth redundancy. The end of flowering occurs when shoot apical meristem (SAM) proliferation halts [74]; however, due to an indeterminate growth habit, the peanut plant has an increasing number of main stems and meristem nodes, continues grow out leaves, and has a long-term coexistence of vegetative growth and reproductive growth, with continual flowering and continual peg emergence. Vegetative growth redundancy at a later stage with reproductive growth redundancy that was caused by vegetative growth redundancy depleted large amounts of photosynthetic products and nutrients that should have been transferred to the early pods, causing the yield and fullness of the pods to suffer. The results of the multivariate analysis showed that flowering redundancy adversely affected peanut pod formation and the resulting pod yield and the so-called HEFD is not closely related to the yield characteristics. The DTC90, DTC100, FD, and LEFD were strongly negatively correlated with the HPW, HSW, AWPP, YPP, and SP and flowering redundancy was particularly important due to it penetrating both vegetative growth and reproductive growth.
5. Conclusions
The population of 232 germplasm accessions was planted in four different environments to explore phenotypic diversity of 13 traits and analyze the relationship between flowering time traits and yield-related traits. The results show that the flowering traits had higher phenotypic diversity and the yield traits had richer variance potentials. Significant effects for the genotype, environment, and genotype-by-environment interaction were found for the 13 traits. A moderate to high H2 was observed in the majority of the phenotypic traits, which mainly controlled by genetics. Multivariate statistical analysis indicated flowering redundancy adversely affected peanut pod formation and the resulting pod yield. This study further supplements the study of phenotypic diversity and genetic diversity in peanut flowering time traits and lays the foundation for the localization of peanut flowering−redundancy-related genes. We will further dissect the diversity at the molecular level in next step to validate the extent of genetic diversity that exists in this germplasm. The initial exploration of the relationship between flowering redundancy and yield−related traits provides direction and theoretical support for subsequent peanut improvement and high-yield and high-efficiency breeding.
Supplementary Materials
The following supporting information can be downloaded at: https://www.mdpi.com/article/10.3390/agronomy14030434/s1, Table S1: The detailed information of origins and resource background of 232 peanut accessions; Table S2: The climatic conditions of the three cities; Table S3: Summary of BLUPs of the 232 peanut genotypes for different phenotypic traits; Table S4: The mean and range of the 13 traits in the 6 clusters.
Author Contributions
Conceptualization, L.L. and Z.L.; methodology, D.L.; software, Z.L. and N.L.; validation, L.L. and Z.L.; formal analysis, N.Z.; investigation, N.L., K.T., X.L., Y.T. and X.Y.; resources, L.L.; data curation, N.L., K.T., X.L., Y.T. and X.Y.; writing—original draft preparation, N.L.; writing—review and editing, N.L., L.L. and Z.L.; visualization, N.L.; supervision, D.L., N.Z., L.L. and Z.L.; project administration, D.L., N.Z., L.L. and Z.L.; funding acquisition, D.L., N.Z., L.L. and Z.L. All authors have read and agreed to the published version of the manuscript.
Funding
This work was supported by the National Key R&D Project (No. 2018YFD1000900), Chinese Agricultural Research System (CARS-13), Hunan Key R&D Project (No. 2021NK2005), Shandong Key R&D Project (No. ZFJH202310-2), and Hunan Modern Agricultural Research System. This work was also funded by General Scientific Research Project of Education Department of Hunan Province (19C0930) and Crop Science Excellent Talent Fund of Hunan Agricultural University (YXQN2018-21).
Data Availability Statement
The data presented in this study are available in the tables, figures, and Supplementary tables in the manuscript.
Conflicts of Interest
The authors declare no conflicts of interest.
References
- Magassa, M. Improved Varieties Sow a Better Future in Mali’s Groundnut Hubs. ICRISAT. 2022. Available online: https://www.cgiar.org/news-events/news/improved-varieties-sow-a-better-future-in-malis-groundnut-hubs (accessed on 23 July 2023).
- Food and Agriculture Organization. 2021. Available online: https://www.fao.org/faostat/zh/#data/QCL/visualize (accessed on 10 January 2024).
- Huyghe, C. Genetics and genetic modifications of plant architecture in grain legumes: A review. Agronomie 1998, 18, 383–411. [Google Scholar] [CrossRef]
- Shin, K.; Kenichiro, F.; Setsuzo, Y.; Masao, I.; Tatsuhiko, S.; Takashi, S.; Akio, K.; Takeshi, N. Seed yield and its components of indeterminate and determinate lines in recombinant inbred lines of soybean. Breed. Sci. 2015, 65, 154–160. [Google Scholar] [CrossRef]
- Ashwini, K.V.R.; Ramesh, S.; Sunitha, N.C. Comparative BLUP, YREM-based performance and AMMI model-based stability of horse gram [Macrotyloma uniflorum (Lam.) Verdc.] genotypes differing in growth habit. Genet. Resour. Crop Evol. 2021, 68, 457–467. [Google Scholar] [CrossRef]
- Kaur, H.; Banga, S.S. Discovery and mapping of Brassica juncea Sdt1 gene associated with determinate plant growth habit. Theor. Appl. Genet. 2015, 128, 235–245. [Google Scholar] [CrossRef]
- Shin, K.; Takashi, S.; Fumio, T.; Akio, K.; Masao, I.; Elroy, C. Effect of change from a determinate to a semi-determinate growth habit on the yield and lodging resistance of soybeans in the northeast region of Japan. Breed. Sci. 2019, 69, 151–159. [Google Scholar] [CrossRef]
- Çalişkan, S.; Çalişkan, M.E.; Arslan, M. Genotypic differences for reproductive growth, yield, and yield components in groundnut (Arachis hypogaea L.). Turk. J. Agric. For. 2008, 32, 415–424. [Google Scholar]
- Kaba, J.S.; Kumaga, F.K.; Ofori, K. Effect of flower production and time of flowering on pod yield of peanut (Arachis hypogaea L.) genotypes. IOSR J. Agric. Vet. Sci. 2014, 7, 44–49. [Google Scholar] [CrossRef]
- Jung, C.; Müller, A.E. Flowering time control and applications in plant breeding. Trends Plant Sci. 2009, 14, 563–573. [Google Scholar] [CrossRef]
- Patil, H.E.; Dikshit, N.; Aklade, S.A.; Vavdiya, P.A. Evaluation of vegetable type Pigeon pea (Cajanus cajan (L.) genotypes for yield and yield contributing traits. Ecol. Environ. Conserv. 2016, 22, 247–254. [Google Scholar]
- Gaur, P.M.; Samineni, S.; Tripathi, S.; Varshney, R.K.; Gowda, C.L. Allelic relationships of flowering time genes in chickpea. Euphytica 2015, 203, 295–308. [Google Scholar] [CrossRef]
- Raman, R.; Diffey, S.; Carling, J.; Cowley, R.B.; Kilian, A.; Luckett, D.J.; Raman, H. Quantitative genetic analysis of grain yield in an Australian Brassica napus doubled-haploid population. Crop Pasture Sci. 2016, 67, 298–307. [Google Scholar] [CrossRef]
- Raman, H.; Raman, R.; Qiu, Y.; Yadav, A.S.; Sureshkumar, S.; Borg, L.; Rohan, M.; Wheeler, D.; Owen, O.; Menz, I.; et al. GWAS hints at pleiotropic roles for FLOWERING LOCUS T in flowering time and yield-related traits in canola. BMC Genom. 2019, 20, 636. [Google Scholar] [CrossRef] [PubMed]
- Li, H.Y.; Du, H.P.; Huang, Z.R.; He, M.L.; Kong, L.P.; Fang, C.; Chen, L.Y.; Yang, H.; Zhang, Y.H.; Liu, B.H.; et al. The AP2/ERF transcription factor TOE4b regulates photoperiodic flowering and grain yield of per plant in soybean. Plant Biotechnol. J. 2023, 21, 1682–1694. [Google Scholar] [CrossRef] [PubMed]
- Cockram, J.; Jones, H.; Leigh, F.J.; O’Sullivan, D.; Powell, W.; Laurie, D.A.; Greenland, A.J. Control of flowering time in temperate cereals: Genes, domestication, and sustainable productivity. J. Exp. Bot. 2007, 58, 1231–1244. [Google Scholar] [CrossRef] [PubMed]
- Upadhyaya, H.D.; Dwivedi, S.L.; Vadez, V.; Hamidou, F.; Singh, S.; Varshney, R.K.; Liao, B. Multiple resistant and nutritionally dense germplasm identified from mini core collection in peanut. Crop Sci. 2014, 54, 679–693. [Google Scholar] [CrossRef]
- Patil, R.; Viswanatha, K.P.; Upadhyaya, H.D.; Lokesha, R.; Khan, H.; Gururaj, S. Genetic diversity, association and principle component analyses for agronomical and quality traits in genomic selection training population of groundnut (Arachis hypogaea L.). Indian J. Genet. Plant Breed. 2020, 80, 282–290. [Google Scholar] [CrossRef]
- Ali, M.A.; Pal, A.K.; Baidya, A.; Gunri, S.K. Variation in dry matter production, partitioning, yield and its correlation in groundnut (Arachis hypogaea L.) genotypes. Legume Res. 2021, 44, 706–711. [Google Scholar] [CrossRef]
- Fonceka, D.; Tossim, H.A.; Rivallan, R.; Vignes, H.; Faye, I.; Ndoye, O.; Moretzsohn, M.C.; Bertioli, D.J.; Glaszmann, J.C.; Courtois, B.; et al. Fostered and left behind alleles in peanut: Interspecific QTL mapping reveals footprints of domestication and useful natural variation for breeding. BMC Plant Biol. 2012, 12, 26. [Google Scholar] [CrossRef]
- Wang, L.; Yang, X.L.; Cui, S.L.; Wang, J.H.; Hou, M.Y.; Mu, G.J.; Li, Z.C.; Liu, L.F. Identification of main effect and epistatic QTLs controlling initial flowering date in cultivated peanut (Arachis hypogaea L.). J. Integr. Agric. 2020, 19, 2383–2393. [Google Scholar] [CrossRef]
- Shirasawa, K.; Koilkonda, P.; Aoki, K.; Hirakawa, H.; Tabata, S.; Watanabe, M.; Hasegawa, M.; Kiyoshima, H.; Suzuki, S.; Kuwata, C.; et al. In silico polymorphism analysis for the development of simple sequence repeat and transposon markers and construction of linkage map in cultivated peanut. BMC Plant Biol. 2012, 12, 80. [Google Scholar] [CrossRef]
- Wang, L.; Yang, X.; Cui, S.; Zhao, N.N.; Li, L.; Hou, M.Y.; Mu, G.J.; Liu, L.F.; Li, Z.C. High-density genetic map development and QTL mapping for concentration degree of floret flowering date in cultivated peanut (Arachis hypogaea L.). Mol. Breed. 2020, 40, 17. [Google Scholar] [CrossRef]
- Vasanthi, R.P.; Suneetha, N.; Sudhakar, P. Genetic variability and correlation studies for morphological, yield and yield attributes in groundnut (Arachis hypogaea L.). Legume Res. 2015, 38, 9–15. [Google Scholar] [CrossRef]
- Yol, E.; Furat, S.; Upadhyaya, H.D.; Uzun, B. Characterization of groundnut (Arachis hypogaea L.) collection using quantitative and qualitative traits in the Mediterranean Basin. J. Integr. Agric. 2018, 17, 63–75. [Google Scholar] [CrossRef]
- Banla, E.M.; Dzidzienyo, D.K.; Diangar, M.M.; Melomey, L.D.; Offei, S.K.; Tongoona, P.; Desmae, H. Molecular and phenotypic diversity of groundnut (Arachis hypogaea L.) cultivars in Togo. Physiol. Mol. Biol. Plants 2020, 26, 1489–1504. [Google Scholar] [CrossRef]
- Swamy, B.M.; Upadhyaya, H.D.; Goudar, P.K.; Kullaiswamy, B.Y.; Singh, S. Phenotypic variation for agronomic characteristics in a groundnut core collection for Asia. Field Crops Res. 2003, 84, 359–371. [Google Scholar] [CrossRef][Green Version]
- Gan, Y.T.; Harker, K.N.; Kutcher, H.R.; Gulden, R.H.; Irvine, B.; May, W.E.; O’Donovan, J.T. Canola seed yield and phenological responses to plant density. Can. J. Plant Sci. 2016, 96, 151–159. [Google Scholar] [CrossRef]
- Jiang, H.F.; Duan, N.X. Descriptors and Data Standard for Peanut (Arachis spp.); China Agriculture Press: Beijing, China, 2006; pp. 26–29. [Google Scholar]
- Pan, J.; Zhang, L.; Wang, L.; Fu, S. Effects of long-term fertilization treatments on the weed seed bank in a wheat-soybean rotation system. Glob. Ecol. Conserv. 2020, 21, e00870. [Google Scholar] [CrossRef]
- Bates, D.; Mächler, M.; Bolker, B.; Walker, S. Fitting Linear Mixed-Effects Models Using lme4. J. Stat. Softw. 2015, 67, 1–48. [Google Scholar] [CrossRef]
- Piepho, H.P.; Mohring, J. Computing heritability and selection response from unbalanced plant breeding trials. Genetics 2007, 177, 1881–1888. [Google Scholar] [CrossRef]
- Friendly, M. Corrgrams: Exploratory displays for correlation matrices. Am. Stat. 2002, 56, 316–324. [Google Scholar] [CrossRef]
- Jolliffe, I.T.; Cadima, J. Principal component analysis: A review and recent developments. Philos. Trans. R. Soc. A Math. Phys. Eng. Sci. 2016, 374, 20150202. [Google Scholar] [CrossRef] [PubMed]
- Kassambara, A. Practical Guide to Principal Component Methods in R; STHDA: Los Angeles, CA, USA, 2017; Volume 2. [Google Scholar]
- Steel, R.G.D.; Torrie, J.H.; Dicey, D.A. Principles and Procedures of Statistics: A Biometrical Approach; McGraw-Hill Co. Inc.: New York, NY, USA, 1997. [Google Scholar]
- Chen, T.T.; Zhang, J.L.; Wang, X.Y.; Zeng, R.E.; Zhang, L. Improving Peanut Growth and Yield Responses with Monoseeding and Paclobutrazol Applications in Southern China. Legume Res. 2022, 45, 327–333. [Google Scholar] [CrossRef]
- Liu, Z.; Nan, Z.W.; Lin, S.M.; Meng, W.W.; Xie, L.Y.; Yu, H.Q.; Zhang, Z.; Wan, S.B. Organ removal of maize increases peanut canopy photosynthetic capacity, dry matter accumulation, and yield in maize/peanut intercropping. Front. Plant Sci. 2023, 24, 1266969. [Google Scholar] [CrossRef] [PubMed]
- Zheng, W.Y.; Dai, J.; Li, N.; Zhao, H.T.; Chang, H.B.; Liao, X.; Sheng, F.; Lu, Q. Comparative evaluation of microbially-produced biostimulants on peanut growth. Sustainability 2023, 15, 8025. [Google Scholar] [CrossRef]
- Zaman, M.A.; Tuhina-Khatun, M.; Ullah, M.Z.; Moniruzzamn1, M.; Alam, K.H. Genetic variability and path analysis of groundnut (Arachis hypogaea L.). Agriculturists 2011, 9, 29–36. [Google Scholar] [CrossRef]
- Mukri, G.; Nadaf, H.L.; Bhat, R.S.; Gowda, M.V.C.; Upadhyaya, H.D.; Sujay, V. Phenotypic and molecular dissection of ICRISAT mini core collection of peanut (Arachis hypogaea L.) for high oleic acid. Plant Breed. 2012, 131, 418–422. [Google Scholar] [CrossRef]
- Sudini, H.; Upadhyaya, H.D.; Reddy, S.V.; Mangala1, U.N.; Rathore1, A.; Kumar, K.V.K. Resistance to late leaf spot and rust diseases in ICRISAT’s mini core collection of peanut (Arachis hypogaea L.). Australas. Plant Pathol. 2015, 44, 557–566. [Google Scholar] [CrossRef]
- Chaudhari, S.; Khare, D.; Patil, S.C.; Sundravadana, S.; Variath, M.T.; Sudini, H.K.; Manohar, S.S.; Bhat, R.S.; Pasupuleti, J. Genotype × Environment Studies on Resistance to Late Leaf Spot and Rust in Genomic Selection Training Population of Peanut (Arachis hypogaea L.). Front. Plant Sci. 2019, 10, 1338. [Google Scholar] [CrossRef]
- Guclu, V.; Aydogdu, M.; Basak, M.; Kizil, S.; Uzun, B.; Yol, E. Characterization of a groundnut collection to stem rot disease caused by Sclerotium rolfsii. Australas. Plant Pathol. 2020, 49, 691–700. [Google Scholar] [CrossRef]
- Hamidou, F.; Halilou, O.; Vadez, V. Assessment of groundnut under combined heat and drought stress. J. Agron. Crop Sci. 2013, 199, 1–11. [Google Scholar] [CrossRef]
- Upadhyaya, H.D.; Reddy, L.J.; Dwivedi, S.L.; Gowda, C.L.L.; Singh, S. Phenotypic diversity in cold-tolerant peanut (Arachis hypogaea L.) germplasm. Euphytica 2009, 165, 279–291. [Google Scholar] [CrossRef]
- Upadhyaya, H.D. Variability for drought resistance related traits in the mini core collection of peanut. Crop Sci. 2005, 45, 1432–1440. [Google Scholar] [CrossRef]
- Lal, C.; Hariprasanna, K.; Rathnakumar, A.L.; Misra, J.B.; Samdur, M.Y.; Gor, H.K.; Chikani, B.M.; Jain, V.K. Response of peanut genotypes to mid-season moisture stress: Phenological, morpho-physiological, and yield traits. Crop Pasture Sci. 2009, 60, 339–347. [Google Scholar] [CrossRef]
- Holbrook, C.C.; Anderson, W.F.; Pittman, R.N. Selection of a core collection from the US germplasm collection of peanut. Crop Sci. 1993, 33, 859–861. [Google Scholar] [CrossRef]
- Upadhyaya, H.D. Phenotypic diversity in groundnut (Arachis hypogaea L.) core collection assessed by morphological and agronomical evaluations. Genet. Resour. Crop Evol. 2003, 50, 539–550. [Google Scholar] [CrossRef]
- Upadhyaya, H.D.; Bramel, P.J.; Ortiz, R.; Singh, S. Developing a mini core of peanut for utilization of genetic resources. Crop Sci. 2002, 42, 2150–2156. [Google Scholar] [CrossRef]
- Cheong, Y.K.; Park, K.H.; Doo, H.S.; Ryu, J.H.; Choi, S.Y.; Suh, D.Y. Flowering and Fruiting of Characteristics of Short Flowering Period Lines in Peanut. Korean J. Crop Sci. 2002, 47, 437–442. [Google Scholar]
- Mazzani, C.E.; Segovia, V.; Marín, C.; Pacheco, W. Peanut (Arachis hypogaea L.) cultivars classification based on quantitative traits to establish core collections of the genebank of Centro Nacional de Investigaciones Agropecuarias, Venezuela. Rev. UDO Agrícola 2009, 9, 756–763. [Google Scholar]
- Kumar, N.; Ajay, B.C.; Rathanakumar, A.L.; Radhakrishnan, T.; Jadon, K.S.; Chikani, B.M. Genetic variability analyses for yield and physiological traits in groundnut (Arachis hypogaea L.) genotypes. J. Oilseeds Res. 2019, 36, 1–7. [Google Scholar] [CrossRef]
- Jiang, H.F.; Huang, L.; Ren, X.P.; Chen, Y.N.; Zhou, X.J.; Xia, Y.L.; Huang, J.Q.; Lei, Y.; Yan, L.Y.; Wan, L.Y.; et al. Diversity characterization and association analysis of agronomic traits in a Chinese peanut (Arachis hypogaea L.) mini-core collection. J. Integr. Plant Biol. 2014, 56, 159–169. [Google Scholar] [CrossRef]
- Kiranmai, S.M.; Venkataravana, P.; Pushpa, H.D. Correlation and path analysis studies in groundnut under different environment. Legume Res. 2016, 39, 1048–1050. [Google Scholar] [CrossRef]
- Mubai, N.; Sibiya, J.; Mwololo, J.; Musvosvi, C.; Charlie, H.; Munthali, W.; Kachulu, L.; Okori, P. Phenotypic correlation, path coefficient and multivariate analysis for yield and yield-associated traits in groundnut accessions. Cogent Food Agric. 2020, 6, 1823591. [Google Scholar] [CrossRef]
- Jannat, S.; Hassan, M.U.; Ortiz, G.T.; Shah, M.K.N.; Ahmed, M.; Shah, A.H.; Qayyum, A. Genetic characterization of flowering and phytochrome genes in peanut (Arachis hypogaea L.) for early maturity. Mol. Biol. Rep. 2022, 49, 5495–5504. [Google Scholar] [CrossRef] [PubMed]
- Monpara, B.A.; Dhameliya, H.R. Genetic behaviour of earliness related traits and seed yield in chickpea (Cicer arietinum L.). Pak. J. Biol. Sci. 2013, 16, 955–959. [Google Scholar] [CrossRef] [PubMed]
- Mallikarjuna, B.P.; Viswanatha, K.P.; Samineni, S.; Gaur, P.M. Association of flowering time with phenological and productivity traits in chickpea. Euphytica 2019, 215, 77. [Google Scholar] [CrossRef]
- Endres, L.; da Cruz, S.J.S.; Vilela, R.D.; dos Santos, J.M.; Barbosa, G.V.D.S.; Silva, J.A.C. Foliar applications of calcium reduce and delay sugarcane flowering. BioEnergy Res. 2016, 9, 98–108. [Google Scholar] [CrossRef]
- Khokhar, J.S.; Jamwal, N.S.; Sanghera, G.S.; Singh, P. Evaluation of sugarcane (Saccharum officinarum) germplasm for quality, yield traits and effects of flowering on cane traits. Indian J. Agric. Sci. 2022, 92, 842–846. [Google Scholar] [CrossRef]
- Vinothini, N.; Vijayan, R.; Umarani, R. Studies on flowering pattern in relation to seed filling and seed multiplication rate in groundnut (Arachis hypogaea L.). Int. J. Curr. Microbiol. Appl. Sci. 2018, 7, 3321–3328. [Google Scholar] [CrossRef]
- Hariprasanna, K.; Lal, C.; Radhakrishnan, T. Relationship between flowering duration and physical quality traits as well as pod yield in groundnut (Arachis hypogaea). Indian J. Agric. Sci. 2008, 78, 180–182. [Google Scholar]
- Khatoon, B.; Sharma, V.R.; Yadav, H.K. Phenotypic diversity and trait association in cluster bean (Cyamopsis tetragonoloba). Vegetos 2023, 37, 329–340. [Google Scholar] [CrossRef]
- Rana, J.C.; Sharma, T.R.; Tyagi, R.K.; Chahota, R.K.; Gautam, N.K.; Singh, M.; Sharma, P.N.; Ojha, S.N. Characterisation of 4274 accessions of common bean (Phaseolus vulgaris L.) germplasm conserved in the Indian gene bank for phenological, morphological and agricultural traits. Euphytica 2015, 205, 441–457. [Google Scholar] [CrossRef]
- Gerrano, A.S.; Van Rensburg, W.S.J.; Kutu, F.R. Agronomic evaluation and identification of potential cowpea (Vigna unguiculata L. Walp) genotypes in South Africa. Acta Agric. Scand. Sect. B—Soil Plant Sci. 2019, 69, 295–303. [Google Scholar] [CrossRef]
- Nyirenda Yohane, E.; Shimelis, H.; Laing, M.; Mathew, I.; Shayanowako, A. Phenotypic divergence analysis in pigeonpea [Cajanus cajan (L.) Millspaugh] germplasm accessions. Agronomy 2020, 10, 1682. [Google Scholar] [CrossRef]
- Ullah, A.; Akram, Z.; Malik, S.I.; Khan, K.S.U. Assessment of phenotypic and molecular diversity in soybean [Glycine max (L.) Merr.] germplasm using morpho-biochemical attributes and SSR markers. Genet. Resour. Crop Evol. 2021, 68, 2827–2847. [Google Scholar] [CrossRef]
- Yimram, T.; Somta, P.; Srinives, P. Genetic variation in cultivated mungbean germplasm and its implication in breeding for high yield. Field Crops Res. 2009, 112, 260–266. [Google Scholar] [CrossRef]
- Adu, M.O.; Asare, P.A.; Yawson, D.O.; Dzidzienyo, D.K.; Nyadanu, D.; Asare-Bediako, E.; Afutu, E.; Tachie-Menson, J.W.; Amoah, M.N. Identifying key contributing root system traits to genetic diversity in field-grown cowpea (Vigna unguiculata L. Walp.) genotypes. Field Crops Res. 2019, 232, 106–118. [Google Scholar] [CrossRef]
- Kwak, M.; Gepts, P. Structure of genetic diversity in the two major gene pools of common bean (Phaseolus vulgaris L., Fabaceae). Theor. Appl. Genet. 2009, 118, 979–992. [Google Scholar] [CrossRef] [PubMed]
- Saleem, M.A.; Naidu, G.K.; Nadaf, H.L.; Tippannavar, P.S. Genetic diversity in groundnut (Arachis hypogaea L.) based on reaction to biotic stresses and productivity parameters. Legume Res. 2021, 44, 131–137. [Google Scholar] [CrossRef]
- Luo, X.; Liu, Z. Plant development: Unveiling cytokinin’s role in the end of flowering. Curr. Biol. 2022, 32, R168–R170. [Google Scholar] [CrossRef]


Disclaimer/Publisher’s Note: The statements, opinions and data contained in all publications are solely those of the individual author(s) and contributor(s) and not of MDPI and/or the editor(s). MDPI and/or the editor(s) disclaim responsibility for any injury to people or property resulting from any ideas, methods, instructions or products referred to in the content. |
© 2024 by the authors. Licensee MDPI, Basel, Switzerland. This article is an open access article distributed under the terms and conditions of the Creative Commons Attribution (CC BY) license (https://creativecommons.org/licenses/by/4.0/).