Abstract
Weeds interfere with agricultural production activities worldwide and have a very serious impact on agriculture and animal husbandry. Identifying a safe and reliable weed control strategy may increase the yield and production net income, and improve crop quality. Licorice is one of the most popular traditional Chinese herbal medicines and has been used for over 2000 years in China. Liquiritin and glycyrrhizic acid are crucial active ingredients. A field experiment was carried out to explore the effects of weeding frequency on the yield and quality of Glycyrrhiza uralensis Fisch in an arid and semi-arid area of northwest China. The experiment consisted of seven treatments: (1) no weeding, marked as WF0, and (2)–(7) artificial weeding using a hoe once every 1, 2, 4, 6, 8 and 10 weeks after emergence, marked as WF1, WF2, WF4, WF6, WF8 and WF10, respectively. We found that a higher weeding frequency resulted in greater plant height, photosynthesis, yield and quality. The highest yield was obtained when the WF1 treatment was applied, while the cost of weeding was high among all treatments. The concentrations of liquiritin and glycyrrhizic acid were increased by 53.24% and 36.57%, with the highest nitrogen metabolism enzymatic activities and quality observed when the WF4 treatment was applied. The WF4 treatment resulted in the largest increase in the net income among all treatments in both growing seasons, with respective increases of up to 71.39% and 78.81%. These findings suggest that weeding once every four weeks could be an effective and sustainable measure to control weeds in an arid and semi-arid area.
1. Introduction
Globally, weeds interfere with agricultural production activities and have a very serious impact on agriculture and animal husbandry [1,2]. Weeds and crops form a complex system in the ecosystem, competing directly for resources such as water, nutrients, light and space, which can affect the growth, yield and quality of crops; this can ultimately lead to substantial economic losses [3]. Weeds have been found to cause a 45% yield loss; however, this percentage may rise to 94–96% in rice, 50% in pulses, 72% in sugarcane and nearly 90% in almost all vegetables when there is an increase in weed interference [4]. In traditional agriculture, farmers had a proactive approach to weed removal, clearing them as soon as they were noticed [5]. Nonetheless, hand weeding is time-consuming, labor-intensive and tedious, leading to higher production costs [6]. Although chemical weed control using herbicides has traditionally been the most popular and effective method [7,8], it affects the quality and safety of crops and pollutes the environment. Moreover, the evolution of herbicide resistance has also become a major problem, further complicating the process of weed control [9]. All these factors can significantly impact the sustainable development of farmland ecosystems. Therefore, identifying a safe and reliable weed control strategy that can not only increase yield and the production net income, but also improve crop quality, is of great significance.
The proactive management of weed diversity may increase crop productivity [10]. Most studies have shown that weeds impact crop yield, and that the yield is sub-correlated with the intensity of weed disturbance; as such, constantly clearing all weeds during the entire growth period is the best approach to increasing output [11,12]. A previous study found that corn fields without weed interference had the highest grain yield [13]. Continuous weeding has also been found to significantly reduce the weed density and quantity of weed dry matter and increases the efficacy of weed control, ultimately improving plant growth, yield attributes and the overall yield of groundnut [14]. Similar results have been reported in wheat [8], rice [15] and other crops [16]. Some studies have also suggested that weeds not only interfere with crop yield but also affect quality. In one study, the yield of a paddy field without weed interference was about 50% higher than that of a weed field and rice processing, and the appearance quality and seed nitrogen accumulation were also the best [17]. Other studies have shown that although weed interference affects the growth and yield of crops, they have no significant effect on the quality. Notably, an increase in the duration of weed interference has also been found to negatively affect the crop height, head diameter and 1000-kernel weight of plants, but not the seed oil content [18]. In one study, three rounds of artificial weeding in the early stages of a Radix bupleuri field significantly increased the root weight but had little effect on the total amount of saponin A and saponin D [19]. It can be seen that weed control has different effects on the yield and quality of cultivated crops. Photosynthesis [20,21], the activity of anti-stress enzymes [22,23] and nitrogen metabolism during the growing season significantly affect the yield and quality of crops. However, the impact of weeding frequency on these plant indicators has not been fully evaluated.
Licorice (Glycyrrhiza uralensis Fisch) is a perennial herb of the genus Glycyrrhiza in the family Leguminosae. It is one of the most popular traditional Chinese herbal medicines and has been used for over 2000 years in China. Its dried roots and rhizomes are widely used in Eastern and Western countries as medicine. This species contains numerous active ingredients [24,25], including liquiritin (LQ) and glycyrrhizic acid (GA), which are the main medicinal components specified in the Chinese Pharmacopoeia [26]. The artificial cultivation of wild licorice began in the 1980s in China and has become a leading industry in recent years [27]. Weed control is one of the main technical obstacles restricting the large-scale cultivation of licorice [28]. In the local area, farmers often use herbicides combined with manual weeding to weed, resulting in serious pesticide residues [29,30].
In the past 40 years, licorice has been comprehensively studied in terms of the plant’s systematic classification [31], chemical composition [32], pharmacological efficacy [33,34], applicable separation and extraction methods [35,36], metabonomics [37,38], clinical application [39], etc. Most studies on the artificial cultivation of licorice have largely focused on seed treatment [40,41], the best sowing and harvesting date [42,43], water stress [38,44], fertilization [45] and pest control [46], with only a handful of studies being conducted on weed control and herbicides. Herbicides pose significant challenges to the safe medical use of licorice. The determination of weed interference and the duration of competition can help growers to improve the cost effectiveness and efficacy of their weed management program.
We hypothesized that (i) different weeding frequencies might affect the growth, photosynthetic physiology and enzyme activity of licorice, and then change its yield and quality, and that (ii) the effects of different weeding frequencies on the yield and quality might have a critical value, which is conducive to improving the economic benefits of its ecological planting. The present study aimed to (i) identify the differential efficacy of weeding frequencies on yield and quality and (ii) determine the optimal weeding frequency and the cost of ecological planting.
2. Materials and Methods
2.1. Study Site
The field experiment was conducted in 2021 and 2022 at the Tianjizhang village of licorice cultivation, Yanchi county, Ningxia, in northwest China (Long. 107°16′48″ E, Lat. 37°48′0″ N, ca. 1427 m above sea level). The region is characterized by a typical continental monsoon climate with a mean annual temperature of 7.7 °C, a total annual precipitation of 290 mm and an annual evaporation of 2132 mm. The soil type mainly comprises the aeolian sandy soil sierozem, which is barren and vulnerable to wind erosion. The region is a typical desert steppe area, dominated by xerophytes and mesoxerophytes.
2.2. Experimental Set-Up
One-year-old transplanted seedlings of licorice were planted in early May at a depth of approximately 15 cm with a 30 × 12 cm spacing row and harvested in mid-October in each year (2021–2022). The planting density was about 27 plants m−2. Each plot had an area of 3 × 5 m2. Using the method of flood irrigation, irrigation was carried out with 1500 m3/ha of water in late April, late May and late July, respectively. A slow-release compound fertilizer with a N/P2O5/K2O ratio of 20:9:11 was applied at a rate of 750 kg/ha and used as a base fertilizer during mechanical plowing in late March. The fertilization depth was approximately 30 cm.
The weed control test was initiated after the emergence of licorice. The experiment consisted of seven treatments and was carried out using a randomized complete block (RCB) design with three replications. The treatments were (1) no weeding, marked as WF0, and (2)–(7) artificial weeding using a hoe once every 1, 2, 4, 6, 8 and 10 weeks after emergence; these treatments were marked as WF1, WF2, WF4, WF6, WF8 and WF10, respectively. All plots, whether weeded or not weeded, received the same agronomic management practice.
2.3. Weeds Investigation
Three quadrants (1 × 1 m2) were randomly selected from the three plots without weeding. Weeds were removed from the ground and kept in ovens at 80 °C until a constant weight was achieved. Then, the aboveground biomass accumulation (g/m2) was calculated. The weed species and their density were also recorded.
2.4. Sampling and Measurements
2.4.1. Growth Index
In mid-September of each year, 30 healthy plants with uniform growth were chosen in order to measure the plant height (vertical height through the center of the crown) and crown size (length and width through the center of the crown) using steel tape (accuracy of 0.1 cm) in different treatment plots. The ground diameter was measured using a vernier caliper (accuracy of 0.01 mm).
2.4.2. Photosynthetic Parameters
Healthy leaves were selected from 2/3 of the plant above the ground on a sunny day at the end of August of each year in order to measure the net photosynthetic rate (Pn, μmol/m2·s), transpiration rate (Tr, mmol/m2·s), stomatal conductance (G, mmol/m2·s) and intercellular carbon dioxide (CO2) concentration (Ci, μmol/mol) using a LI-COR 6800 portable photosynthesis system (LI-COR Biosciences, Lincoln, NE, USA). The reference (CO2) was set to 400 μmol/mol, the light intensity was set to 1000 μmol/m2·s, the temperature was 24 °C and the water vapor pressure difference (VPD) was 1.0 kPa. Three leaves were selected for each treatment and used as three replicates. The measurement time was between 9:00 and 11:00 a.m., and the leaves were tiled to cover the whole leaf chamber (6 cm2). The chlorophyll soil plant analysis development (SPAD) value was measured using a portable chlorophyll SPAD meter (SPAD-502 Plus, Konica Minolta, Osaka, Japan).
2.4.3. Antioxidant and Nitrogen Metabolism Enzymes
Healthy leaves were collected at the end of August every year and stored in a dry ice sampling box. The leaves were taken back to the laboratory and placed in a refrigerator at −80 °C for determination. The contents of antioxidant enzymes, including superoxide dismutase (SOD), peroxidase (POD) and catalase (CAT), and nitrogen metabolism enzymes, including glutamine synthetase (Gs), nitrate reductase (NR), nitrite reductase (NiR) and glutamate synthase (NG), were determined using spectrophotometry (BioPhotometer, Eppendorf, Hamburg, Germany), according to the instructions of the corresponding kits (provided by Suzhou Michy Biomedical Technology Co., Ltd., Suzhou, China).
2.4.4. Yield and Effective Components
All licorice roots in each plot (3 × 5 m2) were dug out in mid-October each year and placed in a ventilated, dry, shady environment to dry naturally. The dry weight of the roots was measured, and the yield per hectare was calculated. The content of LQ and GA was determined using high-performance liquid chromatography (HPLC) according to the 2020 edition of Chinese Pharmacopoeia. The determination method was as follows:
HPLC analysis was performed with Agilent series 1200 equipment consisting of a G1311A pump, a G1315B-Diode array detector and a G1316A column compartment. Samples were separated using an Agilent TC-C18 column (250 mm × 4.6 mm, 5 µm particle). The acetonitrile and formic acid used during sample preparation were both HPLC–MS grade (Thermo Fisher Scientific, Shanghai, China). LQ (lot: Z13J11X108109), and GA (lot: Y02J11L113432) were purchased from Shanghai Yuanye Co., Ltd. (Shanghai, China), with a purity of more than 98%.
A total of 0.2 g of licorice powder was placed into a 100 mL conical flask with a stopper, to which 50 mL of 70% ethanol was added; this was followed by precise weighing. After sonication for 30 min, the weight loss was compensated with 70% ethanol. To prepare the control solution, reference standards of LQ and GA were added to methanol to create a mixed control solution (0.113 mg/mL and 0.267 mg/mL, respectively). All solutions were filtered through a 0.22 μm filter membrane before being injected into the HPLC system.
Mobile phase: acetonitrile (A)—0.05% phosphoric acid water (B); gradient elution: 0–9 min, 50–48% A; 9–19 min, 48–35% A; 19–33 min, 35–5%A; 33–36 min, 5–50% A. The detection wavelength was set to 237 nm for LQ and GA. The flow rate was 1.0 mL/min, the column temperature was 30 °C, and the injection volume was 10 μL. Each sample was assessed with 3 replicates.
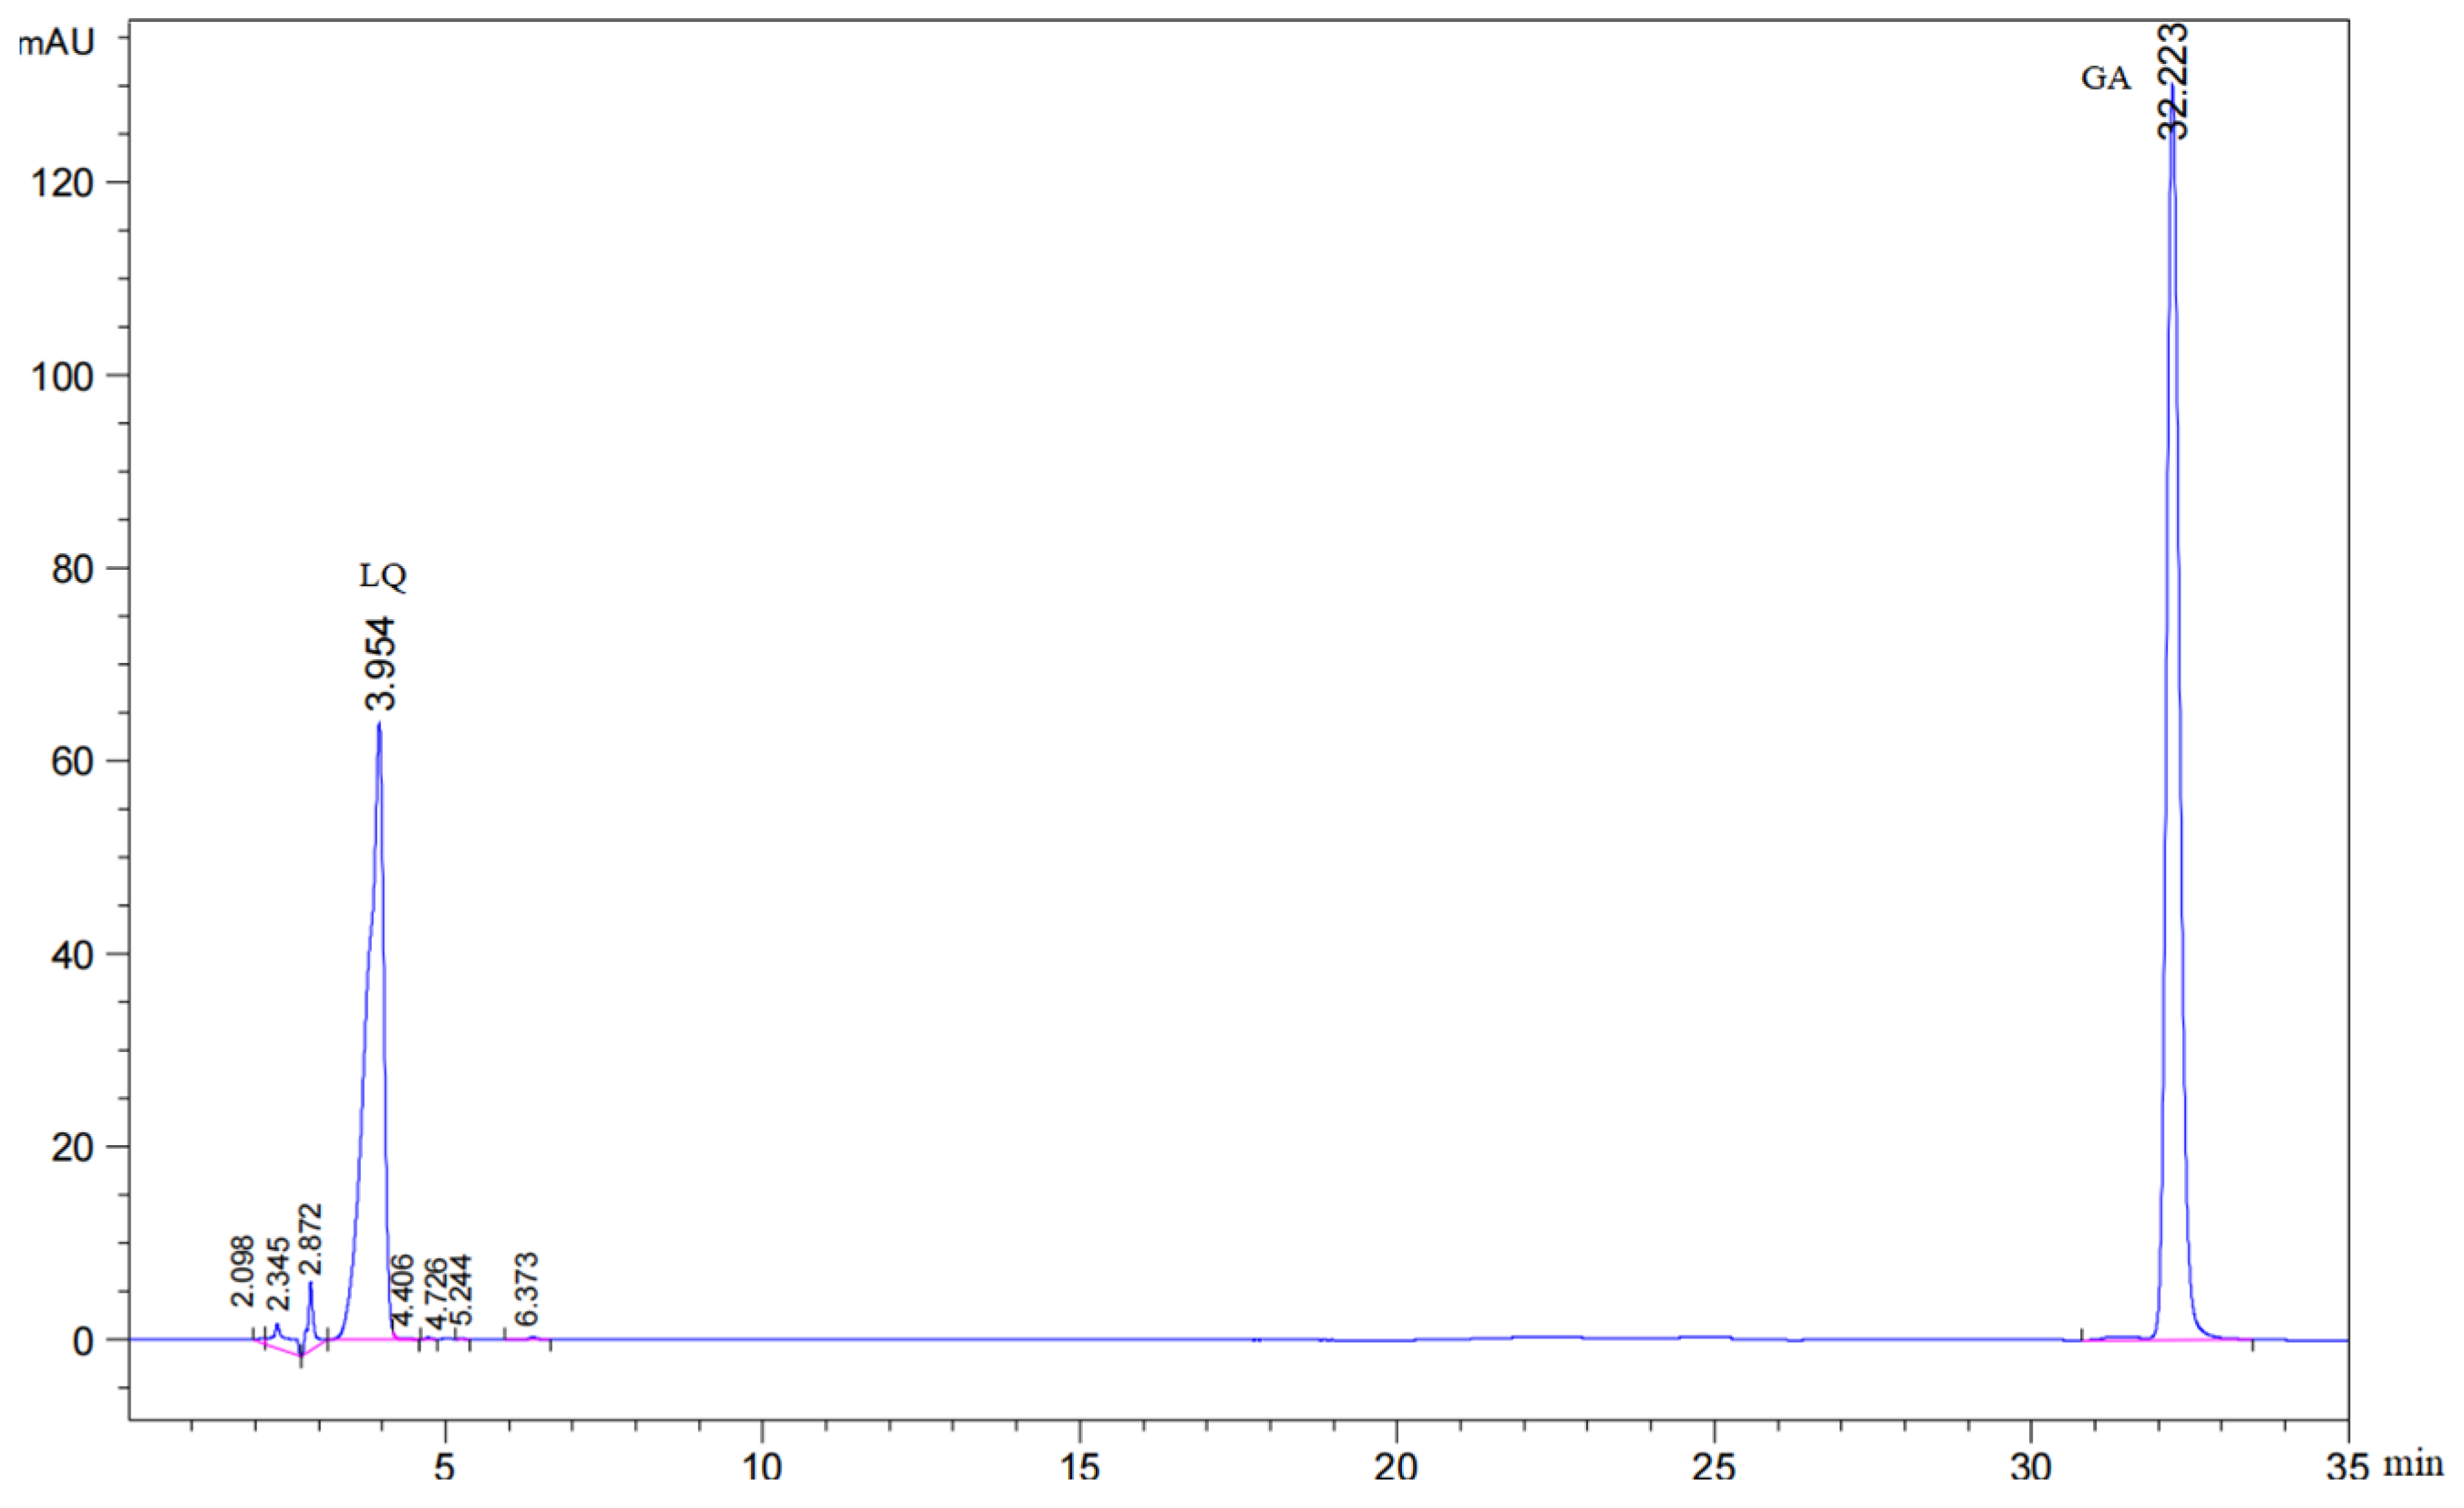
The contents of LQ and GA were measured according to the dry weight. The Chinese Pharmacopoeia stipulates that the content of LQ should not be less than 0.50% and that the content of GA should not be less than 2.00%. The chromatograms of LQ and GA standard samples are shown in Figure 1.
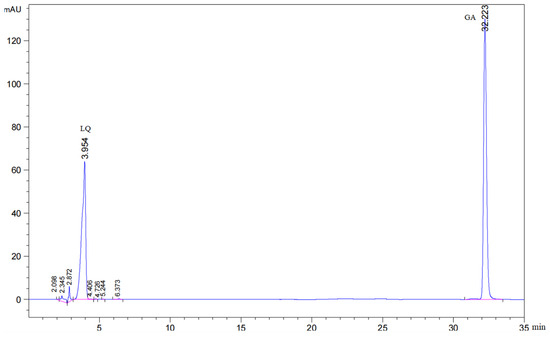
Figure 1.
The chromatogram of LQ and GA standard samples. The pink section represents where the peak appears.
2.4.5. Economic Benefit
The economic benefit was calculated according to the 2-year average market price of licorice root dry weight and expressed in CNY/ha. The formula is shown below:
Net income = Gross income − Planting costs (seedling, land rent and other inputs, excluding weeding costs) − Weeding costs
2.5. Data Analysis
Analysis of variance (ANOVA) was estimated using Statistical Analysis System software (SAS 8.1), and the means were compared following a protected least significant difference (LSD) procedure at a 5% level of probability using the Duncan Multiple Range Test (DMRT). The principal component analysis (PCA) method was used to reveal the differences of the seven treatments, and the combined correlation analysis method was used to reveal the correlation between yield, effective components and other indicators. Data from the two seasons were examined independently. The box plot, correlation analysis graph and the PCA graph were created using Metware Cloud, which is a free online platform for data analysis (https://cloud.metware.cn, accessed on 8 December 2023).
3. Results
3.1. Weeds Investigation
Nine species of weeds were found in the non-weeding plot; these belonged to four families and seven genera (Table 1). The weeds with a higher density and aboveground biomass were Setaria viridis and Chenopodium album, with a density of 27 m−2 and 7 m−2, respectively, and a biomass of 62.12 g·m−2 and 236.71 g·m−2, respectively. The weed density in the plot without weeding was 46 m−2, or about 465,000 ha−1.

Table 1.
Weed investigation of non-weeding plots.
3.2. Growth of Licorice
Different weeding frequencies had different effects on growth in both growing seasons (Table 2). Generally, the growth index value showed a downward trend with a decrease in the weeding frequency. The plant height, ground diameter and crown width of licorice treated with WF1 were the highest, with values of 51.17 cm, 5.51 mm and 963.23 cm2, respectively, in 2021; these were 31.54, 31.19% and 94.55% higher than those obtained when the WF0 treatment was applied (lowest values), and the difference was significant (p < 0.05). The values in 2022 were 42.67 cm, 5.13 mm and 747.52 cm2, respectively, which were also significantly increased by 81.96, 95.05 and 137.39% compared with the WF0 treatment (lowest values).

Table 2.
Effect of weeding frequencies on the growth ( ± SD).
Meanwhile, no significant difference in the plant height index was found between WF1 and WF2 treatments in 2021 (p > 0.05). Similarly, no significant difference was detected between the WF1 and WF2 or WF4 treatments in 2022 (p > 0.05); however, the difference between WF1 and the other treatments was significant in both growing seasons (p < 0.05). Overall, no significant differences in the plant height, ground diameter and crown width were observed between the WF2 and WF4, WF6 and WF8, WF10 and WF0 treatments (p > 0.05).
3.3. Photosynthetic Parameters
The effects of different weeding frequencies on the photosynthetic parameters were also different in both growing seasons (Table 3). The effects of different treatments on the Pn were WF1 > WF4 > WF2 > WF6 > WF8 > WF10 > WF0 in 2021 and WF1 > WF4 > WF2 > WF8 > WF6 > WF10 > WF0 in 2022. The effects of different treatments on the Tr were WF1 > WF4 > WF2 > WF8 > WF6 > WF10 > WF0 in 2021 and WF1 > WF4 > WF2 > WF6 > WF8 > WF10 > WF0 in 2022.

Table 3.
Effect of weeding frequencies on photosynthetic parameters ( ± SD).
The Pn, Tr, G and SPAD values in the WF1 treatment were the highest within 2 years. Compared with the WF0 treatment (lowest values), these parameters increased by 0.85, 0.47, 1.96 and 0.33 and 0.96, 0.73, 1.50 and 0.39 in 2021 and 2022, respectively; the differences were significant (p < 0.05). However, no significant differences in these parameters were found between the WF2 and WF4 treatments and among the WF6, WF8 and WF10 treatments (p > 0.05).
3.4. Antioxidant Enzyme Activities
Generally, the values regarding the antioxidant enzyme activity observed when different treatments were applied tended to increase in both growing seasons (Table 4). Notably, the WF1 treatment resulted in the lowest SOD, CAT and POD values.

Table 4.
Effect of weeding frequencies on antioxidant enzyme activities ( ± SD).
In 2021, the SOD activity observed when the WF10 and WF0 treatments were applied was significantly higher than that in other treatments (p < 0.05), namely 4.01 and 3.74 times higher than that observed in the WF1 treatment, respectively. The CAT activity in the WF8 treatment and POD activity in the WF10 treatment were significantly higher than those in other treatments (p < 0.05). In 2022, the SOD activity observed when the WF8 treatment was applied was the highest, and the change in the CAT and POD activities was consistent with that observed in 2021.
3.5. Nitrogen Metabolism Enzyme Activities
The activities of nitrogen metabolism enzymes in different treatments tended to increase and then decrease in both growing seasons (Table 5). The values obtained with higher weeding frequencies were significantly higher than those obtained with lower weeding frequencies. The NR, NiR, NG and Gs activities in the WF1, WF2, WF4 and WF6 treatments were higher, while those in the WF8, WF10 and WF0 treatments were lower. The NR, NiR and NG activities in the WF4 treatment were the highest. Compared with the WF0 treatment, these parameters increased by 1.76, 0.67 and 2.19, and 6.93, 0.56 and 2.33 in 2021 and 2022, respectively, and the differences were significant (p < 0.05). The Gs activities were the highest in the WF6 and WF4 treatments in 2021 and 2022, respectively.

Table 5.
Effect of weeding frequencies on nitrogen metabolism enzyme activities ( ± SD).
3.6. Yield and Effective Components
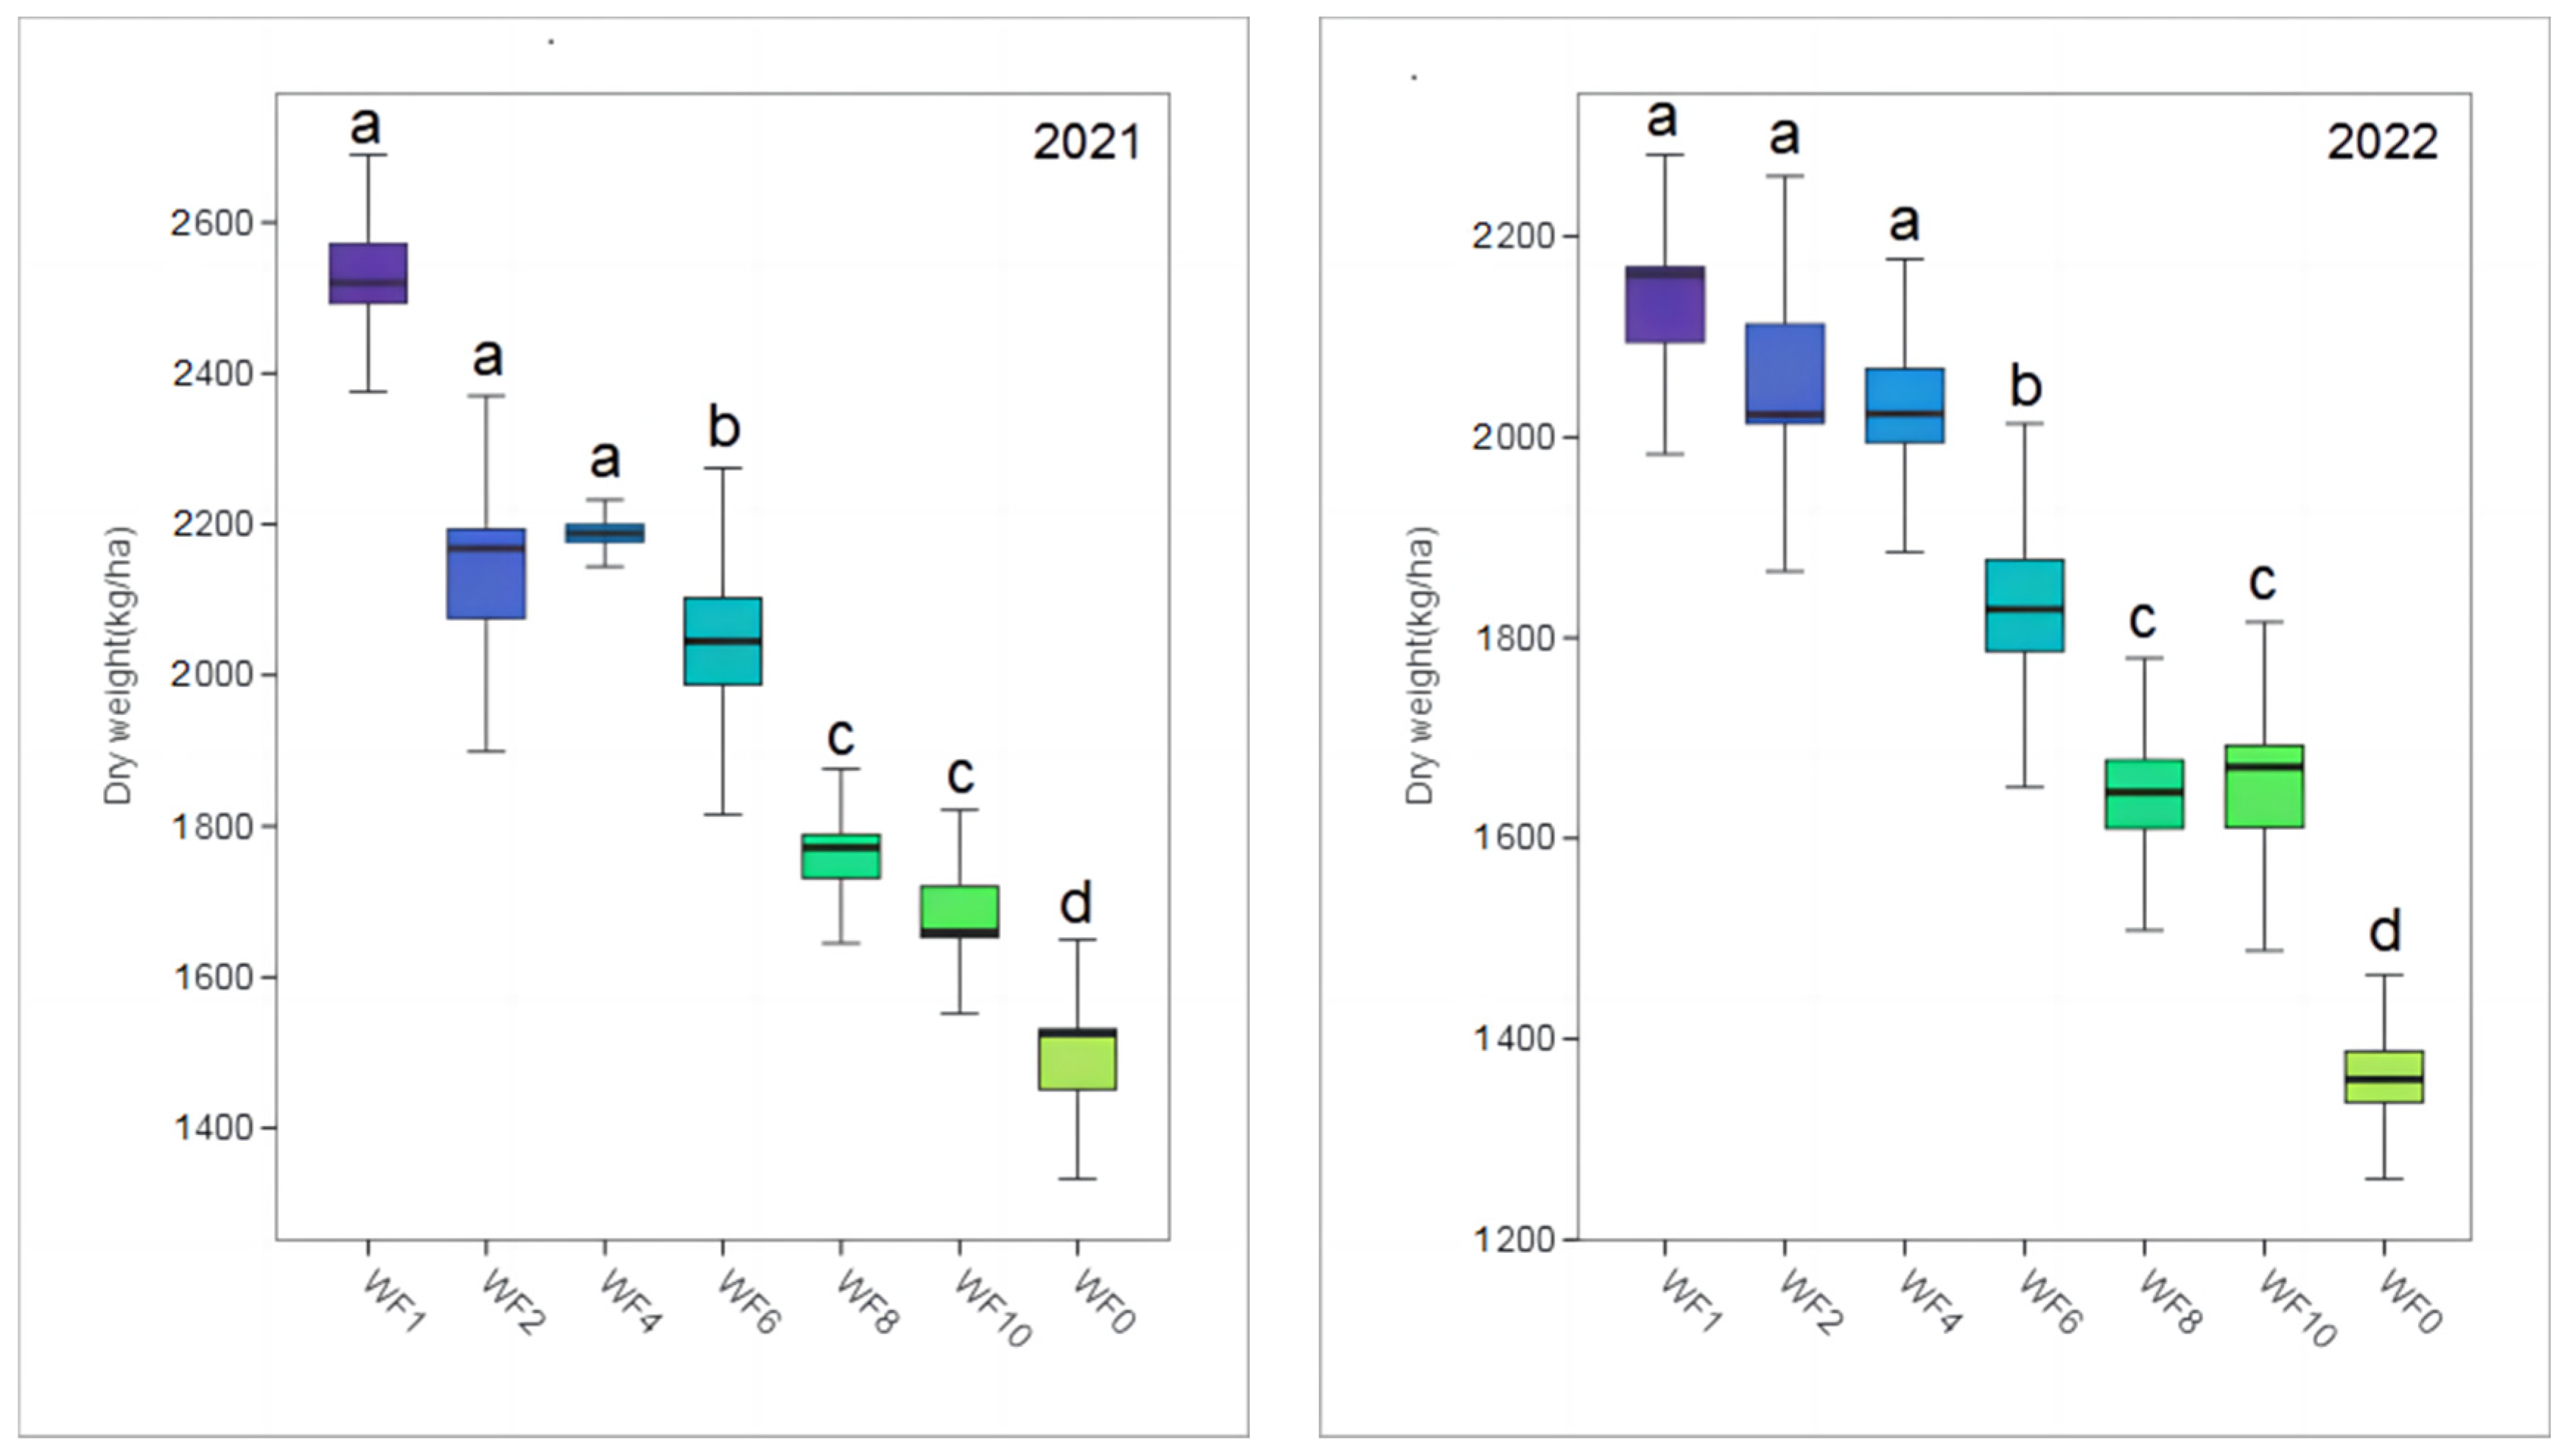
The yield exhibited a downward trend with a decrease in the weeding frequency in both growing seasons (Figure 2). The highest yield was obtained when the WF1 treatment was applied, and the dry weight reached 2536.46 and 2122.20 kg/ha in 2021 and 2022, respectively; this is 71.41% and 55.65% higher than the dry weight observed when weeding was not implemented, respectively, and the difference was significant (p < 0.05). However, no significant differences were observed among the WF1, WF2 and WF3 treatments and between the WF8 and WF10 treatments (p > 0.05).
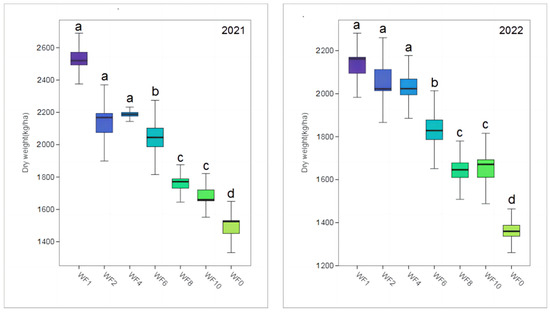
Figure 2.
Effect of weeding frequencies on the yield in 2021 and 2022. For each box plot, it represented the dry weight. The height of the central box (from bottom side of the box to the top one) covered 75% of the total measurements; the horizontal line running through the box showed corresponding median; the vertical lines at the two ends of the box, also known as whiskers, showed measurements which did not differ from the median generally by more than one and a half times the inter-quartile range. Different lowercases indicate the significant (p < 0.05) difference.
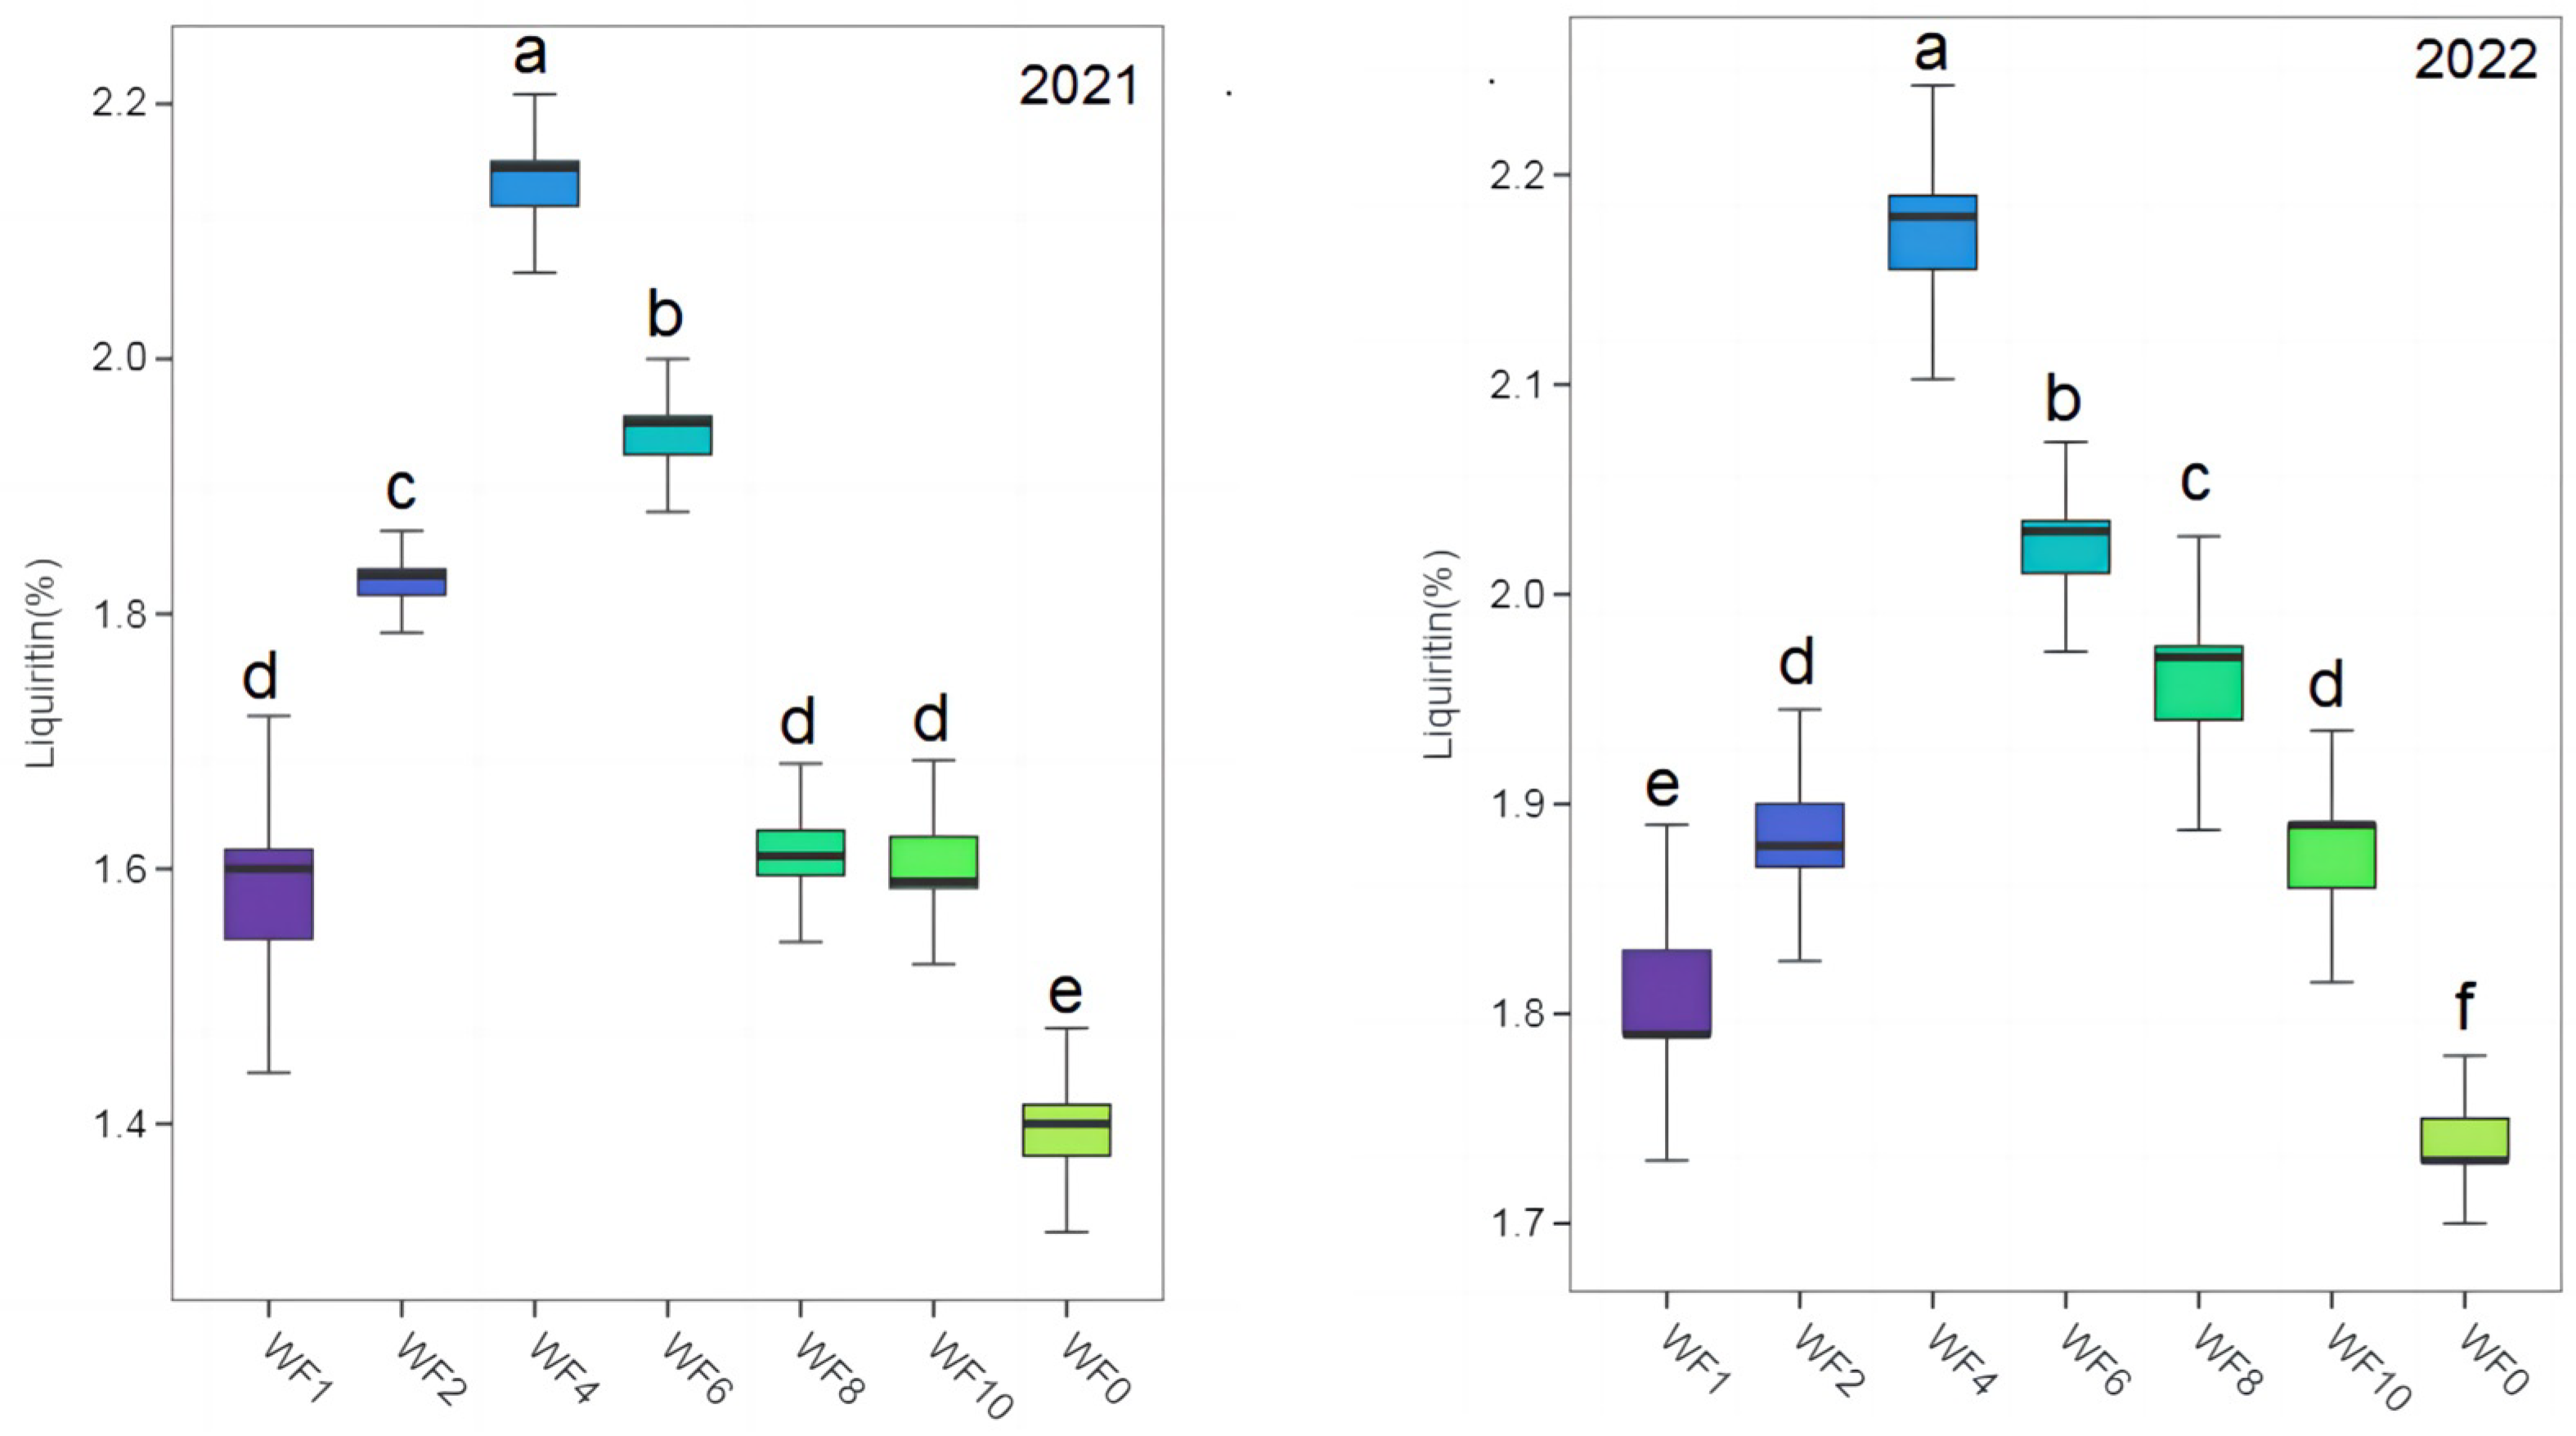
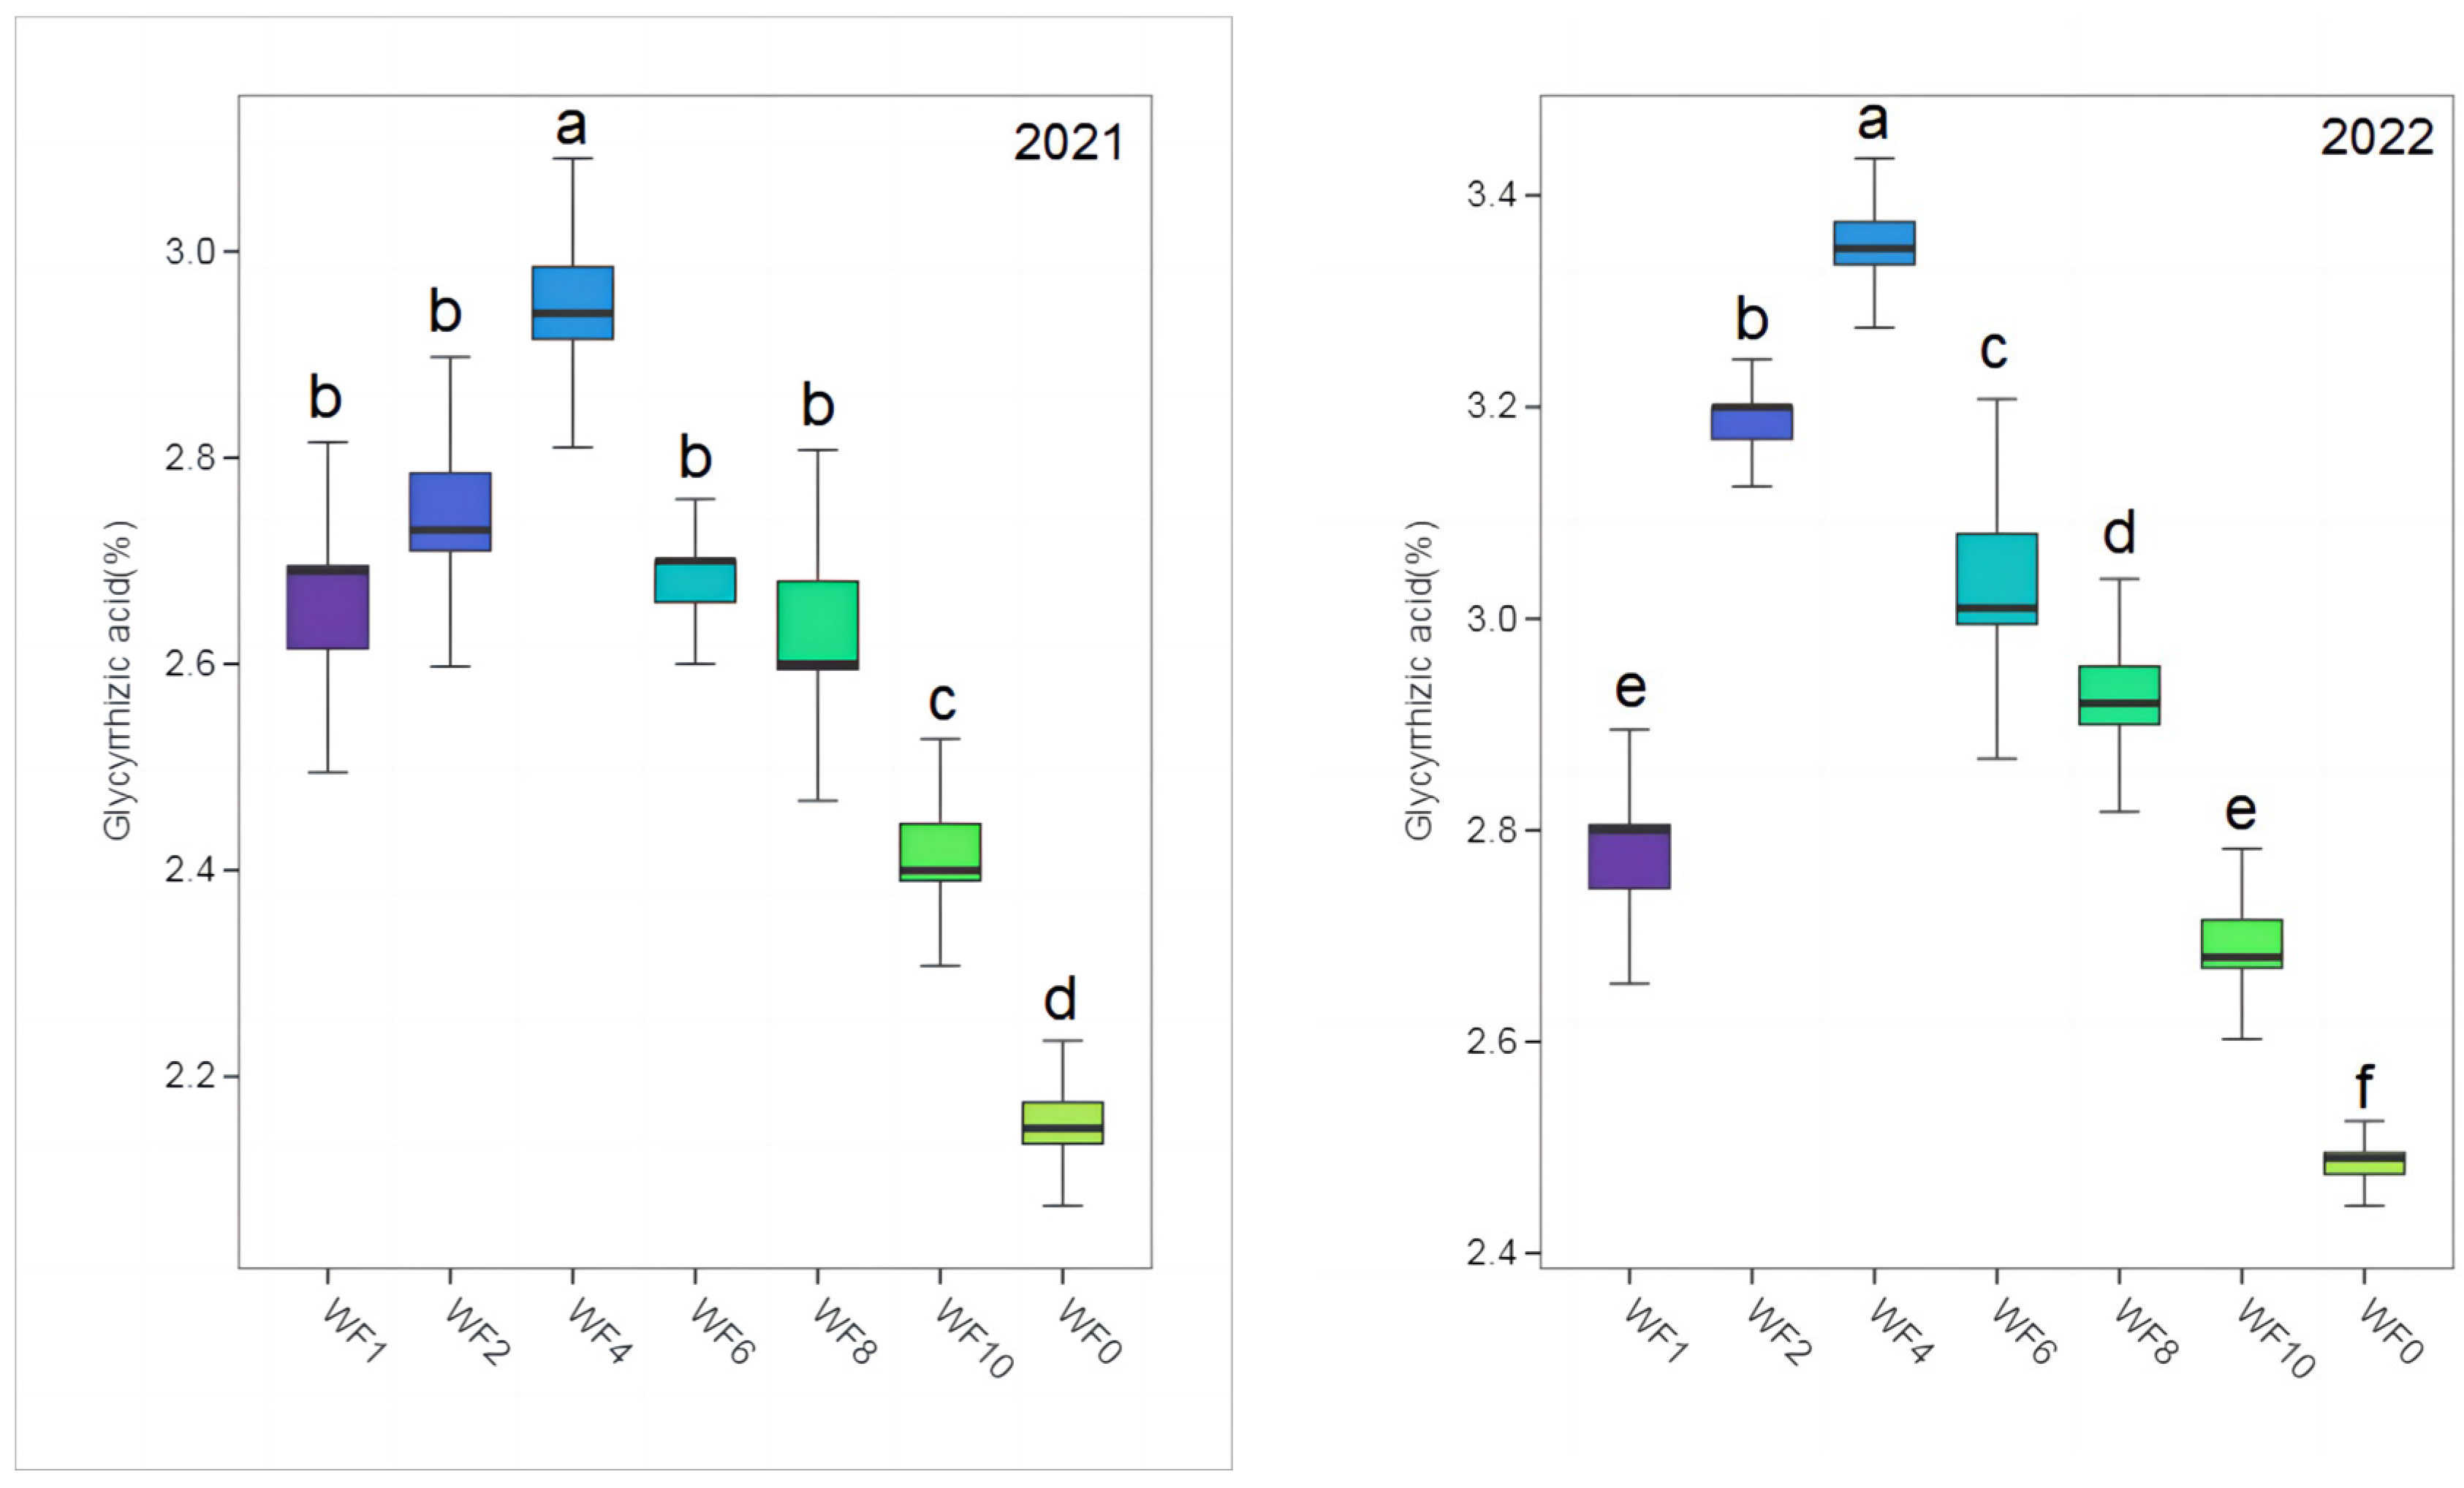
The contents of LQ and GA in different treatments were much higher than those specified in the 2020 edition of the Chinese Pharmacopoeia (LQ: 0.50%, GA: 2.00%) (Figure 3 and Figure 4). The highest LQ and GA were found in the WF4 treatment in both growing seasons, and the lowest values were found in the WF0 treatment. In 2021, LQ content increased by 35.67% and 53.24% in the WF4 treatment compared with the WF1 and WF0 treatments. The GA increased by 11.74% and 36.57% in the WF4 treatment compared with the WF1 and WF0 treatments. In 2022, LQ and GA increased by 19.23% and 21.30% in the WF4 treatment compared with the WF1 treatment, respectively, and by 24.71% and 35.48% compared with the WF0 treatment, respectively.
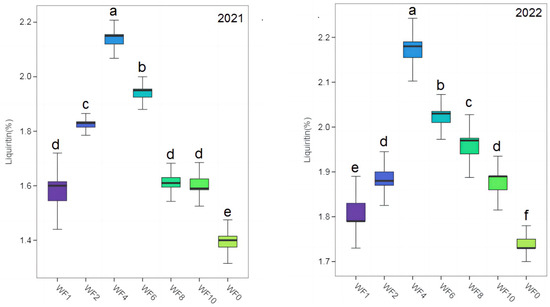
Figure 3.
Effect of weeding frequencies on liquiritin in 2021 and 2022. For each box plot, it represented the liquiritin content. The height of the central box (from bottom side of the box to the top one) covered 75% of the total measurements; the horizontal line running through the box showed corresponding median; the vertical lines at the two ends of the box, also known as whiskers, showed measurements which did not differ from the median generally by more than one and a half times the inter-quartile range. Different lowercases indicate the significant (p < 0.05) difference.
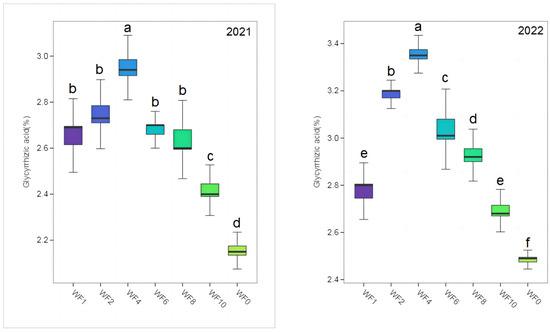
Figure 4.
Effect of weeding frequencies on glycyrrhizic acid in 2021 and 2022. For each box plot, it represented the glycyrrhizic acid content. The height of the central box (from bottom side of the box to the top one) covered 75% of the total measurements; the horizontal line running through the box showed corresponding median; the vertical lines at the two ends of the box, also known as whiskers, showed measurements which did not differ from the median generally by more than one and a half times the inter-quartile range. Different lowercase letters indicate a significant (p < 0.05) difference.
3.7. Economic Benefit
The trend in change in the gross income and dry weight of licorice under different treatments was similar, while the net income changed in a different manner in both growing seasons. The WF4 treatment resulted in the largest increases in the net income among all treatments in both growing seasons, with respective increases of 71.39% and 78.81% compared with the WF0 treatment. The net income observed when the WF6 treatment was applied was the second highest, and that observed for the WF0 treatment was the lowest. The WF4 treatment did not differ significantly from the WF6 treatment (p > 0.05), but it significantly differed from other treatments (p < 0.05) (Table 6).

Table 6.
Effect of weeding frequencies on economic benefit ( ± SD).
3.8. Combined Correlation Analysis of Growth and Physiological Indexes with Yield and Effective Components
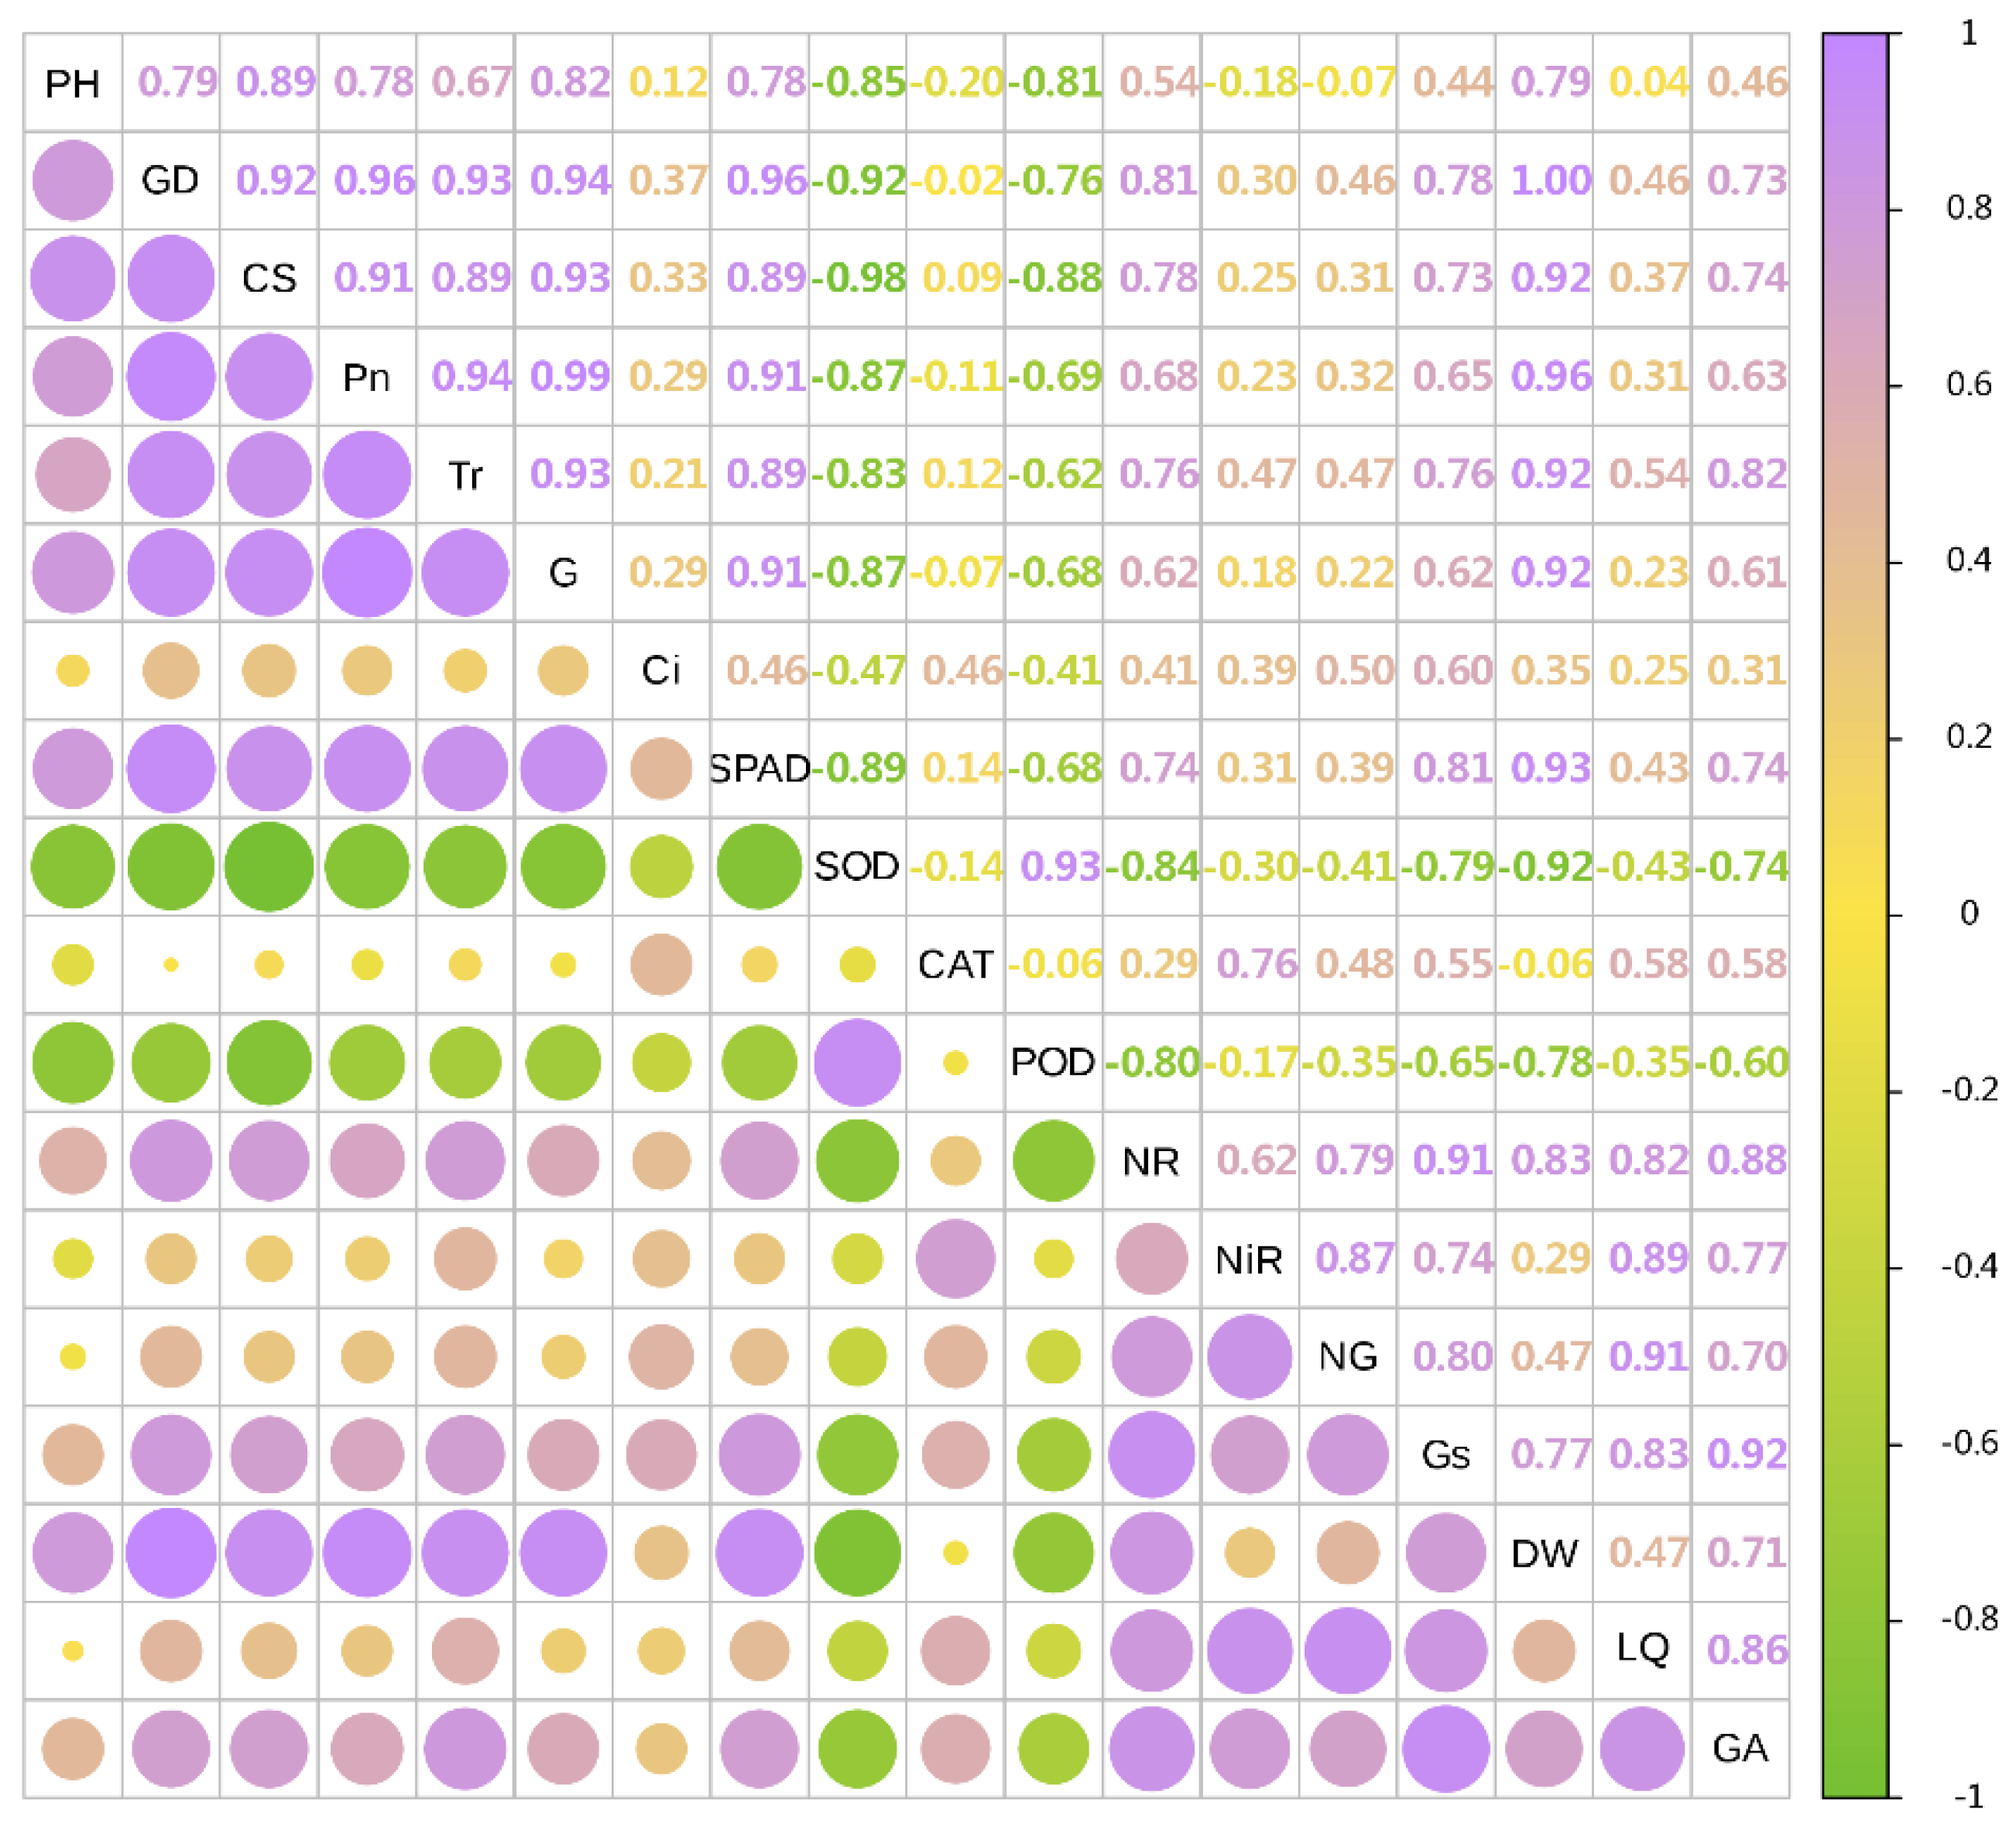
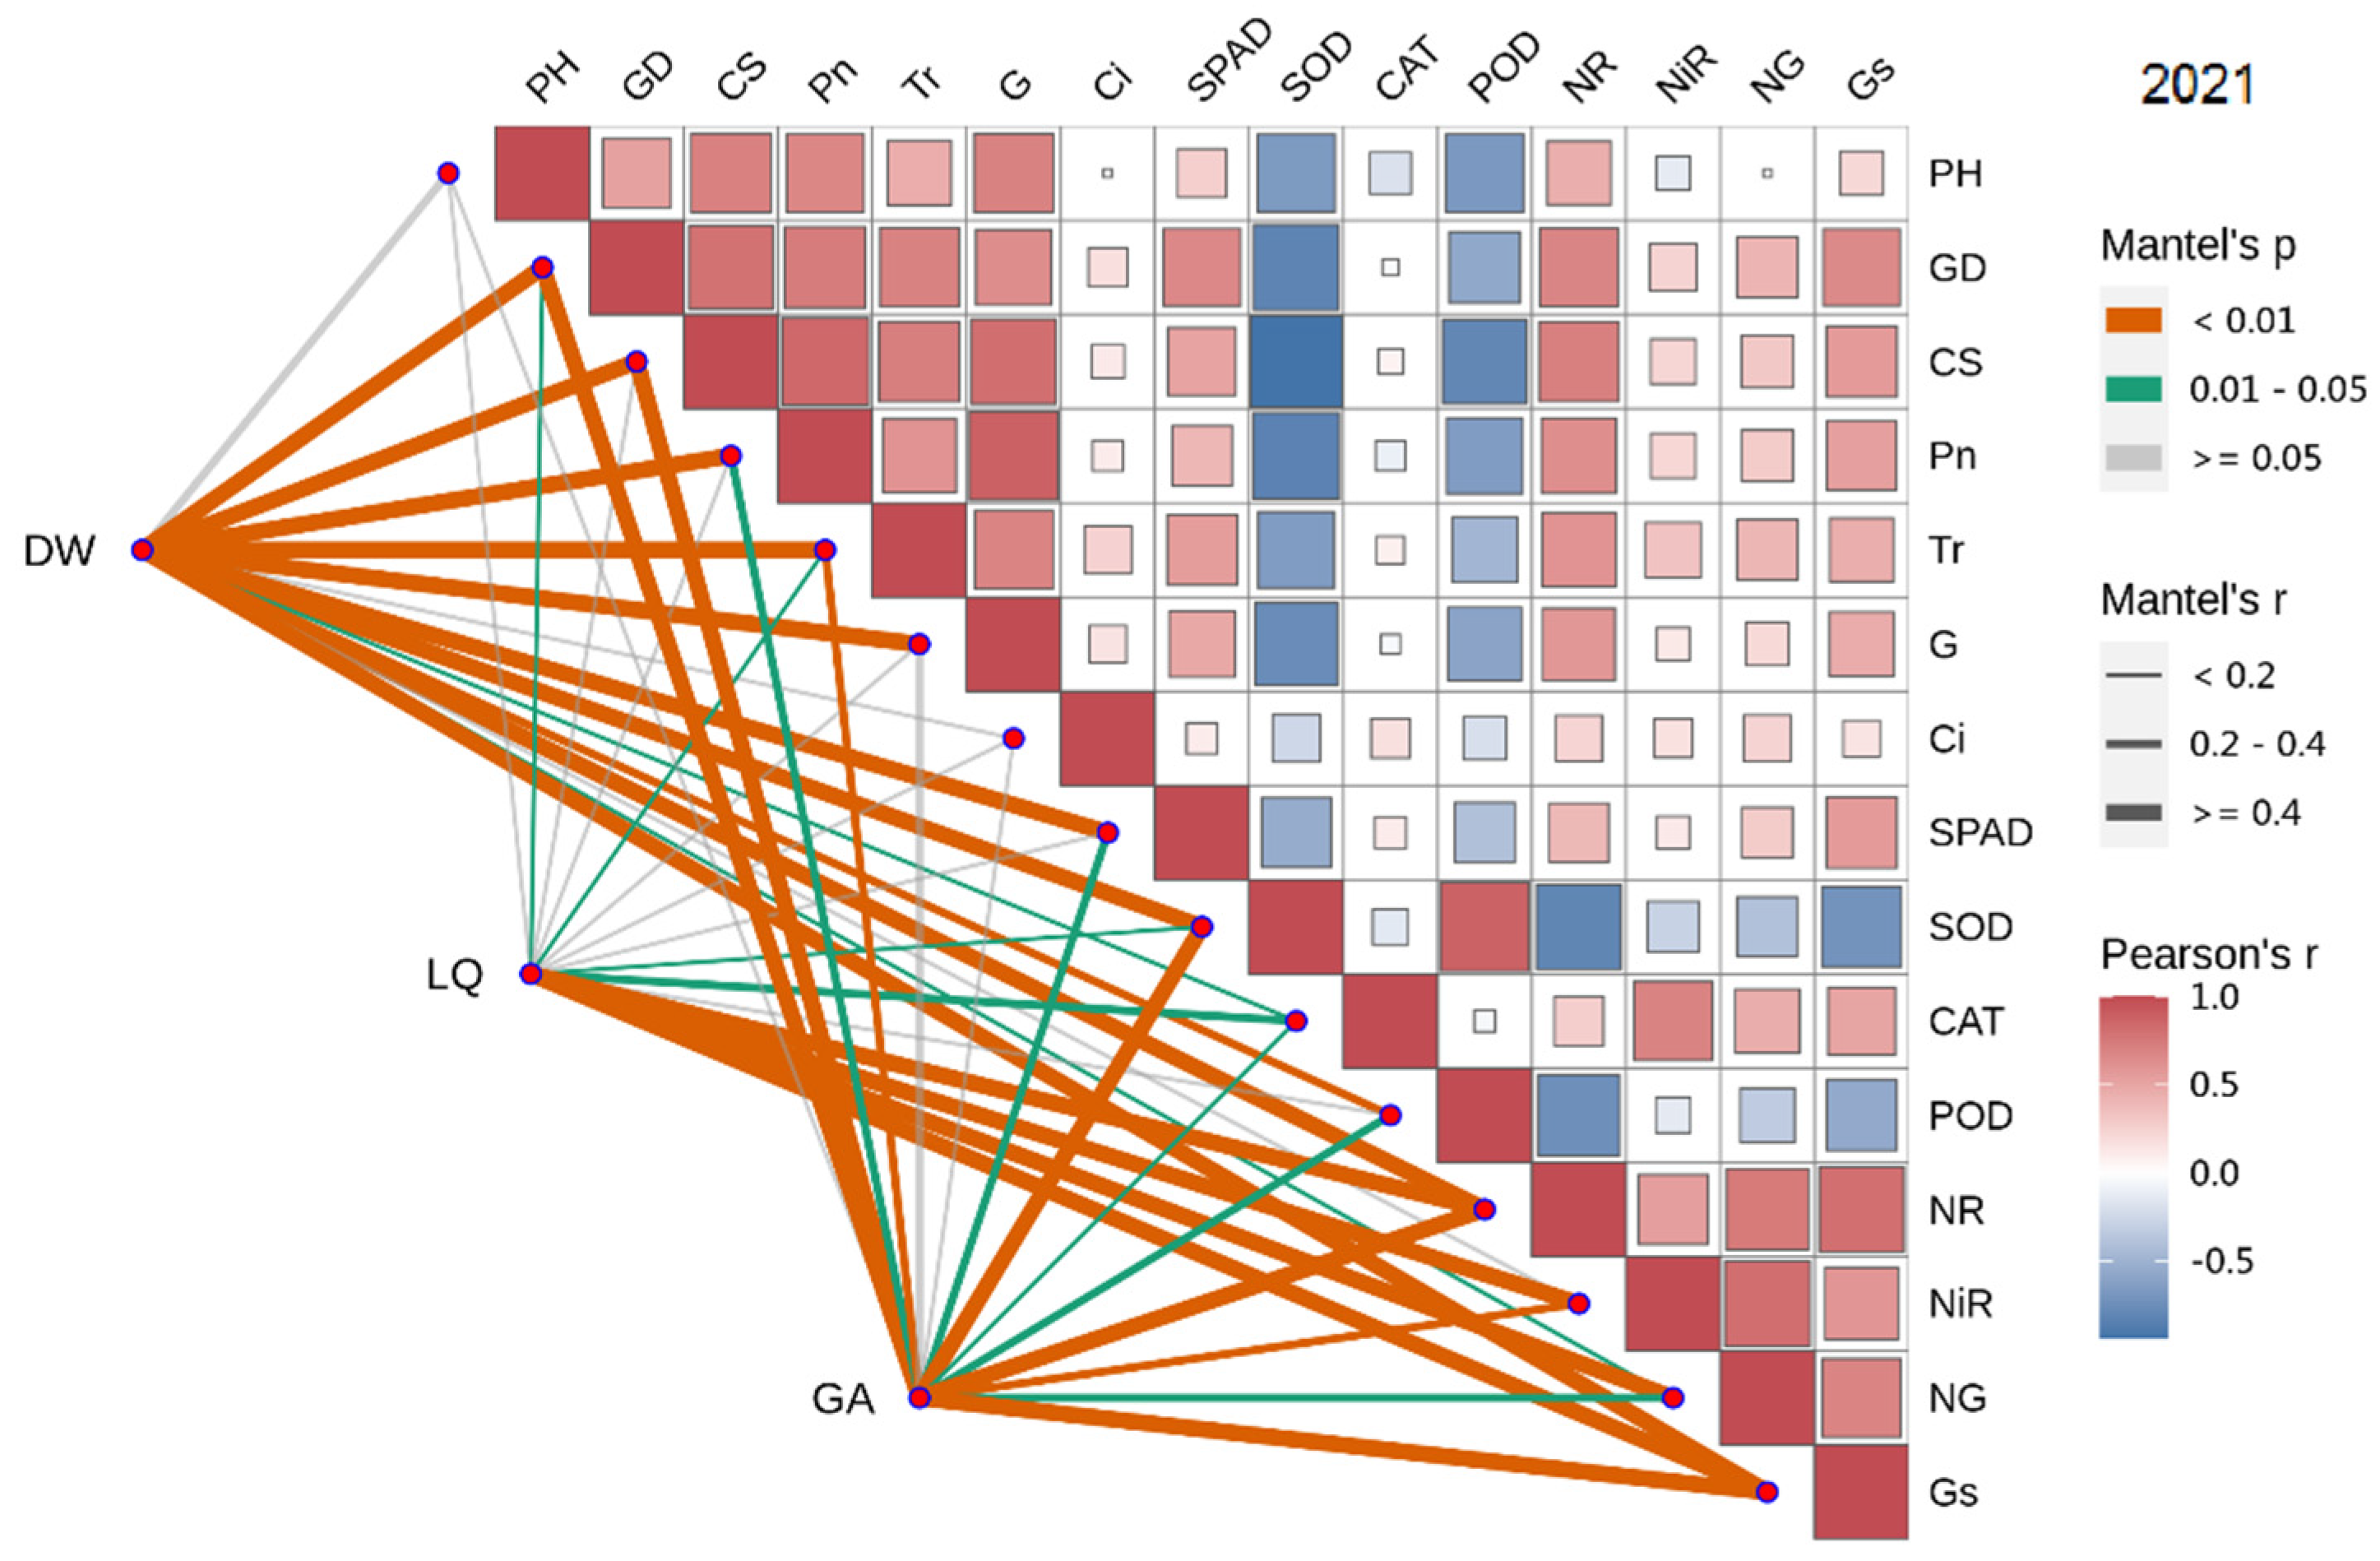
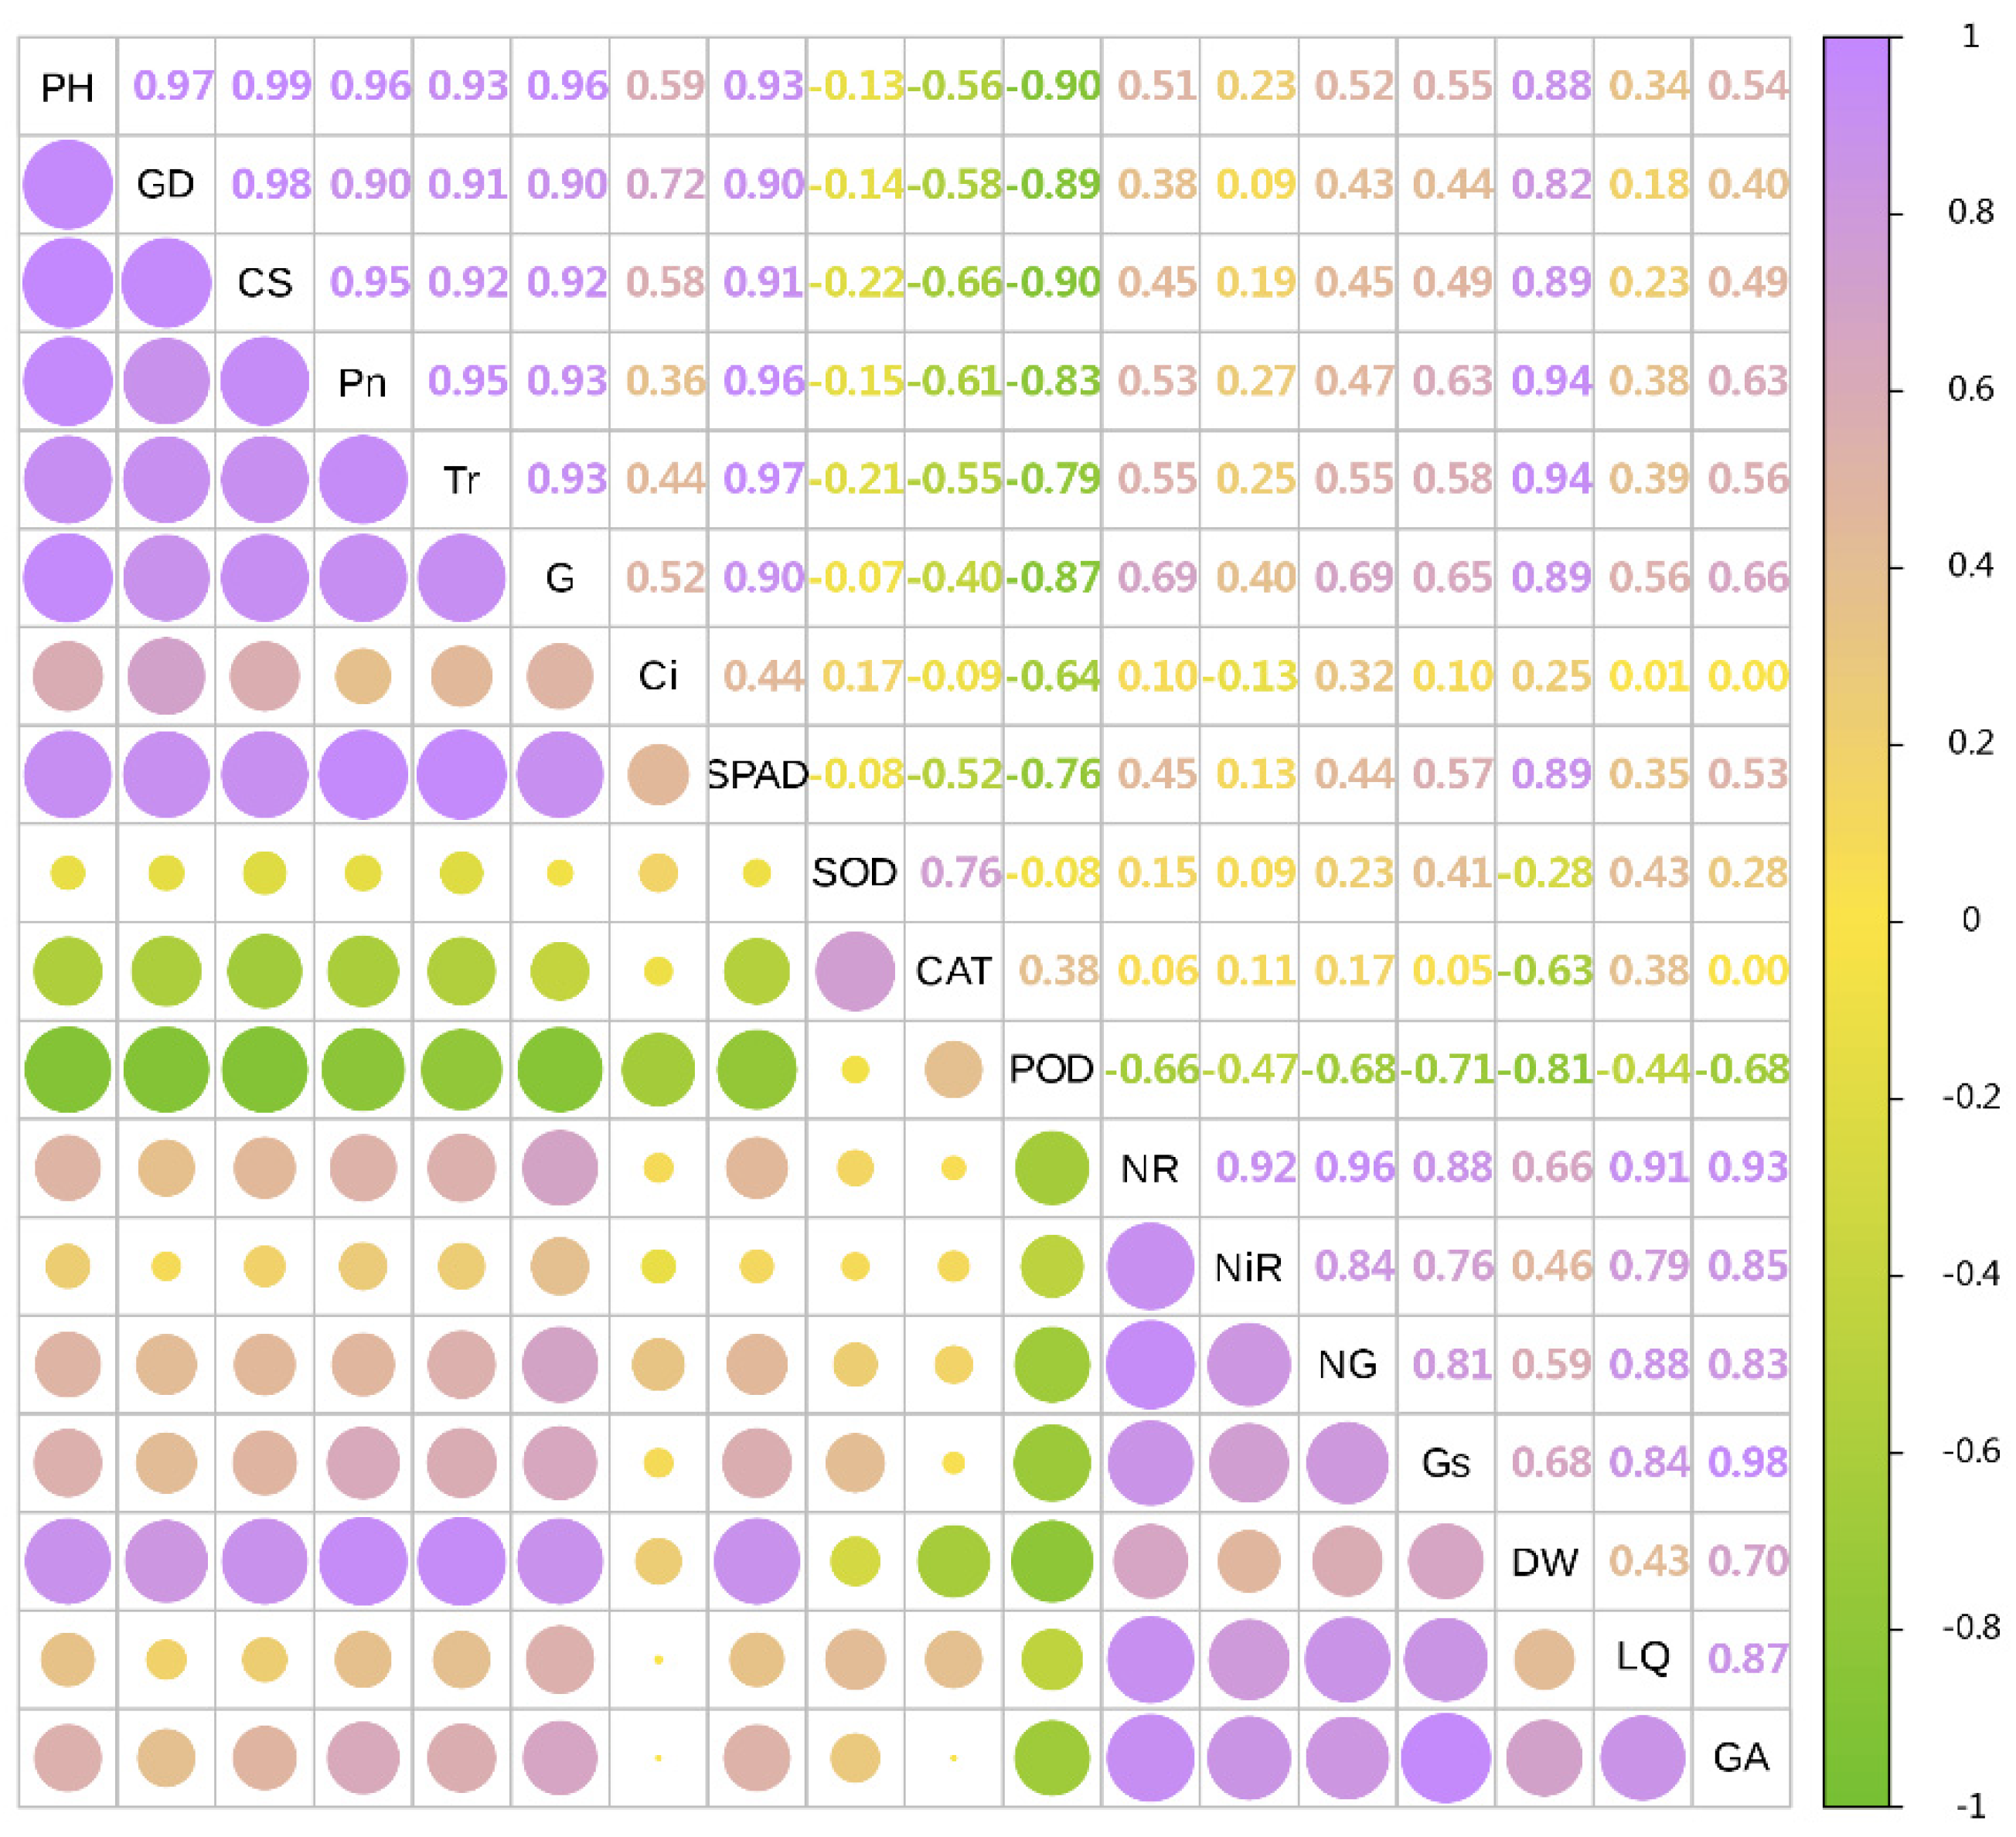
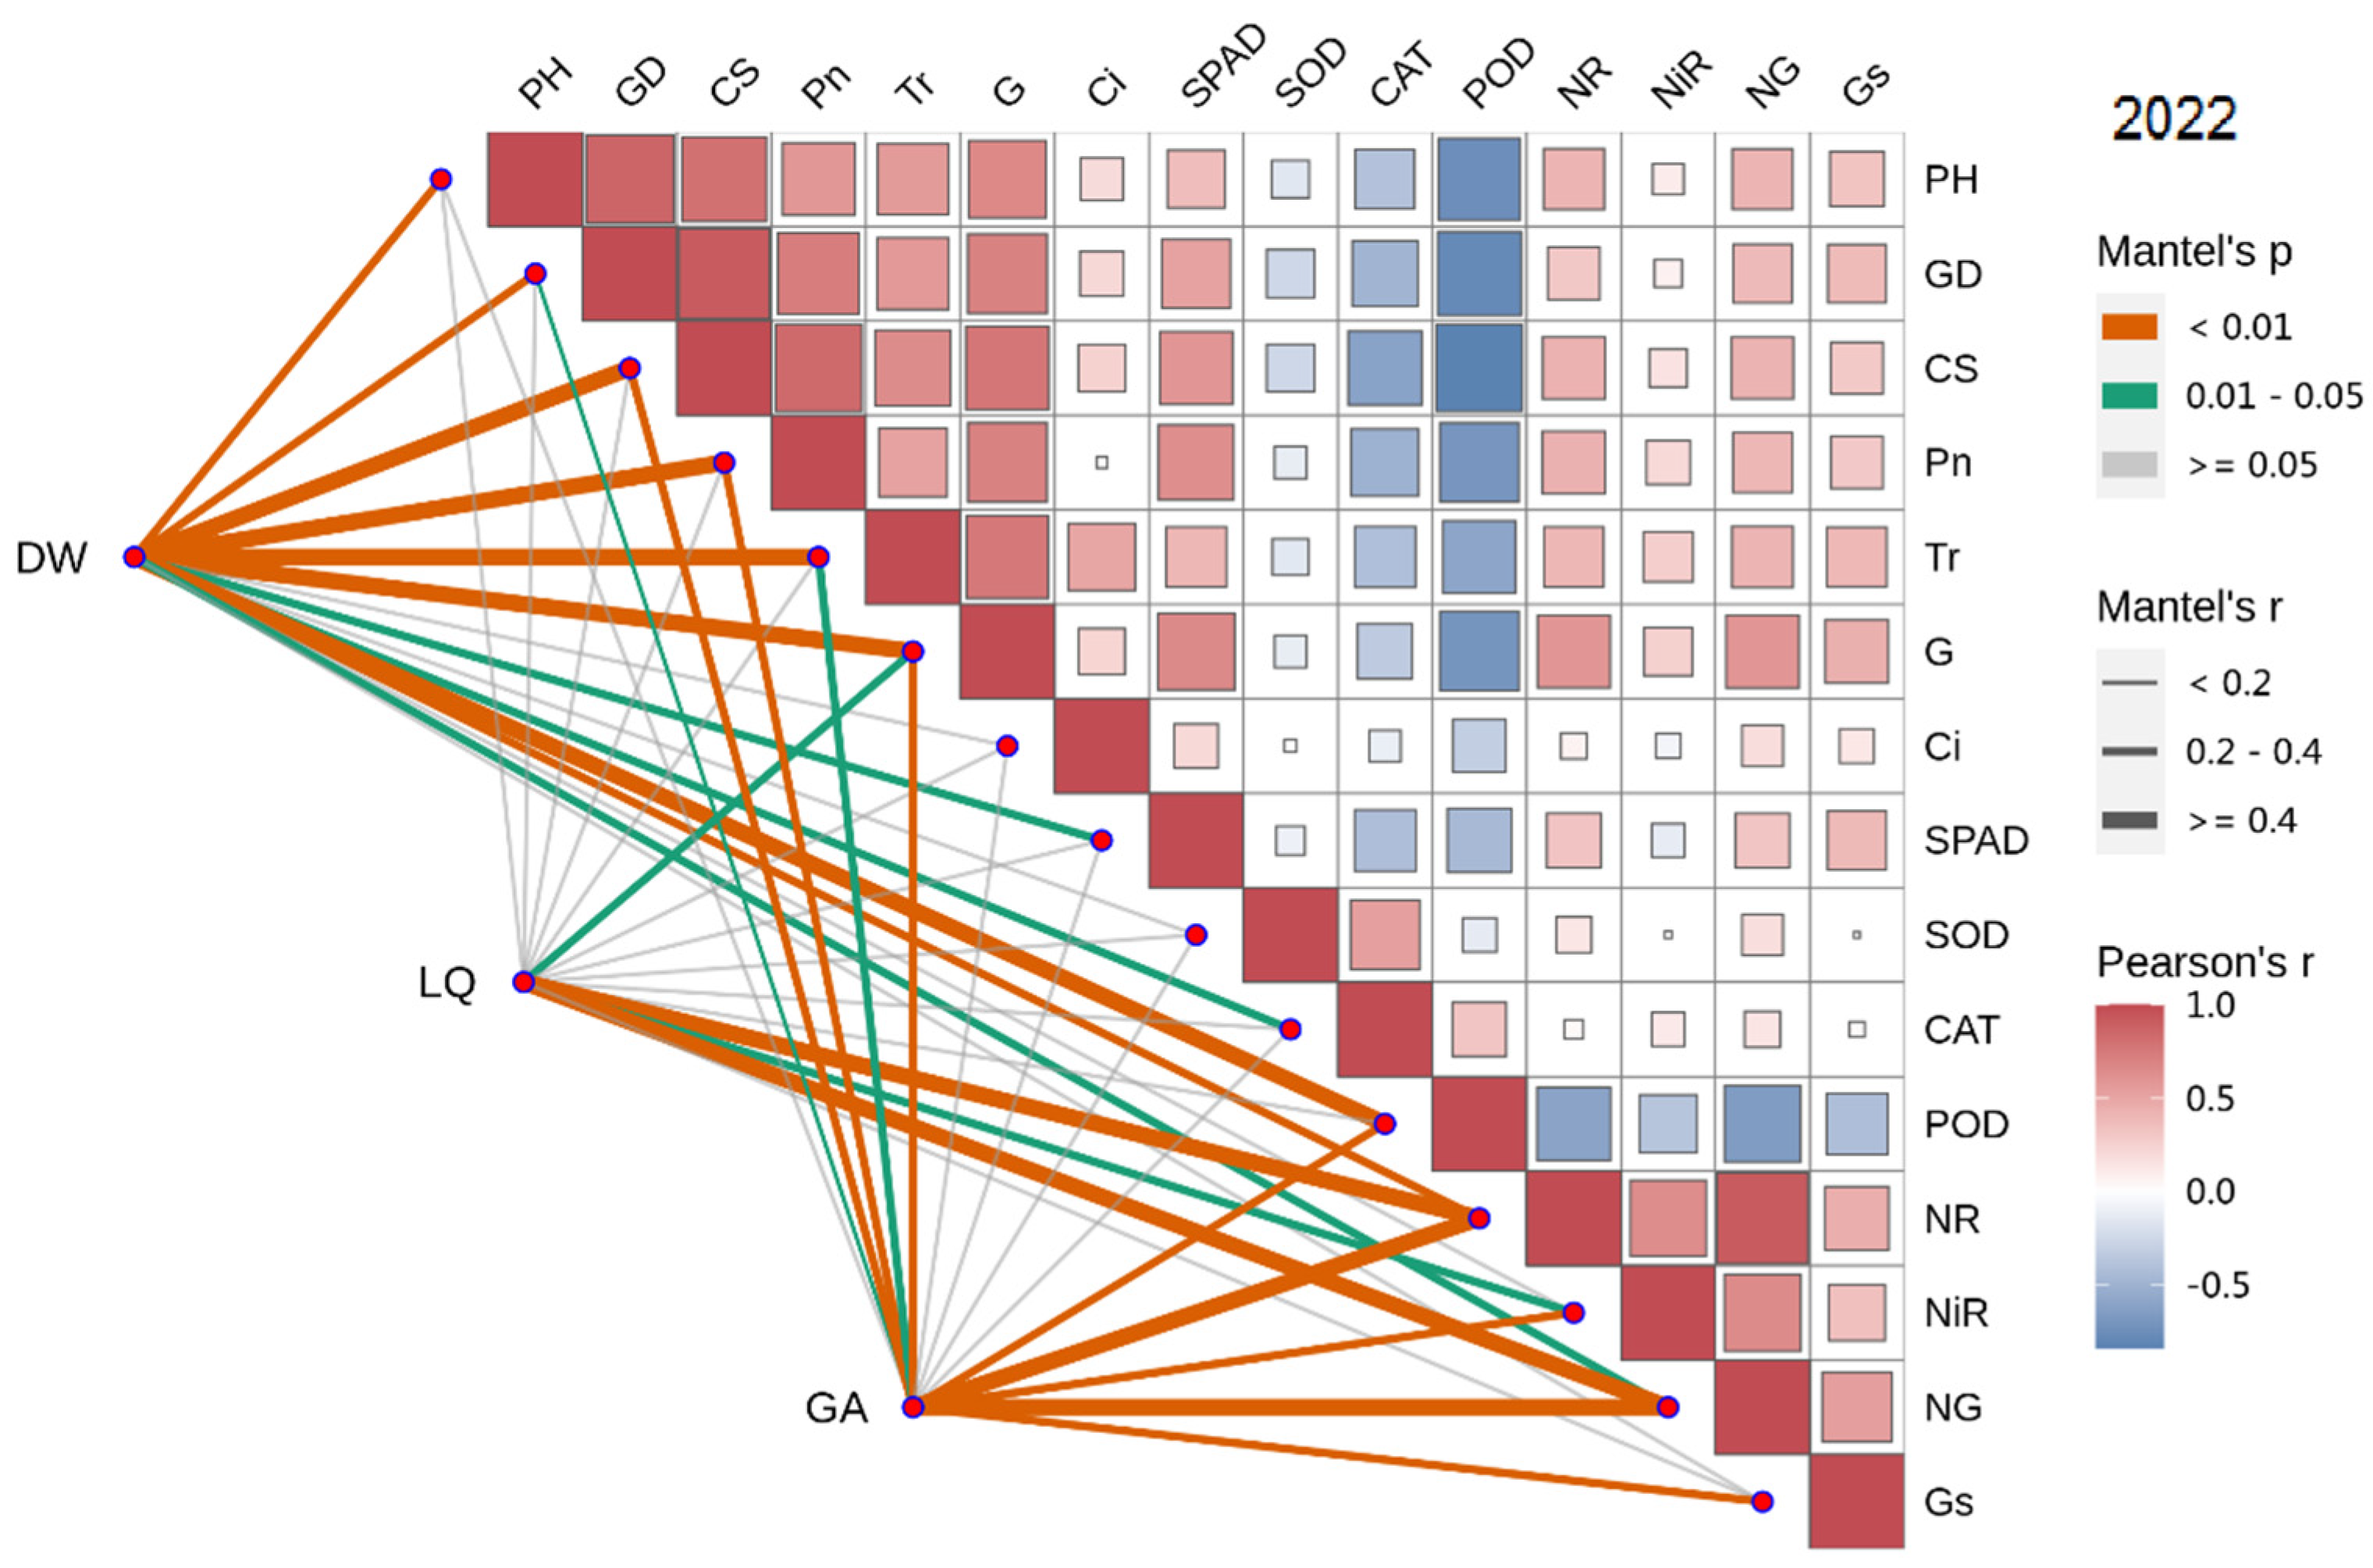
The correlation between the growth and physiological indexes (photosynthetic indicators, antioxidant enzyme activity, nitrogen metabolism enzyme activity) and yield and effective components of licorice was analyzed, and the Mantel test results were as follows.
In 2021, the dry weight of licorice was significantly positively correlated with GD, Pn, SPAD, CS, Tr and G (Sorted by the size of the correlation coefficient), and negatively correlated with SOD, POD and CAT. LQ was positively correlated with NG, NiR, Gs and NR. GA was significantly positively correlated with Gs and NR (Figure 5 and Figure 6).
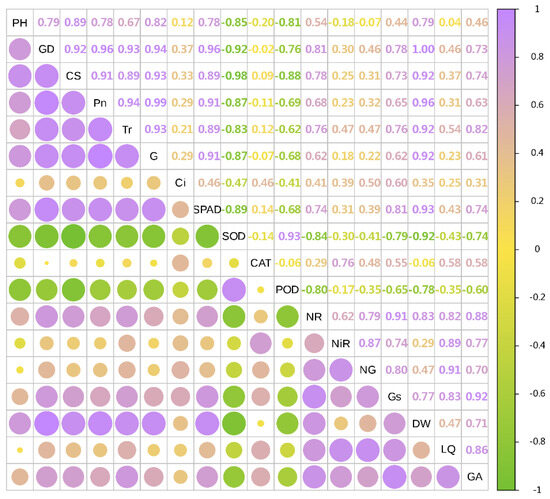
Figure 5.
Correlation analysis of growth and physiological indexes with yield and effective components in 2021. The circles’size represents the degree of correlation. The higher the degree of correlation, the larger the circle.
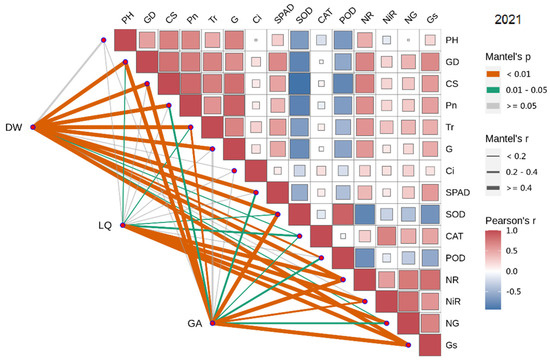
Figure 6.
Combined correlation analysis of growth and physiological indexes with yield and effective components in 2021. The boxes’size represents the degree of correlation. The higher the degree of correlation, the larger the box.
In 2022, the dry weight of licorice was significantly positively correlated with Pn, Tr, SPAD, CS, PH and GD, and negatively correlated with POD, CAT and SOD. Meanwhile, LI was significantly positively correlated with NR, NG and Gs. Additionally, GA was significantly positively correlated with Gs, NR, NiR and NG (Figure 7 and Figure 8).
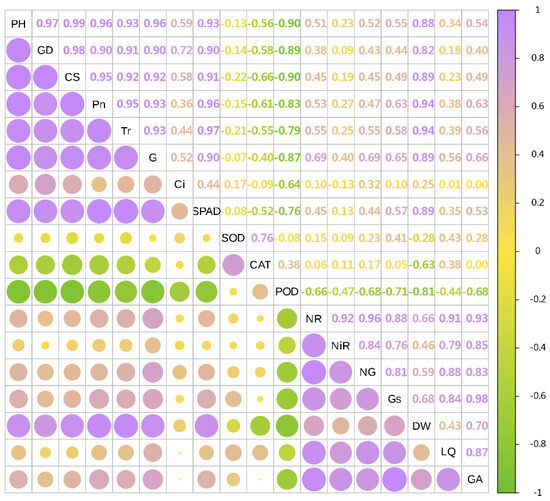
Figure 7.
Correlation analysis of growth and physiological indexes with yield and effective components in 2022. The circles’size represents the degree of correlation. The higher the degree of correlation, the larger the circle.
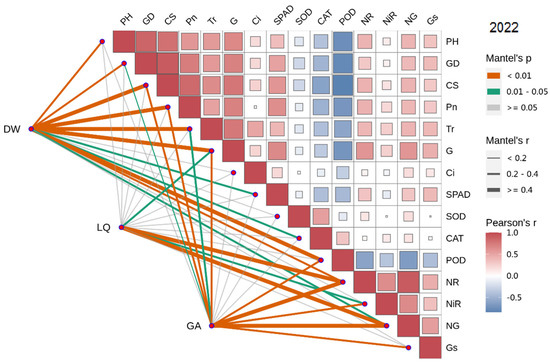
Figure 8.
Combined correlation analysis of growth and physiological indexes with yield and effective components in 2022. The boxes’size represents the degree of correlation. The higher the degree of correlation, the larger the box.
3.9. PCA of Different Weeding Frequencies
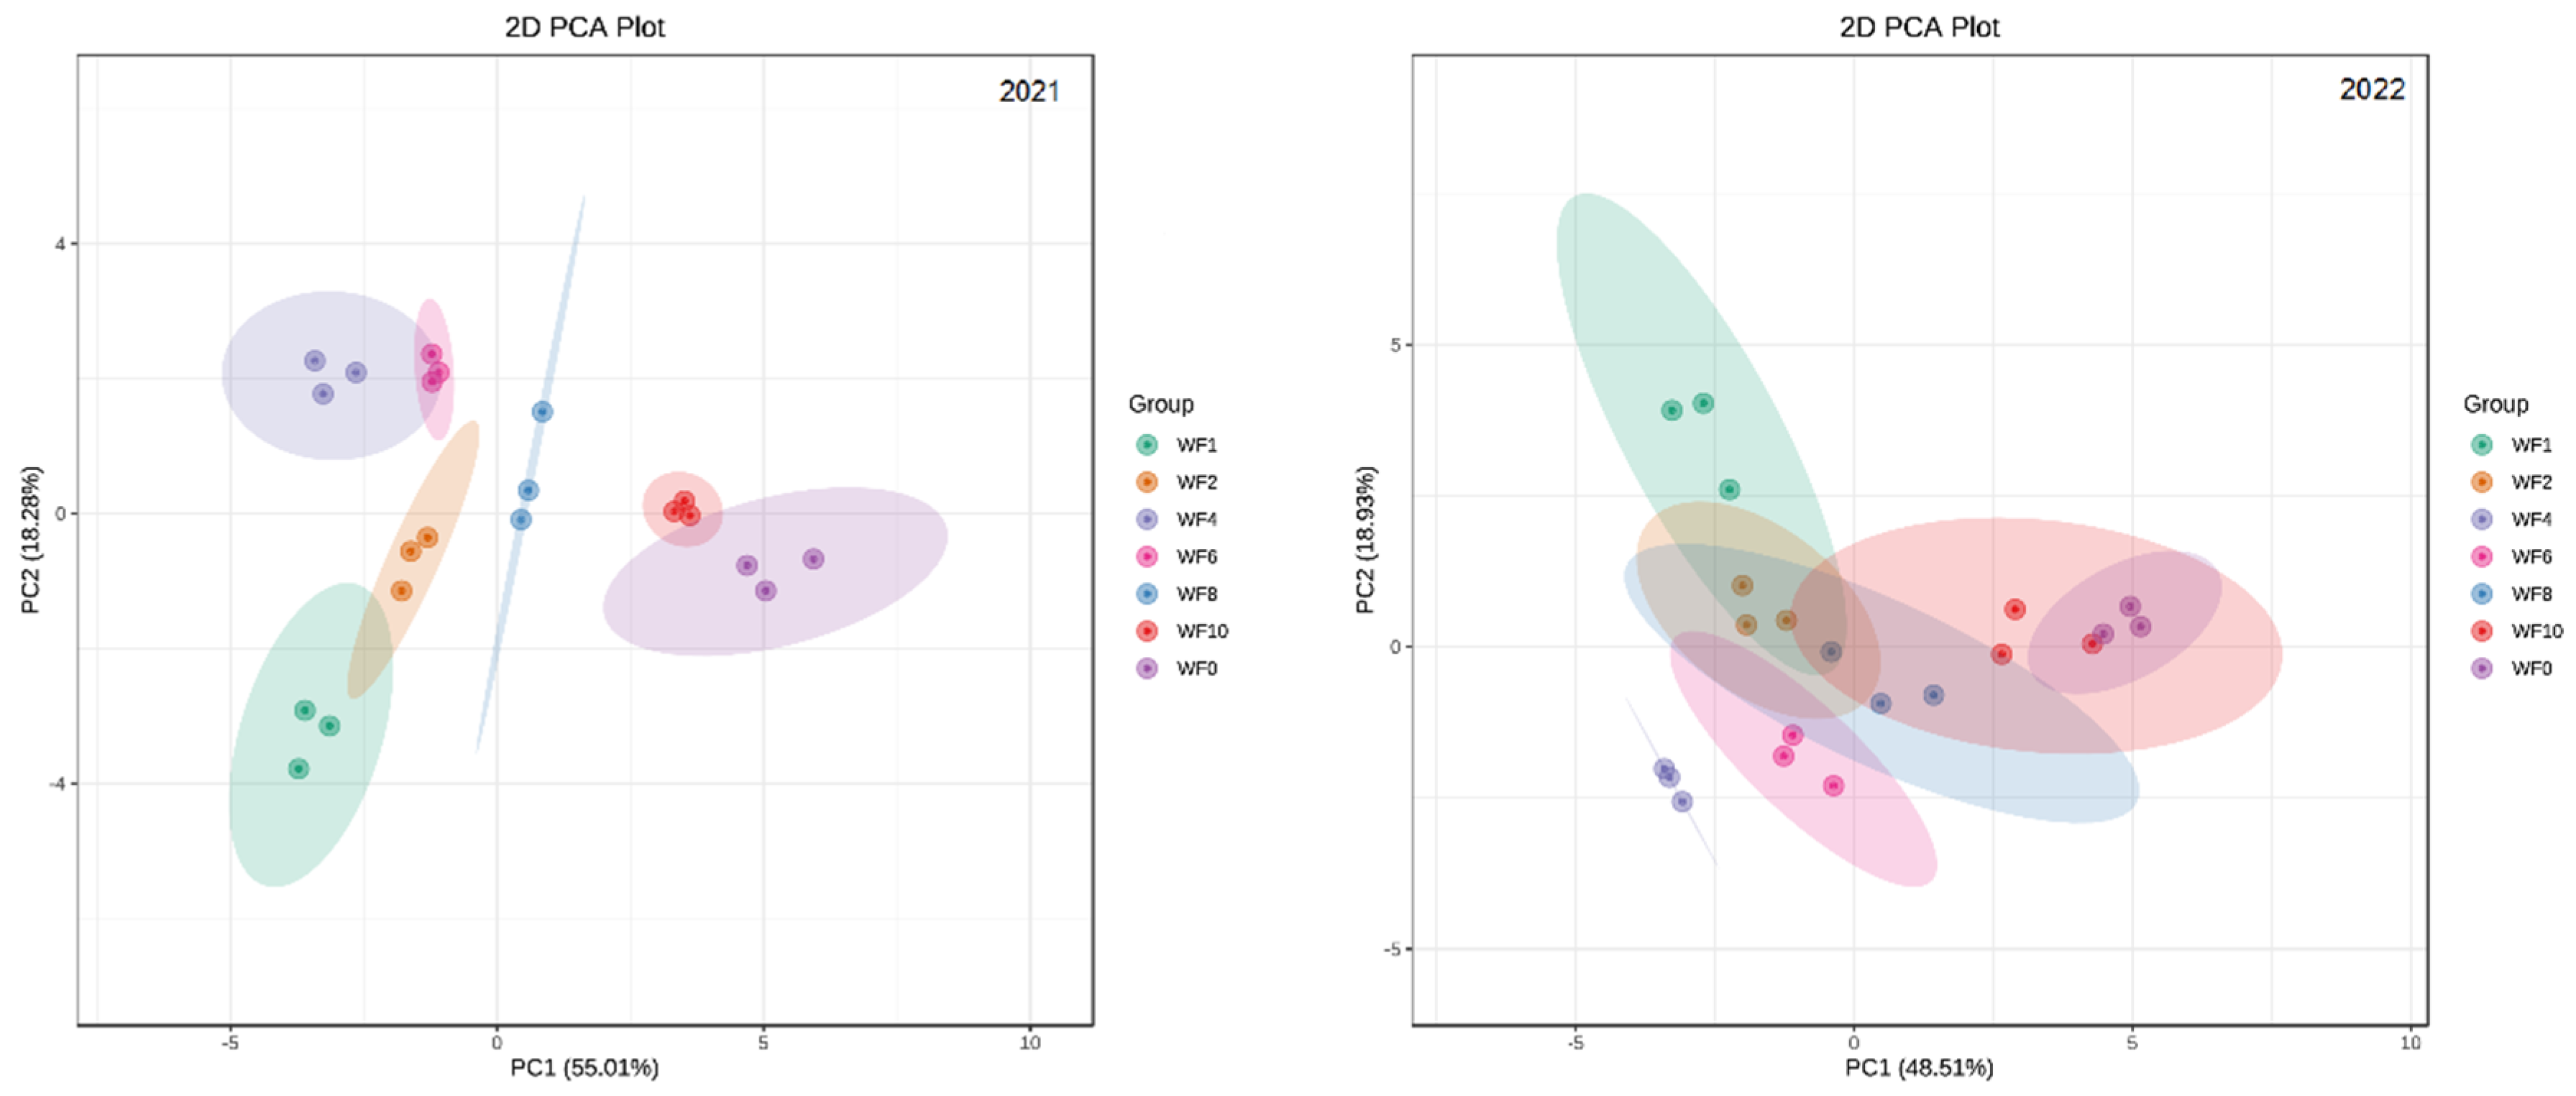
To assess the difference between the seven weeding frequencies in the field, PCA was performed on 18 indicators; these included the growth, photosynthetic indicators, antioxidant enzyme activity, nitrogen metabolism enzyme activity, yield and effective components of licorice (Figure 9).
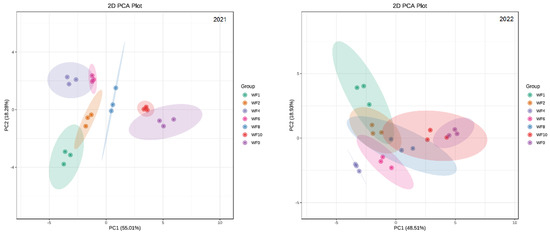
Figure 9.
The PCA of weeding frequencies in 2021 and 2022.
The PCA showed that the total variance of the model described by the PC1 and PC2 axes was 73.29% in 2021 and 67.44% in 2022, which suggested that there were differences among the seven treatments.
4. Discussion
4.1. Effect of Weeding Frequencies on Growth of Licorice
The present study found that the degree to which different weeding frequencies affected the normal growth of licorice was inconsistent. The plant height, ground diameter and crown observed in the WF1, WF2 and WF4 treatments were greater (Table 2). This study was conducted in the arid and semi-arid areas of China, which experience low rainfall and high evaporation. Plant growth is often affected by water stress. In response to water stress, changes in the growth of plants and its distribution to different organs reflect the methods used to adapt to the ecological environment [44]. In this study, there were approximately 465,000 weeds per hectare in the licorice field, and the biomass produced reached 3298.2 kg. All of these weeds consumed approximately 157.33 kg of (NH4)2SO4, 41.95 kg of Ca(H2PO4)2 and 62.93 kg of K2SO4, as well as lots of water [48]. Since the absorption of nutrients and water in weeds is often faster and higher than in crop plants [49], it is possible that weeds consumed the N, P, K and water required for the normal growth of licorice and ultimately affected its morphological structure.
4.2. Effect of Weeding Frequencies on Photosynthetic Parameters of Licorice
This study found that an increase in weed interference affected the availability of the water, nutrients and light required for growth, leading to the occurrence of a series of adaptive changes in the plants’ photosynthetic physiology. The more weeds there are, the stronger the competitive advantage. The G of the treatment without weeding was significantly lower than that of the other treatments, and the SPAD value was also lower (Table 3). This might be due to the competition of weeds, leading to a deficit of water in the leaves, stomatal limitation [50] and the degradation of photosynthetic pigment [51], thus reducing the Pn value and ultimately, the energy and material provided for growth. On the contrary, the treatment with a high weeding frequency was less affected by weed competition, and the photosynthetic parameters were relatively high; this led to the production of dry matter. This was consistent with the effect that weeds have on growth and yield.
4.3. Effect of Weeding Frequencies on Antioxidant Enzyme Activities of Licorice
Plants can spontaneously induce osmotic regulation and catalyze a series of antioxidant enzymes when exposed to a stressful environment, thus removing excess reactive oxygen species and alleviating stress damage [52]. The activity of antioxidant enzymes increases when plants are under stress [53]. In this study, the activities of the three enzymes under different treatments tended to increase and then decrease (Table 4). The content of the three types of enzymes was lower in the treatment that included weed removal once a week; this may be due to lower levels of weed stress, a strong capacity for photosynthesis, and relatively low levels of active oxygen-free radicals, which destroy the cell membrane. The decrease in the photosynthetic capacity reduced the transmission rate of photosynthetic electrons with the aggravation of weed interference, which was conducive to the flow of electrons to molecular oxygen; this resulted in the production of superoxide radicals in plants, the accumulation of reactive oxygen species in cells [54] and an increase in the content of the three enzymes in licorice leaves. When the degree of weed interference exceeded the adaptation range, weed stress damaged the cell membrane system and the physiological system of the plants, and the activity of antioxidant enzymes showed a decreasing trend.
4.4. Effect of Weeding Frequencies on Nitrogen Metabolism Enzyme Activities of Licorice
Nitrogen is a key plant nutrient and is known to affect the primary and secondary metabolism in plants. A lack of nitrogen nutrition leads to the accumulation of carbon-based secondary metabolites such as terpenoids and phenols [55,56]. A previous study on the effect of the weeding frequency on rice nitrogen uptake revealed that weed leaves also require higher nitrogen levels and absorb more nitrogen than rice leaves in highly enriched soils [57]. The high N supply had an adverse effect on the production of secondary compounds in plants. The current study found that the treatments comprising a high weeding frequency promoted the activities of NR, NiR, NG and Gs, while those with a low weeding frequency significantly inhibited the plants’ enzyme activities. The WF4 treatment resulted in higher levels of activity in the nitrogen metabolism enzymes (Table 5). This might be due to the arid and semi-arid nature of the study area, the barren land and the fact that weeds consume a certain amount of nitrogen under a moderate weeding frequency. Mild nitrogen deficiency may promote an increase in the activities of nitrogen metabolism enzymes. However, under a low weeding frequency, weeds consume a large amount of nitrogen, resulting in an extreme lack of nitrogen nutrition in licorice; this may inhibit the nitrogen metabolism pathway during growth and thus, lower the activities of nitrogen metabolism enzymes.
4.5. Effect of Weeding Frequencies on Yield and Effective Components of Licorice
Our data showed that the effects of different weeding frequencies on the yield were consistent with those on the growth and photosynthesis of the plants. The yields obtained were higher when the WF1, WF2 and WF4 treatments were applied, and the yield was lowest when the WF0 treatment was applied. Because the licorice with a greater plant height, crown width, ground diameter and growth had a stronger photosynthetic capacity, more dry matter was accumulated, and the corresponding yield was higher. It is inferred that the growth status of the underground and aboveground parts of the plant has a direct positive correlation with its photosynthetic capacity.
The effects of different weeding frequencies on the accumulation of active ingredients and the activities of nitrogen metabolism enzymes were also consistent. WF4-treated licorice had higher LQ and GA contents. This might be because the secondary metabolites of licorice increased to varying degrees under the condition of mild weed interference to protect the carbon/nitrogen nutrient metabolism balance and adapt to the weed stress environment. Therefore, it was inferred that a moderate weed interference frequency would help improve the accumulation of LQ and GA in licorice. This was consistent with previous research results regarding the effect of nitrogen application on the quality of medical cannabis; it was previously found that a certain degree of nitrogen deficiency will induce the production of cannabinoids, and that high-dose nitrogen addition or low-dose nitrogen addition has adverse effects on the production of secondary metabolites [55].
5. Conclusions
In summary, different weeding frequencies had different effects on the yield and quality of licorice. The WF1, WF2 and WF4 treatments exhibited higher yields, followed by the WF6, WF8 and WF10 treatments; the lowest yield was observed when the WF0 treatment was applied. A moderate weeding frequency was beneficial to an increase in the content of LQ and GA. In addition, it was found that the WF4-treated licorice had higher LQ and GA contents, which was consistent with its high economic benefits. Therefore, considering the quality and economic benefits of the local ecological planting of licorice, the WF4 treatment would not only significantly improve the quality and economic benefits of licorice production, but also promote the sustainability of the farmland ecosystem. This would represent an ecological and efficient measure that is able to prevent and control weeds in farmland. In this study, hand weeding was used in the experiments. If large-scale planting is carried out, the labor cost is high, and safe and reliable weeding machinery should be designed to improve the efficiency of weeding and increase farmers’ income. The findings of this study are able to provide a significant reference regarding the regulation of the quality of Chinese medicinal materials using weeds in the future. Further studies should explore the optimal ratio of medicinal materials and weeds to be applied in licorice production.
Author Contributions
Investigation, D.W., H.L., B.M., M.L., Y.B. and Y.N.; data analysis, D.W. and B.M.; writing—original draft preparation, D.W.; writing—review and editing, D.W. and B.M.; project administration, D.W.; funding acquisition, B.M. and M.L. All authors have read and agreed to the published version of the manuscript.
Funding
This research was funded by Natural Science Foundation of Ningxia Hui Autonomous Region (2022AAC03421), National Modern Agricultural Industry Technology System Funding (CARS-21), Ningxia Hui Autonomous Region Agricultural Science and Technology Independent Innovation Funding Project (NGSB-2021-16), and the sixth batch of autonomous region youth science and technology talents lift project.
Data Availability Statement
All new research data are presented in this contribution.
Acknowledgments
We want to thank all the members of our team who have contributed by involvement in the experimental process.
Conflicts of Interest
The authors declare no conflicts of interest.
Abbreviations
| PH | Plant height |
| GD | ground diameter |
| CS | crown size |
| Pn | net photosynthetic rate |
| Tr | transpiration rate |
| G | stomatal conductance |
| Ci | intercellular CO2 concentration |
| SOD | superoxide dismutase |
| POD | peroxidase |
| CAT | catalase |
| GS | glutamine synthetase |
| NR | nitrate reductase |
| NiR | nitrite reductase |
| NG | glutamate synthase |
| DW | dry weight |
| LQ | liquiritin |
| GA | glycyrrhizic acid |
References
- Vasileiou, M.; Kyrgiakos, L.S.; Kleisiari, C.; Kleftodimos, G.; Vlontzos, G.; Belhouchette, H.; Pardalos, P.M. Transforming weed management in sustainable agriculture with artificial intelligence: A systematic literature review towards weed identification and deep learning. Crop Prot. 2024, 176, 106522. [Google Scholar] [CrossRef]
- Ekwealor, K.U.; Echereme, C.B.; Ofobeze, T.N.; Okereke, C.N. Economic importance of weeds: A review. Asian Plant Res. J. 2019, 3, 1–11. [Google Scholar] [CrossRef]
- Worthington, M.; Reberg-Horton, C. Breeding cereal crops for enhanced weed suppression: Optimizing allelopathy and competitive ability. J. Chem. Ecol. 2013, 39, 213–231. [Google Scholar] [CrossRef] [PubMed]
- Hossain, M.S.; Sarker, U.K.; Monira, S.; Ali, M.I.; Hasan, A.K.; Kaysar, M.S.; Anwar, M.P.; Begum, M.; Rashid, M.H.; Rashid, M.H.; et al. Determination of critical period for sustainable weed management and yield of Jute (Corchorus olitorius L.) under sub-tropical condition. Sustainability 2023, 15, 9282. [Google Scholar] [CrossRef]
- Adenawoola, A.R.; Aladesanwa, R.D.; Adenowuro, T.D. Effects of frequency of weeding on the growth and yield of long-fruited jute (Corchorus olitorius) in a rainforest area of southwestern Nigeria. Crop Prot. 2005, 24, 407–411. [Google Scholar] [CrossRef]
- Pahade, S.; Jha, A.K.; Verma, B.; Meshram, R.K.; Toppo, O.; Shrivastava, A. Efficacy of sulfentrazone 39.6% and pendimethalin as a pre emergence application against weed spectrum of Soybean (Glycine max L. Merrill). Int. J. Plant Soil Sci. 2023, 35, 51–58. [Google Scholar] [CrossRef]
- Moss, S. Integrated weed management (IWM): Why are farmers reluctant to adopt non-chemical alternatives to herbicides? Pest Manag. Sci. 2019, 75, 1205–1211. [Google Scholar] [CrossRef] [PubMed]
- Tomar, D.S.; Jha, A.K.; Verma, B.; Meshram, R.K.; Porwal, M.; Chouhan, M.; Rajpoot, A. Comparative efficacy of different herbicidal combinations on weed growth and yield attributes of Wheat. Int. J. Environ. Clim. Chang. 2023, 13, 889–898. [Google Scholar] [CrossRef]
- Kraehmer, H.; Laber, B.; Rosinger, C.; Schulz, A. Herbicides as weed control agents: State of the art: I. weed control research and safener technology: The path to modern agriculture. Plant Physiol. 2014, 166, 1119–1131. [Google Scholar] [CrossRef]
- Ferrero, R.; Lima, M.; Davis, A.S.; Gonzalez-Andujar, J.L. Weed diversity affects Soybean and Maize yield in a long term experiment in Michigan, USA. Front. Plant Sci. 2017, 8, 236. [Google Scholar] [CrossRef]
- Keller, M.; Böhringer, N.; Möhring, J.; Rueda-Ayala, V.; Gutjahr, C.; Gerhards, R. Changes in Weed Communities, Herbicides, Yield Levels and Effect of Weeds on Yield in Winter Cereals Based on Three Decades of Field Experiments in South-Western Germany. Gesunde Pflanz. 2015, 67, 11–20. [Google Scholar] [CrossRef]
- Ali, A.; Streibig, J.C.; Andreasen, C. Yield loss prediction models based on early estimation of weed pressure. Crop Prot. 2013, 53, 125–131. [Google Scholar] [CrossRef]
- Mubeen, K.; Yonas, M.W.; Khalofah, A.; Ikram, R.M.; Sarwar, N.; Shehzad, M.; Wasaya, A.; Rehman, H.u.; Yasir, T.A.; Aziz, M.; et al. Interference of horse purslane (Trianthema portulacastrum L.) and other weeds affect yield of autumn planted maize (Zea mays L.). Saudi J. Biol. Sci. 2021, 28, 2291–2300. [Google Scholar] [CrossRef]
- Mehriya, M.L.; Choudhary, R. Effect of combined application of herbicides on the growth, yield attributes, yield and profitability of Kharif Groundnut Arachis hypogaea (L.). Int. J. Environ. Clim. Chang. 2023, 13, 2413–2424. [Google Scholar] [CrossRef]
- Liu, C.; Yang, K.; Chen, Y.; Gong, H.; Feng, X.; Tang, Z.; Fu, D.; Qi, L. Benefits of mechanical weeding for weed control, rice growth characteristics and yield in paddy fields. Field Crop. Res. 2023, 293, 108852. [Google Scholar] [CrossRef]
- Abdallah, I.S.; Abdelgawad, K.F.; El-Mogy, M.M.; El-Sawy, M.B.I.; Mahmoud, H.A.; Fahmy, M.A.M. Weed control, growth, nodulation, quality and storability of Peas as affected by pre- and postemergence herbicides. Horticulturae 2021, 7, 307. [Google Scholar] [CrossRef]
- Liao, P.; Chen, G.; Liu, G.; Jiang, Y.; Zhao, C.; Wang, W.; Huo, Z. Effects of different density of Cyperus difformis and Ammannia baccifera on rice yield, processing and appearance quality. Acta Agric. Zhejiangensis 2022, 34, 2348–2357. [Google Scholar] [CrossRef]
- Stefanic, E.; Rasic, S.; Lucic, P.; Zimmer, D.; Mijic, A.; Antunovic, S.; Japundzic-Palenkic, B.; Lukacevic, M.; Zima, D.; Stefanic, I. The critical period of weed control influences Sunflower (Helianthus annuus L.) yield, yield components but not oil content. Agronomy 2023, 13, 2008. [Google Scholar] [CrossRef]
- Tian, Y.; Hu, Y.; Zhang, W.; Qian, K.; He, L. Effects of different weeding frequencies and methods on the yield and quality of Radix bupleuri. Plant Dr. 2021, 34, 49–57. [Google Scholar] [CrossRef]
- Walter, J.; Kromdijk, J. Here comes the sun: How optimization of photosynthetic light reactions can boost crop yields. J. Integr. Plant Biol. 2022, 64, 564–591. [Google Scholar] [CrossRef]
- Wu, A.; Brider, J.; Busch, F.A.; Chen, M.; Chenu, K.; Clarke, V.C.; Collins, B.; Ermakova, M.; Evans, J.R.; Farquhar, G.D.; et al. A cross-scale analysis to understand and quantify the effects of photosynthetic enhancement on crop growth and yield across environments. Plant Cell Environ. 2023, 46, 23–44. [Google Scholar] [CrossRef]
- Jhanzab, H.M.; Qayyum, A.; Bibi, Y.; Sher, A.; Hayat, M.T.; Iqbal, J.; Qamar, M.; Elesawy, B.H.; Ismail, K.A.; Gharib, A.F.; et al. Chemo-Blended Ag & Fe nanoparticles effect on growth, physiochemical and yield traits of Wheat (Triticum aestivum). Agronomy 2022, 12, 757. [Google Scholar] [CrossRef]
- Liu, X.; Li, N.; Ji, T.; Zhou, B.; Min, W.; Li, J.; Yang, F. Effects of microbial agents and corn protein ferment on physiological characteristics in leaves and yield of tomato. Chin. J. Appl. Ecol. 2023, 34, 3039–3044. [Google Scholar] [CrossRef]
- Dang, H.; Zhang, T.; Wang, Z.; Li, G.; Zhao, W.; Lv, X.; Zhuang, L. Differences in the endophytic fungal community and effective ingredients in root of three Glycyrrhiza species in Xinjiang, China. PeerJ 2021, 9, e11047. [Google Scholar] [CrossRef] [PubMed]
- Man, S.; Wang, J.; Gao, W.; Guo, S.; Li, Y.; Zhang, L.; Xiao, P. Chemical analysis and anti-inflammatory comparison of the cell culture of Glycyrrhiza with its field cultivated variety. Food Chem. 2013, 136, 513–517. [Google Scholar] [CrossRef]
- Chinese Pharmacopoeia Commission. The Chinese Pharmacopoeia; China Medical Science Press: Beijing, China, 2020; pp. 88–89. ISBN 9787506700778. [Google Scholar]
- Li, X.; Zhao, Z.; Chen, L.; An, H.; Li, G.; Liu, B. The status and countermeasures of development on licorices industry of Ningxia. Ecol. Econ. 2012, 12, 131–134. [Google Scholar]
- Li, X.; An, Y.; Li, H.; Jin, X. Weed control and safety of quizalofop-P-ethyl 10% EC for licorice farmland. Plant Prot. 2018, 44, 219–223. [Google Scholar] [CrossRef]
- Zhao, Z.; Fu, Y.; Qin, J.; Jin, M.; Yang, S.; Dou, X.; Yang, M. QuEchERS pretreatment coupled to gas chromatography and tandem mass spectrometry to fast determination of 34 pesticide residues in Glycyrrhizae Radix et Rhizoma. China J. Chin. Mater. Medica 2019, 44, 5094–5101. [Google Scholar] [CrossRef]
- Zuo, Z.; Niu, Y.; Zhang, A.; Wen, S. Residual status of five herbicides in artificial licorice. J. Zhejiang Agric. Sci. 2020, 61, 2001–2003. [Google Scholar] [CrossRef]
- Li, X.; Lu, J.; Yan, P.; Zhang, F. Study on Classification System and Experimental Biology of Glycyrrhiza L.; Fudan University Press: Shanghai, China, 2015; pp. 1–404. ISBN 9787309109825. [Google Scholar]
- Liu, G.; Wu, Y.; Liu, Y.; Li, X.; Yang, W. Chemical constituents in Glycyrrhiza uralensis: A review. Mod. Chin. Med. 2021, 23, 2006–2016. [Google Scholar] [CrossRef]
- Kong, S.; Li, P.; Verpoorte, R.; Li, M.; Dai, Y. Chemical and pharmacological difference between honey-fried licorice and fried licorice. J. Ethnopharmacol. 2023, 302, 115841. [Google Scholar] [CrossRef]
- Li, N.; Zhang, C.; Zhong, G.; Xiu, L.; Liu, H.; Chen, S.; Chen, F.; Li, M.; Liao, W.; Ren, Y. Research progress on chemical constituents and pharmacological effects of different varieties of Glycyrrhizae Radix et Rhizoma and predictive analysis of quality markers. Chin. Tradit. Herb. Drugs 2021, 52, 7680–7692. [Google Scholar] [CrossRef]
- Hao, J.; Liu, J.; Zhang, L.; Jing, Y.; Ji, Y. A study of the ionic liquid-based ultrasonic-assisted extraction of isoliquiritigenin from Glycyrrhiza uralensis. BioMed Res. Int. 2020, 2020, 7102046. [Google Scholar] [CrossRef]
- Lee, E.J.; Shaikh, S.; Ahmad, K.; Ahmad, S.S.; Lim, J.H.; Park, S.; Yang, H.J.; Cho, W.-K.; Park, S.-J.; Lee, Y.-H.; et al. Isolation and characterization of compounds from Glycyrrhiza uralensis as therapeutic agents for the muscle disorders. Int. J. Mol. Sci. 2021, 22, 876. [Google Scholar] [CrossRef]
- Bai, H.; Bao, F.; Fan, X.; Han, S.; Zheng, W.; Sun, L.; Yan, N.; Du, H.; Zhao, H.; Yang, Z. Metabolomics study of different parts of licorice from different geographical origins and their anti-inflammatory activities. J. Sep. Sci. 2020, 43, 1593–1602. [Google Scholar] [CrossRef]
- Zhang, D.; Liu, Y.; Yang, Z.; Song, X.; Ma, Y.; Zhao, J.; Wang, X.; Liu, H.; Fan, L. Widely target metabolomics analysis of the differences in metabolites of licorice under drought stress. Ind. Crop. Prod. 2023, 202, 117071. [Google Scholar] [CrossRef]
- Yang, L.; Jiang, Y.; Zhang, Z.; Hou, J.; Tian, S.; Liu, Y. The anti-diabetic activity of licorice, a widely used Chinese herb. J. Ethnopharmacol. 2020, 263, 113216. [Google Scholar] [CrossRef] [PubMed]
- Li, R.; Jin, Q.; Li, Z.; Wang, Y.; Peng, Z.; Duan, L. Salicylic acid improved salinity tolerance of Glycyrrhiza uralensis Fisch during seed germination and seedling growth stages. Acta Agron. Sin. 2020, 46, 1810–1816. [Google Scholar] [CrossRef]
- Huang, W.; Gao, J.; Wang, N.; Li, B.; Sun, X.; Xie, P.; Yang, J.; Sun, C. Study on seed germination characteristics of Glycyrrhiza uralensis Fisch. Seed 2018, 37, 12–15. [Google Scholar] [CrossRef]
- Zhu, L.; An, W.; Xie, J.; Zhan, F.; Liu, Y. Influence of seeding date on Glyrrhiza uralensis Fisch surviving through winter and growth characteristic of root system. J. Desert Res. 2007, 27, 469–472. [Google Scholar]
- Ye, J.; Qiu, D.; Zeng, Q.; Lin, H.; Zhang, H.; Wang, S.; Zhao, G. Comparisons of yields and effective constituents of various kinds of licorice in different picking time. Chin. Tradit. Pat. Med. 2016, 38, 1088–1092. [Google Scholar]
- Song, K.; Hu, H.; Xie, Y.; Fu, L. The effect of soil water deficiency on water use strategies and response mechanisms of Glycyrrhiza uralensis Fisch. Plants 2022, 11, 1464. [Google Scholar] [CrossRef]
- Huang, J.; Wang, P.; Niu, Y.; Yu, H.; Ma, F.; Xiao, G.; Xu, X. Changes in C:N:P stoichiometry modify N and P conservation strategies of a desert steppe species Glycyrrhiza uralensis. Sci. Rep. 2018, 8, 12668. [Google Scholar] [CrossRef]
- Chang, H.; Chen, P.; Ma, M. Feeding preference of Altica deserticola for leaves of Glycyrrhiza glabra and G. uralensis and its mechanism. Sci. Rep. 2020, 10, 1534. [Google Scholar] [CrossRef]
- Bond, W.J.; Midgley, J.J. Ecology of sprouting in woody plants: The persistence niche. Trends in Ecology and Evolution. Trends Ecol. Evol. 2001, 16, 45–51. [Google Scholar] [CrossRef] [PubMed]
- An, W.; Zhan, F.; Xie, J.; Liu, Y. Weed species and control measures in cultivated licorice field. Agric. Sci.-Technol. Inf. 2008, 12, 33–34. [Google Scholar] [CrossRef]
- Kaur, S.; Kaur, R.; Chauhan, B.S. Understanding crop-weed-fertilizer-water interactions and their implications for weed management in agricultural systems. Crop Prot. 2018, 103, 65–72. [Google Scholar] [CrossRef]
- Flexas, J.; Medrano, H. Drought-inhibition of photosynthesis in C3 plants: Stomatal and non-stomatal limitations revisited. Ann. Bot. 2002, 89, 183–189. [Google Scholar] [CrossRef] [PubMed]
- Joshi, R.; Wani, S.H.; Singh, B.; Bohra, A.; Dar, Z.A.; Lone, A.A.; Pareek, A.; Singla-Pareek, S.L. Transcription factors and plants response to drought stress: Current understanding and future directions. Front. Plant Sci. 2016, 7, 1029. [Google Scholar] [CrossRef] [PubMed]
- Gadelha, C.G.; Miranda, R.d.S.; Alencar, N.L.M.; Costa, J.H.; Prisco, J.T.; Gomes-Filho, E. Exogenous nitric oxide improves salt tolerance during establishment of Jatropha curcas seedlings by ameliorating oxidative damage and toxic ion accumulation. J. Plant Physiol. 2017, 212, 69–79. [Google Scholar] [CrossRef] [PubMed]
- Sheng, Z.; Meng, J.; Tao, J.; Zhao, D. Osmotic regulation, antioxidant enzyme activities and photosynthetic characteristics of tree Peony (Paeonia suffruticosa Andr.) in response to high temperature stress. Phyton Int. J. Exp. Bot. 2023, 92, 3133–3147. [Google Scholar] [CrossRef]
- Li, B.; Feng, Y.; Zong, Y.; Zhang, D.; Hao, X.; Li, P. Elevated CO2-induced changes in photosynthesis, antioxidant enzymes and signal transduction enzyme of soybean under drought stress. Plant Physiol. Biochem. 2020, 154, 105–114. [Google Scholar] [CrossRef] [PubMed]
- Saloner, A.; Bernstein, N. Nitrogen supply affects cannabinoid and terpenoid profile in medical cannabis (Cannabis sativa L.). Ind. Crop. Prod. 2021, 167, 113516. [Google Scholar] [CrossRef]
- Radušienė, J.; Marksa, M.; Ivanauskas, L.; Jakštas, V.; Çalişkan, Ö.; Kurt, D.; Odabaş, M.S.; Çirak, C. Effect of nitrogen on herb production, secondary metabolites and antioxidant activities of Hypericum pruinatum under nitrogen application. Ind. Crop. Prod. 2019, 139, 111519. [Google Scholar] [CrossRef]
- Maimunah, M.A.; Kautsar, V.; Bimantara, P.O.; Kimani, S.M.; Torita, R.; Tawaraya, K.; Murayama, H.; Utami, S.N.; Purwanto, B.H.; Cheng, W. Weeding frequencies decreased rice–weed competition and increased rice N uptake in organic paddy field. Agronomy 2021, 11, 1904. [Google Scholar] [CrossRef]
Disclaimer/Publisher’s Note: The statements, opinions and data contained in all publications are solely those of the individual author(s) and contributor(s) and not of MDPI and/or the editor(s). MDPI and/or the editor(s) disclaim responsibility for any injury to people or property resulting from any ideas, methods, instructions or products referred to in the content. |
© 2024 by the authors. Licensee MDPI, Basel, Switzerland. This article is an open access article distributed under the terms and conditions of the Creative Commons Attribution (CC BY) license (https://creativecommons.org/licenses/by/4.0/).

