
Effects of Salt Stress on Grain Quality and Starch Properties of High-Quality Rice Cultivars


 , ,
, , 
 , and
, and
Abstract
1. Introduction
2. Materials and Methods
2.1. Experiment Setup
2.2. Rice Yield and Quality
2.3. Starch Granule Morphology
2.4. Starch Properties
2.5. The Fine Structure of Amylopectin
2.6. Statistical Analysis
3. Results
3.1. Yield and Yield Components
3.2. Appearance and Milling Quality of Rice
3.3. Cooking and Eating Quality of Rice
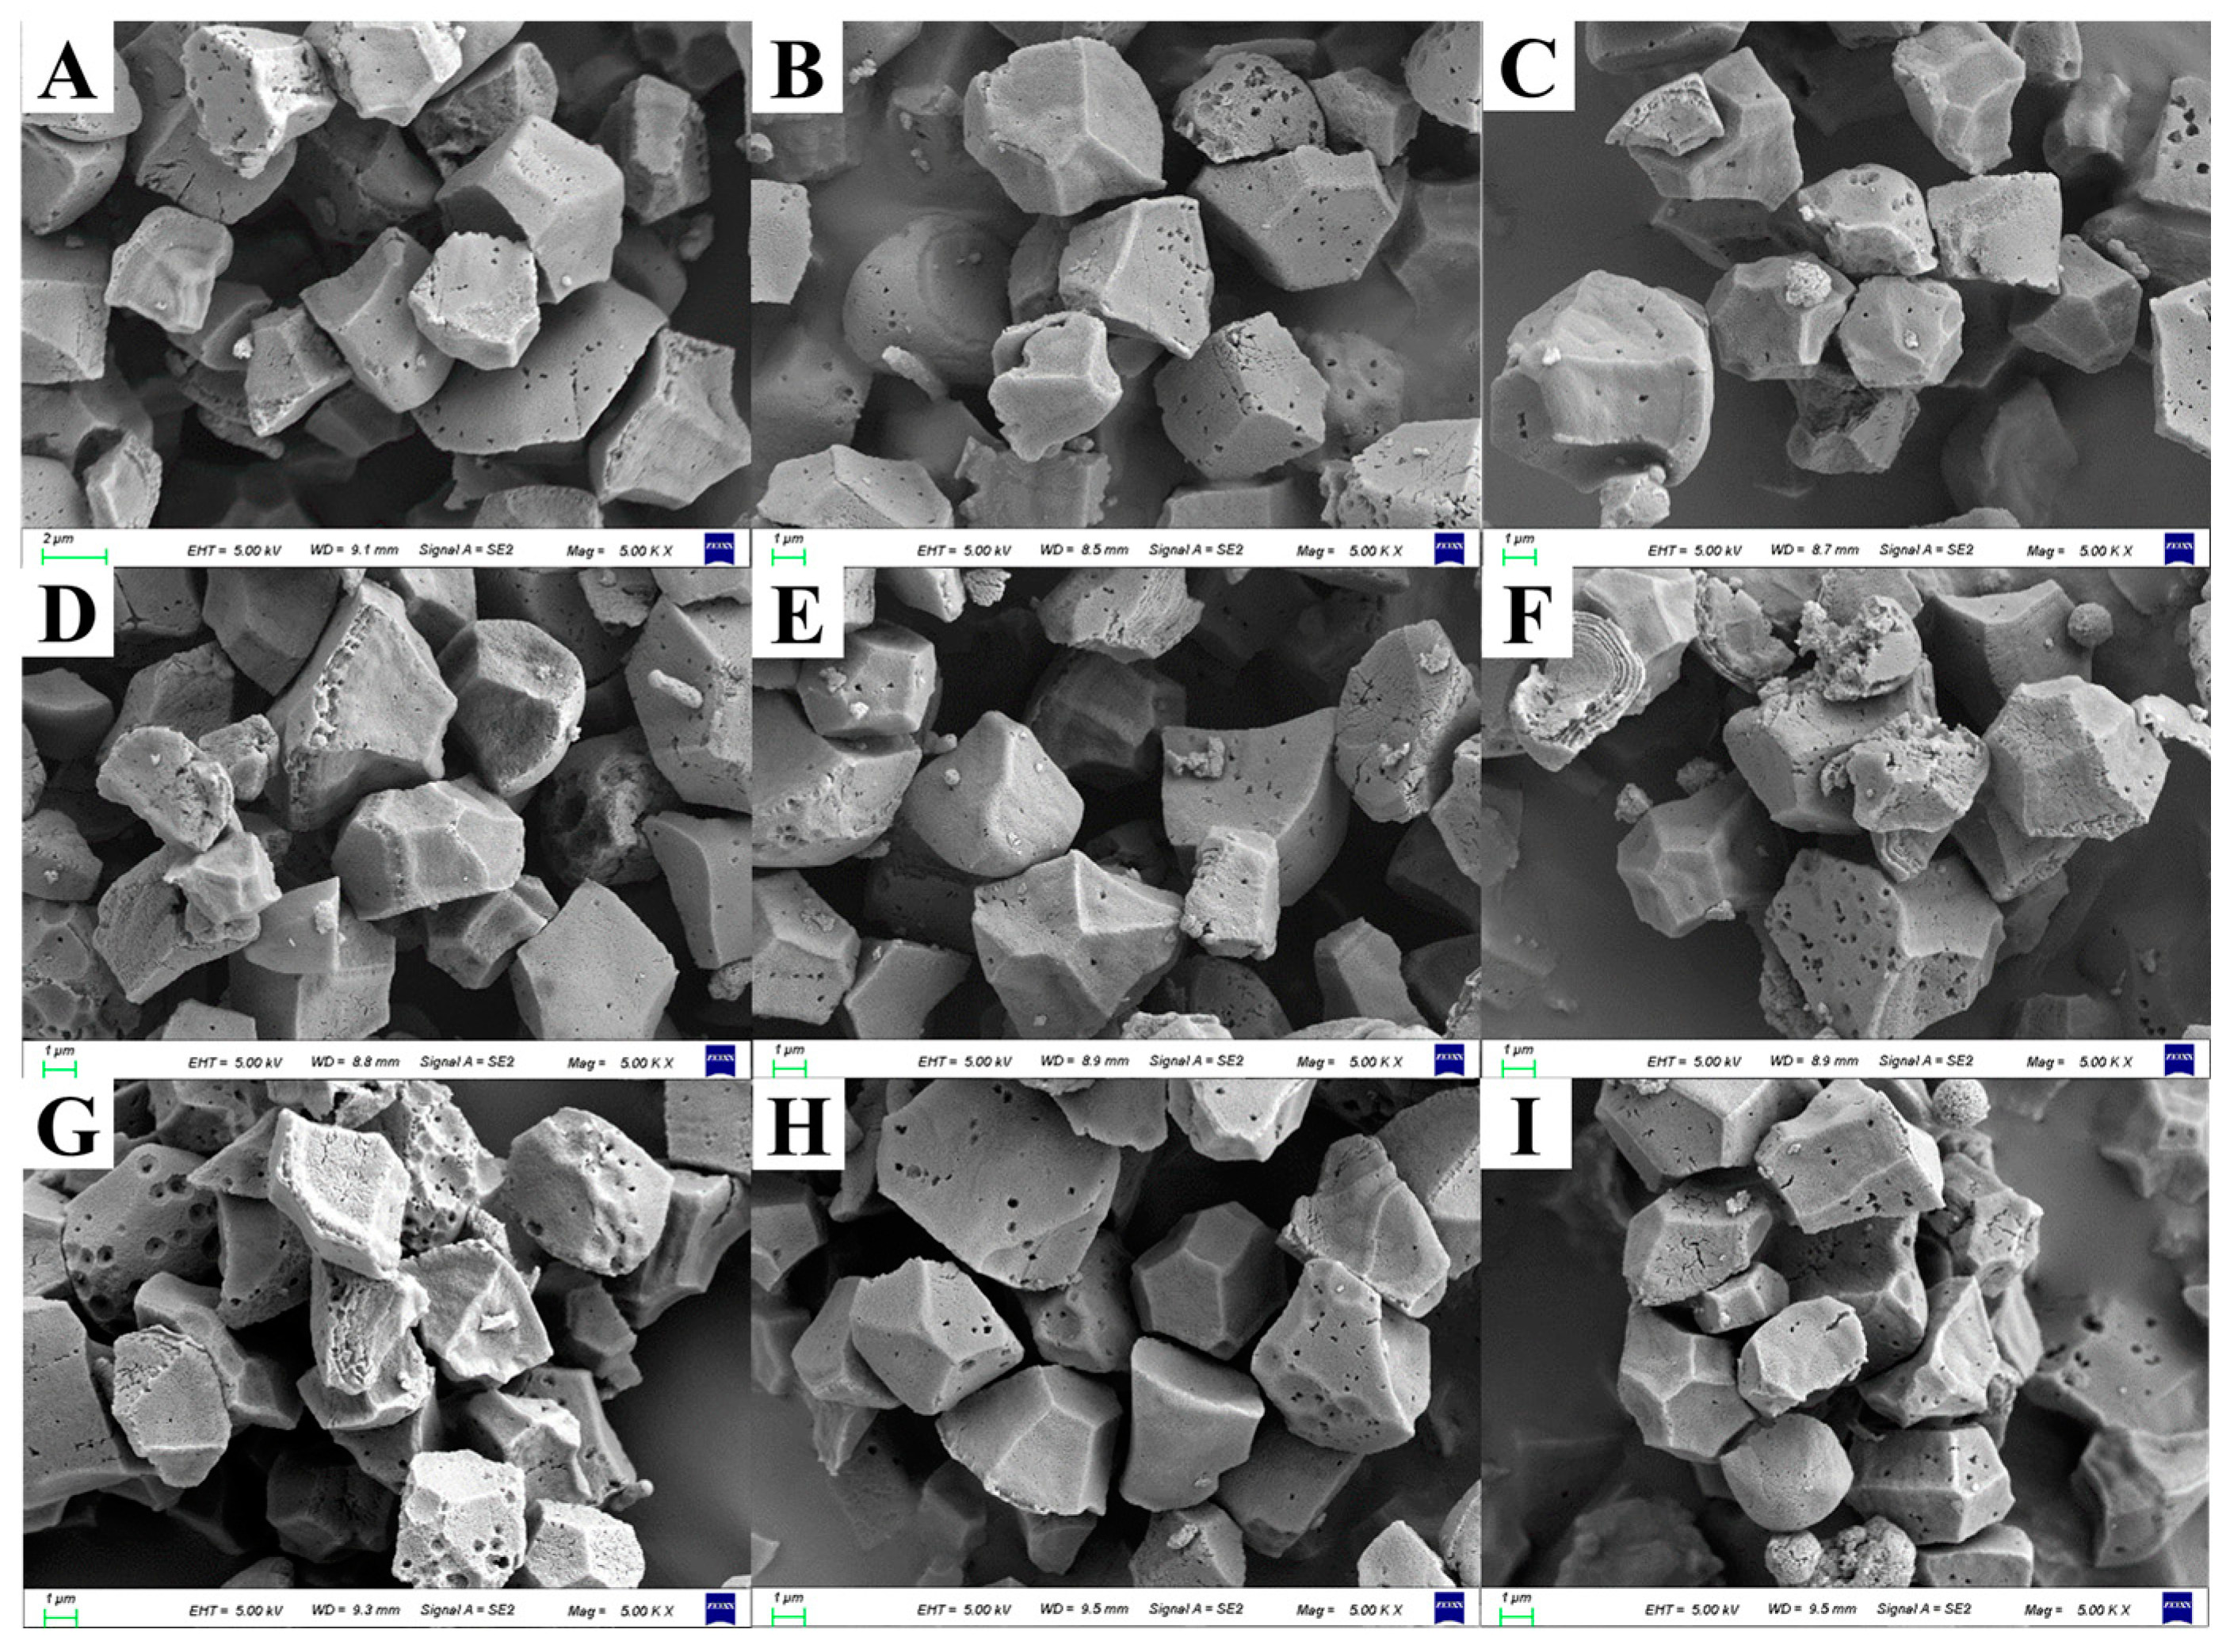
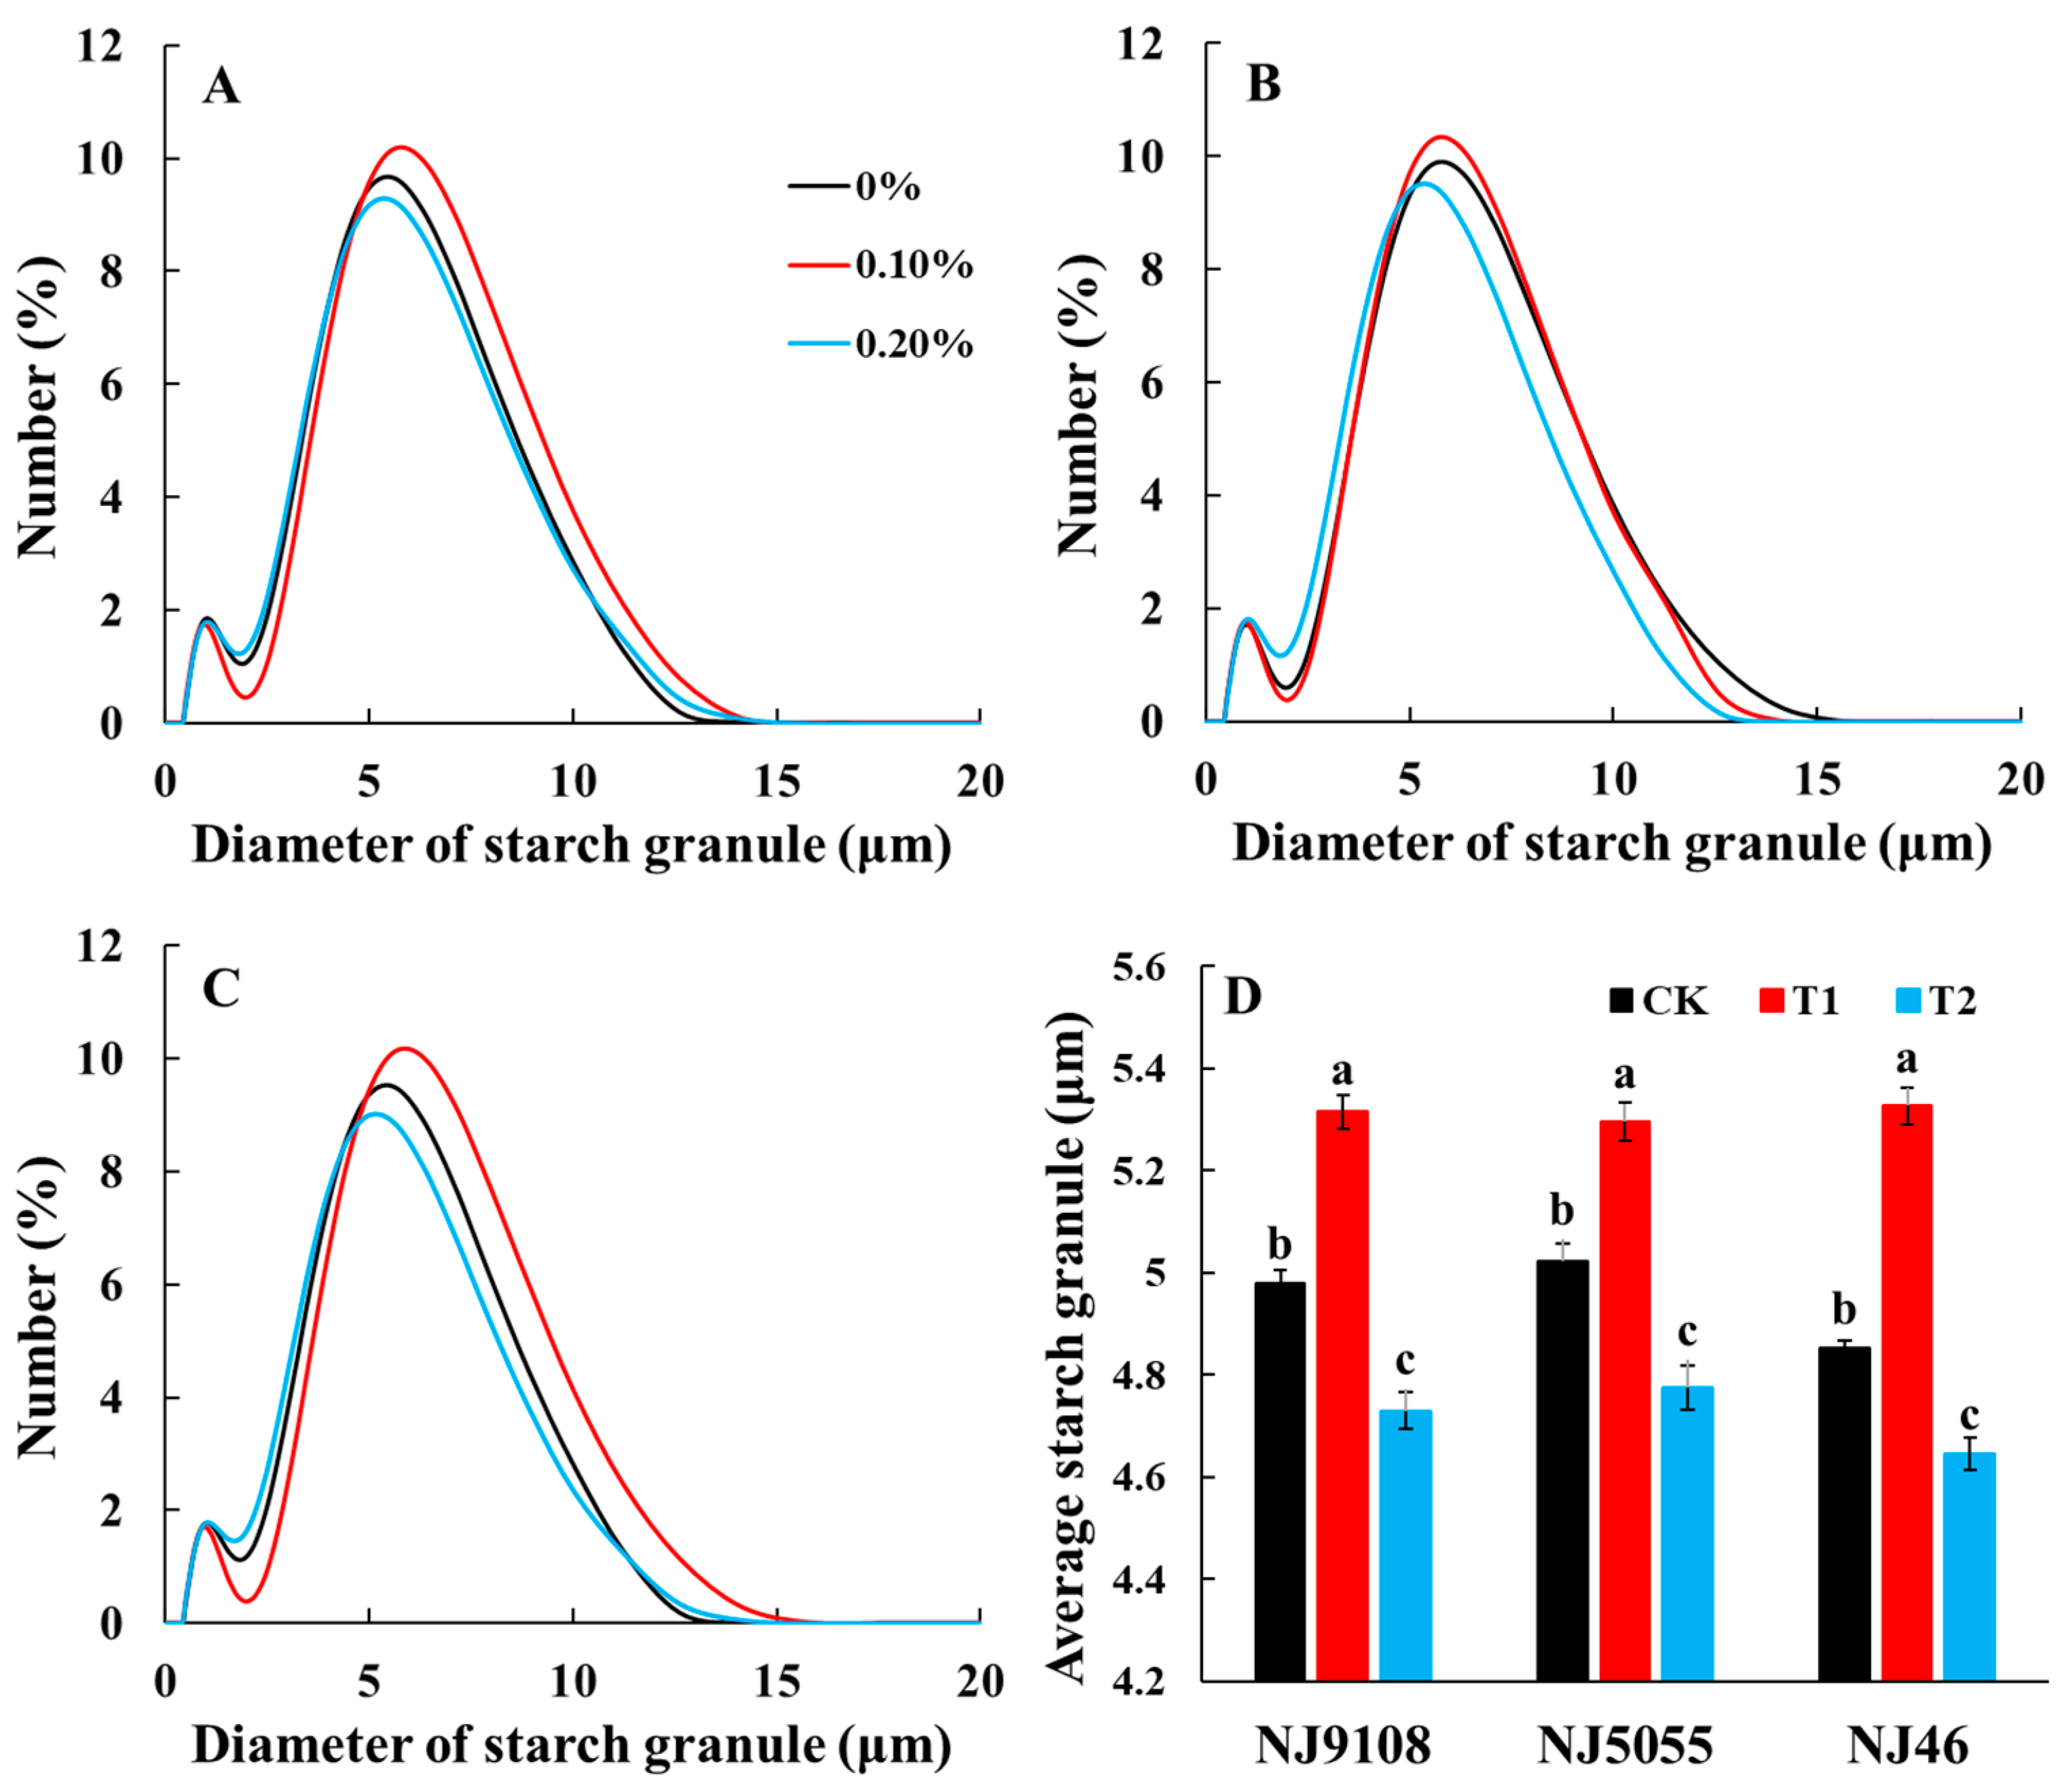
3.4. Starch Granule Morphology and Size Distribution
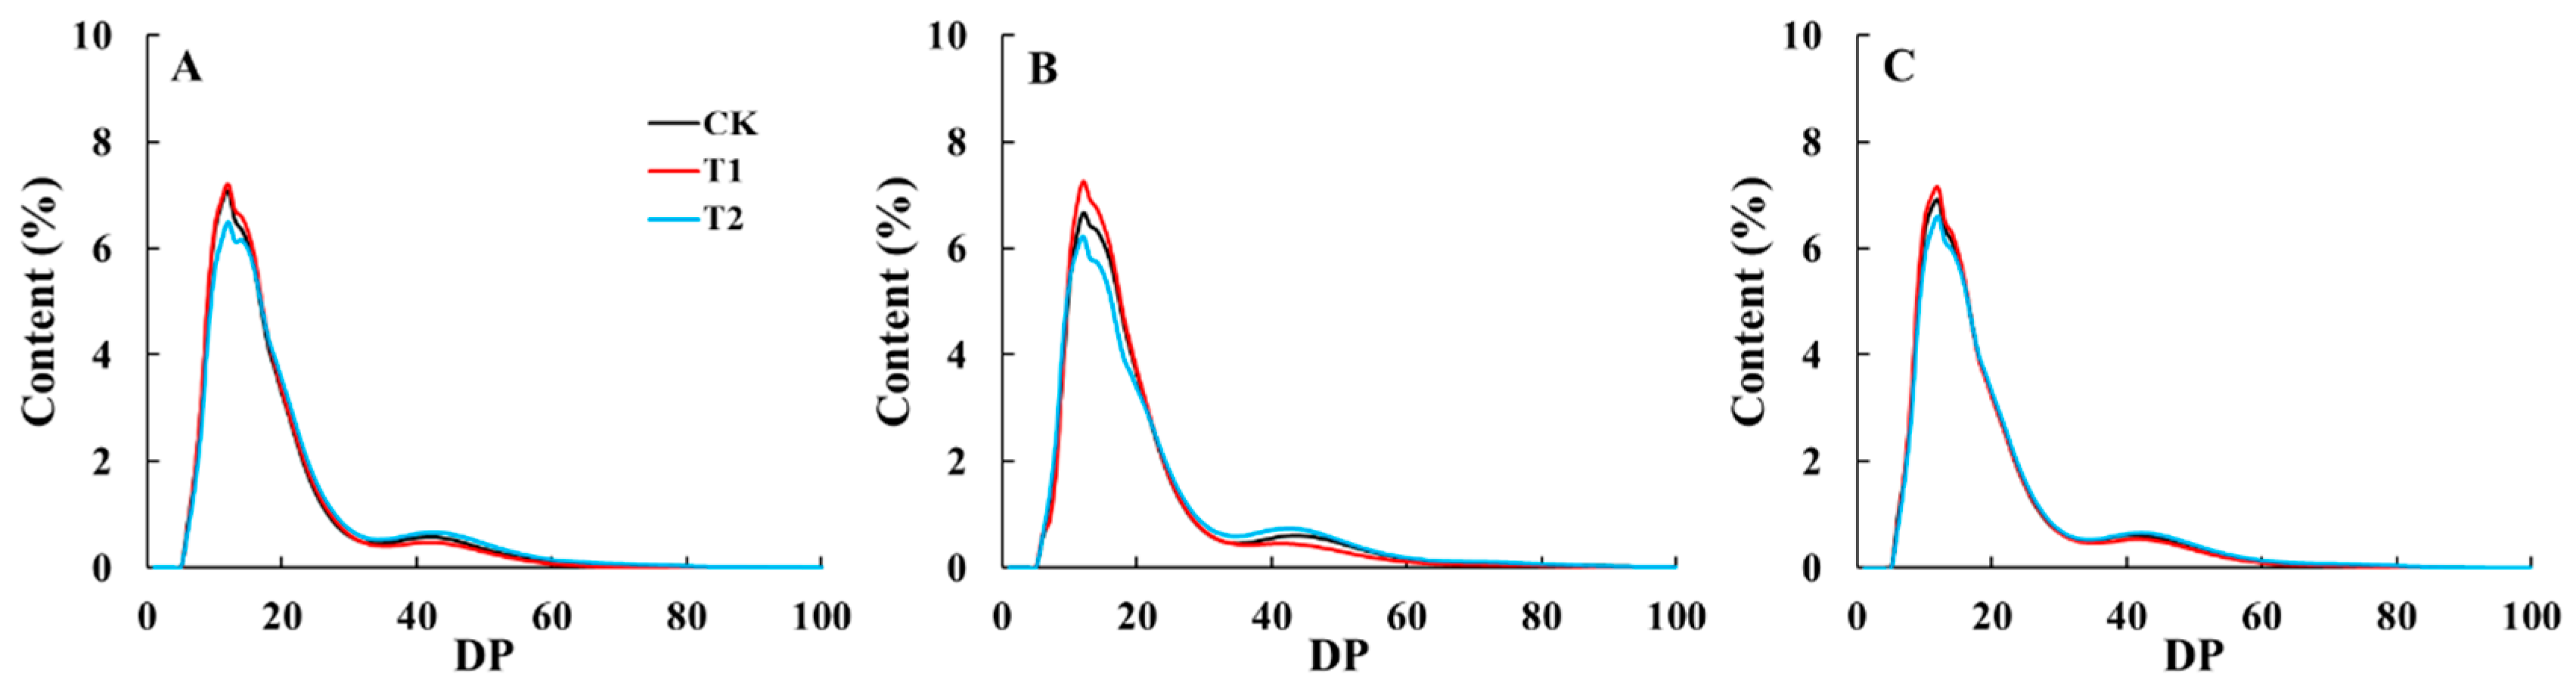
3.5. Chain Length Distribution of Amylopectin
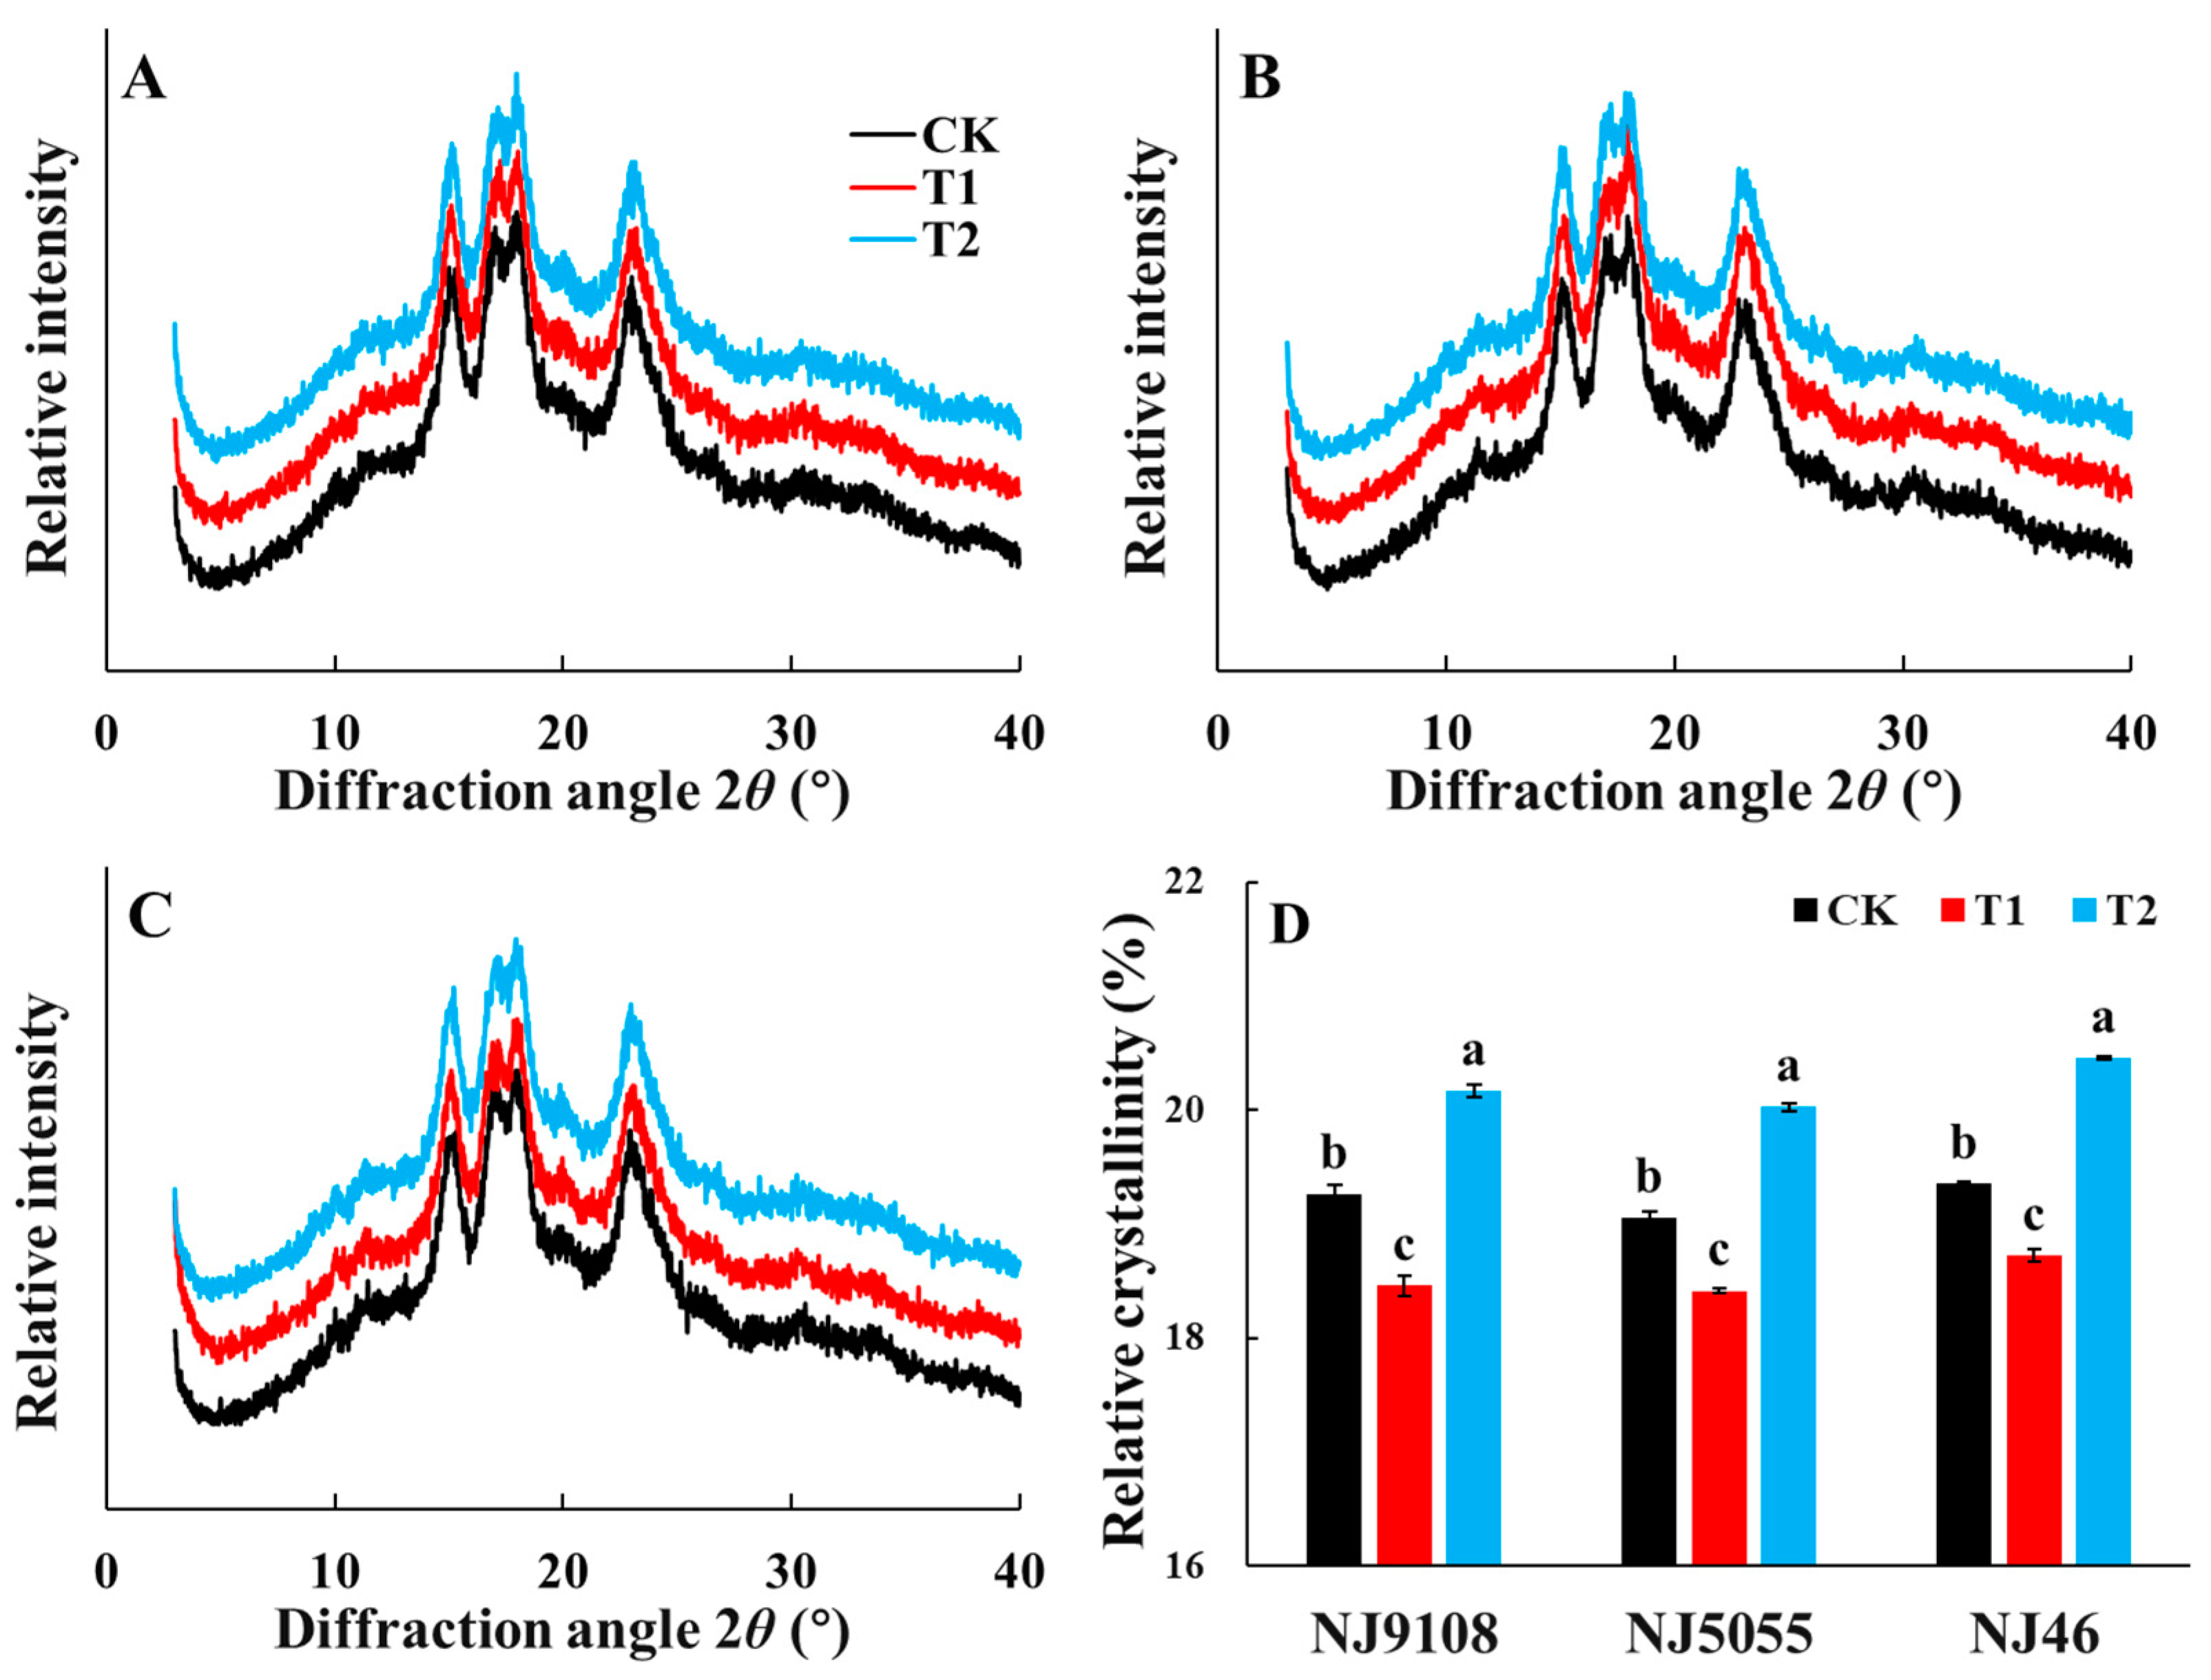
3.6. X-ray Diffraction (XRD) and Relative Crystallinity
3.7. Fourier Transform Infrared (FTIR) Analysis
3.8. Pasting Properties and Thermal Properties of Rice Starch
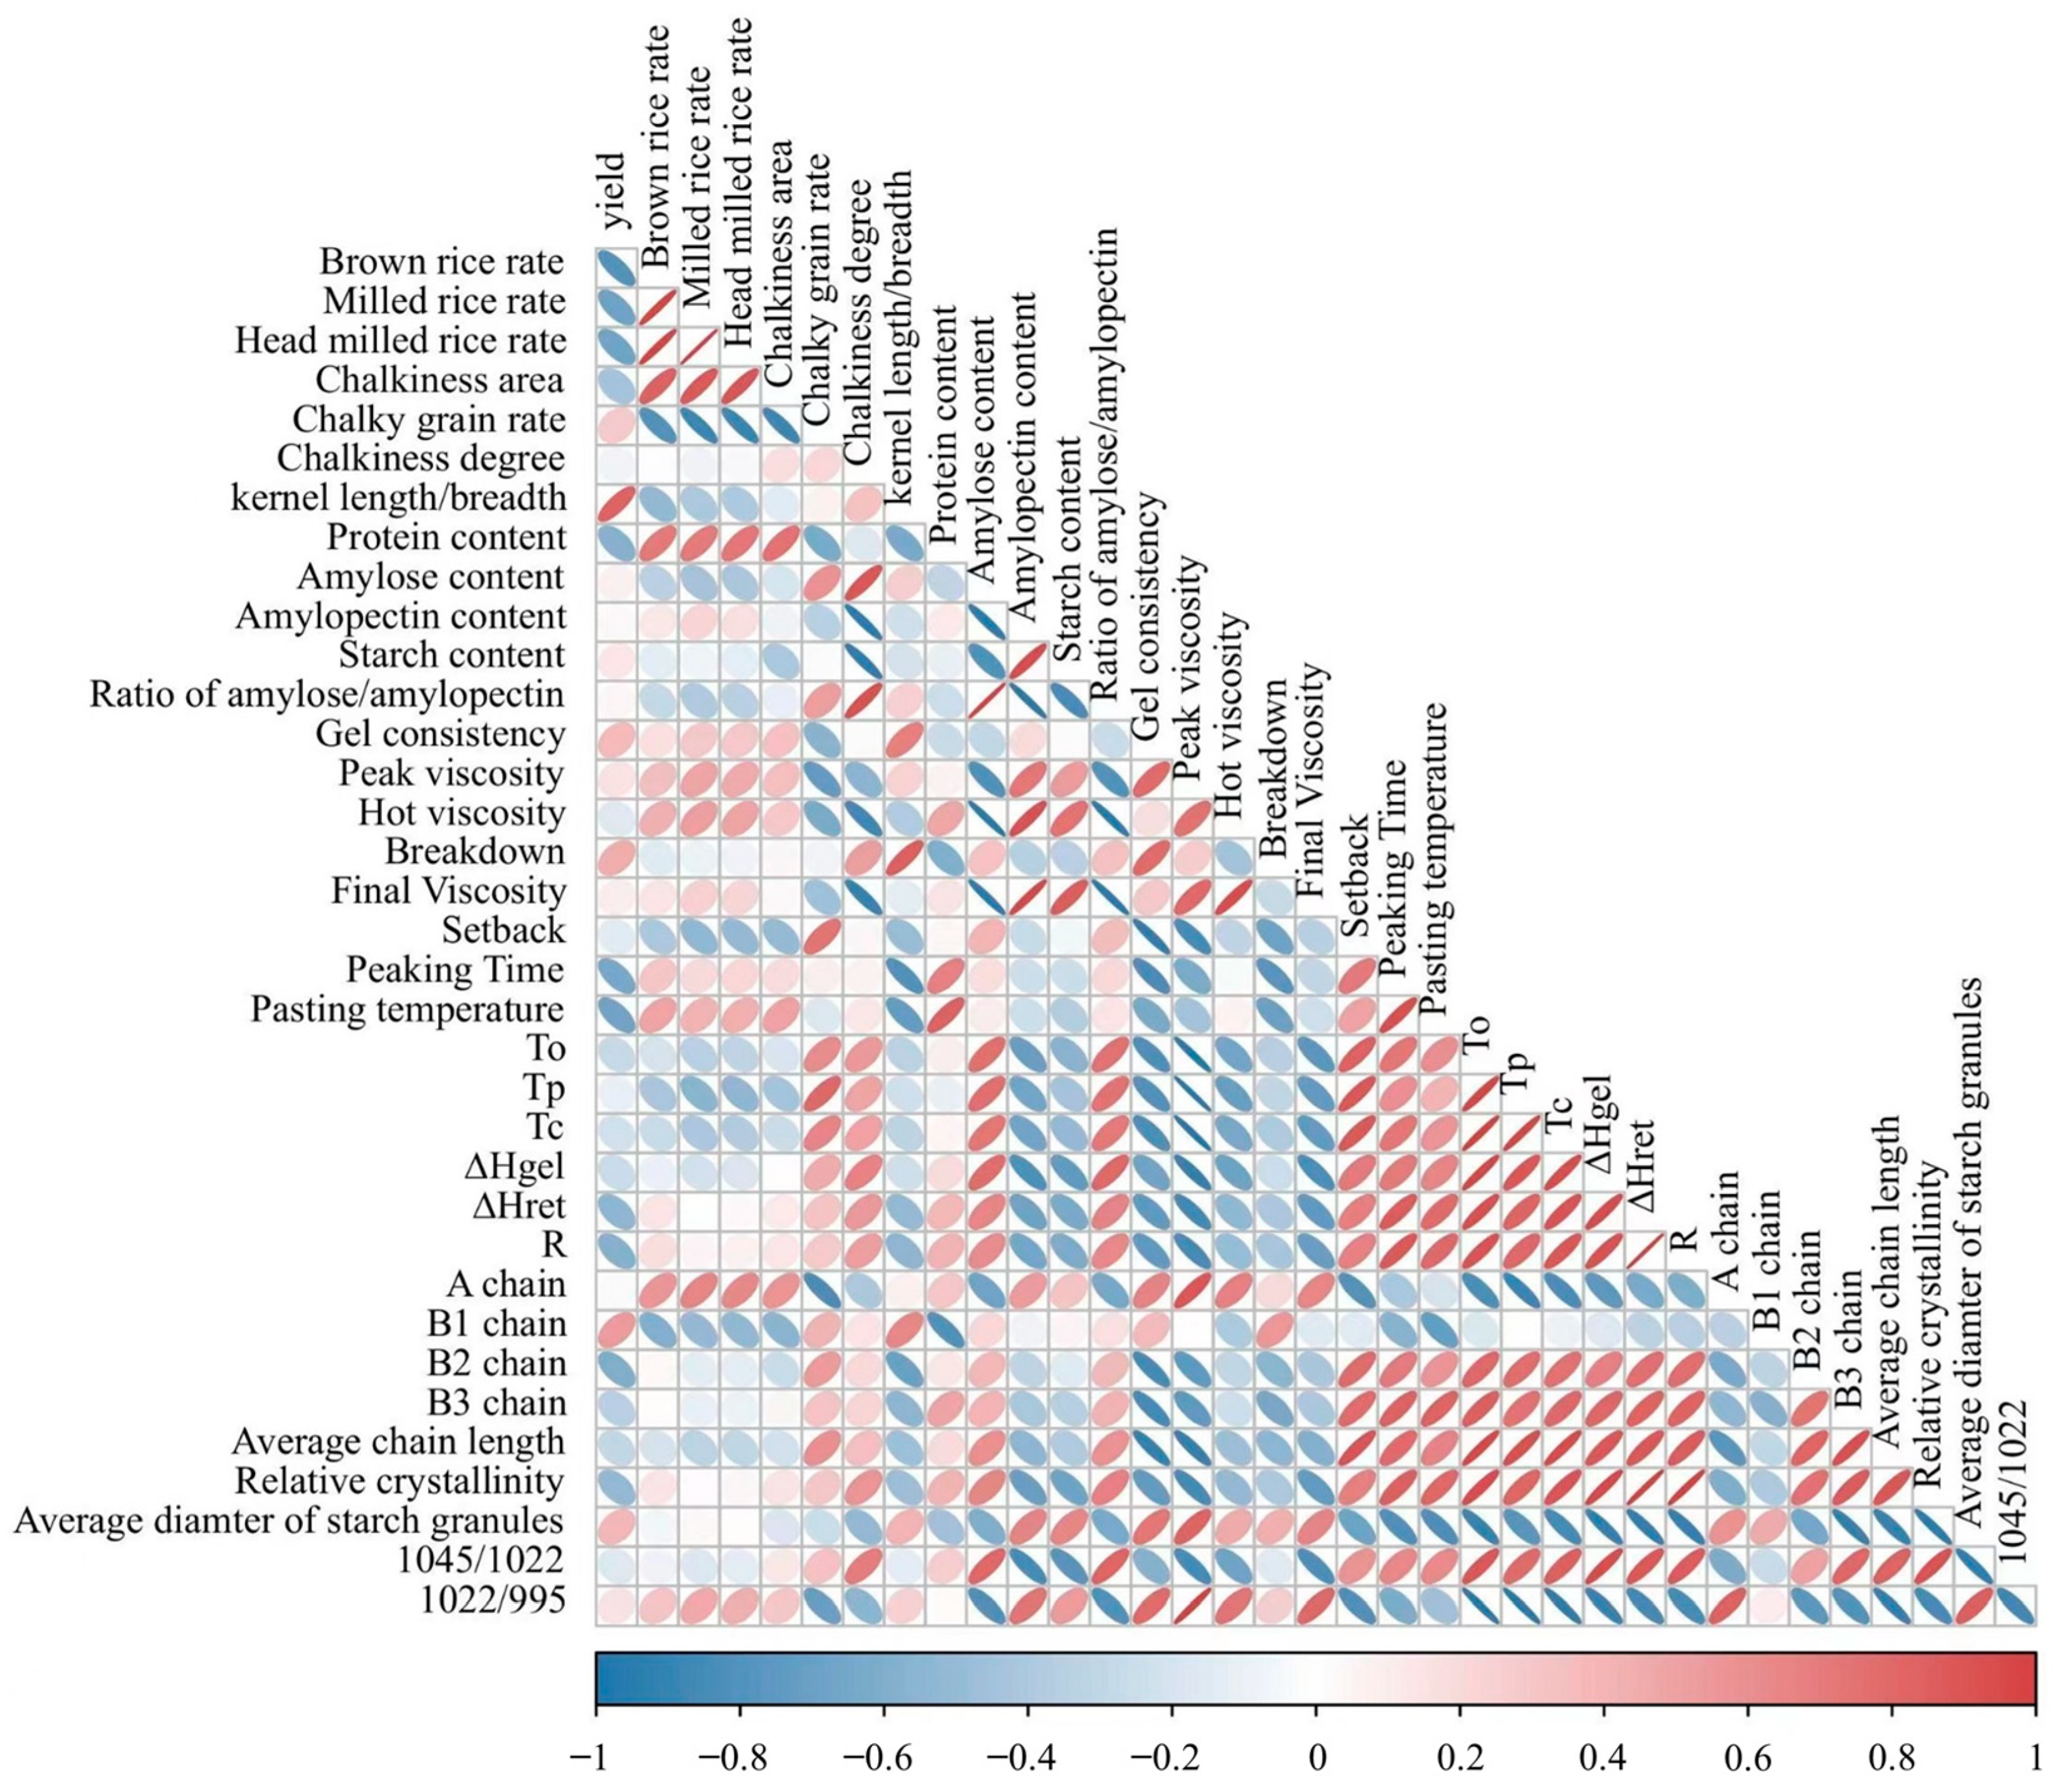
3.9. Relationships between Starch Properties
4. Discussion
4.1. Effects of Salt Stress on Rice Yield and Yield Components
4.2. Effects of Salinity on Appearance and Milling Quality of Rice
4.3. Effects of Salinity on Cooking and Eating Quality and Starch Properties of Rice
5. Conclusions
Author Contributions
Funding
Data Availability Statement
Conflicts of Interest
References
- Timmer, C.P. Food security in Asia and the Pacific: The rapidly changing role of rice. Asia Pac. Policy Stud. 2014, 1, 73–90. [Google Scholar] [CrossRef]
- Krishnan, P.; Ramakrishnan, B.; Reddy, K.R.; Reddy, V.R. High-temperature effects on rice growth, yield, and grain quality. Adv. Agron. 2011, 111, 87–206. [Google Scholar]
- Zhang, R.; Wang, Y.; Hussain, S.; Yang, S.; Li, R.; Liu, S.; Hou, H. Study on the effect of salt stress on yield and grain quality among different rice varieties. Front. Plant Sci. 2022, 13, 918460. [Google Scholar] [CrossRef] [PubMed]
- Qin, H.; Li, Y.; Huang, R. Advances and challenges in the breeding of salt-tolerant rice. Int. J. Mol. Sci. 2020, 21, 8385. [Google Scholar] [CrossRef] [PubMed]
- Devkota, K.P.; Devkota, M.; Rezaei, M.; Oosterbaan, R. Managing salinity for sustainable agricultural production in salt-affected soils of irrigated drylands. Agric. Syst. 2022, 198, 103390. [Google Scholar] [CrossRef]
- Zhang, J. Discussion on ecological rehabilitation of salt-affected soils. Res. Soil Water Conserv. 2008, 4, 74–78. [Google Scholar]
- Yang, Y.; Guo, Y. Elucidating the molecular mechanisms mediating plant salt-stress responses. New Phytol. 2018, 217, 523–539. [Google Scholar] [CrossRef] [PubMed]
- Hussain, S.; Zhang, J.; Zhong, C.; Zhu, L.; Cao, X.; Yu, S.; James, A.B.; Jin, Q. Effects of salt stress on rice growth, development characteristics, and the regulating ways: A review. J. Integr. Agric. 2017, 16, 2357–2374. [Google Scholar] [CrossRef]
- Hasegawa, P.M.; Bressan, R.A.; Zhu, J.; Bohnert, H.J. Plant cellular and molecular responses to high salinity. Annu. Rev. Plant Biol. 2000, 51, 463–499. [Google Scholar] [CrossRef]
- Siringam, K.; Juntawong, N.; Cha-um, S.; Kirdmanee, C. Salt stress induced ion accumulation, ion homeostasis, membrane injury and sugar contents in salt-sensitive rice (Oryza sativa L. spp. indica) roots under isoosmotic conditions. Afr. J. Biotechnol. 2011, 10, 1340–1346. [Google Scholar]
- Jung, J.Y.; Shin, R.; Schachtman, D.P. Ethylene mediates response and tolerance to potassium deprivation in Arabidopsis. Plant Cell 2009, 21, 607–621. [Google Scholar] [CrossRef]
- Abdelgadir, E.M.; Oka, M.; Fujiyama, H. Nitrogen nutrition of rice plants under salinity. Biol. Plant. 2005, 49, 99–104. [Google Scholar] [CrossRef]
- Cotsaftis, O.; Plett, D.; Johnson, A.A.; Walia, H.; Wilson, C.; Ismail, A.M.; Baumann, U. Root-specific transcript profiling of contrasting rice genotypes in response to salinity stress. Mol. Plant 2011, 4, 25–41. [Google Scholar] [CrossRef]
- Amirjani, M.R. Effect of salinity stress on growth, sugar content, pigments and enzyme activity of rice. Int. J. Bot. 2011, 7, 73–81. [Google Scholar] [CrossRef]
- Khan, M.A.; Abdullah, Z. Salinity–sodicity induced changes in reproductive physiology of rice (Oryza sativa) under dense soil conditions. Environ. Exp. Bot. 2003, 49, 145–157. [Google Scholar] [CrossRef]
- Abdullah, Z.; Khan, M.A.; Flowers, T.J. Causes of sterility in seed set of rice under salinity stress. J. Agron. Crop Sci. 2001, 187, 25–32. [Google Scholar] [CrossRef]
- Zeng, L.; Shannon, M.C. Effects of salinity on grain yield and yield components of rice at different seeding densities. Agron. J. 2000, 92, 418–423. [Google Scholar] [CrossRef]
- Sangwongchai, W.; Krusong, K.; Thitisaksakul, M. Salt tolerance at vegetative stage is partially associated with changes in grain quality and starch physicochemical properties of rice exposed to salinity stress at reproductive stage. J. Sci. Food Agric. 2022, 102, 370–382. [Google Scholar] [CrossRef] [PubMed]
- Gu, J.; Chen, J.; Chen, L.; Wang, Z.; Zhang, H.; Yang, J. Grain quality changes and responses to nitrogen fertilizer of japonica rice cultivars released in the Yangtze River Basin from the 1950s to 2000s. Crop J. 2015, 3, 285–297. [Google Scholar] [CrossRef]
- Sreenivasulu, N.; Zhang, C.; Tiozon, R.N.; Liu, Q. Post-genomics revolution in the design of premium quality rice in a high-yielding background to meet consumer demands in the 21st century. Plant Commun. 2022, 3, 100271. [Google Scholar] [CrossRef]
- Yao, D.; Wu, J.; Luo, Q.; Li, J.; Zhuang, W.; Xiao, G.; Deng, Q.; Lei, D.; Bai, B. Influence of high natural field temperature during grain filling stage on the morphological structure and physicochemical properties of rice (Oryza sativa L.) starch. Food Chem. 2020, 310, 125817. [Google Scholar] [CrossRef] [PubMed]
- Yao, D.; Wu, J.; Luo, Q.; Zhang, D.; Zhuang, W.; Xiao, G.; Deng, Q.; Bai, B. Effects of salinity stress at reproductive growth stage on rice (Oryza sativa L.) composition, starch structure, and physicochemical properties. Front. Nutr. 2022, 9, 926217. [Google Scholar] [CrossRef] [PubMed]
- Zeng, Y.; Tan, X.; Zeng, Y.; Xie, X.; Pan, X.; Shi, Q.; Zhang, J. Changes in the rice grain quality of different high-quality rice varieties released in southern China from 2007 to 2017. J. Cereal Sci. 2019, 87, 111–116. [Google Scholar] [CrossRef]
- Xu, Z.; Shao, T.; Lv, Z.; Yue, Y.; Liu, A.; Long, X.; Rengel, Z. The mechanisms of improving coastal saline soils by planting rice. Sci. Total Environ. 2020, 703, 135529. [Google Scholar] [CrossRef] [PubMed]
- Wang, C.; Zhang, Y.; Zhu, Z.; Chen, T.; Zhao, Q.; Zhong, W.; Yang, J.; Yao, S.; Zhou, L.; Zhao, L.; et al. Research progress on the breeding of super rice varieties in Jiangsu Province, China. J. Integr. Agric. 2017, 165, 992–999. [Google Scholar] [CrossRef]
- Li, Z.; Zhou, T.; Zhu, K.; Wang, W.; Zhang, W.; Zhang, H.; Liu, L.; Zhang, Z.; Wang, Z.; Wang, B.; et al. Effects of salt stress on grain yield and quality parameters in rice cultivars with differing salt tolerance. Plants 2023, 12, 3243. [Google Scholar] [CrossRef] [PubMed]
- GB/T 17891-1999; High Quality Paddy. China Standard Press: Beijing, China, 1999.
- Wei, C.; Jiang, J.; Liu, C.; Fang, X.; Zhou, T.; Xue, Z.; Wang, W.; Zhang, W.; Zhang, H.; Liu, L.; et al. Effects of source strength and sink size on starch metabolism, starch properties and grain quality of rice (Oryza sativa L.). Agronomy 2023, 13, 1288. [Google Scholar] [CrossRef]
- Syahariza, Z.A.; Li, E.; Hasjim, J. Extraction and dissolution of starch from rice and sorghum grains for accurate structural analysis. Carbohydr. Polym. 2010, 82, 14–20. [Google Scholar] [CrossRef]
- Tran, T.T.; Shelat, K.J.; Tang, D.; Li, E.; Gilbert, R.G.; Hasjim, J. Milling of rice grains. The degradation on three structural levels of starch in rice flour can be independently controlled during grinding. J. Agric. Food Chem. 2011, 59, 3964–3973. [Google Scholar] [CrossRef]
- Zhou, T.; Li, Z.; Li, E.; Wang, W.; Yuan, L.; Zhang, H.; Liu, L.; Wang, Z.; Gu, J.; Yang, J. Optimization of nitrogen fertilization improves rice quality by affecting the structure and physicochemical properties of starch at high yield levels. J. Integr. Agric. 2022, 21, 1576–1592. [Google Scholar]
- Wu, A.C.; Li, E.; Gilbert, R.G. Exploring extraction/dissolution procedures for analysis of starch chain-length distributions. Carbohydr. Polym. 2014, 114, 36–42. [Google Scholar] [CrossRef] [PubMed]
- Gay, F.; Maraval, I.; Roques, S.; Gunata, Z.; Boulanger, R.; Audebert, A.; Mestres, C. Effect of salinity on yield and 2-acetyl-1-pyrroline content in the grains of three fragrant rice cultivars (Oryza sativa L.) in Camargue (France). Field Crop. Res. 2010, 117, 154–160. [Google Scholar] [CrossRef]
- Wang, J.; Dai, Q.; Shang, J.; Jin, X.; Sun, Q.; Zhou, G.; Dai, Q. Field-scale rice yield estimation using sentinel-1A synthetic aperture radar (SAR) data in coastal saline region of Jiangsu Province, China. Remote Sens. 2019, 11, 2274. [Google Scholar] [CrossRef]
- Bhatt, M.M.; Patel, D.B.; Sasidharan, N.; Jadeja, G.C. Salinity resistance studies in rice (Oryza sativa L.). Res. Crop. 2008, 9, 215–218. [Google Scholar]
- Ashraf, M.; Athar, H.R.; Harris, P.J.; Kwon, T.R. Some prospective strategies for improving crop salt tolerance. Adv. Agron. 2008, 97, 45–110. [Google Scholar]
- Hakim, M.A.; Juraimi, A.S.; Hanafi, M.M.; Ali, E.; Ismail, M.R.; Selamat, A.; Karim, S.R. Effect of salt stress on morpho-physiology, vegetative growth and yield of rice. J. Environ. Biol. 2014, 35, 317. [Google Scholar]
- Lee, C.K.; Yoon, Y.H.; Shin, J.C.; Lee, B.W.; Kim, C.K. Growth and yield of rice as affected by saline water treatment at different growth stages. Korean J. Crop Sci. 2002, 47, 402–408. [Google Scholar]
- Yoshioka, Y.; Iwata, H.; Tabata, M.; Ninomiya, S.; Ohsawa, R. Chalkiness in rice: Potential for evaluation with image analysis. Crop Sci. 2007, 47, 2113–2120. [Google Scholar] [CrossRef]
- Rao, P.S.; Mishra, B.; Gupta, S.R. Effects of soil salinity and alkalinity on grain quality of tolerant, semi-tolerant and sensitive rice genotypes. Rice Sci. 2013, 20, 284–291. [Google Scholar] [CrossRef]
- Liu, Q.; Tao, Y.; Cheng, S.; Zhou, L.; Tian, J.; Xing, Z.; Liu, G.; Wei, H.; Zhang, H. Relating amylose and protein contents to eating quality in 105 varieties of Japonica rice. Cereal Chem. 2020, 97, 1303–1312. [Google Scholar] [CrossRef]
- Wang, L.; Zhang, L.; Wang, H.; Ai, L.Z.; Xiong, W. Insight into protein-starch ratio on the gelatinization and retrogradation characteristics of reconstituted rice flour. Int. J. Biol. Macromol. 2020, 146, 524–529. [Google Scholar] [CrossRef]
- Martin, M.; Fitzgerald, M.A. Proteins in rice grains influence cooking properties! J. Cereal Sci. 2002, 36, 285–294. [Google Scholar] [CrossRef]
- Li, H.; Prakash, S.; Nicholson, T.M.; Fitzgerald, M.A.; Gilbert, R.G. Instrumental measurement of cooked rice texture by dynamic rheological testing and its relation to the fine structure of rice starch. Carbohydr. Polym. 2016, 146, 253–263. [Google Scholar] [CrossRef]
- Li, H.; Wen, Y.; Wang, J.; Sun, B. The molecular structures of leached starch during rice cooking are controlled by thermodynamic effects, rather than kinetic effects. Food Hydrocolloids 2017, 73, 295–299. [Google Scholar] [CrossRef]
- Thitisaksakul, M.; Tananuwong, K.; Shoemaker, C.F.; Chun, A.; Tanadul, O.U.; Labavitch, J.M.; Beckles, D.M. Effects of timing and severity of salinity stress on rice (Oryza sativa L.) yield, grain composition, and starch functionality. J. Agric. Food Chem. 2015, 63, 2296–2304. [Google Scholar] [CrossRef] [PubMed]
- Li, H.; Gilbert, R.G. Starch molecular structure: The basis for an improved understanding of cooked rice texture. Carbohydr. Polym. 2018, 195, 9–17. [Google Scholar] [CrossRef] [PubMed]
- Li, P.; Chen, Y.; Lu, J.; Zhang, C.; Liu, Q.; Li, Q. Genes and their molecular functions determining seed structure, components, and quality of rice. Rice 2022, 15, 18. [Google Scholar] [CrossRef] [PubMed]
- Yu, J.; Wang, K.; Beckles, D.M. Starch branching enzymes as putative determinants of postharvest quality in horticultural crops. BMC Plant Biol. 2021, 21, 479. [Google Scholar] [CrossRef]
- Lin, L.; Cai, C.; Gilbert, R.G.; Li, E.; Wang, J.; Wei, C. Relationships between amylopectin molecular structures and functional properties of different-sized fractions of normal and high-amylose maize starches. Food Hydrocolloids 2016, 52, 359–368. [Google Scholar] [CrossRef]
- Jalal, A.; de Oliveira Junior, J.C.; Ribeiro, J.S.; Fernandes, G.C.; Mariano, G.G.; Trindade, V.D.R.; Dos Reis, A.R. Hormesis in plants: Physiological and biochemical responses. Ecotoxicol. Environ. Safe 2021, 207, 111225. [Google Scholar] [CrossRef] [PubMed]
- Erofeeva, E.A. Hormesis in plants: Its common occurrence across stresses. Curr. Opin. Toxicol. 2022, 30, 100333. [Google Scholar] [CrossRef]


| Year/Cultivar | Treatment | Number of Panicles per Pot | Number of Spikelets per Panicle | Total Spikelets per Pot | Filled Grains (%) | 1000-Grain Weight (g) | Grain Yield (g pot−1) |
|---|---|---|---|---|---|---|---|
| 2019/NJ 9108 | CK | 21.33 ± 0.58 a | 125.09 ± 0.64 a | 2668.27 ± 58.64 a | 93.28 ± 0.14 a | 26.28 ± 0.05 a | 65.40 ± 1.24 a |
| T1 | 18.67 ± 0.58 b | 119.63 ± 0.60 b | 2232.86 ± 58.13 b | 90.27 ± 0.06 b | 25.91 ± 0.04 b | 52.23 ± 1.25 b | |
| T2 | 14.67 ± 0.58 c | 110.71 ± 0.44 c | 1623.58 ± 57.73 c | 80.41 ± 0.21 c | 24.36 ± 0.21 c | 31.80 ± 0.97 c | |
| 2019/NJ 5055 | CK | 20.33 ± 0.58 a | 120.40 ± 0.14 a | 2448.25 ± 72.32 a | 90.62 ± 0.25 a | 24.85 ± 0.01 a | 55.14 ± 1.48 a |
| T1 | 17.67 ± 0.58 b | 114.32 ± 0.04 b | 2019.71 ± 65.91 b | 85.26 ± 0.10 b | 24.13 ± 0.02 b | 41.56 ± 1.40 b | |
| T2 | 13.33 ± 0.58 c | 107.26 ± 1.67 c | 1429.49 ± 39.08 c | 78.23 ± 0.22 c | 23.56 ± 0.01 c | 26.34 ± 0.65 c | |
| 2019/NJ 46 | CK | 21.67 ± 0.58 a | 134.41 ± 1.76 a | 2911.61 ± 39.99 a | 94.12 ± 0.10 a | 26.12 ± 0.03 a | 71.59 ± 0.85 a |
| T1 | 19.67 ± 0.58 b | 129.21 ± 1.01 b | 2540.76 ± 56.32 b | 90.58 ± 0.12 b | 25.48 ± 0.01 b | 58.64 ± 1.26 b | |
| T2 | 15.33 ± 0.58 c | 115.46 ± 0.10 c | 1770.37 ± 68.06 c | 83.31 ± 0.17 c | 24.86 ± 0.01 c | 36.67 ± 1.47 c | |
| 2020/NJ 9108 | CK | 21.00 ± 0.00 a | 126.55 ± 0.37 a | 2657.62 ± 7.76 a | 92.59 ± 0.06 a | 26.22 ± 0.10 a | 65.40 ± 1.24 a |
| T1 | 18.33 ± 0.58 b | 119.63 ± 0.95 b | 2192.92 ± 51.83 b | 88.51 ± 0.13 b | 25.83 ± 0.05 b | 52.23 ± 1.25 b | |
| T2 | 14.33 ± 0.58 c | 112.68 ± 0.16 c | 1615.14 ± 67.22 c | 78.94 ± 0.08 c | 24.59 ± 0.03 c | 31.80 ± 0.97 c | |
| 2020/NJ 5055 | CK | 20.00 ± 0.00 a | 122.44 ± 0.21 a | 2448.87 ± 4.20 a | 89.20 ± 0.04 a | 24.75 ± 0.03 a | 55.14 ± 1.48 a |
| T1 | 17.67 ± 0.58 b | 114.86 ± 0.28 b | 2029.18 ± 65.91 b | 84.53 ± 0.18 b | 24.02 ± 0.01 b | 41.56 ± 1.40 b | |
| T2 | 12.67 ± 0.58 c | 110.67 ± 0.52 c | 1401.81 ± 65.37 c | 76.99 ± 0.65 c | 23.20 ± 0.04 c | 26.34 ± 0.65 c | |
| 2020/NJ 46 | CK | 21.33 ± 0.58 a | 133.27 ± 1.76 a | 2842.34 ± 38.73 a | 93.25 ± 0.09 a | 25.97 ± 0.07 a | 71.59 ± 0.85 a |
| T1 | 19.33 ± 0.58 b | 128.50 ± 1.61 b | 2483.78 ± 42.68 b | 89.42 ± 0.05 b | 25.32 ± 0.04 b | 58.64 ± 1.26 b | |
| T2 | 15.00 ± 0.00 c | 116.28 ± 0.34 c | 1744.25 ± 5.09 c | 82.23 ± 0.19 c | 24.72 ± 0.01 c | 36.67 ± 1.47 c | |
| Analysis of variance | |||||||
| Year (Y) | * | ** | NS | ** | ** | ** | |
| Cultivar (C) | ** | ** | ** | ** | ** | ** | |
| Treatment (T) | ** | ** | ** | ** | ** | ** | |
| Y × C | NS | ** | NS | NS | ** | NS | |
| Y × T | NS | ** | NS | NS | NS | NS | |
| C × T | NS | ** | ** | ** | ** | ** | |
| Y × C × T | * | ** | NS | ** | ** | ** | |
| Year/Cultivar | Treatment | Brown Rice (%) | Milled Rice (%) | Head Milled Rice (%) | Chalky Area (%) | Chalky Kernel (%) | Chalkiness (%) | Kernel Length/Width |
|---|---|---|---|---|---|---|---|---|
| 2019/NJ 9108 | CK | 88.17 ± 0.06 c | 78.36 ± 0.12 c | 71.13 ± 0.08 c | 20.42 ± 0.06 b | 10.22 ± 0.04 b | 3.16 ± 0.05 b | 1.55 ± 0.01 a |
| T1 | 88.97 ± 0.01 b | 79.66 ± 0.09 b | 72.57 ± 0.02 b | 19.34 ± 0.09 c | 9.51 ± 0.04 c | 2.56 ± 0.02 c | 1.53 ± 0.01 b | |
| T2 | 89.52 ± 0.11 a | 80.28 ± 0.11 a | 73.71 ± 0.06 a | 21.40 ± 0.02 a | 10.44 ± 0.07 a | 4.25 ± 0.03 a | 1.51 ± 0.01 c | |
| 2019/NJ 5055 | CK | 88.39 ± 0.03 c | 78.74 ± 0.09 c | 71.44 ± 0.02 c | 19.40 ± 0.06 b | 9.93 ± 0.07 b | 0.91 ± 0.03 b | 1.50 ± 0.01 a |
| T1 | 89.07 ± 0.05 b | 79.87 ± 0.05 b | 72.77 ± 0.08 b | 18.62 ± 0.07 c | 9.31 ± 0.03 c | 0.67 ± 0.01 c | 1.49 ± 0.01 a | |
| T2 | 89.78 ± 0.05 a | 80.55 ± 0.09 a | 73.90 ± 0.03 a | 20.26 ± 0.04 a | 10.10 ± 0.04 a | 1.54 ± 0.09 a | 1.45 ± 0.01 b | |
| 2019/NJ 46 | CK | 86.00 ± 0.13 c | 75.70 ± 0.17 c | 67.19 ± 0.04 c | 15.52 ± 0.09 b | 20.34 ± 0.11 b | 2.41 ± 0.05 b | 1.53 ± 0.01 a |
| T1 | 87.02 ± 0.09 b | 76.56 ± 0.02 b | 68.29 ± 0.07 b | 14.76 ± 0.11 c | 19.23 ± 0.07 c | 1.91 ± 0.05 c | 1.52 ± 0.01 a | |
| T2 | 87.94 ± 0.08 a | 77.07 ± 0.06 a | 69.10 ± 0.09 a | 16.37 ± 0.03 a | 21.42 ± 0.08 a | 3.21 ± 0.11 a | 1.47 ± 0.01 b | |
| 2020/NJ 9108 | CK | 88.29 ± 0.06 c | 78.49 ± 0.04 c | 71.20 ± 0.06 c | 20.58 ± 0.06 b | 10.33 ± 0.05 b | 3.36 ± 0.10 b | 1.55 ± 0.00 a |
| T1 | 88.99 ± 0.13 b | 79.71 ± 0.11 b | 72.66 ± 0.11 b | 19.52 ± 0.07 c | 9.66 ± 0.03 c | 2.66 ± 0.04 c | 1.53 ± 0.01 b | |
| T2 | 89.58 ± 0.13 a | 80.33 ± 0.07 a | 73.88 ± 0.05 a | 21.48 ± 0.04 a | 10.48 ± 0.03 a | 4.35 ± 0.03 a | 1.50 ± 0.01 c | |
| 2020/NJ 5055 | CK | 88.42 ± 0.03 c | 78.79 ± 0.09 c | 71.58 ± 0.04 c | 19.70 ± 0.03 b | 10.15 ± 0.02 b | 0.96 ± 0.04 b | 1.50 ± 0.01 a |
| T1 | 89.20 ± 0.04 b | 79.89 ± 0.06 b | 72.90 ± 0.03 b | 18.74 ± 0.03 c | 9.49 ± 0.03 c | 0.71 ± 0.03 c | 1.50 ± 0.01 a | |
| T2 | 89.81 ± 0.07 a | 80.58 ± 0.08 a | 74.03 ± 0.08 a | 20.41 ± 0.05 a | 10.32 ± 0.04 a | 1.66 ± 0.02 a | 1.45 ± 0.00 b | |
| 2020/NJ 46 | CK | 86.12 ± 0.10 c | 75.68 ± 0.20 c | 67.27 ± 0.05 c | 15.64 ± 0.06 b | 20.63 ± 0.04 b | 2.46 ± 0.02 b | 1.54 ± 0.01 a |
| T1 | 87.09 ± 0.09 b | 76.66 ± 0.03 b | 68.42 ± 0.03 b | 14.90 ± 0.10 c | 19.38 ± 0.06 c | 2.01 ± 0.04 c | 1.52 ± 0.01 b | |
| T2 | 87.98 ± 0.09 a | 77.17 ± 0.05 a | 69.38 ± 0.05 a | 16.83 ± 0.05 a | 21.79 ± 0.12 a | 3.55 ± 0.04 a | 1.48 ± 0.01 c | |
| Analysis of variance | ||||||||
| Year (Y) | ** | * | ** | ** | ** | ** | NS | |
| Cultivar (C) | ** | ** | ** | ** | ** | ** | ** | |
| Treatment (T) | ** | ** | ** | ** | ** | ** | ** | |
| Y × C | NS | NS | NS | NS | ** | * | NS | |
| Y × T | NS | NS | * | NS | NS | ** | NS | |
| C × T | ** | ** | ** | ** | ** | ** | ** | |
| Y × C × T | NS | NS | NS | ** | * | ** | NS | |
| Year/Cultivar | Treatment | Protein Content (%) | Amylose Content (%) | Amylopectin Content (%) | Starch Content (%) | Ratio of Amylose/Amylopectin | Gel Consistency (mm) |
|---|---|---|---|---|---|---|---|
| 2019/NJ 9108 | CK | 8.29 ± 0.04 b | 14.21 ± 0.05 b | 64.36 ± 0.08 b | 78.56 ± 0.12 b | 0.22 ± 0.00 b | 84.40 ± 0.04 b |
| T1 | 7.86 ± 0.03 c | 13.60 ± 0.05 c | 66.31 ± 0.14 a | 79.91 ± 0.19 a | 0.21 ± 0.00 c | 85.48 ± 0.19 a | |
| T2 | 8.47 ± 0.02 a | 14.60 ± 0.02 a | 63.30 ± 0.14 c | 77.89 ± 0.15 c | 0.23 ± 0.00 a | 83.28 ± 0.11 c | |
| 2019/NJ 5055 | CK | 8.87 ± 0.05 b | 12.36 ± 0.09 b | 68.27 ± 0.08 b | 80.64 ± 0.10 b | 0.18 ± 0.00 b | 82.33 ± 0.15 b |
| T1 | 8.21 ± 0.08 c | 11.54 ± 0.08 c | 69.81 ± 0.15 a | 81.36 ± 0.08 a | 0.17 ± 0.00 c | 83.65 ± 0.19 a | |
| T2 | 9.34 ± 0.02 a | 13.06 ± 0.05 a | 66.83 ± 0.17 c | 79.89 ± 0.19 c | 0.20 ± 0.00 a | 80.45 ± 0.05 c | |
| 2019/NJ 46 | CK | 7.64 ± 0.05 b | 14.46 ± 0.09 b | 65.35 ± 0.12 b | 79.81 ± 0.19 b | 0.22 ± 0.00 b | 81.49 ± 0.15 b |
| T1 | 7.14 ± 0.02 c | 13.60 ± 0.05 c | 66.90 ± 0.07 a | 80.50 ± 0.11 a | 0.20 ± 0.00 c | 83.14 ± 0.08 a | |
| T2 | 8.04 ± 0.02 a | 15.22 ± 0.09 a | 63.99 ± 0.14 c | 79.21 ± 0.08 c | 0.24 ± 0.00 a | 79.23 ± 0.09 c | |
| 2020/NJ 9108 | CK | 8.36 ± 0.03 b | 14.19 ± 0.12 b | 64.53 ± 0.13 b | 78.72 ± 0.10 b | 0.22 ± 0.00 b | 84.12 ± 0.03 b |
| T1 | 7.90 ± 0.01 c | 13.55 ± 0.07 c | 66.80 ± 0.08 a | 80.35 ± 0.14 a | 0.20 ± 0.00 c | 85.58 ± 0.08 a | |
| T2 | 8.54 ± 0.02 a | 14.66 ± 0.03 a | 63.53 ± 0.12 c | 78.19 ± 0.10 c | 0.23 ± 0.00 a | 83.15 ± 0.08 c | |
| 2020/NJ 5055 | CK | 8.91 ± 0.02 b | 12.44 ± 0.05 b | 68.18 ± 0.04 b | 80.63 ± 0.09 b | 0.18 ± 0.00 b | 82.20 ± 0.14 b |
| T1 | 8.31 ± 0.07 c | 11.52 ± 0.15 c | 69.42 ± 0.11 a | 80.94 ± 0.20 a | 0.17 ± 0.00 c | 83.33 ± 0.10 a | |
| T2 | 9.48 ± 0.02 a | 13.10 ± 0.02 a | 66.50 ± 0.17 c | 79.61 ± 0.17 c | 0.20 ± 0.00 a | 80.64 ± 0.26 c | |
| 2020/NJ 46 | CK | 7.71 ± 0.02 b | 14.53 ± 0.15 b | 65.29 ± 0.16 b | 79.82 ± 0.10 b | 0.22 ± 0.00 b | 81.51 ± 0.20 b |
| T1 | 7.24 ± 0.02 c | 13.53 ± 0.13 c | 67.07 ± 0.10 a | 80.59 ± 0.19 a | 0.20 ± 0.00 c | 83.29 ± 0.15 a | |
| T2 | 8.14 ± 0.01 a | 15.47 ± 0.24 a | 63.91 ± 0.12 c | 79.38 ± 0.31 c | 0.24 ± 0.00 a | 79.37 ± 0.27 c | |
| Analysis of variance | |||||||
| Year (Y) | ** | NS | NS | NS | NS | NS | |
| Cultivar (C) | ** | ** | ** | ** | ** | ** | |
| Treatment (T) | ** | ** | ** | ** | ** | ** | |
| Y × C | NS | NS | ** | ** | NS | NS | |
| Y × T | NS | NS | NS | NS | NS | NS | |
| C × T | ** | ** | ** | ** | ** | ** | |
| Y × C × T | NS | NS | * | NS | NS | * | |
| Year/Cultivar | Treatment | A-Chain Content (%) | B1-Chain Content (%) | B2-Chain Content (%) | B3-Chain Content (%) | Average Chain Length (DP) | Degree of Branching (%) |
|---|---|---|---|---|---|---|---|
| 2019/NJ 9108 | CK | 30.98 ± 0.02 b | 49.36 ± 0.03 c | 8.61 ± 0.02 c | 11.05 ± 0.02 b | 19.60 ± 0.02 b | 5.11 ± 0.01 b |
| T1 | 31.36 ± 0.03 a | 51.23 ± 0.03 a | 8.81 ± 0.02 b | 8.60 ± 0.04 c | 18.64 ± 0.02 c | 5.38 ± 0.01 a | |
| T2 | 27.46 ± 0.02 c | 50.32 ± 0.02 b | 9.92± 0.02 a | 12.31 ± 0.03 a | 20.41 ± 0.01 a | 4.91 ± 0.01 c | |
| 2019/NJ 5055 | CK | 29.85 ± 0.02 b | 48.14 ± 0.02 b | 9.43 ± 0.02 b | 12.58 ± 0.01 b | 19.76 ± 0.01 b | 5.07 ± 0.01 b |
| T1 | 31.98 ± 0.02 a | 48.66 ± 0.05 a | 9.34 ± 0.01 c | 10.02 ± 0.03 c | 19.18 ± 0.05 c | 5.21 ± 0.00 a | |
| T2 | 28.83 ± 0.01 c | 48.13 ± 0.03 b | 9.94 ± 0.03 a | 13.10 ± 0.01 a | 20.72 ± 0.03 a | 4.83 ± 0.00 c | |
| 2019/NJ 46 | CK | 25.55 ± 0.01 c | 52.32 ± 0.02 b | 9.43 ± 0.03 c | 12.69 ± 0.05 b | 20.93 ± 0.03 b | 4.78 ± 0.01 b |
| T1 | 27.10 ± 0.04 a | 54.49 ± 0.03 a | 9.51 ± 0.02 b | 8.90 ± 0.08 c | 19.42 ± 0.06 c | 5.15 ± 0.01 a | |
| T2 | 26.26 ± 0.03 b | 47.86 ± 0.02 c | 11.09 ± 0.05 a | 14.79 ± 0.06 a | 21.76 ± 0.02 a | 4.61 ± 0.01 c |
| Year/Cultivar | Treatment | Peak Viscosity (cP) | Hot Viscosity (cP) | Breakdown (cP) | Final Viscosity (cP) | Setback (cP) | Peaking Time (s) | Pasting Temperature (°C) |
|---|---|---|---|---|---|---|---|---|
| 2019/NJ 9108 | CK | 2512.33 ± 18.50 b | 1354.67 ± 2.52 b | 1157.67 ± 16.01 b | 1900.33 ± 5.13 b | −612.00 ± 13.53 b | 6.30 ± 0.06 b | 71.69 ± 0.07 b |
| T1 | 2658.33 ± 11.72 a | 1421.67 ± 9.07 a | 1236.67 ± 3.51 a | 1932.00 ± 15.39 a | −726.33 ± 4.04 c | 6.10 ± 0.03 c | 70.56 ± 0.08 c | |
| T2 | 2408.33 ± 10.02 c | 1295.00 ± 8.19 c | 1113.33 ± 2.08 c | 1831.00 ± 17.06 c | −577.33 ± 7.09 a | 6.49 ± 0.02 a | 72.86 ± 0.03 a | |
| 2019/NJ 5055 | CK | 2584.33 ± 9.07 b | 1633.33 ± 5.51 b | 951.00 ± 3.61 b | 2033.33 ± 5.03 b | −551.00 ± 4.36 b | 6.43 ± 0.04 b | 72.32 ± 0.05 b |
| T1 | 2710.33 ± 10.97 a | 1717.67 ± 3.79 a | 992.67 ± 8.39 a | 2102.33 ± 4.73 a | −608.00 ± 6.24 c | 6.26 ± 0.06 c | 71.56 ± 0.10 c | |
| T2 | 2420.00 ± 13.89 c | 1557.33 ± 4.16 c | 862.67 ± 15.82 c | 1937.67 ± 3.51 c | −482.33 ± 11.37 a | 6.83 ± 0.06 a | 73.50 ± 0.16 a | |
| 2019/NJ 46 | CK | 2357.00 ± 9.54 b | 1318.33 ± 14.29 b | 1038.67 ± 4.93 b | 1902.00 ± 9.85 b | −455.00 ± 1.73 b | 6.37 ± 0.12 b | 71.57 ± 0.09 b |
| T1 | 2468.00 ± 10.54 a | 1363.00 ± 9.54 a | 1105.00 ± 2.00 a | 1939.33 ± 6.11 a | −528.67 ± 4.93 c | 6.23 ± 0.06 b | 70.47 ± 0.17 c | |
| T2 | 2216.00 ± 1.00 c | 1233.67 ± 5.51 c | 982.33 ± 4.51 c | 1825.33 ± 9.02 c | −390.67 ± 8.02 a | 6.63 ± 0.06 a | 72.56 ± 0.10 a | |
| 2020/NJ 9108 | CK | 2487.33 ± 6.03 b | 1350.00 ± 5.29 b | 1137.33 ± 2.52 b | 1889.67 ± 3.06 b | −597.67 ± 3.21 b | 6.23 ± 0.09 b | 71.59 ± 0.07 b |
| T1 | 2638.67 ± 2.52 a | 1404.00 ± 3.61 a | 1234.67 ± 1.53 a | 1928.00 ± 6.00 a | −710.67 ± 3.51 c | 6.14 ± 0.03 b | 70.65 ± 0.05 c | |
| T2 | 2390.00 ± 4.58 c | 1275.33 ± 4.04 c | 1114.67 ± 0.58 c | 1827.67 ± 7.37 c | −562.33 ± 4.04 a | 6.76 ± 0.08 a | 72.38 ± 0.06 a | |
| 2020/NJ 5055 | CK | 2575.67 ± 4.16 b | 1627.00 ± 4.58 b | 948.67 ± 0.58 b | 2023.67 ± 11.59 b | −552.00 ± 7.94 b | 6.43 ± 0.09 b | 72.33 ± 0.16 b |
| T1 | 2685.67 ± 3.06 a | 1710.00 ± 4.58 a | 975.67 ± 1.53 a | 2091.00 ± 3.00 a | −594.67 ± 0.58 c | 6.31 ± 0.07 b | 71.19 ± 0.16 c | |
| T2 | 2422.67 ± 6.51 c | 1548.00 ± 7.00 c | 874.67 ± 0.58 c | 1938.00 ± 13.23 c | −484.67 ± 7.57 a | 6.87 ± 0.10 a | 73.61 ± 0.06 a | |
| 2020/NJ 46 | CK | 2340.00 ± 6.56 b | 1302.33 ± 2.52 b | 1037.67 ± 6.35 b | 1889.00 ± 4.36 b | −451.00 ± 3.61 b | 6.33 ± 0.10 b | 71.60 ± 0.07 b |
| T1 | 2437.33 ± 5.13 a | 1359.00 ± 2.00 a | 1078.33 ± 3.21 a | 1930.67 ± 5.77 a | −506.67 ± 4.04 c | 6.19 ± 0.06 b | 70.38 ± 0.06 c | |
| T2 | 2209.33 ± 7.64 c | 1238.67 ± 7.57 c | 970.67 ± 1.53 c | 1806.00 ± 5.29 c | −403.33 ± 4.04 a | 6.77 ± 0.10 a | 72.50 ± 0.12 a | |
| Analysis of variance | ||||||||
| Year (Y) | ** | ** | ** | ** | ** | * | ** | |
| Cultivar (C) | ** | ** | ** | ** | ** | ** | ** | |
| Treatment (T) | ** | ** | ** | ** | ** | ** | ** | |
| Y × C | NS | ** | ** | ** | * | ** | ** | |
| Y × T | * | NS | ** | NS | ** | ** | NS | |
| C × T | ** | ** | ** | ** | ** | NS | ** | |
| Y × C × T | NS | * | ** | NS | * | NS | ** | |
| Year/Cultivar | Treatment | To (°C) | Tp (°C) | Tc (°C) | ∆Hgel (J/g) | ∆Hret (J/g) | R (%) |
|---|---|---|---|---|---|---|---|
| 2019/NJ 9108 | CK | 61.35 ± 0.04 b | 66.52 ± 0.15 b | 75.70 ± 0.17 b | 9.16 ± 0.05 b | 1.85 ± 0.01 b | 20.23 ± 0.08 b |
| T1 | 60.30 ± 0.05 c | 65.26 ± 0.09 c | 74.23 ± 0.13 c | 8.84 ± 0.01 c | 1.64 ± 0.02 c | 18.51 ± 0.16 c | |
| T2 | 62.40 ± 0.08 a | 67.30 ± 0.06 a | 76.36 ± 0.19 a | 9.41 ± 0.05 a | 2.22 ± 0.01 a | 23.59 ± 0.12 a | |
| 2019/NJ 5055 | CK | 61.18 ± 0.14 b | 66.16 ± 0.06 b | 75.13 ± 0.11 b | 9.06 ± 0.01 b | 1.78 ± 0.02 b | 19.61 ± 0.24 b |
| T1 | 60.20 ± 0.04 c | 65.20 ± 0.17 c | 74.39 ± 0.08 c | 8.76 ± 0.02 c | 1.54 ± 0.01 c | 17.62 ± 0.07 c | |
| T2 | 62.13 ± 0.02 a | 67.21 ± 0.03 a | 76.55 ± 0.03 a | 9.25 ± 0.03 a | 2.26 ± 0.03 a | 24.43 ± 0.26 a | |
| 2019/NJ 46 | CK | 62.30 ± 0.15 b | 67.99 ± 0.13 b | 76.59 ± 0.05 b | 9.24 ± 0.02 b | 1.94 ± 0.02 b | 21.02 ± 0.14 b |
| T1 | 61.30 ± 0.12 c | 67.16 ± 0.06 c | 75.80 ± 0.13 c | 9.04 ± 0.02 c | 1.74 ± 0.03 c | 19.24 ± 0.37 c | |
| T2 | 63.46 ± 0.03 a | 69.23 ± 0.09 a | 77.59 ± 0.04 a | 9.46 ± 0.02 a | 2.34 ± 0.02 a | 24.78 ± 0.20 a | |
| 2020/NJ 9108 | CK | 61.51 ± 0.04 b | 66.77 ± 0.02 b | 75.72 ± 0.14 b | 9.21 ± 0.05 b | 1.86 ± 0.01 b | 20.20 ± 0.13 b |
| T1 | 60.39 ± 0.08 c | 65.34 ± 0.12 c | 74.34 ± 0.12 c | 8.87 ± 0.02 c | 1.66 ± 0.01 c | 18.76 ± 0.05 c | |
| T2 | 62.80 ± 0.59 a | 67.61 ± 0.06 a | 76.57 ± 0.11 a | 9.37 ± 0.04 a | 2.27 ± 0.06 a | 24.20 ± 0.50 a | |
| 2020/NJ 5055 | CK | 61.30 ± 0.06 b | 66.37 ± 0.04 b | 75.28 ± 0.06 b | 9.13 ± 0.02 b | 1.83 ± 0.01 b | 20.01 ± 0.05 b |
| T1 | 60.37 ± 0.04 c | 65.30 ± 0.03 c | 74.43 ± 0.05 c | 8.84 ± 0.02 c | 1.57 ± 0.01 c | 17.79 ± 0.11 c | |
| T2 | 62.30 ± 0.07 a | 67.39 ± 0.06 a | 76.63 ± 0.06 a | 9.26 ± 0.01 a | 2.25 ± 0.03 a | 24.33 ± 0.32 a | |
| 2020/NJ 46 | CK | 62.40 ± 0.09 b | 68.20 ± 0.07 b | 76.46 ± 0.10 b | 9.29 ± 0.02 b | 1.98 ± 0.02 b | 21.27 ± 0.17 b |
| T1 | 61.56 ± 0.10 c | 67.39 ± 0.08 c | 75.73 ± 0.03 c | 9.14 ± 0.03 c | 1.75 ± 0.02 c | 19.19 ± 0.21 c | |
| T2 | 63.57 ± 0.04 a | 69.67 ± 0.03 a | 77.69 ± 0.04 a | 9.51 ± 0.04 a | 2.42 ± 0.01 a | 25.40 ± 0.16 a | |
| Analysis of variance | |||||||
| Year (Y) | ** | ** | NS | ** | ** | NS | |
| Cultivar (C) | ** | ** | ** | ** | ** | ** | |
| Treatment (T) | ** | ** | ** | ** | ** | ** | |
| Y × C | NS | NS | NS | * | NS | ** | |
| Y × T | NS | * | NS | ** | NS | ** | |
| C × T | NS | ** | ** | ** | ** | ** | |
| Y × C × T | NS | NS | NS | NS | * | ** | |
Disclaimer/Publisher’s Note: The statements, opinions and data contained in all publications are solely those of the individual author(s) and contributor(s) and not of MDPI and/or the editor(s). MDPI and/or the editor(s) disclaim responsibility for any injury to people or property resulting from any ideas, methods, instructions or products referred to in the content. |
© 2024 by the authors. Licensee MDPI, Basel, Switzerland. This article is an open access article distributed under the terms and conditions of the Creative Commons Attribution (CC BY) license (https://creativecommons.org/licenses/by/4.0/).
Share and Cite
Cui, R.; Zhou, T.; Shu, C.; Zhu, K.; Ye, M.; Zhang, W.; Zhang, H.; Liu, L.; Wang, Z.; Gu, J.; et al. Effects of Salt Stress on Grain Quality and Starch Properties of High-Quality Rice Cultivars. Agronomy 2024, 14, 444. https://doi.org/10.3390/agronomy14030444
Cui R, Zhou T, Shu C, Zhu K, Ye M, Zhang W, Zhang H, Liu L, Wang Z, Gu J, et al. Effects of Salt Stress on Grain Quality and Starch Properties of High-Quality Rice Cultivars. Agronomy. 2024; 14(3):444. https://doi.org/10.3390/agronomy14030444
Chicago/Turabian StyleCui, Ruilong, Tianyang Zhou, Chenchen Shu, Kuanyu Zhu, Miao Ye, Weiyang Zhang, Hao Zhang, Lijun Liu, Zhiqin Wang, Junfei Gu, and et al. 2024. "Effects of Salt Stress on Grain Quality and Starch Properties of High-Quality Rice Cultivars" Agronomy 14, no. 3: 444. https://doi.org/10.3390/agronomy14030444
APA StyleCui, R., Zhou, T., Shu, C., Zhu, K., Ye, M., Zhang, W., Zhang, H., Liu, L., Wang, Z., Gu, J., & Yang, J. (2024). Effects of Salt Stress on Grain Quality and Starch Properties of High-Quality Rice Cultivars. Agronomy, 14(3), 444. https://doi.org/10.3390/agronomy14030444