Article

Testing Biochar’s Ability to Moderate Extremely Acidic Soils in Tea-Growing Areas

Department of Agroecosystems, Faculty of Agriculture and Technology, University of South Bohemia in České Budějovice, Branišovská 1645/31A, 370 05 České Budějovice, Czech Republic
*
Author to whom correspondence should be addressed.
Agronomy 2024, 14(3), 533; https://doi.org/10.3390/agronomy14030533
Submission received: 16 February 2024 / Revised: 1 March 2024 / Accepted: 4 March 2024 / Published: 4 March 2024
(This article belongs to the Section Agricultural Biosystem and Biological Engineering)

Abstract

:
Biochar as a by-product of the carbonization of biomass has an inherent potential to modify acidic soils due to its alkaline nature. To explore the mechanism and effectiveness of biochar, a case study was conducted on severely acidic soils from six fields under tea cultivation in a subtropical zone, comparing rice husk biochars, in three rates (B5, B10, B15 t ha−1), and CaCO3 as conventional liming practice. The results showed increases in pH of 71.5%, 52.7%, 30.6%, and 29.7% in B15, B10, B5, and CaCO3-treated soils compared to the control. On average, B15 and B10 treatments resulted in the highest organic matter with 12.3% and 9.7%, respectively. B15, B10, B5, and CaCO3 caused increases of 196.6%, 173.4%, 129.7%, and 100.9% in base saturation compared to the control, respectively. Also, after the application of B15, B10, and B5 treatments, the effective cation exchange capacity increased by 191.4%, 112.1%, and 39.5%; however, the application of CaCO3 resulted in a 20.1% decrease. Overall, applying biochar on acidic soils provides adequate negative charges due to its well-extended specific surface area and pore volume, which cause the absorption of additional Al+, resulting in ameliorating soil pH. The application of proper biochar could notably be more effective in improving acidic soils than conventional practices such as the overuse of CaCO3. In this regard, evaluating various biochars in terms of feedstock, pyrolysis conditions, and modification scenarios merits in-depth research in future studies.

1. Introduction

One of the primary issues with the excessive use of chemical fertilizers in farms, especially those situated in wet regions, is the gradual acidity of the soil [1]. Low yields of crops planted in such acid soils are a result of the unavailability, high expense, and poor quality of typical liming substances [2]. One challenging method of managing soil to preserve soil quality and productivity is keeping the soil acidity at a suitable level. Globally, about 3950 million hectares (ha) of arable lands are suffering from acidic pH: 58% of agricultural lands in Asia, 31% of Latin America, and 56% of Africa and North America have a pH of lower than 5.5. At that level of acidity, just 5% of common agricultural products are able to grow [3]. The mismanagement of soil during agricultural practices such as the overuse of chemical fertilization, wastewater irrigation, and intensive tillage are the main reasons for soil pH instabilities [4].
Today, tea is being cultivated as one of the popular beverages with more than 5 million ha in about 66 countries of the world [5]. Typically, regions with altitudes up to 2100 m above sea level, warm, humid climates with 1000 mm of annual precipitation, and acidic soil with a coarse texture are suitable areas for tea growing [6,7]. The majority of the soils in tea-growing regions are Alfisols, Ultisols, and Oxisols, which are typically deficient in primary minerals and bases such as Ca and Mg [8,9,10]. Due to severe weathering and a lot of precipitation, the base saturation in tea land areas is low [11,12]. Heavy precipitation has caused bases to be washed away, resulting in Al3+ and its species as well as H+ dominating the exchange sites of the soils [13]. Low P and Mo concentrations in the soil solution make acidic soils naturally less nutritious [14]. The most important effects of soil acidification are the dissolution of minerals containing iron, magnesium, and aluminum as well as the substitution of exchangeable base cations such as Ca2+, Mg2+, and K+ by H+ and Al3+ [15]. Moreover, the most noticeable sign of Al toxicity and one of its primary consequences is the restriction of plant root growth [16]. Overexposure to Al inhibits the development of expanded root tips, root hair formation and cell division [17]. In addition, the detrimental presence of Al prevents plants from absorbing nutrients and water [18].
Tea is among the plants that perform better in acidic soils with a pH between 4.5 and 5.5 [19]. Soil pH is a key factor that affects the absorption of nutrients and their ability to be used by plants. Some of the negative impacts of high pH include Al and manganese toxicity as well as calcium, molybdenum, and boron insufficiency [15]. The presence of one milligram of Al per kilogram of soil limits or stops the growth of plants. The roots of the plants become short and thick in such soils due to the high concentration of dissolved Al and manganese underground, and their growth slows down as a result of insufficient soil penetration [20]. Even the existence of such a circumstance supports the development of the nematode that causes tea root wound disease and reduces the quantitative and qualitative efficiency of the plant [19,21].
The maintenance of soil fertility in the past three decades in tea lands has been controlled using inorganic fertilizers, mainly sulfate of ammonia. However, the oxidation of a mole of NH4+ applied to soil leads to the production of two moles of H+. As a result, the use of ammonium sulfate may have played a role in most of the soils’ acidic pH < 4.0. Regarding these challenges, managing the tea plantations’ acidic soils in rain-fed regions is a critical issue to avoid changing the consistency of the soil [1,14,22]. The use of lime is recommended as one of the solutions to overcome acidic soil, while the use of agricultural lime by farmers is challenging due to high haulage costs [23]. To boost the productivity of the soils and crops, farmers who own such acidic farms must be given a viable alternative. Any substitute material for liming acid soils that farmers could find appealing should be reasonably affordable, easily accessible, and ideally located close to the farms.
Given that biochar has inherent alkali properties, using it in agricultural acidic soils could be a possibility [24]. A carbon-rich substance called biochar is produced by pyrolyzing biomass with limited oxygen [25]. As a result of its carbon skeleton structure, biochar is chemically and physiologically more stable in soil than directly adding uncharred material, which has the same carbon equivalent [26]. Based on the type of feedstock and pyrolysis condition, biochar may contain a variety of chemically reactive functional groups and components, which give the substance its high capacity for adsorbing harmful elements like aluminum and manganese from acidic soils [27,28,29,30]. Al(OH)3 and Al(OH)4 are examples of less hazardous Al species that can be produced as a result of biochar’s reaction between oxygen functional groups on the surface of biochar and free Al3+ in soil [31]. The type of feedstock, pyrolysis temperature, surface area of the biochar, soil characteristics, and regional environmental conditions all play a role in determining the variety and degree of reactions, which takes place in between biochar and the soil’s physiochemical components [25,32].
The plain regions of northern Iran, between the Caspian Sea and the Alborz Mountain range, as well as along the Hyrcanian woodlands, have historically been used for tea planting due to their ideal climate. Unfortunately, the overuse of chemical fertilizers in these areas has resulted in serious acidity and degradation problems in recent years. The continuous use of acid-forming chemical fertilizers such as ammonium phosphate and ammonium sulfate, along with additional influences including excessive precipitation, leaching, and acidic parent materials such as granite, has caused the pH of the soil in most of these lands to significantly decrease and reach about 3.5, which inexorably impacted the health of plants. On the other hand, rice husk is one of the agricultural by-products that is prevalent in literally all northern Iran. The efficiency of rice husk biochar for the purpose of soil pH modification has been considered in some studies [33,34]. The observed increase in soil pH is usually between 1 and 2 units for the rice husk biochar application rates of 3 to 12 t ha−1 [35,36]. In general, while the silica functional groups (Si–OH, Si–O–Si, and Si–H) are dominant in rice husk biochar produced at low pyrolysis temperatures, aliphatic and aromatic C–H functional groups can significantly increase with increasing pyrolysis temperatures [35]. However, rice husk biochar usually maintains the primary skeleton of rice husk with a very porous structure, high surface area and therefore high potential for the absorption of cations [37,38]. RHB usually has an alkaline pH ranging from 7.1 to 10.8, which depends on the pyrolysis temperature [35]. That is a very important characteristic for soil amendment to be used in acidic soils.
Due to the alkaline nature of biochar, especially the potential of rice husk originated biochar in the modification of acidic environments, it is hypothesized that biochar utilization could be considered as an alternative solution for conventional liming practices. However, the application of rice husk biochar as a liming material on acid tea lands in humid, subtropical settings is still mostly unknown. Additionally, to the best of our knowledge, biochar’s remediation capability in northern Iran’s acidic soils has not yet been studied in comparison with the use of CaCO3 as a traditional liming practice. To effectively ameliorate extremely acidic soils, it is thus important to fill in these gaps. Therefore, the purpose of this study was to determine how effective biochar can be as a liming material on various types of acidic tea-growing regions compared with conventional CaCO3 application.

2. Materials and Methods

2.1. Study Area Description

Soil samples were collected from 6 separate tea fields from different cities along the Alborz Mountains. The distance from the first sampling point to the last point was about 230 km (Figure 1). The geographical directions were as follows: Fooman (37°05′24.2″ N 49°12′49.6″ E), Rasht (37°05′24.2″ N 49°12’49.6″ E), Lahijan (37°10′48.3″ N 50°02′06.4″ E), Amlash (37°01′05.3″ N 50°02’59.1″ E), Chaboksar (36°57′04.3″ N 50°32′39.3″ E), and Shahsawar (36°45′08.0″ N 50°48’37.4″ E). Table 1 provides some environmental descriptions of the study areas. The average area of the selected tea fields was 30 ha. Random disturbed samples of the plow layer (0–20 cm) of the soils were taken, bulked, homogenized, and sub-sampled for routine chemical characterization and pot experiments. Subsequently, 6 soil samples representing 6 different tea fields were considered for physical and chemical tests. The disturbed samples were air-dried, and a portion was ground and passed through a 2 mm sieve for a three-month incubation pot experiment from 1 May to 30 July 2020. The pots were 35 cm in height by 30 cm wide with a capacity of 6 kg soil.

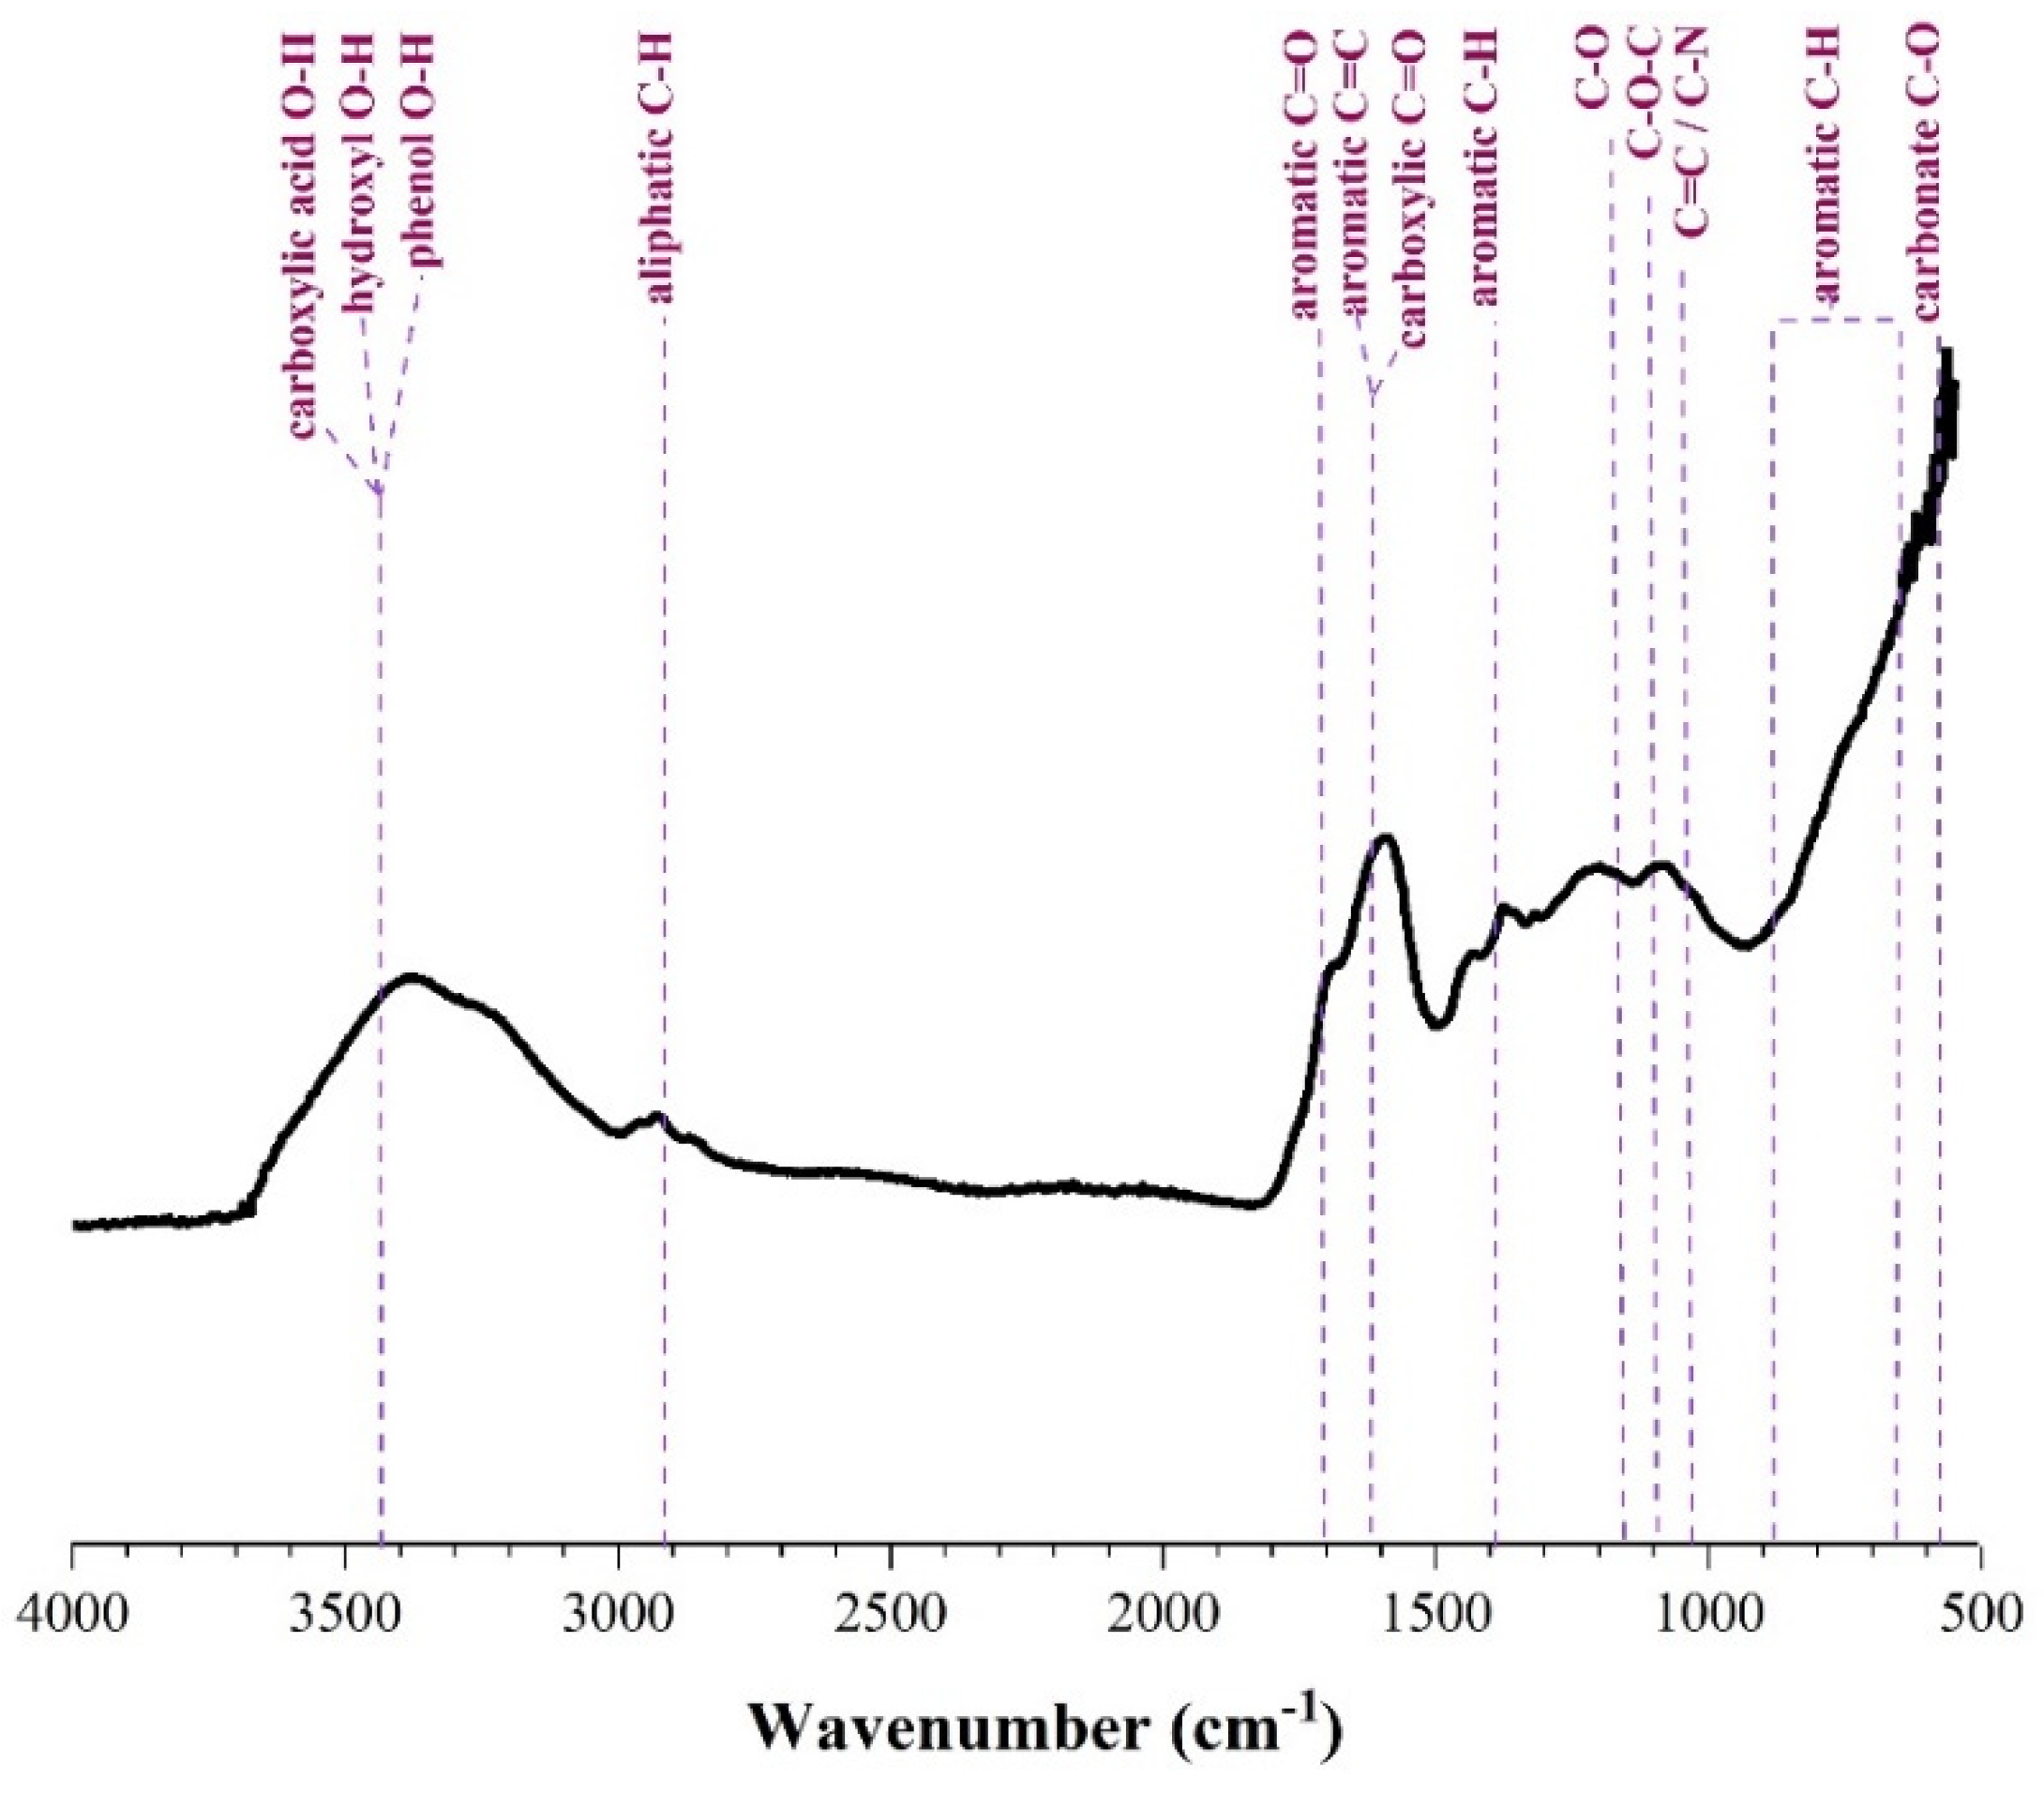
2.2. Biochar Preparation and Characterization

Air-dried rice husks obtained from farmers’ fields were carbonized in a furnace at a pyrolysis temperature of 500 °C with a heating rate of 10 °C min−1 and residence time of 2 h. The results of some physicochemical analysis of produced biochar are presented in Table 2 and Figure 2. The pH and EC of biochar were determined using a 1:10 (w/v) ratio suspension of biochar and deionized water [39]. The Brunner, Emmett, and Teller (BET) method was used to calculate the specific surface area of biochar. Biochar bulk density and porosity were measured via mercury porosimetry (AutoPore IV 9500 M, Micromeritics, Norcross, Georgia). To analyze the status of functional groups on the surface of biochar samples, Fourier transform infrared spectroscopy (FTIR) was conducted in the wavenumber region of 400–4000 cm−1 by using an FTIR Spectrum (PerkinElmer, MA, USA) (Figure 2). The ammonium acetate technique was used to determine the cation exchange capacity (CEC) [40]. Ammonium extractable bases, i.e., Ca2+, Mg2+, K+ and Na+ in the biochar were extracted sequentially with deionized water and 1 M ammonium acetate, respectively, and the concentrations were read on a Perkin Elmer Analyst 800 atomic absorption spectrometer. Carbon (C), hydrogen (H), and nitrogen (N) were measured by the elemental analyzer (Perkin Elmer 2400 II). The oxygen (O) content of the produced biochar was calculated by subtracting CHN and ash content from 100% biochar.
The biochar yield (BY) was calculated using the initial weight of feedstock and the immediate weight of produced biochar, as shown in Equation (1). The moisture content (MC) of biochar was obtained by weighing the biochar samples before and after drying in an oven at 105 °C for 24 h using Equation (2). The ash content (AC) and volatile matter (VM) of biochars were measured using an electric muffle furnace. To obtain the ash content, 1.5 g of oven-dried biochar samples were weighed into a pre-weighed crucible and heated in air at 600 °C for 6 h. After combustion, the residues were weighed, and the ash content was calculated according to Equation (3). For volatile matter determination, 8 mg of oven-dried biochar samples were burned at 950 °C for 30 min under a nitrogen atmosphere, and then the weight of the remaining mass after combustion was used for volatile matter calculation based on Equation (4). Fixed carbon (FC) was calculated by subtracting the percentages of moisture, ash, and volatile matter from the initial biochar weight, as shown in Equation (5).
B Y   ( % ) = [ F e e d s t o c k   w e i g h t g B i o c h a r   w e i g h t   ( g ) B i o c h a r   w e i g h t   ( g ) ] × 100
M C   ( % ) = [ I n i t i a l   b i o c h a r g O v e n   d r i e d   b i o c h a r   a t   105   ° C   ( g ) O v e n   d r i e d   b i o c h a r   a t   105   ° C   ( g ) ] × 100
A C   % = [ O v e n   d r i e d   b i o c h a r   a t   105   ° C   g C o m b u s t e d   b i o c h a r   a t   600   ° C   g C o m b u s t e d   b i o c h a r   a t   600   ° C   g ] × 100
V M   % = [ O v e n   d r i e d   b i o c h a r   a t   105   ° C C o m b u s t e d   b i o c h a r   a t   950   ° C   g C o m b u s t e d   b i o c h a r   a t   950   ° C   g ] × 100
F C   % = 100 [ M o i s t u r e   c o n t e n t   % + V o l a t i l e   m a t t e r   % + A s h   c o n t e n t   ( % ) ]

2.3. Experimental Design

Each soil sample was combined with biochar at three rates of 5 t ha−1 (equal to 12.1 g pot−1), 10 t ha−1 (equal to 24.2 g pot−1), and 15 t ha−1 (equal to 36.3 g pot−1). Also, a lime treatment with an amount of 5 t ha−1 (equal to 12.1 g pot−1) carbonate calcium (CaCO3) with a purity of 99% was considered as a conventional liming approach in which the amount and type of lime were based on the common practice in local tea gardens. A treatment with no amendment was also considered as the control (CK). Therefore, the experiment was conducted using six soils, five treatments (CK, B5, B10, B15, and CaCO3), and three replications, in a completely randomized design. The moisture contents of the soils in the pots were kept at 80% field capacity in the greenhouse. The average temperature during the period of incubation was between 27 and 32 °C.

2.4. Soil Characteristics

Soil samples were analyzed at the end of the experiment by the following methods: soil pH and electrical conductivity (EC) in a 1:1 (w:v) by soil-to-water ratio; soil texture by hydrometer; organic carbon (OC) by wet oxidation [41]; available N (NO3 and NH4+) were determined using a continuous flow analyzer (SEAL Analytical, Norderstedt, Germany) with 1 M KCL extracts [42]; available P was determined using the sodium bicarbonate method [43]. Soil K was determined using the flame photometer method [44]; exchangeable basic cations were analyzed using a 5:50 ratio of soil:ammonium acetate (NH4Oac)-buffered solution at pH 7, in which the basic cations adsorbed in soil were replaced by NH4+ ions [45] and measured by a spectroscope (ICP-OES, PerkinElmer). The pH values of soil solutions were determined through KCl extraction and were measured potentiometrically; titratable and exchangeable acidity (the total of H+ and Al3+ ions), by titration with 0.05 M NaOH solution to pH 8.2; and total alkalinity, by titration with 0.01 M H2SO4 solution to pH 4.4 [46]. Also, the effective cation exchange capacity (ECEC) was determined by summation of the respective exchangeable bases and exchangeable acidities.

2.5. Data Analysis

A one-way analysis of variance (ANOVA) was performed to examine the significance of differences in soil parameters among treatments. Lowercase letters in the figures indicate statistically significant differences after the least significant difference (LSD) test at p < 0.05. SPSS 22.0 was used to analyze the data. Origin 2022 and Excel 2020 were used to create all the figures.

3. Results

3.1. Changes in Soil pH and Cations

The results of changes in cations are presented in Table 3. All treatments significantly increased pH values in all soil sites. The lowest pH was related to Lahijan soil with a value of 3.16, in which B15 treatment caused an 88.9% increase (5.97), which was significantly higher than the other treatments. Meanwhile, the application of CaCO3 in the same soil increased the pH to 4.81, with a 41.4% increase rather than control. Also, the increase in biochar application rates significantly increased the pH in all sites. Based on the average of changes from all sites, increases of 30.6%, 52.7%, 71.5%, and 29.7% were obtained from B5, B10, B15, and CaCO3, respectively. In the case of EC, the application of B5 did not show a significant effect; however, an increase in biochar rates slightly caused an increase in EC values. On average, B15, B10, and CaCO3 significantly increased EC values by 20.9%, 15.1%, and 10.4% compared to the control. The application of biochar treatments in all six soils significantly increased the OC content, and the increase in biochar yield had a significant effect on its effectiveness. Although CaCO3 showed an increase in OC content as well, its effect in Fooman, Chaboksar, and Shahsavar was not significant. Overall, B15, B10, B5, and CaCO3 had 244.8%, 169.4%, 80.4%, and 41.4% increases in OC on average, respectively. All treatments effectively increased soils’ base cations, however, the effect of biochar treatments was much more significant than CaCO3. In the case of Ca2+, although there are no significant differences between B5 and CaCO3 in Fooman and Lahijan, B5 showed significantly higher values of Ca2+ in other sites in comparison to CaCO3. As for Mg2+, the application of CaCO3 did not show significant differences from the control in all six soils. On average, CaCO3 was shown as the lowest effectiveness treatment with 175.2%, 1.9%, 5.8%, and 5.6% increases in Ca2+, Mg2+, K+, and Na+, respectively. However, the highest base values were related to B15 with 1067%, 1035%, 896.7%, and 56.5% increases in Ca2+, Mg2+, K+, and Na+ compared to the control, respectively. As for acid cations, the application of biochar significantly decreased the values of H+, Al3+, and NH4+, and an increase in the biochar application rate caused a significant decrease in those values. The application of B15 and B10 caused significant decreases in H+ by 99.7% and 98.5% in comparison to the control. However, CaCO3 and B5 resulted in 89.4% and 88.9% decreases in H+. On average, B15 and CaCO3 caused a greater decrease in Al3+ with 42.3% and 29.1% decreases on average across all six sites, respectively. Also, the value of NH4+ in all soil was significantly affected by the application of biochar, which resulted in 14.1% (B5), 35.5% (B10), and 61.1% (B15) decreases on average. On the other hand, NO3 showed a reverse trend compared to NH4+. An increase in the application rate of biochar resulted in significant increases in NO3 content: 53.4% (B5), 80.1% (B10), and 116.3% (B15). However, the application of CaCO3 did not show a significant difference from the control in both cases of NH4+ and NO3 contents.

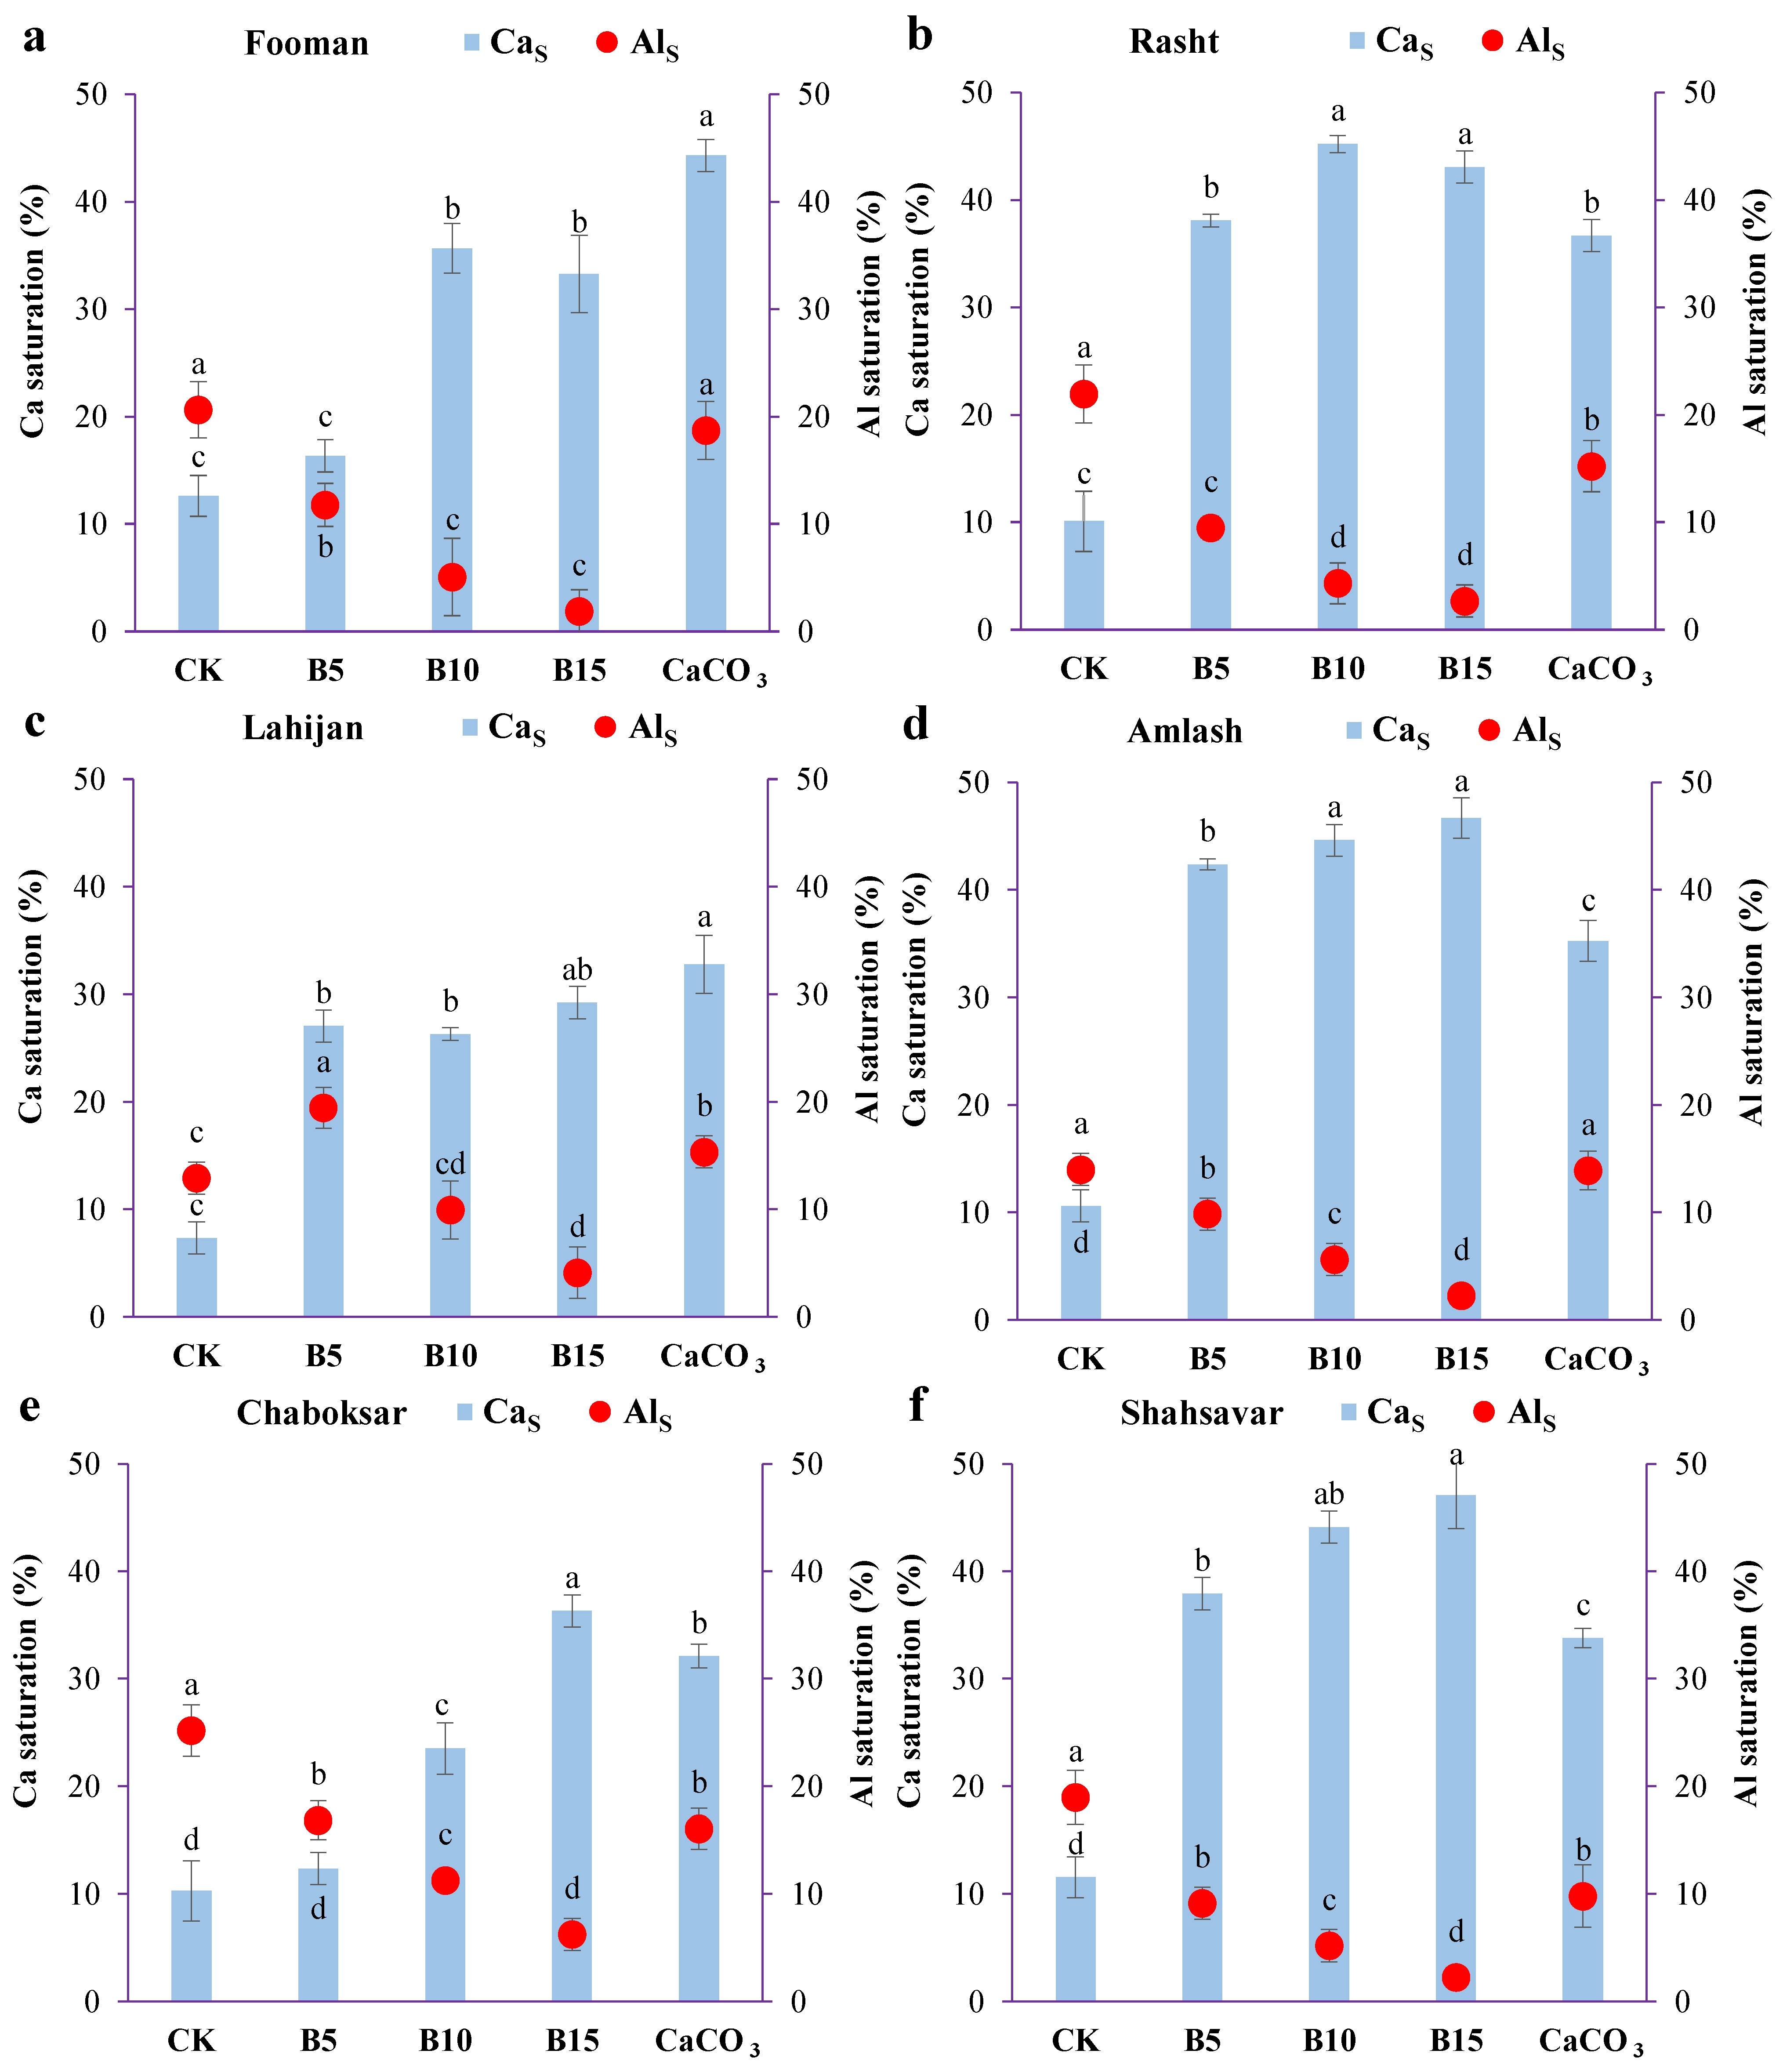
3.2. Soil Al and Ca Saturation

The results of Ca and Al saturations are presented in Figure 3. In Fooman, the highest Ca saturation was obtained after the application of CaCO3 (44.3%), which was significantly higher than the other treatments. Also, B10 and B15 with Ca saturation levels of 35.6% and 33.3% did not show significant differences from each other. However, in the same soil, Al saturation in the CaCO3 treatment was not significantly different from the control. On the other hand, the application of biochar significantly decreased the Al saturation compared to the control; the highest biochar rate (B15) resulted in the lowest Al saturation (1.8%). Almost the same pattern was observed for Lahijan soil. However, of the four other sites, B15 resulted in the highest Ca saturation, which was significantly higher than the CaCO3 treatment. Based on the average across all sites, B15, B10, B5, and CaCO3 caused increases of 309.5%, 272.6%, 202.1%, and 250.3% in Ca saturation compared to the control, respectively. Also, the average decrease in Al saturation compared to the control obtained from all six sites was B15 (82.4%), B10 (61.1%), B5 (27.3%), and CaCO3 (15.1%).

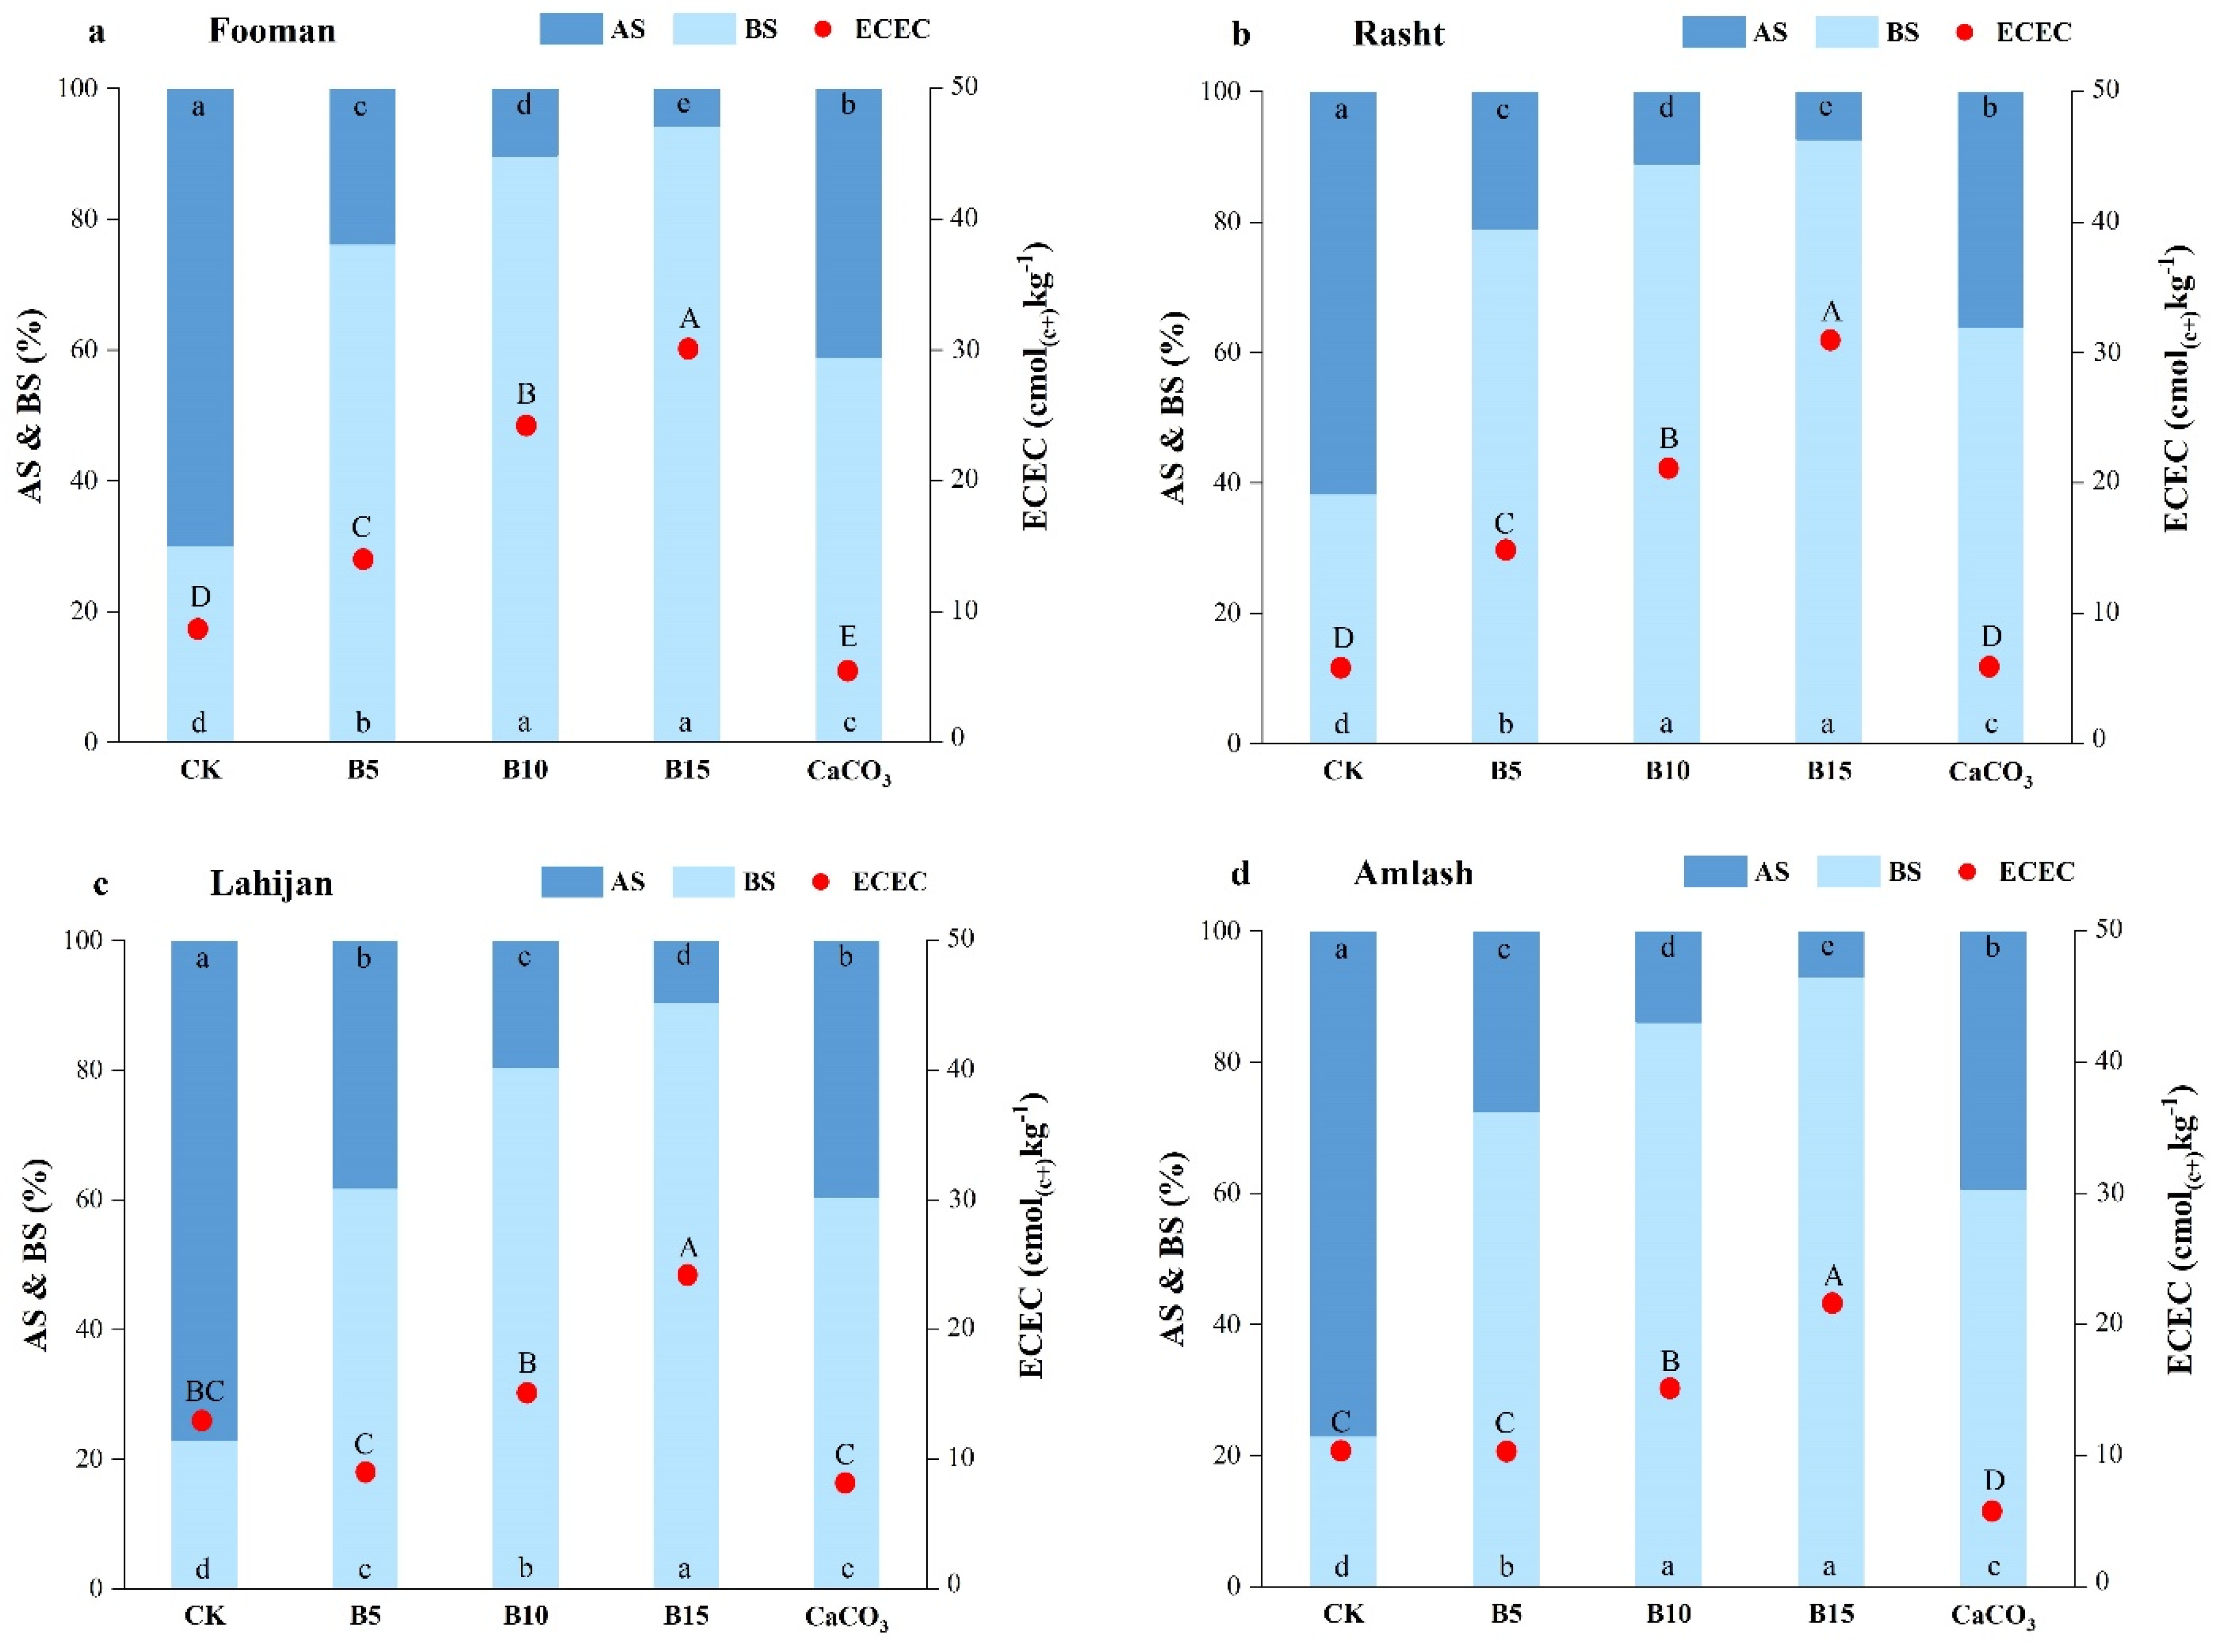
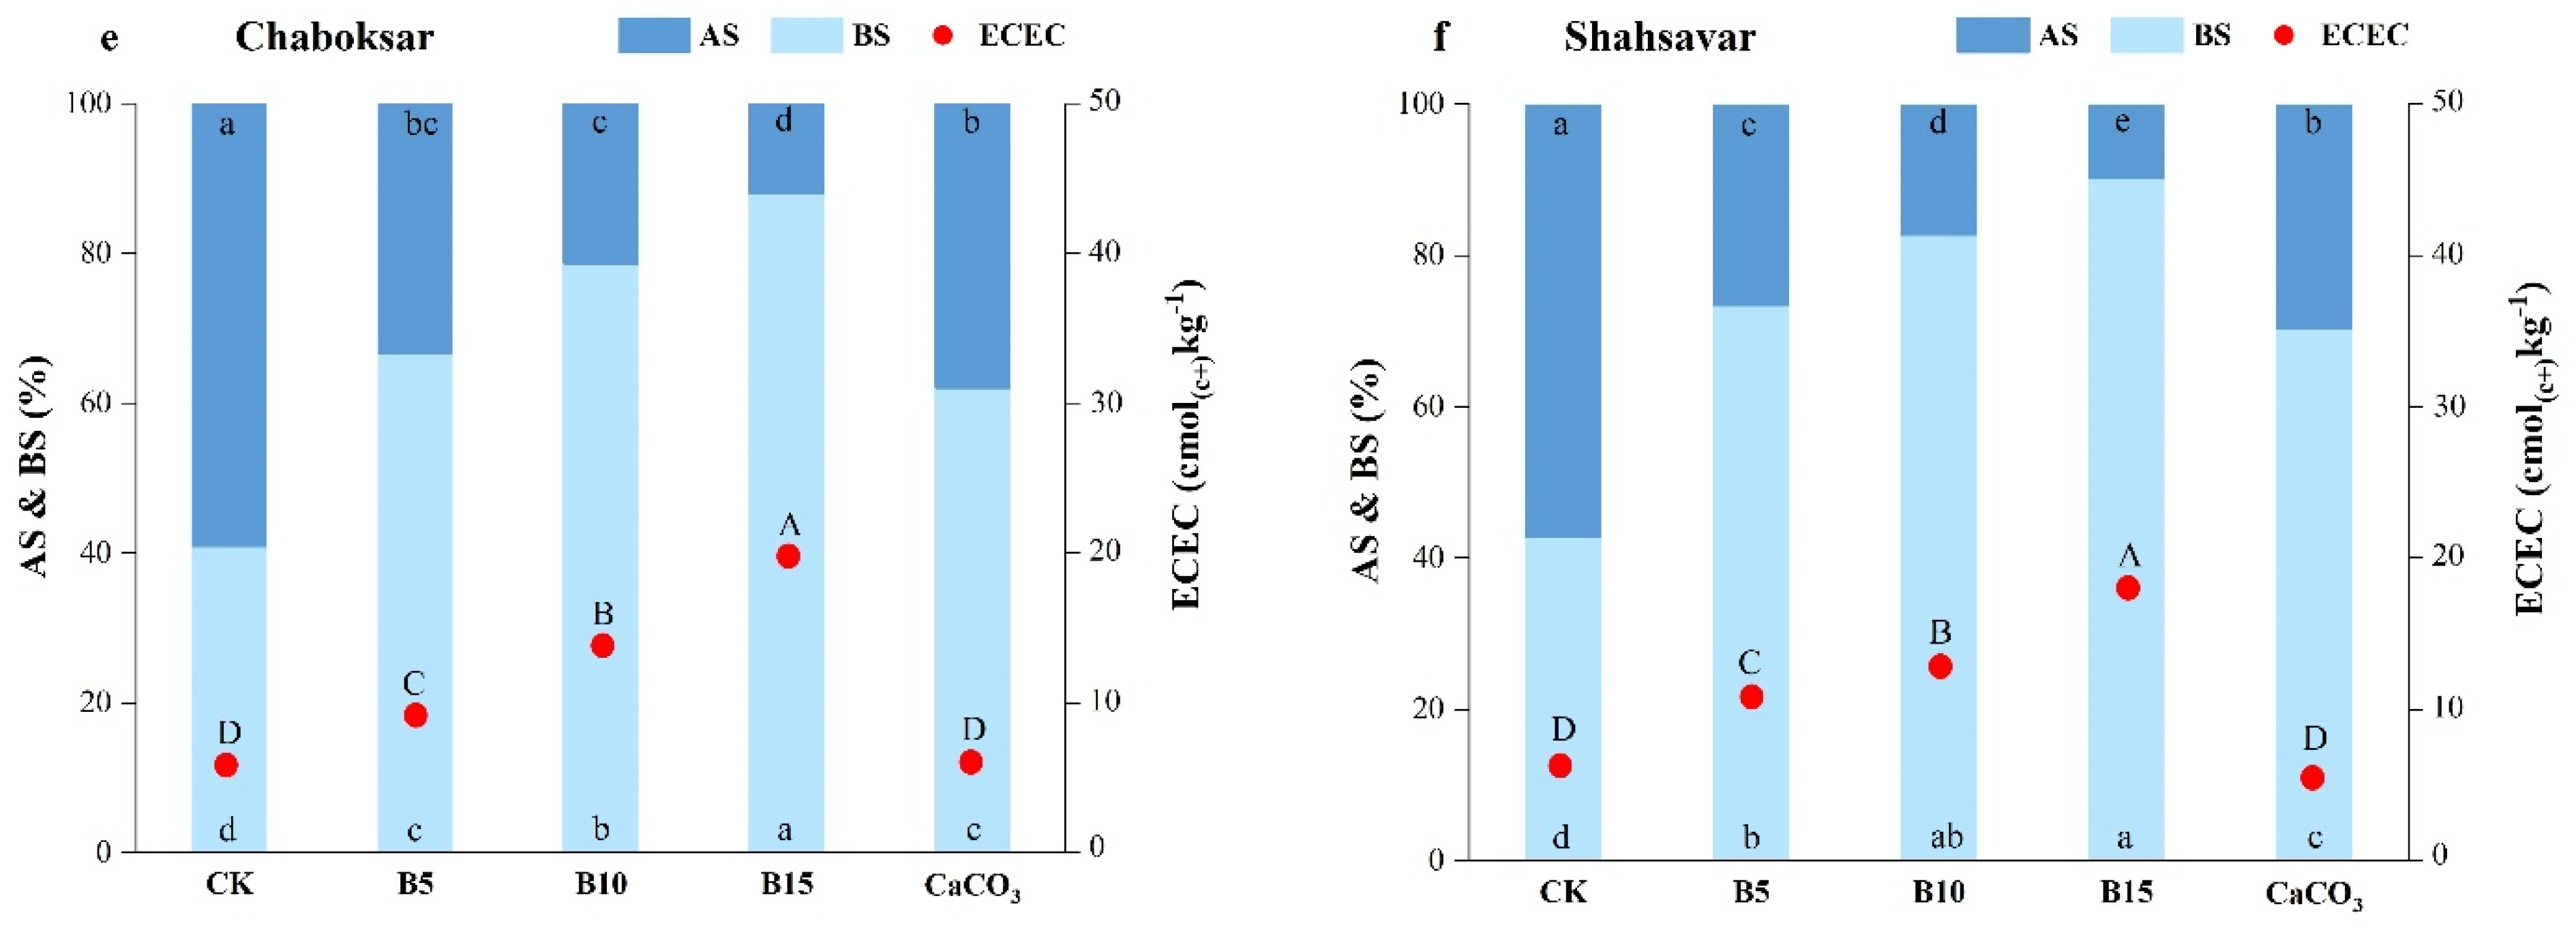
3.3. Soil Effective Cation Exchange Capacity (ECEC)

The results of acid saturation (AS) and base saturation (BS), as well as changes in effective cation exchange capacity (ECEC), are shown in Figure 4. According to the results, all treatments significantly decreased AS in all six sites. Also, the increase in biochar application from B5 to B15 had a significant effect regarding the greater decrease in AS. The most effective treatment in decreasing AS was B15 with an 86.9% decrease on average for all six sites. Meanwhile, CaCO3 showed lower effectiveness (44.1% decrease in AC compared to control) in comparison to the other biochar treatments. In some sites, such as Lahijan and Chaboksar, the CaCO3 and B5 treatments showed similar effectiveness in AS without any significant difference from each other. In the case of base saturation, the highest BS for all six sites was obtained from B15. In the cases of Lahijan and Chaboksar, the application of CaCO3 and B5 resulted in the same BS percentage (roughly about 63%). Based on the average changes in BS obtained from all sites, B15, B10, B5, and CaCO3 resulted in increases of 196.6%, 173.4%, 129.7%, and 100.9% compared to the control, respectively. The application of biochar significantly increased the ECEC of soils from all sites. Also, an increase in the biochar application rate had a significant effect on the increase in ECEC. The average of ECEC obtained from all six sites showed that B15, B10, and B5 caused an increase in ECEC by percentages of 191.4%, 112.1%, and 39.5%, respectively. However, the application of CaCO3 resulted in a decrease in ECEC of 20.1% on average.

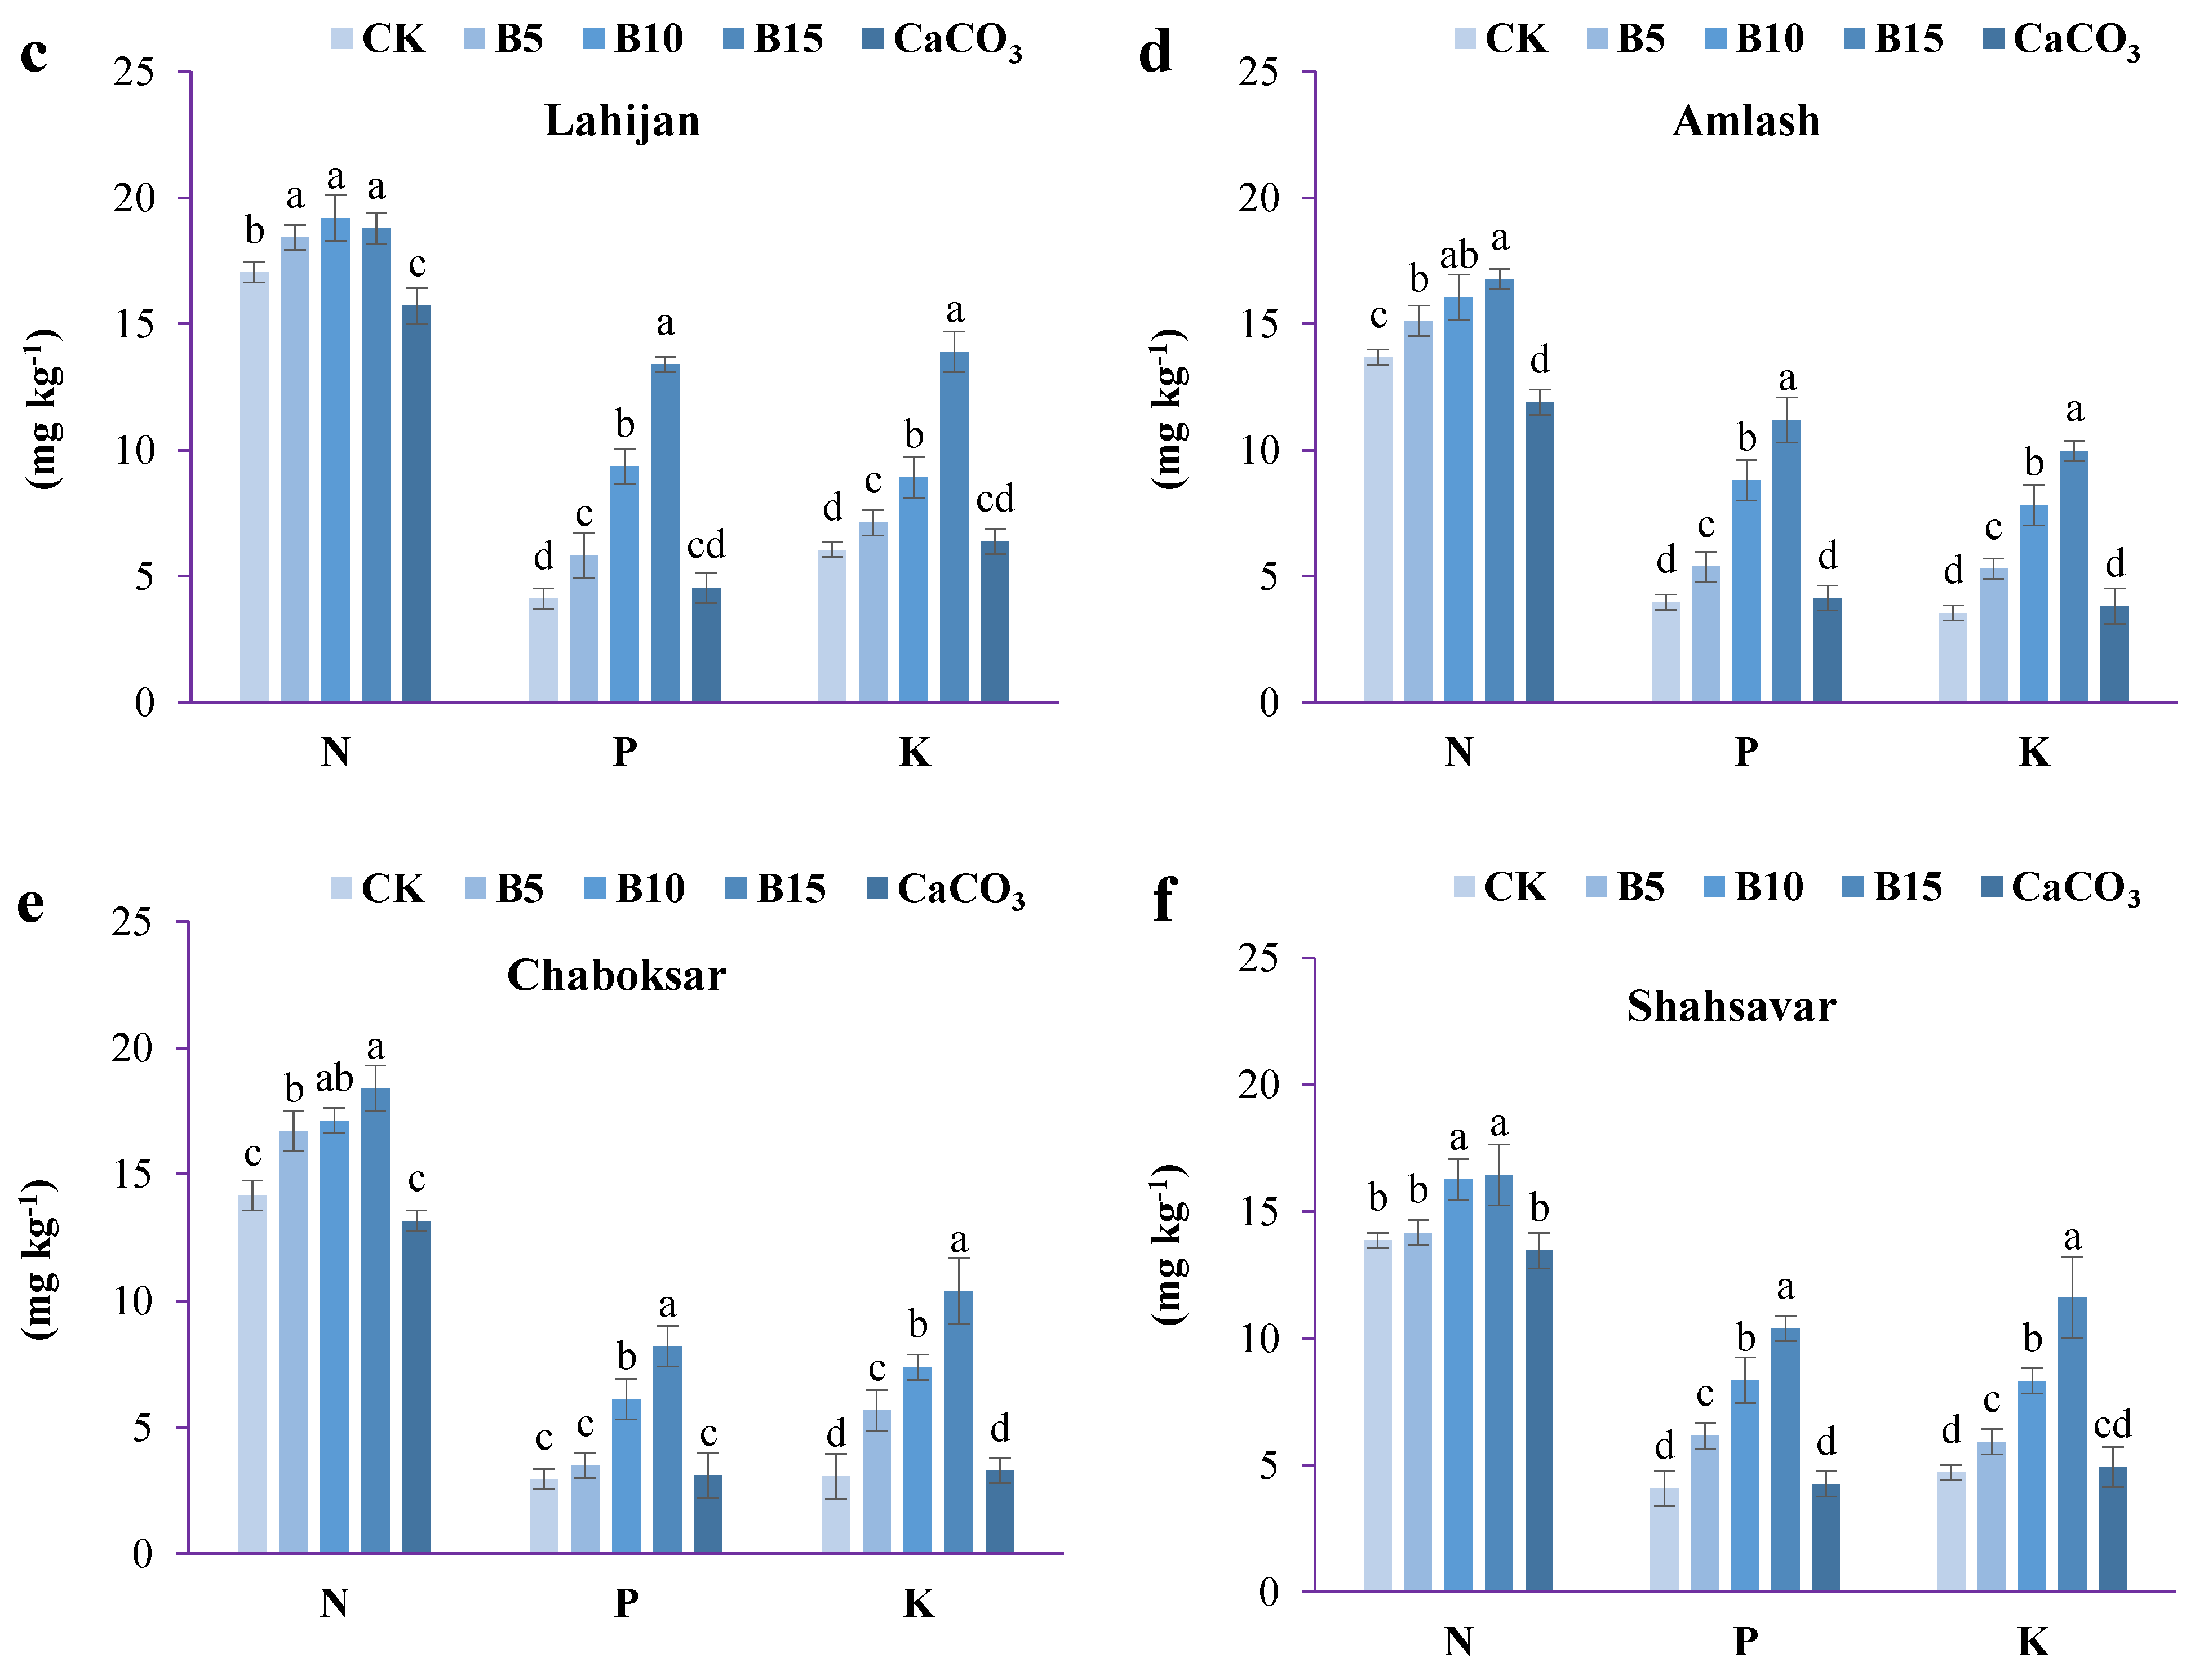
3.4. Changes in Available NPK

Figure 5 presents the results of changes in NPK affected by different rates of biochars and CaCO3. The application of biochar significantly increased the available N in all sites. The highest available N was obtained from the B15 treatment with a 26.1% increase in comparison to the control based on the average of all six sites. However, the application of CaCO3 had a significant negative effect on available N in soil with an average decrease of 6.1% compared to the control. Also, available P and K in the presence of CaCO3 showed 8.2% and 6.8% increases compared to the control. However, based on the average available P from all six sites, B15, B10, and B5 cause increases of 228.5%, 118.2%, and 50.3% compared to the control. Also, the application of B15, B10, and B5 on average resulted in an increase in K availability by 192.9%, 95.8%, and 47.4% in comparison to the control.

3.5. Pearson Correlation between Soil Characteristics

The Pearson correlations between characteristics of soil affected by different treatments are given in Figure 6. Based on the results, pH showed a positive correlation with OM, Ca2+, Mg2+, and K+ with determine coefficients (R2) of 0.37, 0.84, 0.75, and 0.75, respectively. Also, there was a significant negative correlation between ECEC and AS with R2 = −0.69. The available N, P, and K showed a negative correlation with Al saturation (−0.73, −0.81, and −0.76, respectively) as well as a positive correlation with OM (0.83, 0.88, and 0.76, respectively).

4. Discussion

In the current study, although low application rates of biochar and calcium carbonate showed the same effectiveness in modifying the soil pH issue, the increase in biochar application rate was more effective than calcium carbonate. Three mechanisms are put forward for how these modifications work: (1) supplying an adequate absorbent for acidic ascorbates through well-expanded surface area and porosity, (2) loading exchangeable base cations from their inherent structure, and (3) nutrient balancing through an increase in soil organic carbon. Firstly, the alkaline properties of biochar are greatly influenced by the high specific surface area, porosity, and adequate negative charges [39,47]. Although the role of base cations in plant nutrition and balancing soil acidity is proven, however, the high solubility of basic cations, particularly Ca2+, and the limited solubility of acidic cations like Al3+ constantly maintain a high level of soil acidity [15,48,49,50]. High annual precipitation contributes to the leaching of alkaline cations and excess Al3+ in the soil matrix, making this issue more significant in those regions [51,52]. Therefore, it may be inferred that the addition of liming practices does not ensure an improvement in soil pH if free acidic cations are not stabilized. However, in this study, biochar performed this function perfectly due to its abundance of negative charges, which led to a high capacity for the absorption of acidic cations such as Al3+ and H+ [27,31,53]. This claim is supported by a considerable drop in acidic cations in biochar treatments when compared to the control and CaCO3 treatments (Table 3). Some other studies likewise observed that applying biochar decreased the exchangeable acidity of acidic soils and increased the sorption capacity for nutrients [54,55].
Oxygen-containing functional groups on the surface of biochars, such as carboxyl and hydroxyl, play a key role in maintaining free Al3+ as the most effective ion in acidic soils [56,57]. These functional groups can create surface compounds with acidic cations due to their negative charges, which reduces the amount of Al3+ in the soil matrix, resulting in decreasing soil acidity [31,58]. The FTIR analysis of our used biochar shows a sharp peak at 3420 cm−1 which confirms the presence of carboxyl and hydroxyl functional groups in the structure (Figure 2). That is why the Al saturation of all six soils showed a descending trend with the increase in biochar application rate (Figure 3). Although the application of CaCO3 decreased the Al saturation significantly, the concentration of Al is still higher than when using biochar treatments. Also, the formation of micro-pores of biochar during high pyrolysis temperatures causes a notable specific surface area that would offer more contacts for acidic ions absorption, and the growth of meso-pores (2–10 nm) in the biochar would be advantageous for substance diffusion into the inner structure of biochar [59]. Both of those types of pores result in a wide range of channels, which is consistent with the high specific surface area of biochar, oxygen functional groups and thus the sorption of free acidic ions in soil. The results of the basic analysis of biochar in Table 1 confirm the potential of used biochar in absorbing Al3+ in acidic soils due to its high specific surface area and various types of pores.
However, types of feedstock and pyrolysis conditions can be influential on the surface functional groups of biochar [60]. In general, biochars produced at pyrolysis temperature higher than 400 °C are susceptible to having a more alkaline nature [61]. The increase in pH with increasing pyrolysis temperature may be caused by the conversion of basic cations on the surface of the biochar to alkaline compounds such CO32− [62]. As we produced our biochar at 550 °C, it might have benefited from CO32− in its structure. Furthermore, the ash content of biochar can make it less able to absorb substances by blockage pores and reducing its surface area available for absorption [63]. Crop-based biochar is considered to have a lower ash concentration than manure-based biochar, which results in a more porous structure and formed surface area [64]. It might be another explanation for our utilized biochar, which was made from rice husk and has a high specific surface area. It has been observed that the addition of biochar increased the effective cation exchange capacity (ECEC) of acidic soils in rainy climates due to the presence of a large negative charge on its surface [54,65]. This is the main reason for the significant increase in ECEC and base saturation of biochar treatments in comparison to the control and CaCO3 (Figure 4). Also, the positive correlation between ECEC and BS confirms this fact (Figure 6).
As the second mechanism of pH adjustment in biochar-amended soil, biochar can provide various basic cations along with Ca2+. Biochar contains Ca2+, Mg2+, and K+, and the incorporation of biochar can raise the amount of exchangeable base cations of acidic soils [66,67]. In contrast to applying CaCO3, which simply increases the soil’s Ca2+ level, the application of biochar can maintain the balance of Ca2+, Mg2+, and K+ in acidic soils (Table 3). The chemical analysis of biochar clearly shows its potential for loading base cations into the soil due to their availability on the biochar structure (Table 1). That is why biochar treatments significantly increased all basic cations in soils rather than CaCO3, which only had an influence on Ca2+. The same effect of CaCO3 and biochar treatments can be observed in the result of Ca saturation in soils (Figure 3). In general, adding biochars to acidic soil can cause their base cations to be released, which are then able to engage in exchange reactions with Al3+ and H+ and reduce the acidity of the soil [31,55].
Furthermore, the modification of acidic soils is significantly affected by the impact of biochar on soil organic carbon [24,68]. Biochar’s enormous specific surface area and porous structure, which enable it to retain moisture and support a variety of microorganisms, can efficiently stimulate microbial activity in soil [69]. Therefore, it is expected that the breakdown of soil organic matter and the mineralization of nutrients will both show an upward trend with the consideration of the increased rate of biochar application. This process notably increases the soil organic carbon accessibility of available nutrients for plant roots [70] and eventually the elevation of plant growth. Additionally, plant yield could be enhanced by enhancing the soil nutrient-holding capacity and root expansion, which can also improve the plant’s ability to take in more nutrients [35]. It has been reported that the use of biochar alone significantly increased yield gains when compared to the control [71]. It worth noting that cellulosic biochars such as husk and straw have a much higher specific surface area and porous structure than readily degradable biochars like sludge biochar [29]. This finally results in the cations required by the plant being absorbed and retained rather than being leached away, which has a substantial impact on the plant’s growth [72]. Furthermore, the pyrolysis process may have left some readily available nutrients in biochar, known as volatile matter, which can be directly incorporated into the soil when in contact with soil particles [73]. Thus, the increase in soil organic carbon (Table 3) and NPK (Figure 5) could be explained by those reasons. With a closer look at Table 3, it is obvious that the use of biochar resulted in a drop in NH4+ and a rise in NO3 levels, which is mostly seen in the boosted conversion of NH4+ to NO3 [42]. Biochar application could stimulate nitrogen mineralization due to its high surface area and potential for the activity of microorganisms [74]. According to several reports, biochar indirectly aided in the catalytic oxidation of NH4+ to NO3 by boosting the diversity of components in soil ammonia-oxidizing bacteria [75]. In addition, applying biochar to the soil increased the activity of nitrifying bacteria and accelerated the nitrification process [76]. As a result, the NO3 content increased and the NH4+ content dropped as the biochar application rate was raised [77]. The negative correlation between OC and NH4+, as well as the positive correlation between OC and NO3 (Figure 6), is obviously consistent with the role of nitrifying bacteria as a function of the increase in soil OC following the application of biochar.

5. Conclusions

The effectiveness of different levels of biochar and the conventional liming approach was investigated to ameliorate extremely acidic soils utilized for tea cultivation in a subtropical region. Although soil calcium can be increased by calcium carbonate, the created alkaline condition is unable to completely neutralize the quantity of free acidic cations because of the high solubility and instability of basic ions. However, biochar has a significant capacity to absorb free acid cations from the soil due to the many functional groups and substantial negative charges in its porous surfaces. Furthermore, biochar’s large specific surface area, expanded porosity, and high micro-pores volume provide ideal conditions for microbial activity, the breakdown of organic matter, and the availability of the macronutrients and basic cations that plants require. Therefore, in extremely acidic areas in subtropical climates, such as tea growing, the application of biochar can surely be a more effective and affordable alternative to traditional low-efficiency liming methods. Although long-term studies could provide us with a better understanding of the usefulness of biochar in neutralizing acidic cations, however, its resilience against decomposition and excessive precipitation due to the carbon skeleton structure is still reliable.

Author Contributions

M.G.: conceptualization, methodology, validation, formal analysis, investigation, resources, writing—original draft preparation, writing—review and editing, visualization, supervision, project administration, E.A.: software, investigation, writing—review and editing. J.B.: data curation, methodology, P.K.: funding acquisition, methodology. All authors have read and agreed to the published version of the manuscript.

Funding

This research was supported by the University of South Bohemia in České Budějovice (GAJU 085/2022/Z).

Data Availability Statement

The original contributions presented in the study are included in the article, further inquiries can be directed to the corresponding author.

Acknowledgments

The authors gratefully acknowledge the Agricultural Technology and Natural Resources Development Center in Rasht, Iran for providing the site for the laboratory measurements.

Conflicts of Interest

The authors declare no conflicts of interest.

References

  1. Xie, S.; Feng, H.; Yang, F.; Zhao, Z.; Hu, X.; Wei, C.; Liang, T.; Li, H.; Geng, Y. Does Dual Reduction in Chemical Fertilizer and Pesticides Improve Nutrient Loss and Tea Yield and Quality? A Pilot Study in a Green Tea Garden in Shaoxing, Zhejiang Province, China. Environ. Sci. Pollut. Res. 2019, 26, 2464–2476. [Google Scholar] [CrossRef]
  2. Warner, J.M.; Mann, M.L.; Chamberlin, J.; Tizale, C.Y. Estimating Acid Soil Effects on Selected Cereal Crop Productivities in Ethiopia: Comparing Economic Cost-Effectiveness of Lime and Fertilizer Applications. PLoS ONE 2023, 18, e0280230. [Google Scholar] [CrossRef] [PubMed]
  3. Bian, M.; Zhou, M.; Sun, D.; Li, C. Molecular Approaches Unravel the Mechanism of Acid Soil Tolerance in Plants. Crop J. 2013, 1, 91–104. [Google Scholar] [CrossRef]
  4. Sun, Y.; Hu, R.; Zhang, C. Does the Adoption of Complex Fertilizers Contribute to Fertilizer Overuse? Evidence from Rice Production in China. J. Clean. Prod. 2019, 219, 677–685. [Google Scholar] [CrossRef]
  5. Le, V.S.; Herrmann, L.; Hudek, L.; Nguyen, T.B.; Bräu, L.; Lesueur, D. How Application of Agricultural Waste Can Enhance Soil Health in Soils Acidified by Tea Cultivation: A Review. Environ. Chem. Lett. 2022, 20, 813–839. [Google Scholar] [CrossRef]
  6. Bag, S.; Mondal, A.; Banik, A. Exploring Tea (Camellia sinensis) Microbiome: Insights into the Functional Characteristics and Their Impact on Tea Growth Promotion. Microbiol. Res. 2022, 254, 126890. [Google Scholar] [CrossRef]
  7. Xia, W.; Li, C.; Nie, J.; Shao, S.; Rogers, K.M.; Zhang, Y.; Li, Z.; Yuan, Y. Stable Isotope and Photosynthetic Response of Tea Grown under Different Temperature and Light Conditions. Food Chem. 2022, 368, 130771. [Google Scholar] [CrossRef]
  8. Da Silva, C.P.; De Almeida, B.G.; Romero, R.E.; De Alencar, T.L.; Lobato, M.G.R.; Oliveira, L.D.S.; Souza, L.D.S.; Costa, M.C.G.; Mota, J.C.A. Cohesive Character in Alfisols, Ultisol and Oxisols in Northeast of Brazil: Relationship with Tensile Strength and Particle Size. Geoderma Reg. 2020, 23, e00341. [Google Scholar] [CrossRef]
  9. Haby, V.A.; Russelle, M.P.; Skogley, E.O. Testing Soils for Potassium, Calcium, and Magnesium. In SSSA Book Series; Westerman, R.L., Ed.; Soil Science Society of America: Madison, WI, USA, 2018; pp. 181–227. ISBN 978-0-89118-862-9. [Google Scholar]
  10. Xu, Q.; Hu, K.; Wang, X.; Wang, D.; Knudsen, M.T. Carbon Footprint and Primary Energy Demand of Organic Tea in China Using a Life Cycle Assessment Approach. J. Clean. Prod. 2019, 233, 782–792. [Google Scholar] [CrossRef]
  11. Ray, P.; Chattaraj, S.; Bandyopadhyay, S.; Jena, R.K.; Singh, S.K.; Ray, S.K. Shifting Cultivation, Soil Degradation, and Agricultural Land-use Planning in the Northeastern Hill Region of India Using Geo-spatial Techniques. Land Degrad. Dev. 2021, 32, 3870–3892. [Google Scholar] [CrossRef]
  12. Zhu, Q.; Liu, X.; Hao, T.; Zeng, M.; Shen, J.; Zhang, F.; De Vries, W. Modeling Soil Acidification in Typical Chinese Cropping Systems. Sci. Total Environ. 2018, 613–614, 1339–1348. [Google Scholar] [CrossRef]
  13. Lawrence, G.B.; McDonnell, T.C.; Sullivan, T.J.; Dovciak, M.; Bailey, S.W.; Antidormi, M.R.; Zarfos, M.R. Soil Base Saturation Combines with Beech Bark Disease to Influence Composition and Structure of Sugar Maple-Beech Forests in an Acid Rain-Impacted Region. Ecosystems 2018, 21, 795–810. [Google Scholar] [CrossRef]
  14. Yan, P.; Wu, L.; Wang, D.; Fu, J.; Shen, C.; Li, X.; Zhang, L.; Zhang, L.; Fan, L.; Wenyan, H. Soil Acidification in Chinese Tea Plantations. Sci. Total Environ. 2020, 715, 136963. [Google Scholar] [CrossRef]
  15. Rahman, M.A.; Lee, S.-H.; Ji, H.; Kabir, A.; Jones, C.; Lee, K.-W. Importance of Mineral Nutrition for Mitigating Aluminum Toxicity in Plants on Acidic Soils: Current Status and Opportunities. Int. J. Mol. Sci. 2018, 19, 3073. [Google Scholar] [CrossRef] [PubMed]
  16. Frankowski, M. Aluminum Uptake and Migration from the Soil Compartment into Betula Pendula for Two Different Environments: A Polluted and Environmentally Protected Area of Poland. Environ. Sci. Pollut. Res. 2016, 23, 1398–1407. [Google Scholar] [CrossRef] [PubMed]
  17. Chen, Z.C.; Liao, H. Organic Acid Anions: An Effective Defensive Weapon for Plants against Aluminum Toxicity and Phosphorus Deficiency in Acidic Soils. J. Genet. Genom. 2016, 43, 631–638. [Google Scholar] [CrossRef] [PubMed]
  18. Bojórquez-Quintal, E.; Escalante-Magaña, C.; Echevarría-Machado, I.; Martínez-Estévez, M. Aluminum, a Friend or Foe of Higher Plants in Acid Soils. Front. Plant Sci. 2017, 8, 1767. [Google Scholar] [CrossRef] [PubMed]
  19. Sun, L.; Zhang, M.; Liu, X.; Mao, Q.; Shi, C.; Kochian, L.V.; Liao, H. Aluminium Is Essential for Root Growth and Development of Tea Plants (Camellia sinensis). J. Integr. Plant Biol. 2020, 62, 984–997. [Google Scholar] [CrossRef] [PubMed]
  20. Rahman, R.; Upadhyaya, H. Aluminium Toxicity and Its Tolerance in Plant: A Review. J. Plant Biol. 2021, 64, 101–121. [Google Scholar] [CrossRef]
  21. Xia, E.-H.; Tong, W.; Wu, Q.; Wei, S.; Zhao, J.; Zhang, Z.-Z.; Wei, C.-L.; Wan, X.-C. Tea Plant Genomics: Achievements, Challenges and Perspectives. Hortic. Res. 2020, 7, 7. [Google Scholar] [CrossRef] [PubMed]
  22. Gebrewold, A.Z. Review on Integrated Nutrient Management of Tea (Camellia sinensis L.). Cogent Food Agric. 2018, 4, 1543536. [Google Scholar] [CrossRef]
  23. Barcelos, J.P.Q.; Mariano, E.; Jones, D.L.; Rosolem, C.A. Topsoil and Subsoil C and N Turnover Are Affected by Superficial Lime and Gypsum Application in the Short-Term. Soil Biol. Biochem. 2021, 163, 108456. [Google Scholar] [CrossRef]
  24. Xu, H.; Cai, A.; Wu, D.; Liang, G.; Xiao, J.; Xu, M.; Colinet, G.; Zhang, W. Effects of Biochar Application on Crop Productivity, Soil Carbon Sequestration, and Global Warming Potential Controlled by Biochar C:N Ratio and Soil pH: A Global Meta-Analysis. Soil Tillage Res. 2021, 213, 105125. [Google Scholar] [CrossRef]
  25. Joseph, S.; Cowie, A.L.; Van Zwieten, L.; Bolan, N.; Budai, A.; Buss, W.; Cayuela, M.L.; Graber, E.R.; Ippolito, J.A.; Kuzyakov, Y.; et al. How Biochar Works, and When It Doesn’t: A Review of Mechanisms Controlling Soil and Plant Responses to Biochar. GCB Bioenergy 2021, 13, 1731–1764. [Google Scholar] [CrossRef]
  26. Zhu, X.; Mao, L.; Chen, B. Driving Forces Linking Microbial Community Structure and Functions to Enhanced Carbon Stability in Biochar-Amended Soil. Environ. Int. 2019, 133, 105211. [Google Scholar] [CrossRef]
  27. Masud, M.M.; Baquy, M.A.-A.; Akhter, S.; Sen, R.; Barman, A.; Khatun, M.R. Liming Effects of Poultry Litter Derived Biochar on Soil Acidity Amelioration and Maize Growth. Ecotoxicol. Environ. Saf. 2020, 202, 110865. [Google Scholar] [CrossRef] [PubMed]
  28. Shi, R.; Li, J.; Ni, N.; Xu, R. Understanding the Biochar’s Role in Ameliorating Soil Acidity. J. Integr. Agric. 2019, 18, 1508–1517. [Google Scholar] [CrossRef]
  29. Ghorbani, M.; Konvalina, P.; Neugschwandtner, R.W.; Soja, G.; Bárta, J.; Chen, W.-H.; Amirahmadi, E. How Do Different Feedstocks and Pyrolysis Conditions Effectively Change Biochar Modification Scenarios? A Critical Analysis of Engineered Biochars under H2O2 Oxidation. Energy Convers. Manag. 2024, 300, 117924. [Google Scholar] [CrossRef]
  30. Ghorbani, M.; Amirahmadi, E.; Zamanian, K. In-situ Biochar Production Associated with Paddies: Direct Involvement of Farmers in Greenhouse Gases Reduction Policies besides Increasing Nutrients Availability and Rice Production. Land Degrad. Dev. 2021, 32, 3893–3904. [Google Scholar] [CrossRef]
  31. Shetty, R.; Vidya, C.S.-N.; Prakash, N.B.; Lux, A.; Vaculík, M. Aluminum Toxicity in Plants and Its Possible Mitigation in Acid Soils by Biochar: A Review. Sci. Total Environ. 2021, 765, 142744. [Google Scholar] [CrossRef]
  32. Ghorbani, M.; Konvalina, P.; Neugschwandtner, R.W.; Kopecký, M.; Amirahmadi, E.; Moudrý, J.; Menšík, L. Preliminary Findings on Cadmium Bioaccumulation and Photosynthesis in Rice (Oryza sativa L.) and Maize (Zea mays L.) Using Biochar Made from C3- and C4-Originated Straw. Plants 2022, 11, 1424. [Google Scholar] [CrossRef] [PubMed]
  33. Singh, C.; Tiwari, S.; Gupta, V.K.; Singh, J.S. The Effect of Rice Husk Biochar on Soil Nutrient Status, Microbial Biomass and Paddy Productivity of Nutrient Poor Agriculture Soils. Catena 2018, 171, 485–493. [Google Scholar] [CrossRef]
  34. Ghorbani, M.; Asadi, H.; Abrishamkesh, S. Effects of Rice Husk Biochar on Selected Soil Properties and Nitrate Leaching in Loamy Sand and Clay Soil. Int. Soil Water Conserv. Res. 2019, 7, 258–265. [Google Scholar] [CrossRef]
  35. Asadi, H.; Ghorbani, M.; Rezaei-Rashti, M.; Abrishamkesh, S.; Amirahmadi, E.; Chengrong, C.; Gorji, M. Application of Rice Husk Biochar for Achieving Sustainable Agriculture and Environment. Rice Sci. 2021, 28, 325–343. [Google Scholar] [CrossRef]
  36. Ghorbani, M.; Amirahmadi, E. Effect of Rice Husk Biochar (RHB) on Some of Chemical Properties of an Acidic Soil and the Absorption of Some Nutrients. J. Appl. Sci. Environ. Manag. 2018, 22, 313. [Google Scholar] [CrossRef]
  37. Ghorbani, M.; Amirahmadi, E. Effect of Rice Husk Biochar on Some Physical Characteristics of Soil and Corn Growth in a Loamy Soil. Iran. J. Soil Res. 2018, 32, 305–318. [Google Scholar] [CrossRef]
  38. Ghorbani, M.; Asadi, H.; Abrishamkesh, S. Effect of Rice Husk Biochar on Nitrate Leaching in a Clayey Soil. Iran. J. Soil Res. 2016, 29, 127–434. [Google Scholar] [CrossRef]
  39. Fidel, R.B.; Laird, D.A.; Thompson, M.L.; Lawrinenko, M. Characterization and Quantification of Biochar Alkalinity. Chemosphere 2017, 167, 367–373. [Google Scholar] [CrossRef]
  40. Munera-Echeverri, J.L.; Martinsen, V.; Strand, L.T.; Zivanovic, V.; Cornelissen, G.; Mulder, J. Cation Exchange Capacity of Biochar: An Urgent Method Modification. Sci. Total Environ. 2018, 642, 190–197. [Google Scholar] [CrossRef]
  41. Mingorance, M.D.; Barahona, E.; Fernández-Gálvez, J. Guidelines for Improving Organic Carbon Recovery by the Wet Oxidation Method. Chemosphere 2007, 68, 409–413. [Google Scholar] [CrossRef]
  42. Fu, Q.; Yan, J.; Li, H.; Li, T.; Hou, R.; Liu, D.; Ji, Y. Effects of Biochar Amendment on Nitrogen Mineralization in Black Soil with Different Moisture Contents under Freeze-Thaw Cycles. Geoderma 2019, 353, 459–467. [Google Scholar] [CrossRef]
  43. Horta, M.D.C.; Torrent, J. The Olsen P Method as an Agronomic and Environmental Test for Predicting Phosphate Release from Acid Soils. Nutr. Cycl. Agroecosyst. 2007, 77, 283–292. [Google Scholar] [CrossRef]
  44. Lu, D.; Li, C.; Sokolwski, E.; Magen, H.; Chen, X.; Wang, H.; Zhou, J. Crop Yield and Soil Available Potassium Changes as Affected by Potassium Rate in Rice–Wheat Systems. Field Crops Res. 2017, 214, 38–44. [Google Scholar] [CrossRef]
  45. Tournassat, C.; Greneche, J.-M.; Tisserand, D.; Charlet, L. The Titration of Clay Minerals. J. Colloid Interface Sci. 2004, 273, 224–233. [Google Scholar] [CrossRef]
  46. Kostin, A.S.; Krechetov, P.P.; Chernitsova, O.V.; Terskaya, E.V. Geochemical Transformations in Liquid and Solid Phases of Sod–Podzols in Technogenically Disturbed Landscapes of the Moscow Brown Coal Basin. Mosc. Univ. Soil Sci. Bull. 2021, 76, 283–290. [Google Scholar] [CrossRef]
  47. Tomczyk, A.; Sokołowska, Z.; Boguta, P. Biochar Physicochemical Properties: Pyrolysis Temperature and Feedstock Kind Effects. Rev. Environ. Sci. Biotechnol. 2020, 19, 191–215. [Google Scholar] [CrossRef]
  48. Li, W.; Johnson, C.E. Relationships among pH, Aluminum Solubility and Aluminum Complexation with Organic Matter in Acid Forest Soils of the Northeastern United States. Geoderma 2016, 271, 234–242. [Google Scholar] [CrossRef]
  49. Liu, Y.-Q.; Lv, W.-X.; Zhao, Z.-Q.; Yang, Y.-P.; Zhang, L.-X.; Wang, L.-Y.; Jing, C.-Y.; Duan, G.-L.; Zhu, Y.-G. Aluminum Adsorption and Antimonite Oxidation Dominantly Regulate Antimony Solubility in Soils. Chemosphere 2022, 309, 136651. [Google Scholar] [CrossRef] [PubMed]
  50. Najafi, S.; Jalali, M. Effect of Heavy Metals on pH Buffering Capacity and Solubility of Ca, Mg, K, and P in Non-Spiked and Heavy Metal-Spiked Soils. Environ. Monit. Assess. 2016, 188, 342. [Google Scholar] [CrossRef]
  51. Dong, Y.; Yang, J.-L.; Zhao, X.-R.; Yang, S.-H.; Mulder, J.; Dörsch, P.; Peng, X.-H.; Zhang, G.-L. Soil Acidification and Loss of Base Cations in a Subtropical Agricultural Watershed. Sci. Total Environ. 2022, 827, 154338. [Google Scholar] [CrossRef]
  52. Duan, Y.; Lee, J.Y.; Xi, S.; Sun, Y.; Ge, J.; Ong, S.J.H.; Chen, Y.; Dou, S.; Meng, F.; Diao, C.; et al. Anodic Oxidation Enabled Cation Leaching for Promoting Surface Reconstruction in Water Oxidation. Angew. Chem. Int. Ed. 2021, 60, 7418–7425. [Google Scholar] [CrossRef] [PubMed]
  53. Tan, X.-F.; Zhu, S.-S.; Wang, R.-P.; Chen, Y.-D.; Show, P.-L.; Zhang, F.-F.; Ho, S.-H. Role of Biochar Surface Characteristics in the Adsorption of Aromatic Compounds: Pore Structure and Functional Groups. Chin. Chem. Lett. 2021, 32, 2939–2946. [Google Scholar] [CrossRef]
  54. Chintala, R.; Mollinedo, J.; Schumacher, T.E.; Malo, D.D.; Julson, J.L. Effect of Biochar on Chemical Properties of Acidic Soil. Arch. Agron. Soil Sci. 2014, 60, 393–404. [Google Scholar] [CrossRef]
  55. Wan, Q.; Yuan, J.-H.; Xu, R.-K.; Li, X.-H. Pyrolysis Temperature Influences Ameliorating Effects of Biochars on Acidic Soil. Environ. Sci. Pollut. Res. 2014, 21, 2486–2495. [Google Scholar] [CrossRef]
  56. He, L.; Zhao, J.; Wang, M.; Liu, Y.; Wang, Y.; Yang, S.; Wang, S.; Zhao, X.; Lyu, H. Long-Term Successive Seasonal Application of Rice Straw-Derived Biochar Improves the Acidity and Fertility of Red Soil in Southern China. Agronomy 2023, 13, 505. [Google Scholar] [CrossRef]
  57. Qian, L.; Chen, B. Interactions of Aluminum with Biochars and Oxidized Biochars: Implications for the Biochar Aging Process. J. Agric. Food Chem. 2014, 62, 373–380. [Google Scholar] [CrossRef] [PubMed]
  58. Fan, Q.; Sun, J.; Chu, L.; Cui, L.; Quan, G.; Yan, J.; Hussain, Q.; Iqbal, M. Effects of Chemical Oxidation on Surface Oxygen-Containing Functional Groups and Adsorption Behavior of Biochar. Chemosphere 2018, 207, 33–40. [Google Scholar] [CrossRef]
  59. Li, X.; Zhang, J.; Liu, B.; Su, Z. A Critical Review on the Application and Recent Developments of Post-Modified Biochar in Supercapacitors. J. Clean. Prod. 2021, 310, 127428. [Google Scholar] [CrossRef]
  60. Ghorbani, M.; Konvalina, P.; Kopecký, M.; Kolář, L. A Meta-analysis on the Impacts of Different Oxidation Methods on the Surface Area Properties of Biochar. Land Degrad. Dev. 2023, 34, 299–312. [Google Scholar] [CrossRef]
  61. Sahoo, S.S.; Vijay, V.K.; Chandra, R.; Kumar, H. Production and Characterization of Biochar Produced from Slow Pyrolysis of Pigeon Pea Stalk and Bamboo. Clean. Eng. Technol. 2021, 3, 100101. [Google Scholar] [CrossRef]
  62. Singh, H.; Northup, B.K.; Rice, C.W.; Prasad, P.V.V. Biochar Applications Influence Soil Physical and Chemical Properties, Microbial Diversity, and Crop Productivity: A Meta-Analysis. Biochar 2022, 4, 8. [Google Scholar] [CrossRef]
  63. Wang, L.; O’Connor, D.; Rinklebe, J.; Ok, Y.S.; Tsang, D.C.W.; Shen, Z.; Hou, D. Biochar Aging: Mechanisms, Physicochemical Changes, Assessment, And Implications for Field Applications. Environ. Sci. Technol. 2020, 54, 14797–14814. [Google Scholar] [CrossRef]
  64. Li, J.; Liang, N.; Jin, X.; Zhou, D.; Li, H.; Wu, M.; Pan, B. The Role of Ash Content on Bisphenol A Sorption to Biochars Derived from Different Agricultural Wastes. Chemosphere 2017, 171, 66–73. [Google Scholar] [CrossRef]
  65. Dai, Y.; Zheng, H.; Jiang, Z.; Xing, B. Combined Effects of Biochar Properties and Soil Conditions on Plant Growth: A Meta-Analysis. Sci. Total Environ. 2020, 713, 136635. [Google Scholar] [CrossRef] [PubMed]
  66. Fan, L.; Zhou, X.; Liu, Q.; Wan, Y.; Cai, J.; Chen, W.; Chen, F.; Ji, L.; Cheng, L.; Luo, H. Properties of Eupatorium adenophora Spreng (Crofton Weed) Biochar Produced at Different Pyrolysis Temperatures. Environ. Eng. Sci. 2019, 36, 937–946. [Google Scholar] [CrossRef]
  67. Wei, L.; Xu, G.; Shao, H.; Sun, J.; Chang, S.X. Regulating Environmental Factors of Nutrients Release from Wheat Straw Biochar for Sustainable Agriculture. CLEAN-Soil Air Water 2013, 41, 697–701. [Google Scholar] [CrossRef]
  68. Joseph, U.E.; Toluwase, A.O.; Kehinde, E.O.; Omasan, E.E.; Tolulope, A.Y.; George, O.O.; Zhao, C.; Hongyan, W. Effect of Biochar on Soil Structure and Storage of Soil Organic Carbon and Nitrogen in the Aggregate Fractions of an Albic Soil. Arch. Agron. Soil Sci. 2020, 66, 1–12. [Google Scholar] [CrossRef]
  69. Dissanayake, P.D.; Palansooriya, K.N.; Sang, M.K.; Oh, D.X.; Park, J.; Hwang, S.Y.; Igalavithana, A.D.; Gu, C.; Ok, Y.S. Combined Effect of Biochar and Soil Moisture on Soil Chemical Properties and Microbial Community Composition in Microplastic-contaminated Agricultural Soil. Soil Use Manag. 2022, 38, 1446–1458. [Google Scholar] [CrossRef]
  70. Palansooriya, K.N.; Wong, J.T.F.; Hashimoto, Y.; Huang, L.; Rinklebe, J.; Chang, S.X.; Bolan, N.; Wang, H.; Ok, Y.S. Response of Microbial Communities to Biochar-Amended Soils: A Critical Review. Biochar 2019, 1, 3–22. [Google Scholar] [CrossRef]
  71. Jones, D.L.; Rousk, J.; Edwards-Jones, G.; DeLuca, T.H.; Murphy, D.V. Biochar-Mediated Changes in Soil Quality and Plant Growth in a Three Year Field Trial. Soil Biol. Biochem. 2012, 45, 113–124. [Google Scholar] [CrossRef]
  72. Chen, Q.; Liu, H.; Ko, J.; Wu, H.; Xu, Q. Structure Characteristics of Bio-Char Generated from Co-Pyrolysis of Wooden Waste and Wet Municipal Sewage Sludge. Fuel Process. Technol. 2019, 183, 48–54. [Google Scholar] [CrossRef]
  73. El-Naggar, A.; Lee, S.S.; Rinklebe, J.; Farooq, M.; Song, H.; Sarmah, A.K.; Zimmerman, A.R.; Ahmad, M.; Shaheen, S.M.; Ok, Y.S. Biochar Application to Low Fertility Soils: A Review of Current Status, and Future Prospects. Geoderma 2019, 337, 536–554. [Google Scholar] [CrossRef]
  74. Jing, Y.; Zhang, Y.; Han, I.; Wang, P.; Mei, Q.; Huang, Y. Effects of Different Straw Biochars on Soil Organic Carbon, Nitrogen, Available Phosphorus, and Enzyme Activity in Paddy Soil. Sci. Rep. 2020, 10, 8837. [Google Scholar] [CrossRef]
  75. Wang, Z.; Zong, H.; Zheng, H.; Liu, G.; Chen, L.; Xing, B. Reduced Nitrification and Abundance of Ammonia-Oxidizing Bacteria in Acidic Soil Amended with Biochar. Chemosphere 2015, 138, 576–583. [Google Scholar] [CrossRef]
  76. Yoo, G.; Lee, Y.O.; Won, T.J.; Hyun, J.G.; Ding, W. Variable Effects of Biochar Application to Soils on Nitrification-Mediated N2O Emissions. Sci. Total Environ. 2018, 626, 603–611. [Google Scholar] [CrossRef]
  77. Li, S.; Zhang, Y.; Yan, W.; Shangguan, Z. Effect of Biochar Application Method on Nitrogen Leaching and Hydraulic Conductivity in a Silty Clay Soil. Soil Tillage Res. 2018, 183, 100–108. [Google Scholar] [CrossRef]
Figure 1. Geographical location of study sites along the Caspian Sea.
Agronomy 14 00533 g001
Figure 2. Fourier transform infrared (FTIR) spectrum of the used biochar.
Agronomy 14 00533 g002
Figure 3. Effect of different treatments on Al and Ca saturations in six study sites as follows: (a) fooman, (b) Rasht, (c) Lahijan, (d) Amlash, (e) Chaboksar, and (f) Shahsavar. Different lowercase signs represent a significant difference between the mean of Ca and Al saturations affected by different treatments at p < 0.05. Bars represent standard errors (n = 3).
Agronomy 14 00533 g003
Figure 4. Effect of different treatments on acid saturation (AS), base saturation (BS), and effective cation exchange capacity (ECEC) in six study sites as follows: (a) fooman, (b) Rasht, (c) Lahijan, (d) Amlash, (e) Chaboksar, and (f) Shahsavar. Different lowercase signs represent a significant difference between the mean of AS and BS affected by different treatments at p < 0.05. Different uppercase signs represent a significant difference between the mean of ECEC affected by different treatments at p < 0.05.
Agronomy 14 00533 g004aAgronomy 14 00533 g004b
Figure 5. Effect of different treatments on availability of nitrogen (N), phosphorous (P), and potassium (K) in six study sites as follows: (a) fooman, (b) Rasht, (c) Lahijan, (d) Amlash, (e) Chaboksar, and (f) Shahsavar. Different lowercase signs represent a significant difference between the mean of AS and BS affected by different treatments at p < 0.05. Bars represent standard errors (n = 3).
Agronomy 14 00533 g005aAgronomy 14 00533 g005b
Figure 6. Pearson correlation matrix between different properties of soils including acidity (pH), electrical conductivity (EC), organic matter (OM), exchangeable cations (Ca2+, Mg2+, K+, Na+, H+, Al3+, and NH4+), effective cation exchange capacity (ECEC), base saturation (BS), acid saturation (AS), Ca saturation (CaS), Al saturation (AlS), and macronutrient availability (NAv, PAv, and KAv). Color spectra represent the coefficient of determination (blue and red indicate the intensity of negative and positive correlation, respectively). * p < 0.05, ** p < 0.01, and *** p < 0.001.
Agronomy 14 00533 g006
Table 1. Environmental description of the study areas.
PropertyFoomanRashtLahijanAmlashChaboksarShahsavar
General climateHumid
subtropical
Humid
subtropical
Humid
subtropical
Humid
subtropical
MediterraneanMediterranean
Average annual temperature (°C)19.82 ± 1.34 *19.41 ± 1.4718.46 ± 2.4518.91 ± 0.9719.33 ± 0.2320.41 ± 1.23
Average annual precipitation (mm)110.2 ± 5.64107.6 ± 2.75102.4 ± 6.8989.95 ± 4.5351.71 ± 9.5454.58 ± 3.45
Rainy days per year130.1 ± 1.42127.1 ± 1.28120.9 ± 1.37116.8 ± 1.9379.89 ± 1.8184.31 ± 1.21
Relative humidity (%)74.83 ± 2.4373.33 ± 3.7369.82 ± 1.2168.43 ± 1.7562.41 ± 3.8565.85 ± 6.15
Monthly sunshine (h−1)11.02 ± 1.210.75 ± 0.6810.23 ± 0.9410.61 ± 0.8310.43 ± 0.8211.01 ± 1.34
Parent materialGraniteGraniteGraniteGranitePhyllitePhyllite
Clay mineralsMica, MontmorilloniteQuartz,
Mica
Mica,
Feldspar
Feldspar, MontmorilloniteQuartz,
Chlorite
Chlorite,
Sericite mica
Soil taxonomyTypic
Hapludalfs
Typic
Hapludalfs
Ultic
Hapludalfs
Inceptic HapludalfsTypic DystrudeptsTypic Udorthents
Sand:Silt:Clay (%)78.3:14.2:7.557.1:38.2:4.761.4:10.3:28.350.1:39.6:10.355.7:10.1:34.244.6:24.2:31.2
Soil textureLoamy sandSandy claySandy loamSandy claySandy loamLoam
* Standard deviation.
Table 2. Physicochemical properties of used rice husk biochar.
PropertyValuePropertyValue
pH8.91O/C0.15
EC (dS m−1)0.28H/C0.61
CEC (cmol(c+) kg−1)68.2BY (%)40.9
Ca2+Ex (cmol(c+) kg−1)5.24MC (%)0.22
Mg2+Ex (cmol(c+) kg−1)7.15VM (%)30.7
K+Ex (cmol(c+) kg−1)4.18AC (%)17.8
Na+Ex (cmol(c+) kg−1)1.15FC (%)51.3
PAv (mg g−1)3.76SSA (m2 g−1)151.8
C (%)63.4BD (g cm−3)0.23
H (%)3.24Vt (cm3 g−1)0.118
N (%)3.15Vmicro (cm3 g−1)0.067
O (%)12.4Vmeso & macro (cm3 g−1)0.051
EC: electric conductivity, CEC: cation exchange capacity, Ca2+Ex: exchangeable calcium, Mg2+Ex: exchangeable magnesium, K+Ex: exchangeable potassium, Na+Ex: exchangeable sodium, PAv: available phosphorous, C: carbon, H: hydrogen, N: nitrogen, O: oxygen, BY: biochar yield, MC: moisture content, VM: volatile matter, AC: ash content, FC: fixed carbon, SSA: specific surface area, BD: bulk density, Vt: total pore volume, Vmicro: micro-pores, Vmeso: meso-pores, and Vmacro: macro-pores.
Table 3. Changes in soil cations’ status under different treatments at the end of the experiment.
SitesTreatmentspHEC
(dS m−1)
OC (%)Ex-Base Cations (cmol(c+) kg−1)Ex-Acid Cations
(cmol(c+) kg−1)
Av-N Content (mg kg−1)
Ca2+Mg2+K+Na+H+Al3+NH4+NO3
FoomanCK3.52 d0.35 b2.49 d1.11 d0.57 d0.23 d0.75 c3.020 a1.82 a5.32 a8.54 d
B54.39 c0.37 b4.76 b2.29 c4.98 c2.65 c0.77 c0.407 b1.65 a4.27 b12.85 c
B105.39 b0.41 a6.57 ab8.87 b7.58 b4.96 b0.92 b0.041 c1.26 b3.24 c13.45 b
B156.28 a0.42 a7.33 a10.2 a12.3 a5.24 a1.12 a0.005 d0.57 c2.19 d16.42 a
CaCO34.49 c0.39 a2.99 cd2.58 c0.42 d0.25 d0.18 d0.324 b1.09 b5.38 a8.34 d
RashtCK4.01 c0.22 b1.85 e0.67 e0.69 d0.36 d0.83 b0.977 a1.46 a6.36 a7.15 c
B54.72 b0.28 ab3.65 c5.72 c3.83 c1.41 c0.91 b0.191 b1.42 a5.54 b10.72 b
B105.64 a0.29 ab5.35 b10.3 b6.23 b2.87 b0.87 b0.023 c0.98 c5.11 b11.14 b
B156.22 a0.32 a7.21 a13.6 a9.72 a4.92 a1.03 a0.006 d0.84 c3.47 c15.53 a
CaCO34.71 b0.31 a2.62 d2.46 d0.59 d0.39 d0.84 b0.195 b1.02 b6.21 a6.72 c
LahijanCK3.16 c0.49 b1.44 e1.01 d1.12 d0.68 d0.35 c6.918 a1.78 a7.95 a9.09 d
B55.01 b0.51 b3.01 c2.42 c1.56 c1.13 c0.42 b0.098 c1.74 a6.98 ab11.45 c
B105.41 a0.53 ab4.85 b4.13 b4.83 b3.22 b0.46 b0.039 d1.56 b5.47 b13.73 b
B155.97 a0.56 a6.92 a7.29 a9.21 a5.58 a0.51 a0.011 e1.02 c3.32 c15.47 a
CaCO34.47 bc0.43 c2.81 d2.63 c1.07 d0.76 d0.39 bc0.339 b1.39 b7.54 a8.17 d
AmlashCK3.29 d0.36 b2.35 e1.12 e0.42 d0.28 c0.62 b5.129 a1.48 a6.25 a7.44 d
B54.35 c0.39 ab4.55 c4.35 c1.84 c0.31 c0.95 a0.447 b1.01 b5.37 b9.75 c
B105.42 b0.41 a6.28 b6.84 b3.53 b1.94 b0.91 a0.038 d0.86 c3.62 c12.42 b
B156.38 a0.43 a7.79 a10.7 a6.35 a3.34 a0.96 a0.004 e0.51 d2.06 d14.71 a
CaCO34.81 c0.42 a3.55 d2.31 d0.62 d0.29 c0.76 b0.155 c0.91 b5.89 a6.02 d
ChaboksarCK4.21 c0.69 b2.19 d0.69 e1.29 d0.56 c0.21 c0.617 a1.69 a6.69 a7.46 d
B55.59 b0.71 ab3.01 c1.16 d4.15 c0.64 b0.32 b0.026 c1.58 b6.28 a10.43 c
B106.24 a0.73 a5.44 b3.23 b6.29 b0.94 a0.36 ab0.006 d1.55 b4.37 b13.76 b
B156.66 a0.76 a6.28 a7.16 a8.82 a0.99 a0.41 a0.002 d1.23 bc2.12 c16.28 a
CaCO35.32 b0.71 ab2.35 cd2.24 c1.32 d0.54 b0.23 c0.048 b1.12 c6.05 a7.11 d
ShahsavarCK3.97 c0.37 b2.53 d0.86 e1.02 c0.87 c0.43 c1.072 a1.41 a6.78 a7.08 a
B54.68 b0.39 b3.89 c5.35 c1.52 b0.89 c0.44 c0.209 b1.02 b5.44 b8.74 b
B105.49 a0.42 a5.31 b7.84 b1.97 ab0.95 b0.59 b0.032 d0.71 c3.63 c12.63 c
B156.13 a0.43 a7.21 a11.5 a2.19 a1.26 a0.73 a0.007 e0.39 d2.12 d14.32 d
CaCO34.73 b0.38 b3.35 cd2.24 d1.09 c0.92 b0.42 c0.186 c0.65 c6.33 a7.13 a
EC: electric conductivity, OC: organic carbon, Ca2+Ex: exchangeable calcium, Mg2+Ex: exchangeable magnesium, K+Ex: exchangeable potassium, Na+Ex: exchangeable sodium, H+: hydrogen, Al3+: aluminum, NH4+: ammonium, NO3: nitrate. Significant differences between treatments are shown in lower case letters (LSD test, p < 0.05).
Disclaimer/Publisher’s Note: The statements, opinions and data contained in all publications are solely those of the individual author(s) and contributor(s) and not of MDPI and/or the editor(s). MDPI and/or the editor(s) disclaim responsibility for any injury to people or property resulting from any ideas, methods, instructions or products referred to in the content.

