Article

Occurrence of Diseases and Seed Yield of Early Maturing Soybean Cultivars Grown under the Conditions of Central Europe

1
Department of Agroecology and Plant Production, University of Agriculture in Krakow, Al. Mickiewicza 21, 31-120 Krakow, Poland
2
Department of Ecology, Climatology and Air Protection, Faculty of Environmental Engineering and Land Surveying, University of Agriculture in Cracow, Al. Mickiewicza 24/28, 30-059 Krakow, Poland
3
Department of Sanitary Engineering and Water Management, Faculty of Environmental Engineering and Land Surveying, University of Agriculture in Cracow, Al. Mickiewicza 24/28, 30-059 Krakow, Poland
4
Department of Microbiology and Biomonitoring, University of Agriculture in Krakow, Al. Mickiewicza 21, 31-120 Krakow, Poland
*
Author to whom correspondence should be addressed.
Agronomy 2024, 14(3), 534; https://doi.org/10.3390/agronomy14030534
Submission received: 1 February 2024 / Revised: 19 February 2024 / Accepted: 3 March 2024 / Published: 5 March 2024
(This article belongs to the Section Pest and Disease Management)

Abstract

:
The aim of the study was to assess the health status and seed yield of selected soybean cultivars grown in the climate conditions of Central Europe. The health of 22 soybean cultivars was assessed during the study period (2017–2022). Cultivars from two earliness classes (1 and 2) were included in order to capture the entire spectrum of variation in the degree of infection with seven fungal diseases throughout the growing season, i.e., from sowing to harvest. Based on analysis of meteorological conditions in the critical phase of soybean development (from flowering to pod formation), two distinct periods were distinguished according to temperature and rainfall: normal (2017–2019) and anomalous (2020–2022). Ward’s cluster analysis distinguished two clusters that differed in terms of the weather conditions and severity and number of diseases observed for analyzed soybean cultivars during six years of the study. The first cluster included the period 2017–2019, which was characterized as normal in terms of temperature and rainfall. The second cluster included the period 2020–2022, which was characterized as anomalous in terms of temperature and rainfall. In the normal years (2017–2019), only Fusarium of the leaves was not observed during the soybean growing period. Seven diseases were observed in the anomalous years (2020–2022), and the degree of infection of the plants was greater. The Aligator cultivar in class 2, with a longer growing period, showed the highest yield stability. In the anomalous years, yield stability was highest for the class 2 cultivar Viola and lowest for the Acardia cultivar of the same class. In the whole study period, the Abelina cultivar (class 1) had a low coefficient of variation for yield, which means that this soybean cultivar is one of the most stable in terms of yield.

1. Introduction

The European demand for plant protein for fodder production is currently high, and this trend will persist in the coming decades [1]. To address this demand, the European Union has introduced various strategies (e.g., soybean imports, subsidies for production of protein crops, and diversification of protein sources) aimed at strengthening the food security of its member countries. The latest data (2022) indicate that the EU imports about 14 Mt of soybean seeds and 18 Mt of soybean meal [2]. Domestic production of protein crops such as soybean, field bean, or lupine is promoted as well [2]. In Europe the cultivation area of legume crops, including soybean, is small, mainly for cultural reasons, but also due to climatic determinants [1,3]. In 2019, the soybean cultivation area was 5.7 million ha, and total production amounted to 12 million tons [4], while 21 million tons were imported [5]. The areas where soybean is grown in Europe are mainly concentrated between 45° and 50° latitude, with the greatest production in Eastern Europe (Ukraine 3.7 million tons, Serbia 0.7 million tons, Romania 0.4 million tons in 2019) and the northern Mediterranean (Italy 1.0 million tons, France 0.4 million tons in 2019) [5]. In the east of Europe, where the climate becomes more continental, soybean production is limited by the risk of spring frosts, while soybean production in the UK is limited by lower air temperatures and the risk of autumn rain, impeding harvest. In southern Europe, the main limitation is water availability. Climate change is expected to change this situation through diversification of currently used plot rotations, with soybean replacing pea or field bean as a strategy to reduce the growing risk of loss of crops to drought [1,6].
Hopes for increased soybean production are based on climate models of crop yields, which estimate the increases in global air temperature in the upcoming decades [7]. Prognoses indicate an increase in soybean production in Central Europe, whereas production in Southern Europe will be increasingly dependent on additional irrigation. It is estimated that average soybean productivity may increase by 8%, and the production area by 10% [1].
New soybean cultivars have high yield potential. For this potential to be realized, all factors limiting production must be eliminated. The most common causes of reduced soybean yield are poor cultivation techniques, weed infestation, and the presence of pests and fungal diseases. Awareness of good cultivation techniques has been growing among farmers from year to year, owing to which the problems of weed infestation or unsuitable fertilization have been eliminated. Currently a major problem is diseases, which just a few years ago were not a problem in soybean cultivation in Central Europe [8]. Diseases affecting soybean plants include damping off of seedlings, Ascochyta blight, anthracnose, Septoria brown spot, Fusarium rot of the root crown and base of the stem, Fusarium wilt, Cercospora leaf blight, and Fusarium pod blight [8,9]. The aim of current breeding is to optimally adapt soybean cultivars to the climatic conditions of central Europe while achieving and maintaining sufficiently high fertility and resistance to disease [10]. In central Europe, soybean yield depends on the cultivar’s photoperiodic sensitivity and its ability to mature within the vegetation period. The most productive are cultivars with longer vegetation from the second class of earliness (ca 140–150 days), however weather conditions routinely affect them. This is a reason why farmers select cultivars with shorter vegetation length from the first class of earliness (ca 120–135), which are less unreliable in less favorable weather conditions.
We can distinguish several factors affecting the occurrence of soybean diseases [11,12,13,14,15,16,17]. The most important factors influencing the severity of plant diseases in European conditions are variable temperature and rainfall conditions. Weather conditions can have a positive or negative impact on plant development. Frequent rainfall and high moisture levels are conducive to the development of diseases [11]. Cultivation practices influencing the intensity of fungal diseases include crop sequences and the regionalization of cultivars [17,18]. Monoculture is conducive to the development of fungal diseases, and for this reason biodiversity in the composition of crop rotations is promoted. Regionalization of cultivars is an important factor unrelated to expenditures, which limits the occurrence of fungal diseases. Breeders’ main goal in the last 10 years has been to improve the quantitative and qualitative traits of soybean. However, due to the increase in the severity of diseases in soybean cultivation, there is a need for breeding work aimed at increasing the resistance of plants to fungal diseases. Inadequate knowledge of the effect of the occurrence of diseases on soybean yield and the dependencies between co-occurring diseases in relation to the earliness classes of cultivars prompted the research presented in this study [18].
The aim of the study was to assess the health status and yield of selected soybean cultivars in the climate conditions of Central Europe. Soybean cultivars from two earliness classes were included in the study.

2. Materials and Methods

2.1. Study Site

Empirical data were obtained at the Experimental Station of the University of Agriculture in Krakow, located in Prusy (47°24′ N, 7°19′ E, 300 m a.s.l.). The geographical coordinates of the experimental field are 50°07′01″ N and 20°05′19″ E, and it lies 270 m above sea level. The experiment was set up on degraded chernozem (Umbrisols—FAO). This type of soil is fine-grained, with moderate amounts of P, K, and Mg, 1.21% organic carbon, and 0.16% total nitrogen.

2.2. Experimental Design

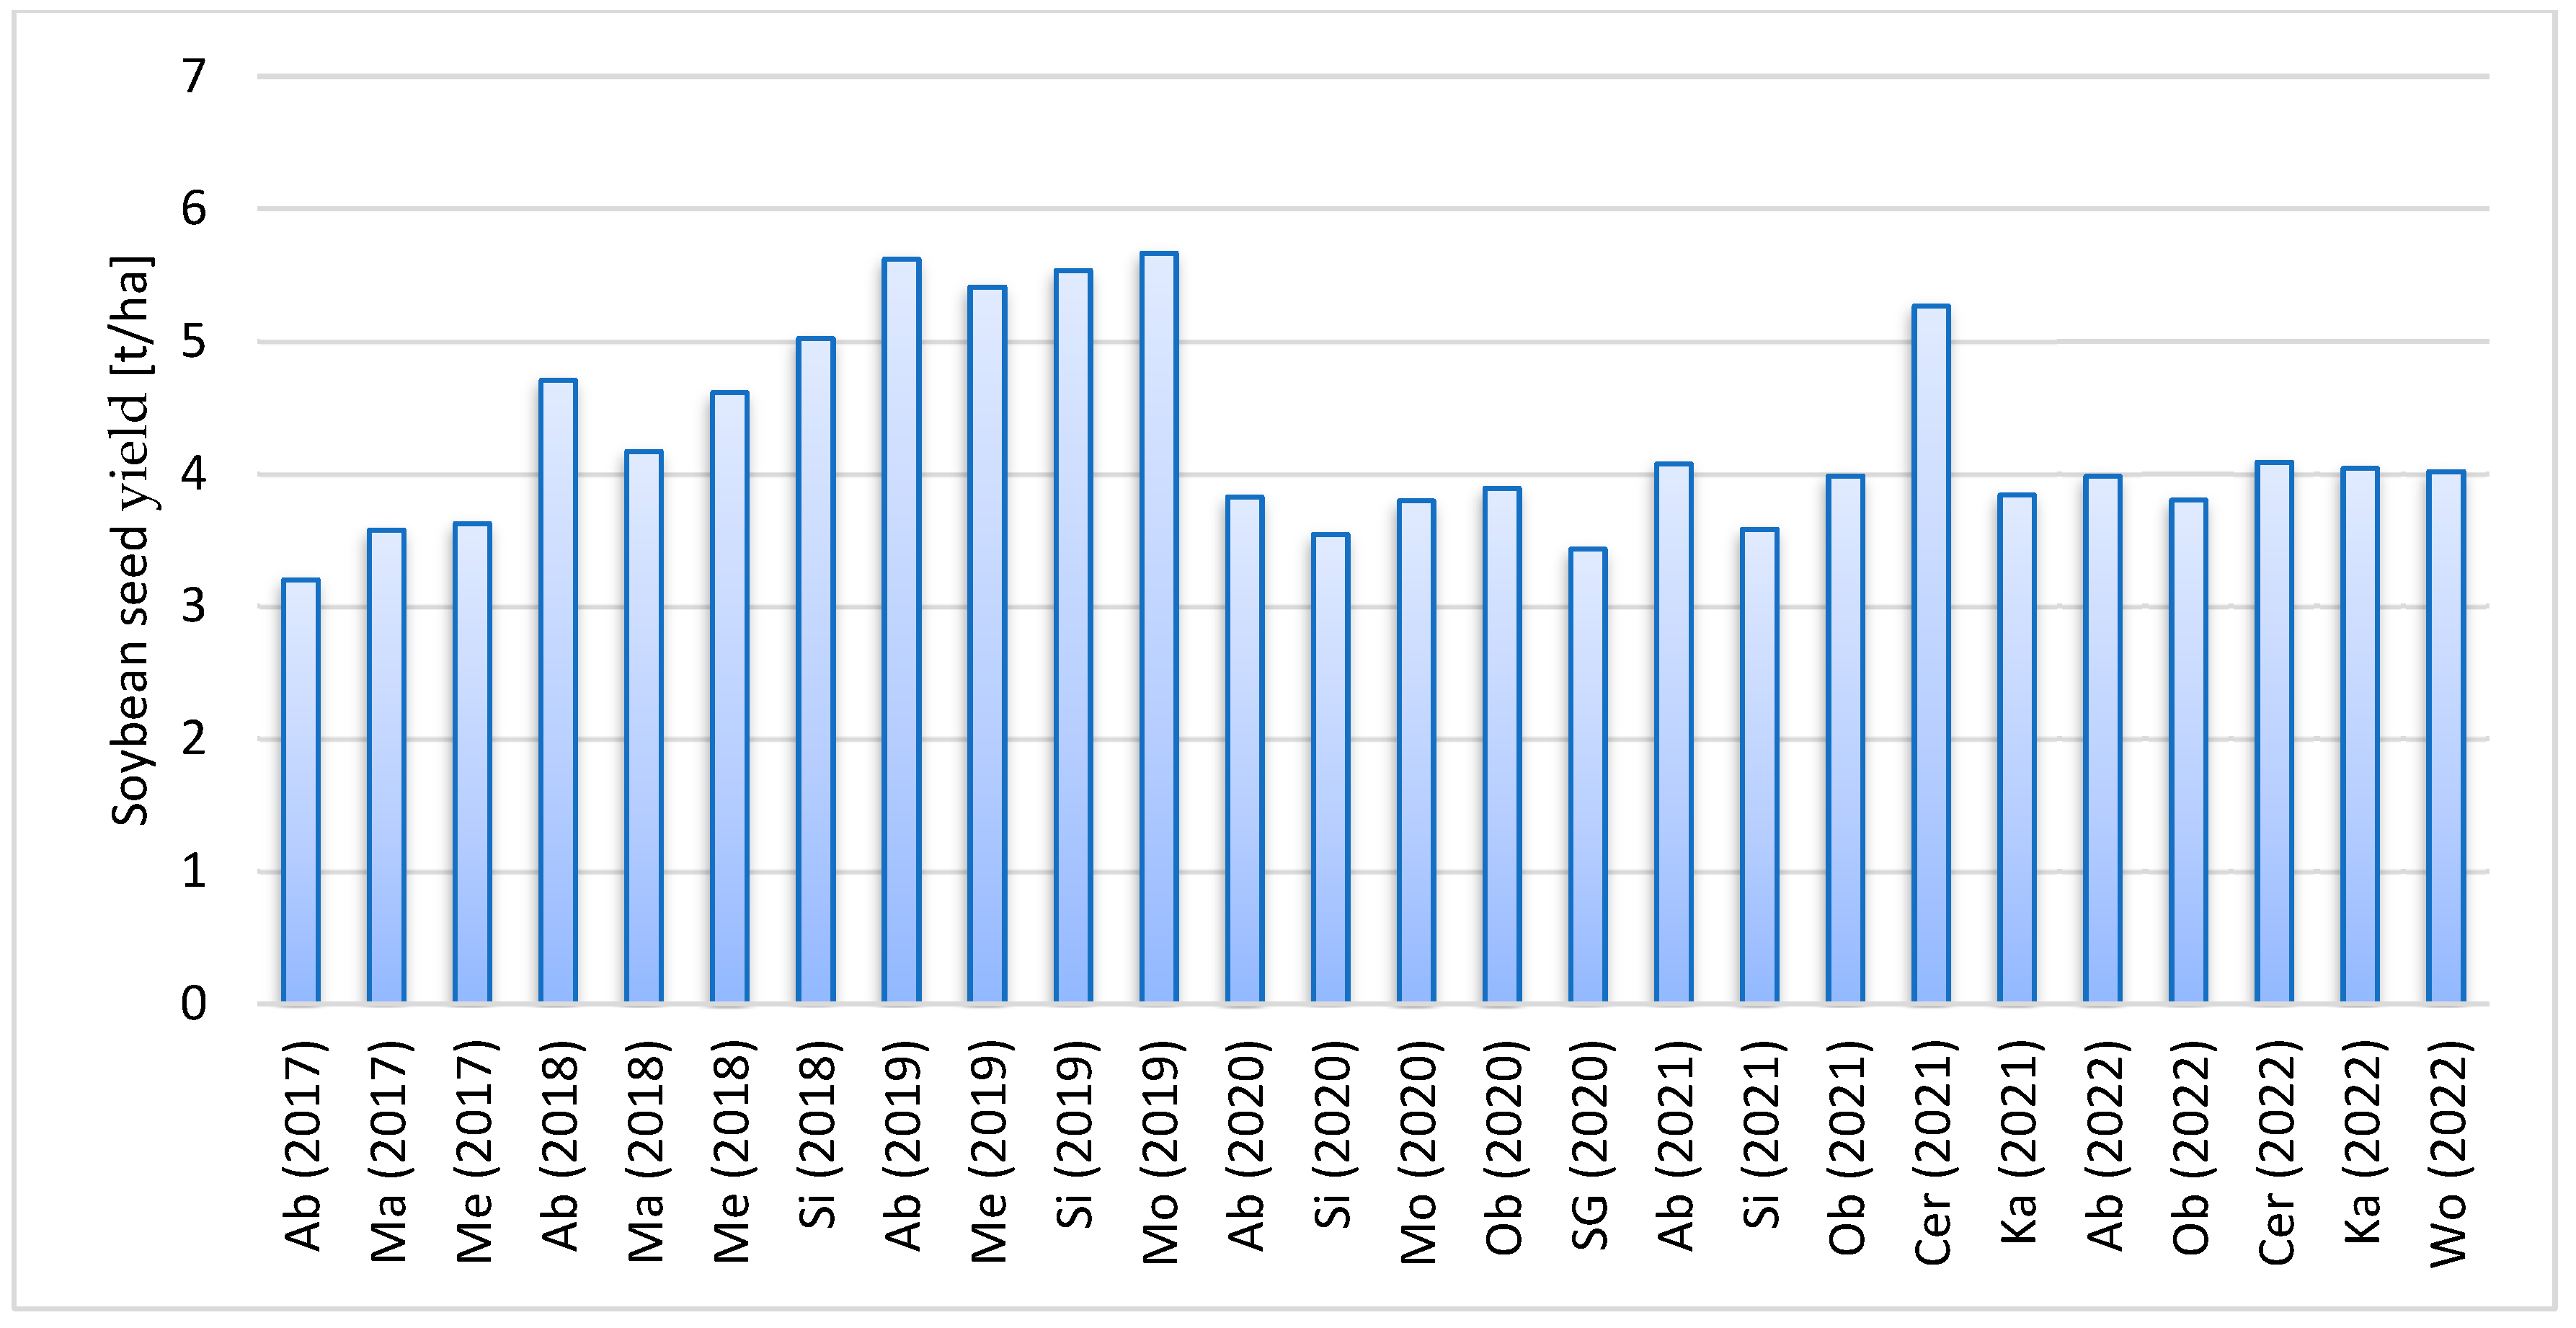
A single-factor field experiment was set up in a randomized block design in three replicates. The yield of soybean cultivars of two earliness classes (classes 1 and 2) was analyzed over a six-year period (2017–2022) (Figure A1 and Figure A2). The experimental factor was the choice of cultivar. The plot area was 10 m2. Soybean was sown at a density of 70 seeds/m2 at 25 cm spacing. Seeds for sowing were treated with bacterial inoculant Nitragina (BIOFOOD®, Houston, TX, USA)—wet inoculation.
The precursor crops for soybean in each year were cereals. After harvest, post-harvest and pre-winter treatments were carried out. Mineral fertilizers were applied before sowing, and the field was tilled with a harrow and a cultivator. The following mineral fertilizers were applied: ammonium nitrate (34%) at 60 kg·ha−1, potassium chloride (60%) at 120 kg·ha−1, and triple granulated superphosphate (46%) at 80 kg·ha−1. Sowing was carried out in the last 10 days of April of each year using a seed drill, at 25 cm spacing. The plants were harvested in the first 10 days of September. Chemical plant protection was applied during soybean growth. Weed control was carried out twice, using Basagran 480 SL at 3 L·ha−1 and Fusilade Forte 150 Ec. No fungicides were applied.

2.3. Assessment of the Health Status of Soybean Plants

The health of 22 soybean cultivars was assessed during the study period (2017–2022). Cultivars from two earliness classes (1 and 2) were included in order to capture the entire spectrum of variation in the degree of infection with fungal diseases throughout the growing season, i.e., from sowing to harvest.
In 2017, six soybean cultivars were evaluated: in class 1, Abelina (Ab), Mavka (Ma), and Merlin (Me); in class 2, Sultana (Su), Aligator (Al), and Lissabon (Li)).
In 2018, nine soybean cultivars were evaluated: in class 1, Abelina (Ab), Mavka (Ma), Merlin (Me), and Sirelia (Si); in class 2, Sultana (Su), Aligator (Al), Protina (Pr), Lissabon (Li), and GL Melanie (GL).
In 2019, 10 soybean cultivars were evaluated: in class 1, Moravians (Mo), Sirelia (Si), Abelina (Ab), and Merlin (Me); in class 2, Aligator (Al), Aurelina (Ar), ES Comandor (Co), Acardia (Ac), Viola (Vi), and GL Melanie (GL).
In 2020, 11 soybean cultivars were evaluated: in class 1, Obelix (Ob), SG Anser (SG), Sirelia (Si), Moravians (Mo), and Abelina (Ab); in class 2, Albiensis (Alb), Aligator (Al), Es Comandor (Co), Viola (Vi), ES Governor (Go), and Acardia (Ac).
In 2021, 12 soybean cultivars were evaluated: in class 1, Obelix (Ob), Ceres (Cer), Sirelia (Si), Abelina (Ab), and Karok (Ka); in class 2, Viola (Vi), ES Comandor (Co), ES Governor (Go), Moravians (Mo), Albiensis (Alb), Sully (Sul), and Acardia (Ac).
In 2022, 11 soybean cultivars were evaluated: in class 1, Obelix (Ob), Abelina (Ab), Karok (Ka), and Wojtek (Wo); in class 2, Acardia (Ac), Albiensis (Alb), ES Governor (Go), Viola (Vi), ES Comandor (Co), Moravians (Mo), and Sully (Sul).
For cultivars that were grown in at least three consecutive years (Aligator, Merlin, Abelina, Acardia, Viola, and Obelix), the coefficient of variation of the yield was calculated.
The health status of the plants was assessed on a nine-point scale, according to Research Centre for Cultivar Testing (COBORU) Methodology [19,20], but for the statistical analysis the degree of infection of plants was converted to relative values (%). Disease severity was assessed in 25 plants randomly chosen from each plot.
Diseases noted during the study period were seedling diseases (SD) caused by Fusarium spp., bacterial leaf spot (BLS) (Xanthomonas campestris pv. glycines), Ascochyta leaf disease (AL) (Ascochyta spp.), Cercospora leaf blight (CLB) (Cercospora kikuchii), Fusarium wilt of leaves (FWL) and Fusarium wilt of stems (FWS) (Fusarium oxysporum), frogeye leaf spot (FLS) (Cercospora sojina), brown spot (BS) (Septoria glycines Hemmi), and Fusarium pod blight (FPB) (Fusarium spp.) (Table 1).
Disease severity was assessed throughout the growing season according to the methodology presented in [19,20]. To better illustrate the occurrence of diseases throughout plant development, the severity of each disease was compared between years and assigned to BBCH (Biologische Bundesanstalt, Bundessortenamt und CHemische Industrie) stages. Infection of plants with seedling diseases was assessed four weeks after sowing. The severity of diseases was assessed at the height of infection, according to Węgorek [21]: bacterial leaf spot and Cercospora leaf blight four times—in the second and third 10-day periods in June and in the second and third 10-day periods in July; Ascochyta leaf disease in the second and third 10-day periods in July; Fusarium wilt of leaves three times—in the second 10-day period in June and in the second and third 10-day periods in July; frogeye leaf spot twice—in the second and third 10-day periods in June; and Fusarium pod blight in the final 10 days of August.

2.4. Assessment of Meteorological Conditions

The course of the weather in 2017–2022 was presented on the basis of 10-day values of selected meteorological elements, i.e., average air temperature, precipitation totals, and the number of days with precipitation from April to September. Daily data on selected meteorological elements were obtained from the Research Centre for Cultivar Testing (COBORU) experimental station in Węgrzce near Krakow, 2 km from the Experimental Station in Prusy.
The meteorological conditions in successive years of the experiment were compared with average monthly values for selected meteorological elements from the period of 1991–2020 (1991–2020 climate normals—IMGW-PiB (Institute of Meteorology and Water Management—National Research Institute; Climate Portal). Due to the lack of long-term data from the experimental station, data obtained from Polish Climate Monitoring Bulletin (2017–2022), on the IMGW (Institute of Meteorology and Water Management) website, were used as a long-term reference. The temperature classification given in the Bulletin is based on the quantile method according to Miętus et al. [22] (Table 1). Monthly rainfall was assessed on the basis of the relative precipitation index (RPI) according to Kaczorowska [23] (Table 2).
Table 1. Temperature classification of months based on the quantile method [22].
Quantile (%)>0.950.90–0.950.80–0.900.70–0.800.60–0.700.40–0700.30–0.400.20–0.300.10–0.200.05–0.10
Temperature characterization of monthExtremely warmAnomalously warmVery warmWarmSlightly warmNormalSlightly coldColdVery coldExtremely cold

2.5. Statistical Analysis

Graphical techniques in combination with analytical statistical methods are used to analyze complex environmental studies. Visual techniques for data exploration include multi-dimensional graphs such as radar plots, which make it possible to identify patterns and trends in large data sets. Another example is graphical presentation of distance matrices in the form of a dendrogram or the presentation of correlation matrices as heat maps [24]. In the present study, the statistical analysis consisted of several stages. In the first stage, aimed at a preliminary grouping of the data, two classification methods were used: cluster analysis and a radar plot. The purpose of cluster analysis was to classify the data in the years of the study (2017–2022). The data were assigned to clusters by distinguishing similar groups of cases according to the severity and number of diseases in two earliness classes of soybean. The homogeneity of the data was also tested by this operation, as the separation of two or more clusters means that the data cannot be considered homogeneous. For this purpose a simple hierarchical cluster analysis was used, in which larger clusters were obtained by combining smaller clusters obtained in the previous steps of the algorithm [24]. Ward’s agglomerative method was applied, and Euclidean distance was used to measure distance.
Radar plots were plotted to illustrate the occurrence of individual diseases for each earliness class of soybean in each year of the experiment. Each observation in the plot was represented by a polygon, on which the values of the variables were assigned to specific dimensions of the figure. The appearance of the polygons changed as a function of the configuration of values, with the radii corresponding to the number of variables, i.e., fungal soybean diseases. The length of each radius was in proportion to the severity of the disease (% of infected plants). Interpretation of the radar plot made it possible to confirm the division into two periods obtained in the cluster analysis, for the two classes of soybean and the occurrence of diseases in them in each year.
Disease intensity was presented in bar graphs, separately for the two periods (clusters) and in relation to the average yield of all soybean cultivars in two earliness classes. The degree of infection of plants with each fungal disease was presented as a cumulative value using bar graphs.
The next stage of the statistical analysis was determination of the relationship between yield and the occurrence of fungal diseases. These relationships were determined separately for the two earliness classes of soybean on the basis of correlation coefficients. The results of the correlation matrix were presented in graphical form using heat maps. Two colors were used to illustrate different correlation values: green (negative values) and red (positive values). Gradation of the values of correlation coefficients was illustrated by the intensity of the color (which increased with the value of the correlation coefficient). The statistical significance of the correlations between yield and disease severity was determined for the level of 0.05.
In the final stage of the statistical analysis, average yield, standard deviation, and coefficients of variation Cv(%) were calculated for the yield of the seven soybean cultivars that were grown in at least three consecutive years of the study.

3. Results

3.1. Weather Conditions during the Research Period

An analysis of the meteorological growing conditions for soybean in Prusy is presented in Table 3.
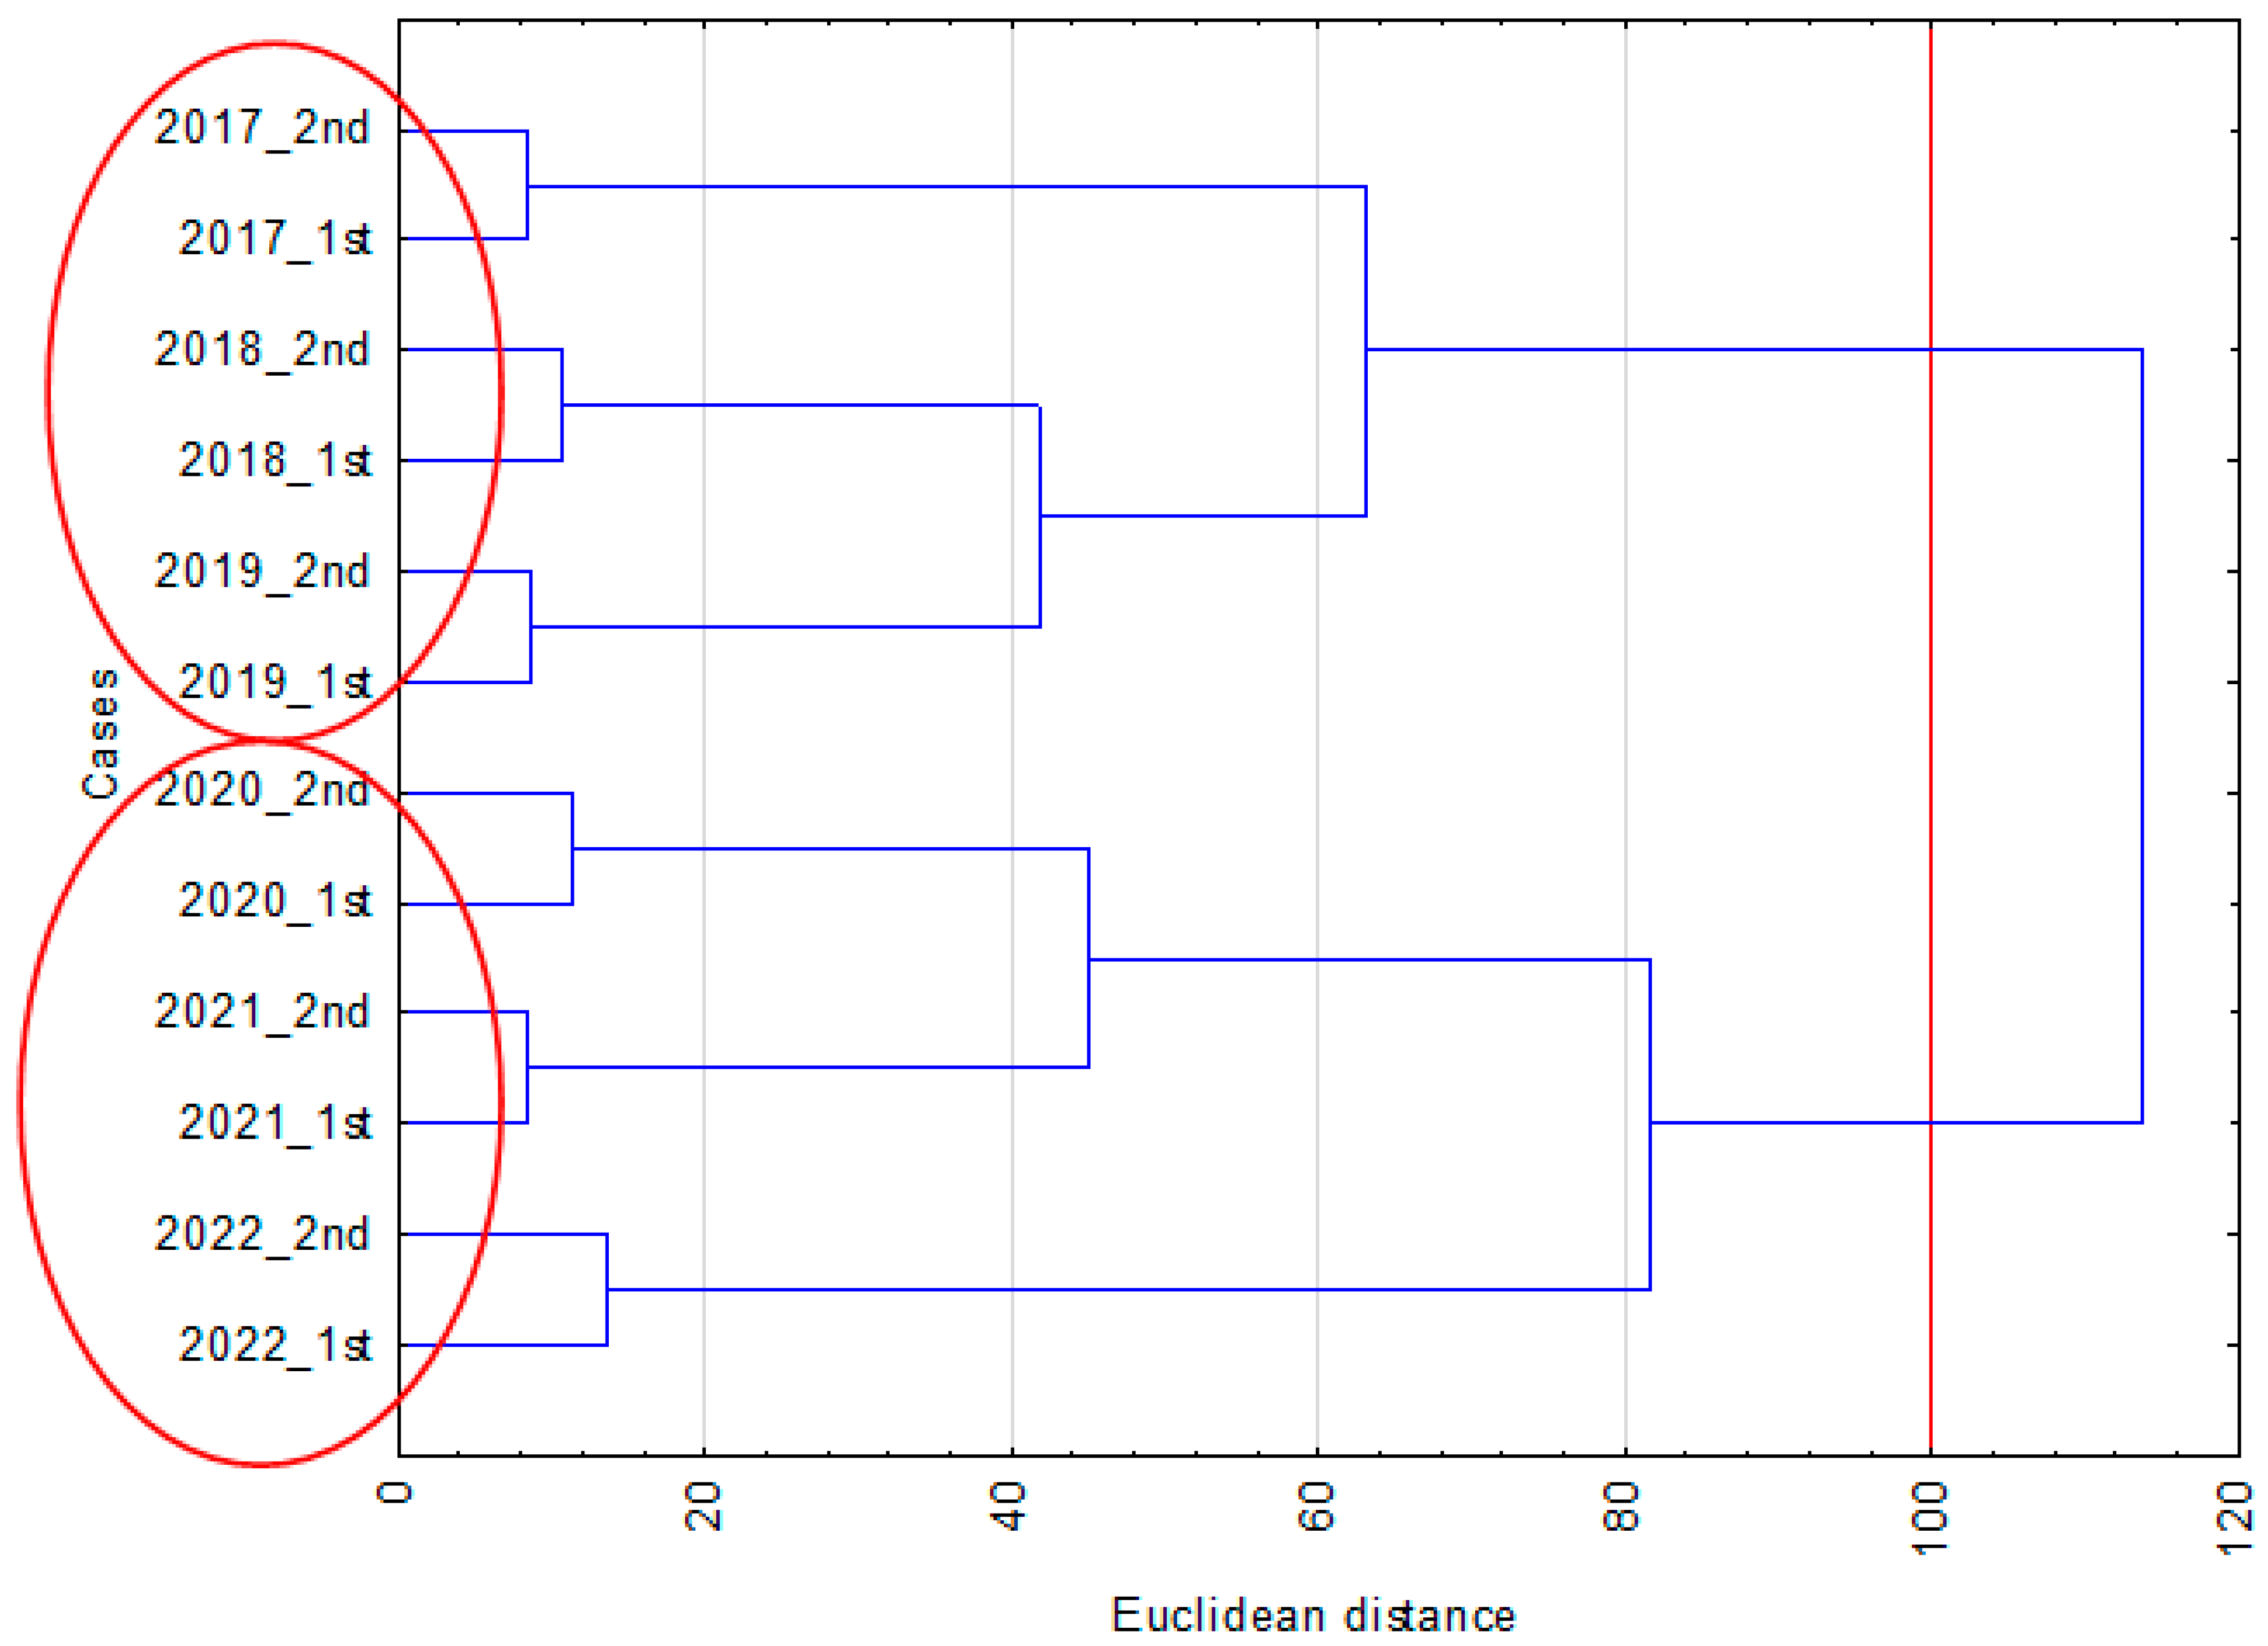
Analysis of the temperature and rainfall conditions presented in Table 3 shows that they were substantially varied. The average air temperature from April to September from 2017 to 2022 was 16.4 °C and was 0.9 °C higher than the long-term average (1991–2020). The average rainfall total from 2017 to 2022 was 601 mm and was 155 mm higher than the long-term average from 1991 to 2020. The average number of days with precipitation was 12.5 and was lower than the long-term average of 13.3. Analysis of average values in successive years showed that the average temperature (T) for this period in all years was higher than the average from 1991 to 2020. Rainfall totals (P) were higher than the long-term average in 2017–2021, and lower in 2022 (Table 3), but the average number of days with precipitation during the growing season was more varied than the other elements in successive years; the average number of days with precipitation ranged from 9.5 days in 2019 to 15 days in 2021. In successive months and 10-day periods of the study, variation in temperature and rainfall conditions were observed during the growing period. Bearing in mind soybean’s need for heat (as a thermophilic plant), analysis of the temperature conditions in successive years of the experiment during the critical period (flowering and pod setting) in July and August showed that, from 2017 to 2019, these months were warmer than average. Hereafter, this period will be referred to as normal. In the years 2020–2022, the months of the critical period (July and August) were colder, and the average temperature was more varied; this period will hereafter be referred to as anomalous (Table 3). In both periods, significant variation over time was also observed in rainfall totals (P) and the number of days with precipitation (Ndp). The division of the study period into normal (2017–2019) and anomalous (2020–2022) coincides with the clusters of numbers of diseases in these periods. In Ward’s cluster analysis, the clusters obtained made it possible to distinguish plant diseases for the soybean cultivars (in two earliness classes) during the six-year period. Figure 1 clearly shows two clusters, which included the years 2017–2019 (normal in terms of temperature and rainfall) and 2020–2022 (anomalous in terms of temperature and rainfall). The Euclidean distance of the linkage was estimated at 100.
The results pertaining to temperature and rainfall conditions were interpreted based on these two clusters. Based on the similarity in temperature conditions in the summer months, two periods were distinguished: 2017–2019 and 2020–2022. In June, July, and August, the years 2017–2019 were similar to the long-term average in terms of temperature and monthly rainfall totals. For this reason, the 2017–2019 period is hereafter referred to as normal in terms of temperature and rainfall. In the years 2019–2022, temperature conditions in the summer months (June, July, and August) were varied, from extremely cold in August 2021 to extremely warm in four cases, with highly varied rainfall (P) totals and distribution (Ndp). Hereafter, the years 2020–2022 will be referred to as anomalous in terms of temperature and rainfall.

3.2. The Occurrence of Fungal Diseases in the Years of the Study

The 10-day periods when diseases occurred in each year of the study were presented using the BBCH scale (Table 4). The severity of the diseases depended on the weather. Disease severity was greatest during BBCH stages 16 to 81. In the six-year period, disease severity was lowest in 2017 and highest in 2022. The occurrence of Fusarium seedling diseases (SD) varied between years. Seedling diseases (SD) most often appeared in the second and third 10-day periods of June, except for 2018, when it appeared earlier, in the last 10 days of May. Cercospora leaf blight (CLB) appeared in 2017–2019 and then again in 2022, which indicates a close connection with the weather. These years were dominated by more frequent rainfall and high temperatures in June and July.
Brown spot (BS) appeared in the years 2018 and 2021–2022 in the second and third 10-day periods of June, in conditions of high temperatures and more rainfall.
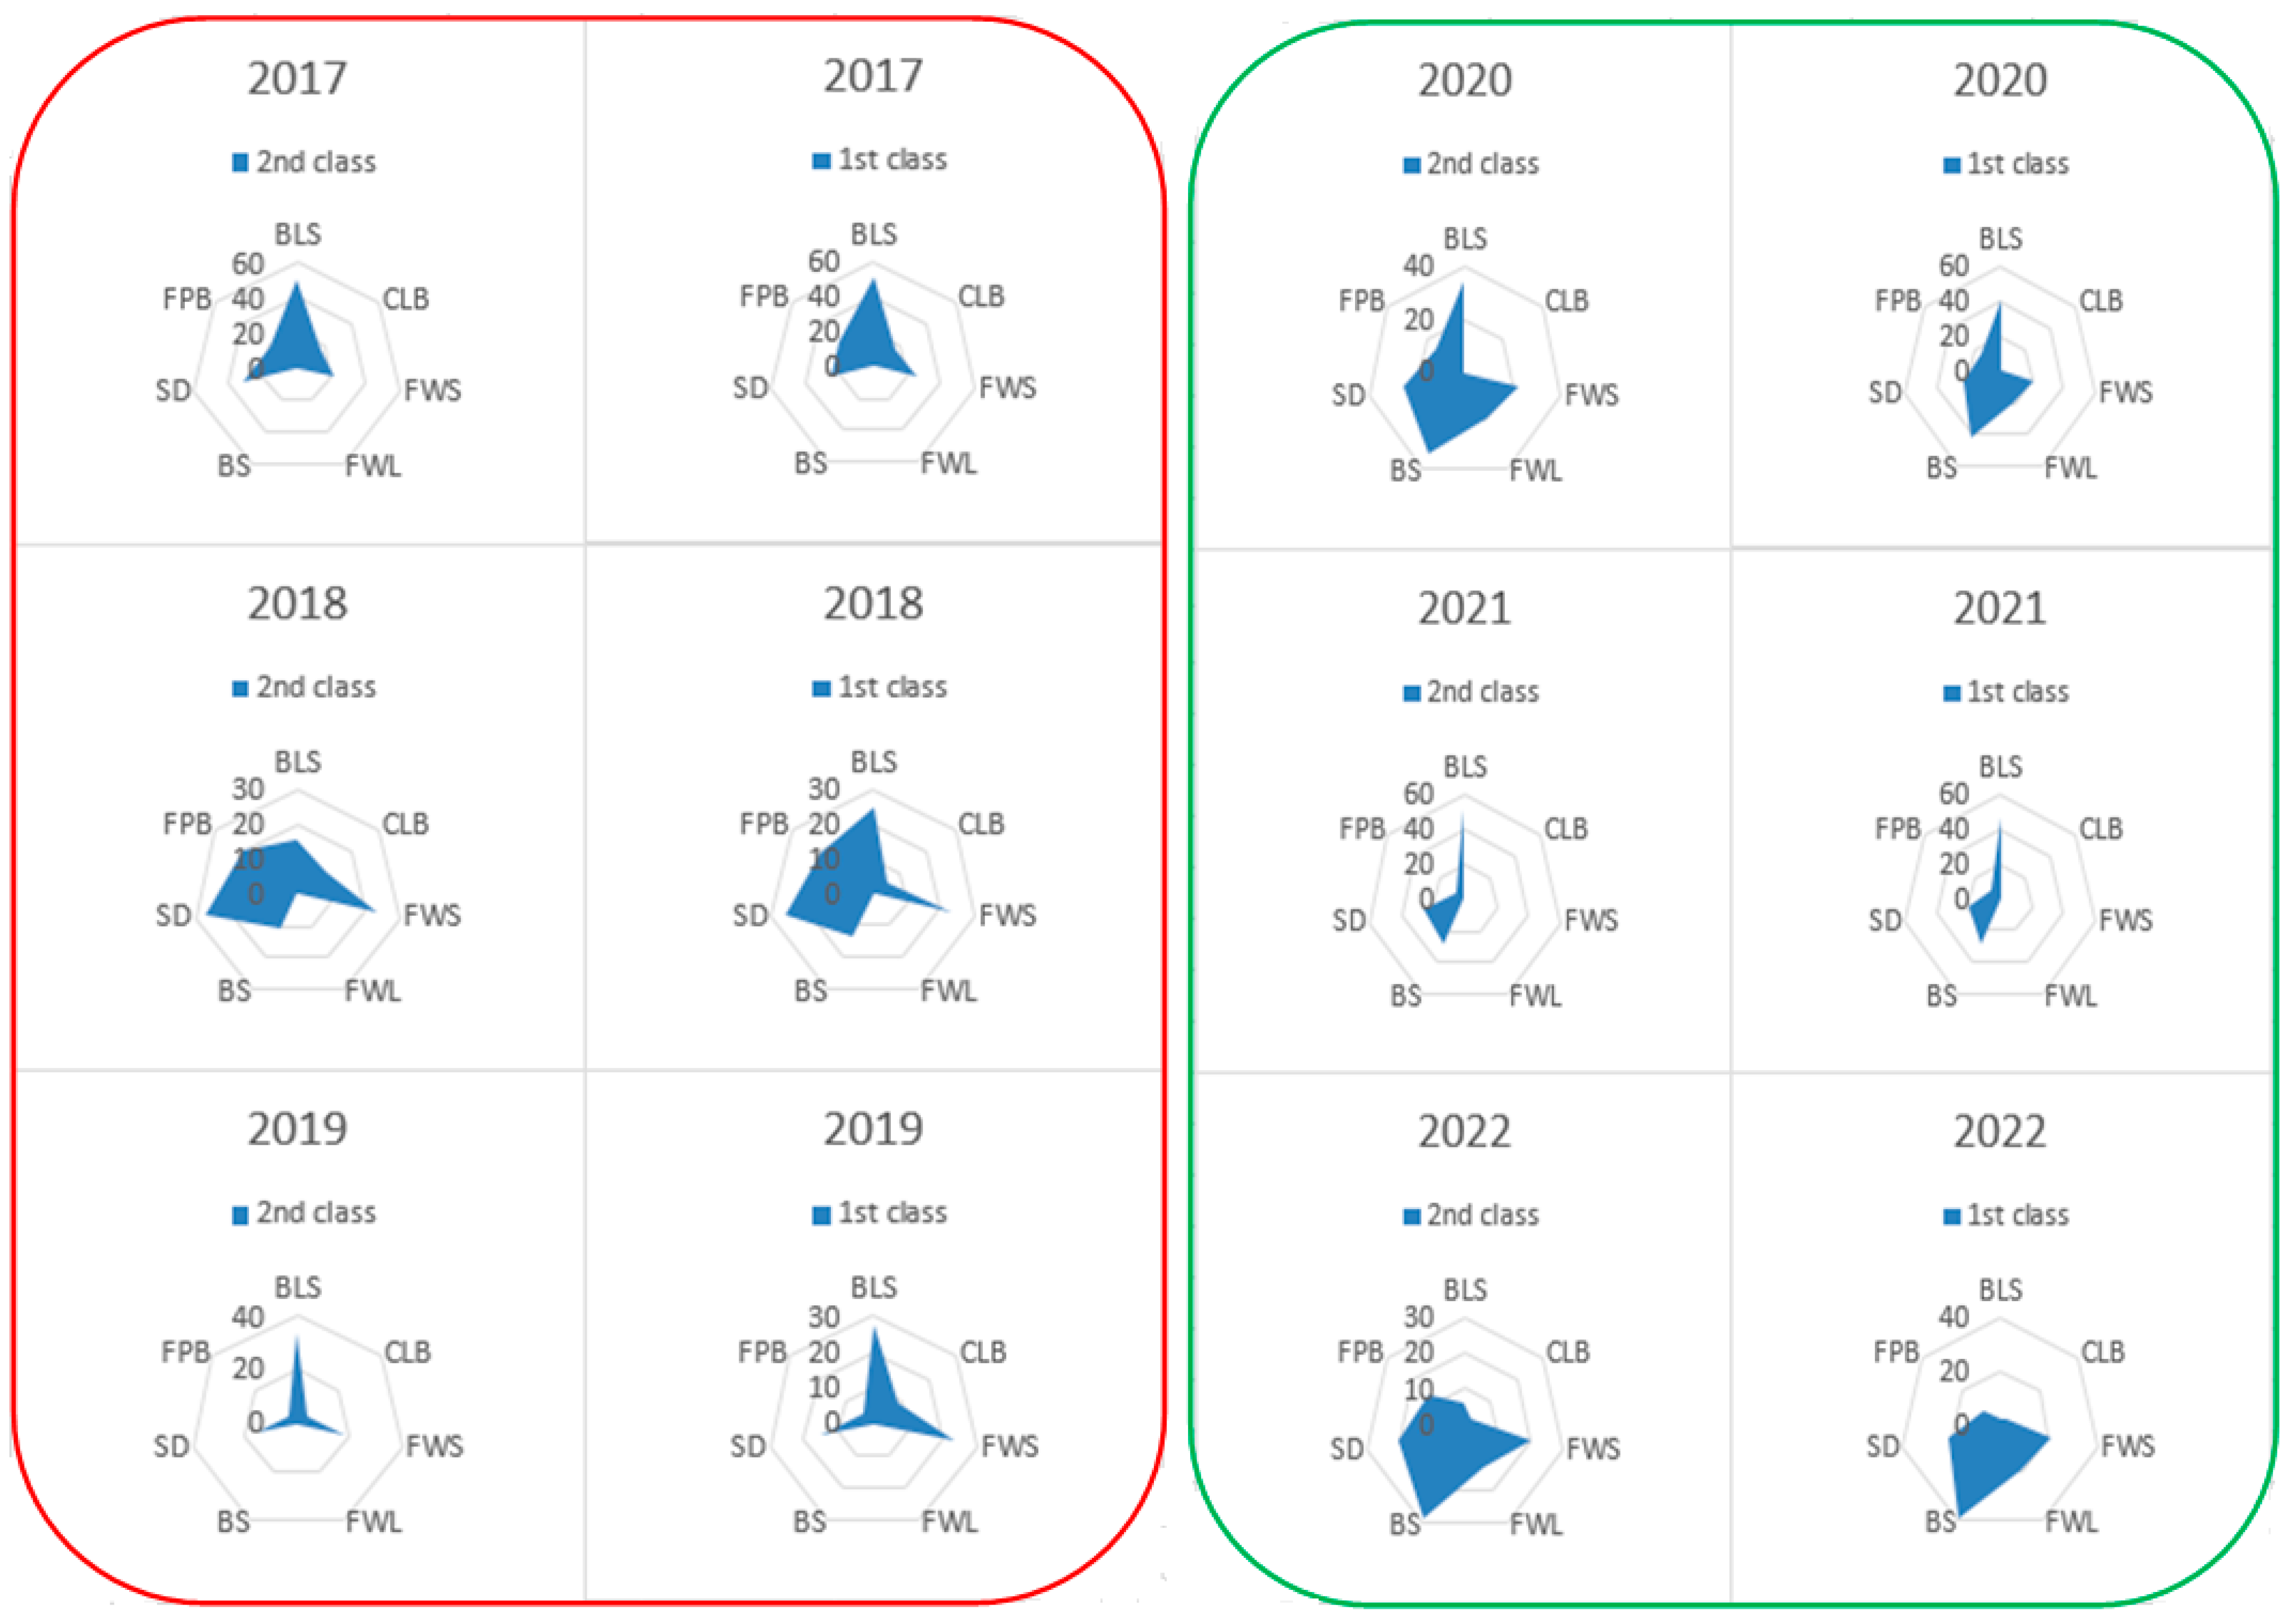
A radar plot was used to present the occurrence of individual diseases in each year of the experiment and for soybean cultivars in the two earliness classes (Figure 2).
In the six-year study period, variation in the occurrence of diseases and their intensity was observed for each class of soybean cultivar. On the radar plot (Figure 2), which served as a preliminary tool to characterize the diseases in each year and class, similarities in the shapes of the polygons can be seen. The polygons were assigned to two groups. The figures illustrating diseases and their similar intensity in 2017–2019 are indicated with a red ellipse, while similar severity of diseases in 2020–2022 is indicated with a green ellipse. Interpretation of the radar plot confirmed the division into periods obtained using cluster analysis for the two soybean classes and the occurrence of diseases in them in each year; i.e., the division of the six-year period coincides with the division into normal years (2017–2019) and anomalous years (2020–2022) in terms of temperature and rainfall (Table 2). The radar plot (Figure 2) clearly shows a difference in the intensity of diseases between the years 2017–2019 (normal) and 2020–2022 (anomalous). The highest severity of diseases was noted in 2020. Higher severity of disease in class 1 can be seen as well.
Figure 3 shows the intensity of diseases in two periods (normal and anomalous years in terms of temperature and rainfall) in relation to the average yield of all soybean cultivars in each class. In 2017, 2018, and 2019, i.e., the normal period in terms of temperature and rainfall, there were five different diseases on average, including seedling diseases (SD), Brown spot (BS), Fusarium wilt of stems (FWS), Cercospora leaf blight (CLB), and Fusarium pod blight (FPB). Fusarium wilt of leaves (FWL) was not observed in either class of soybean during this period. In 2020, 2021, and 2022, i.e., the anomalous period, there were six, five, and seven diseases, respectively.
In the normal years in terms of temperature and rainfall (2017–2019), the average yield for soybean cultivars of class 2 and 1 was 4.72 and 4.43 t/ha, respectively.
In 2017, Aligator (class 2) and Merlin (class 1) produced the highest yields, amounting to 3.78 and 3.63 t/ha, respectively. The average yield for class 2 and 1 soybean cultivars was similar, at about 3.5 t/ha.
In 2018, the cultivars Protina (class 2) and Sirella (class 1) had the highest yield, amounting to about 5.0 t/ha. The average yield of soybean cultivars of classes 2 and 1 was 4.81 and 4.63 t/ha, respectively.
In 2019, the cultivars Viola (class 2) and Moravians (class 1) had the highest yields, amounting to 6.29 and 5.67 t/ha, respectively. The average yield of soybean cultivars of class 2 was about 5.83 t/ha. For class 1 cultivars it was 5% lower, amounting to 5.56 t/ha.
In the anomalous years in terms of temperature and rainfall (2020–2022), the average yield for the soybean cultivars in the two earliness classes was 4.32 (class 2) and 3.94 (class 1) t/ha. This was 8.5% and 11.1% lower, respectively, than the average yield of these classes in the normal years.
In 2020, the highest yields were obtained for the cultivars ES Comandor (class 2) and Obelix (class 1), amounting to 4.11 and 3.89 t/ha, respectively. The average yield for soybean cultivars of classes 2 and 1 was about 3.7 t/ha. In 2021, the highest yields were obtained for ES Comandor (class 2) and for Ceres (class 1), at 5.69 and 5.27 t/ha, respectively. The average yield for the soybean cultivars was 4.83 (class 2) and 4.15 t/ha (class 1). In 2022, Acardia (class 2) and Ceres (class 1) produced the highest yields, amounting to 4.96 and 4.09 t/ha, respectively. The average yield for the class 2 soybean cultivars was 4.43 t/ha. For the class 1 cultivars it was 10% lower, at 3.99 t/ha.

3.3. Relationship between Yield and the Occurrence of Diseases in Each Year

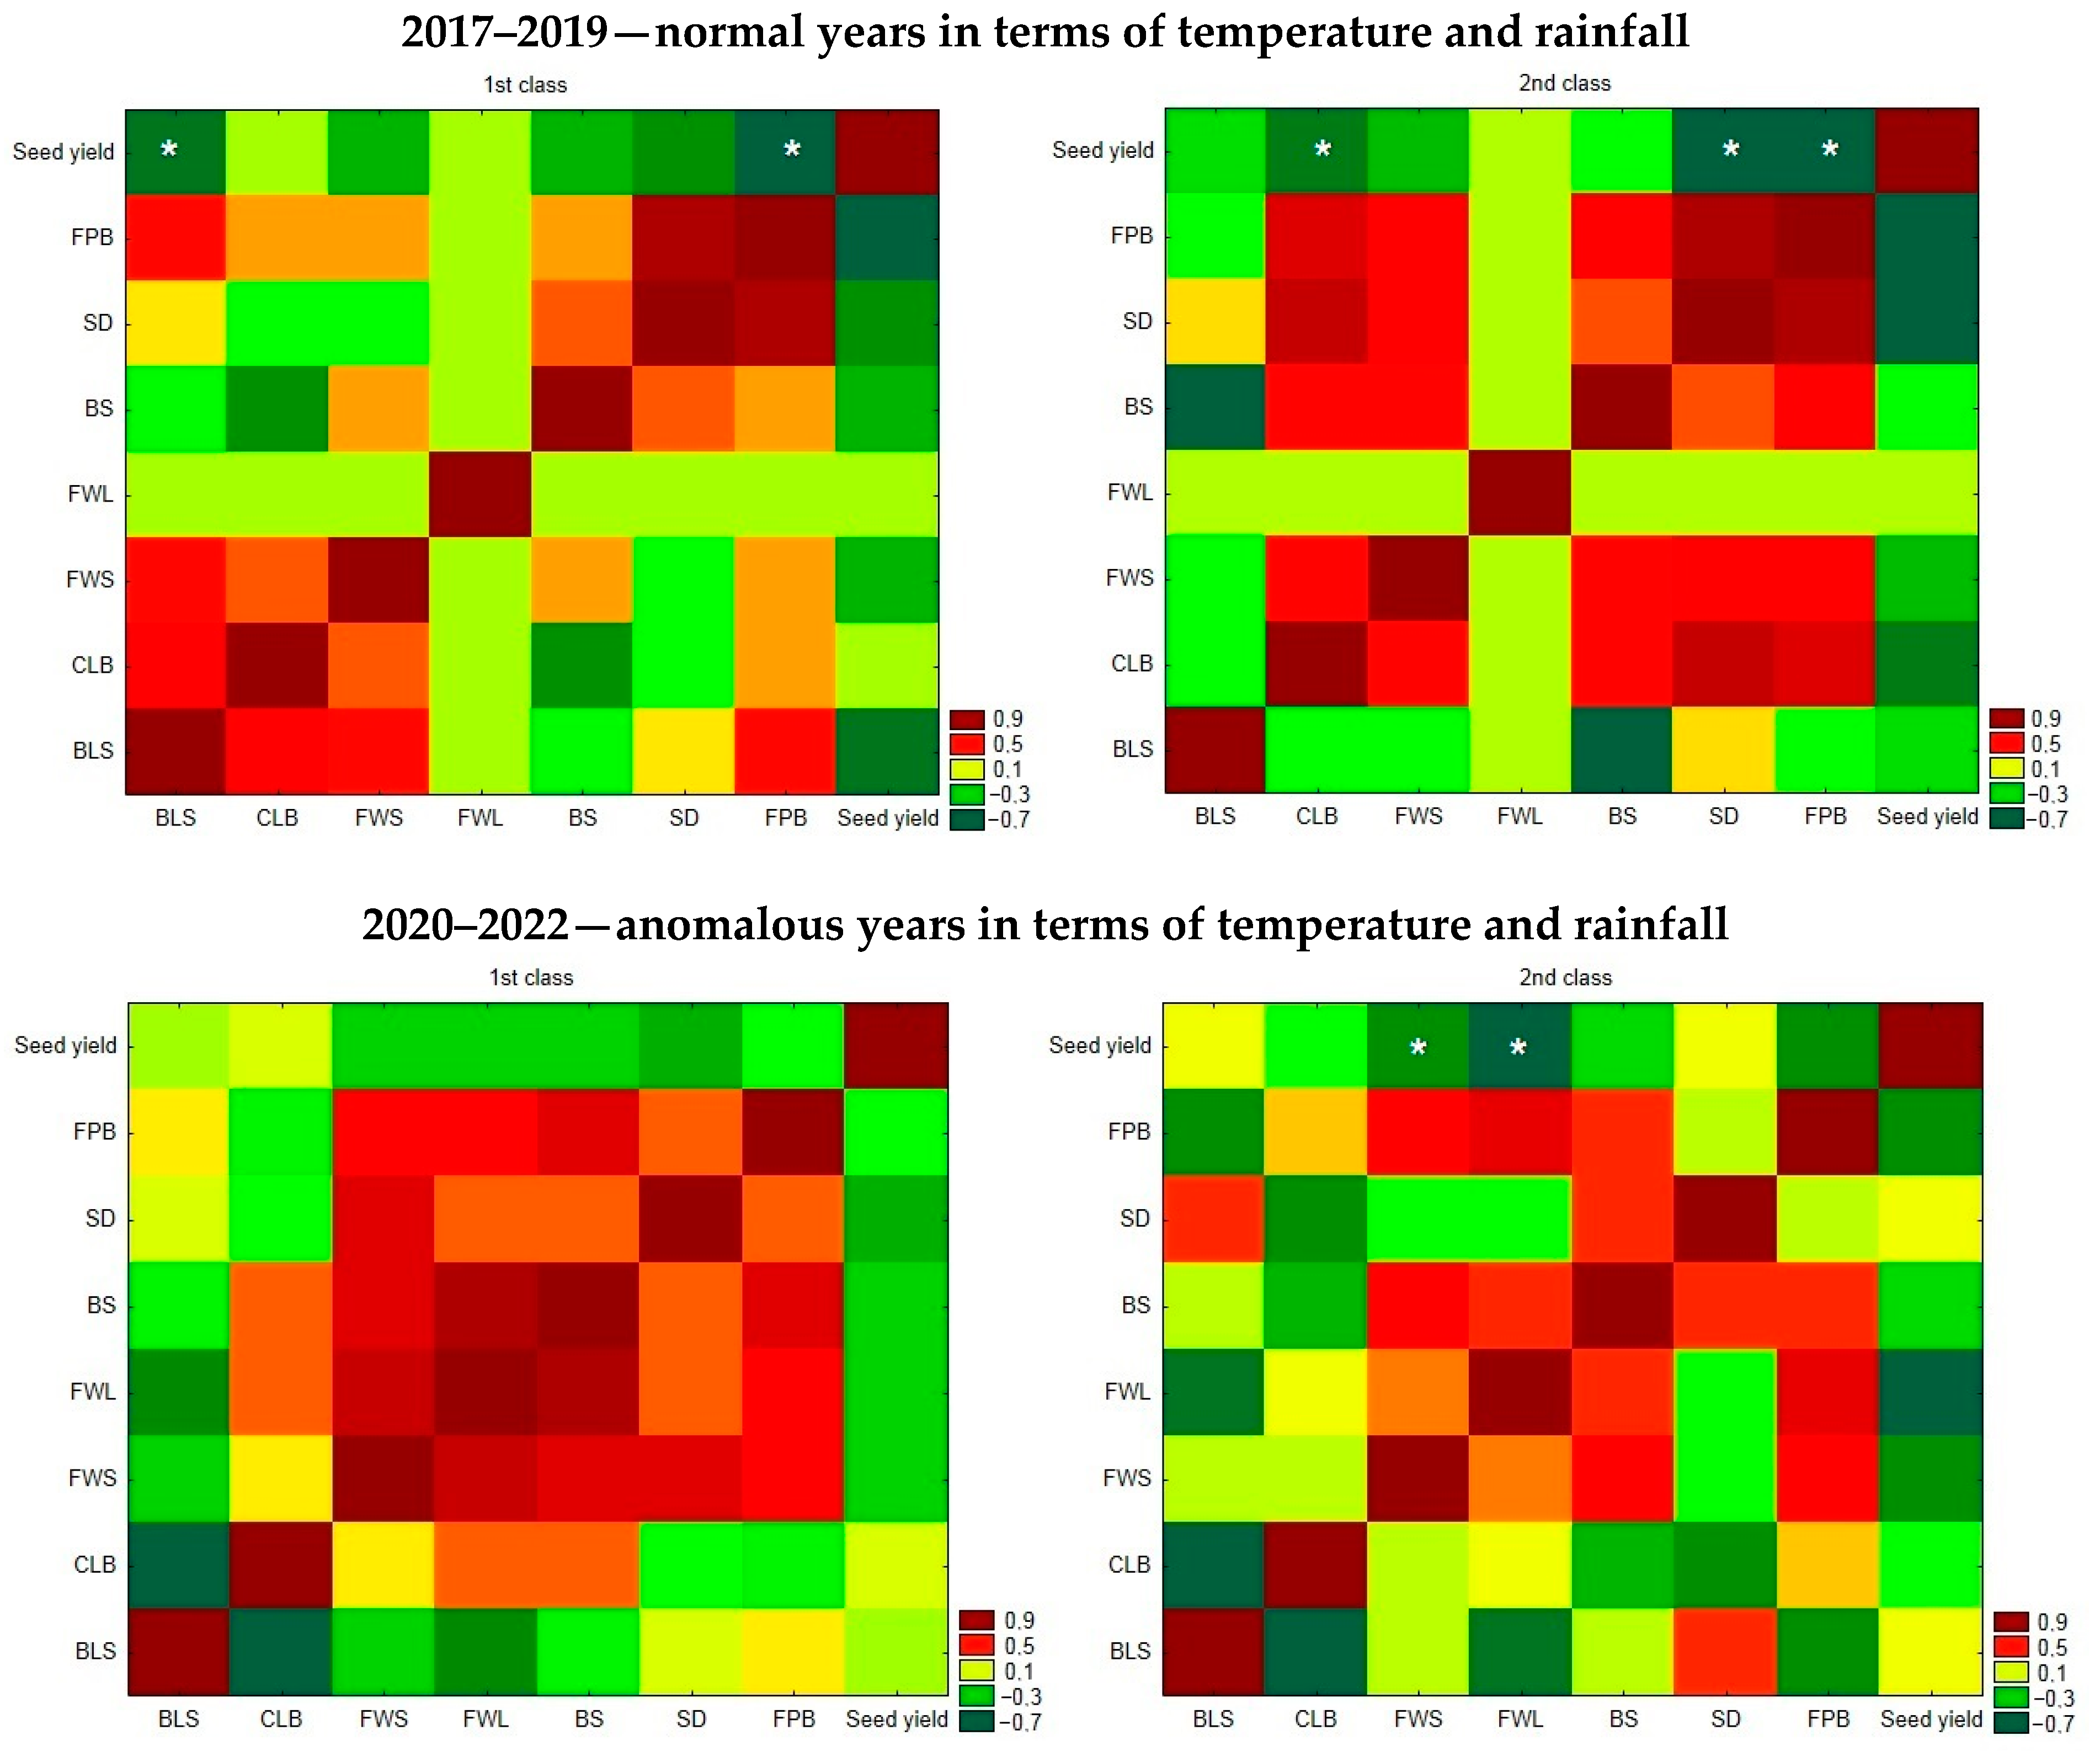
To verify the relationship between yield and diseases, correlations were determined and presented in the form of heatmaps (Figure 4). Correlations were presented separately for normal (2017–2019) and anomalous (2020–2022) temperature and rainfall conditions and for class 1 vs. class 2 cultivars.
Negative correlations between the occurrence of diseases and yield in normal and anomalous years for selected cultivars of classes 1 and 2 showed significance at a level of 0.05 in the case of seedling diseases (SD), Fusarium wilt of stems (FWS), Fusarium wilt of leaves (FWL), Fusarium pod blight (FPB), bacterial leaf spot (BLS), and Cercospora leaf blight (CLB). Yield was not found to be significantly correlated with brown spot (BS).
In normal years in terms of temperature and rainfall (2017–2019), significant negative correlations were shown between yield and bacterial leaf spot (BLS) and Fusarium pod blight (FPB) in class 1. In the case of class 2 cultivars, significant negative correlations were observed between yield and Cercospora leaf blight (CLB), seedling diseases (SD), and Fusarium pod blight (FPB).
In the anomalous years in terms of temperature and rainfall (2020–2022), in class 1 there were no significant correlations between yield and soybean diseases, whereas in class 2 there were significant negative correlations between yield and Fusarium wilt of leaves (FWL) and Fusarium wilt of stems (FWS).

3.4. Yield and Coefficients of Variation of Yield

Table 5 presents coefficients of variation, i.e., yield stability, for selected class 2 and class 1 cultivars (grown for at least 3 years), for two periods (normal and anomalous years in terms of temperature and rainfall). In the normal period, the cultivar Aligator (class 2), Cv = 8%, and Merlin (class 1), Cv = 6%, showed the highest yield stability. In the anomalous years, the soybean yield of the selected soybean cultivars was more variable than in the normal years: yield stability was highest for the Viola cultivar (class 2), Cv = 10%, and lowest for Acardia (class 2), Cv = 16%. In the whole six-year period, in both normal and anomalous years, the Abelina cultivar had the same coefficient of variation of yield, Cv = 10%, which means that it can be considered to be one of the most stable soybean cultivars in terms of yield.

4. Discussion

Our study provides evidence that temperature and rainfall conditions have a significant effect on the health of soybean plants, and it contributes to knowledge on the effect of the number of days with precipitation and temperature on the degree of infection of plants (soybean cultivars of different earliness classes) by fungal diseases. According to the literature [25,26,27,28], soybean is sensitive to temperature throughout the growing season, i.e., from emergence to maturity, when the minimum biological range of temperatures is considered to be 17–18 °C, and the optimal range is 22–32 °C, depending on the latitude, cultivar, and methods used. A long-term decrease in the average daily air temperature to below 15 °C slows plant growth and inhibits the formation of leaves and shoots, and a decrease below 10 °C disturbs the flowering process [29,30]. Soybean has less need for heat in the mature period, with a biological minimum of 8–14 °C.
In a study by Staniak et al. [31], cold stress (12/6 °C day/night) prolonged germination and delayed the emergence of 15 soybean cultivars; however, when the temperature was increased (20/15 °C day/night), the plants emerged quickly, and the plant density decreased by 9% and 4% on average, depending on the duration of stress (3 and 9 days, respectively). Another study [32] confirmed that if the completion of germination and the emergence of soybean seedlings take place at higher temperatures (20 °C), the damage to seedlings caused by low temperature (5 °C) is minor.
The occurrence of warm days and a higher number of days with rainfall in late May and early June resulted in greater severity of seedling diseases (SD) and bacterial leaf spot (BLS). We showed that the presence of seedling diseases had a significant effect on the occurrence of bacterial leaf spot during later development. Among various biotic limitations, plant diseases have a negative effect on soybean yield. Mueller et al. [13] point out that the risk of soybean diseases is not constant and depends on multiple factors. Changes in the weather resulting in increased moisture levels, increased frequency of heavy rainfall, and temperature changes may affect the risk of the development of soybean diseases [13,14]. In addition, extreme weather phenomena can increase the risk of diseases [13,15]. Pathogens attacking soybean can change their virulence or spread over areas previously unaffected by the disease [12,16]. According to Hartman and Hill [18], the degree of economic damage caused by diseases depends on the type of pathogen, the severity of the disease, and environmental conditions. In the present study, the level of soybean yield was varied in terms of temperature and rainfall conditions during the study period. In the normal years in terms of temperature and rainfall, higher seed yield was obtained from cultivars with a longer growing period. We also showed that optimal temperature and rainfall conditions resulted in greater yield stability over the years, while in the years with anomalous temperature and rainfall, soybean yield was lower and more varied. The level of yield was determined by the health of the plants during the growing period. We showed a correlation between yield and the health status of plants. Infection of seedlings resulted in greater susceptibility to other diseases, which directly affected yields.

5. Conclusions

The negative correlations between the occurrence of diseases and seed yield of soybean in normal and anomalous years for selected class 1 and 2 cultivars were significant at a level of 0.05 in the case of seedling diseases and diseases of the stems (Fusarium wilt of stems), leaves (bacterial leaf spot, Cercospora leaf blight, and Fusarium wilt of leaves) and pods (Fusarium pod blight). No significant correlations were shown between yield and brown spot. In the normal years in terms of temperature and rainfall (2017–2019), in class 1 there were significant negative correlations between yield and bacterial leaf spot (BLS) and Fusarium pod blight (FPB). In the case of class 2 cultivars, significant negative correlations were observed between yield and Cercospora leaf blight (CLB), seedling diseases (SD), and Fusarium pod blight (FPB). In the years with anomalous temperature and rainfall (2020–2022), in class 1 there were no significant correlations between yield and soybean diseases, whereas in class 2 there were significant negative correlations between yield and Fusarium wilt of leaves and stems (FWL and FWS). Variable weather conditions negatively affect the plant health and seed yield of soybean. In the conditions of Central Europe, it is recommended to use class 1 cultivars, with slightly lower yield but a lower degree of infection by diseases. Our findings proved that more studies on soybean plant health monitoring under Central Europe weather conditions should be undertaken.

Author Contributions

Conceptualization, A.K.-K., B.S. and E.D.; methodology, A.K.-K., B.S. and E.D.; validation, A.K.-K., B.S. and E.D.; formal analysis, A.K.-K., B.S. and E.D.; writing—original draft preparation, A.K.-K., B.S., E.D., B.K., E.B. and K.Z.; writing—review and editing, A.K.-K., B.S. and E.D.; visualization, E.D., B.S. and A.K.-K.; supervision, A.K.-K., B.S. and E.D. All authors have read and agreed to the published version of the manuscript.

Funding

This research was funded by the Ministry of Science and Higher Education of the Republic of Poland.

Data Availability Statement

Data sets for this research are included in Department of Agroecology and Plant Production, University of Agriculture in Kraków, Poland.

Conflicts of Interest

The authors declare no conflicts of interest.

Appendix A

Figure A1. Average seed yield for cultivars of 1 earliest class cultivated in 2017–2022 years.
Agronomy 14 00534 g0a1
Figure A2. Average seed yield for cultivars of 2 earliest class cultivated in 2017–2022 years.
Agronomy 14 00534 g0a2

References

  1. Nendel, C.; Reckling, M.; Debaeke, P.; Schulz, S.; Berg-Mohnicke, M.; Constantin, J.; Fronzek, S.; Hoffmann, M.; Jakšić, S.; Kersebaum, K.; et al. Future area expansion outweighs increasing drought risk for soybean in Europe. Glob. Chang. Biol. 2023, 29, 1340–1358. [Google Scholar] [CrossRef]
  2. Short-Term Outlook for EU Agricultural Markets in 2022. Available online: https://agriculture.ec.europa.eu/system/files/2022-10/short-term-outlook-autumn-2022_en_1.pdf (accessed on 1 February 2024).
  3. Coleman, K.; Whitmore, A.P.; Hassall, K.L.; Shield, I.; Semenov, M.A.; Dobermann, A.; Bourhis, Y.; Eskandary, A.; Milne, A.E. The potential for soybean to diversify the production of plant-based protein in the UK. Sci. Total Environ. 2021, 767, 144903. [Google Scholar] [CrossRef]
  4. FAOSTAT. 2020. Available online: http://www.fao.org/faostat (accessed on 31 December 2023).
  5. FAOSTAT 2022. Available online: http://www.fao.org/faostat (accessed on 1 February 2024).
  6. Hufnagel, J.; Reckling, M.; Ewert, F. Diverse approaches to crop diversification in agricultural research. A review. Agron. Sustain. Dev. 2020, 40, 14. [Google Scholar] [CrossRef]
  7. Kothari, K.; Battisti, R.; Boote, K.J.; Archontoulis, S.V.; Confalone, A.; Constantin, J.; Cuadra, S.V.; Debaeke, P.; Faye, B.; Grant, B.; et al. Are soybean models ready for climate change food impact assessments? Eur. J. Agron. 2022, 135, 126482. [Google Scholar] [CrossRef]
  8. Lin, F.; Chhapekar, S.S.; Vieira, C.C.; Da Silva, M.P.; Rojas, A.; Lee, D.; Liu, N.; Pardo, E.M.; Lee, Y.-C.; Dong, Z.; et al. Breeding for disease resistance in soybean: A global perspective. Theor. Appl. Genet. 2022, 135, 3773–3872. [Google Scholar] [CrossRef] [PubMed]
  9. Upadhyay, P.; Thakur, S.; Nagre, S.P.; Anand, K.; Saraswat, S.; Mohare, S. Review of soybean breeding for disease and insect resistance. Front. Crop Improv. 2022, 10, 541–548. [Google Scholar]
  10. Andrijanić, Z.; Nazzicari, N.; Šarčević, H.; Sudarić, A.; Annicchiarico, P.; Pejić, I. Genetic Diversity and Population Structure of European Soybean Germplasm Revealed by Single Nucleotide Polymorphism. Plants 2023, 12, 1837. [Google Scholar] [CrossRef] [PubMed]
  11. Fagodiya, R.K.; Trivedi, A.; Fagodia, B.L. Impact of weather parameters on Alternaria leaf spot of soybean incited by Alternaria alternata. Sci. Rep. 2022, 12, 6131. [Google Scholar] [CrossRef] [PubMed]
  12. Kleczewski, N.; Plewa, D.; Kangas, C.; Phillippi, E.; Kleczewski, V. First Report of Red Crown Rot of Soybeans Caused by Calonectria ilicicola (Anamorph: Cylindrocladium parasiticum) in Illinois. Plant Dis. 2019, 103, 1777. [Google Scholar] [CrossRef]
  13. Heeb, L.; Jenner, E.; Cock, M.J.W. Climate-smart pest management: Building resilience of farms and landscapes to changing pest threats. J. Pset Sci. 2019, 92, 951–969. [Google Scholar] [CrossRef]
  14. Roth, M.G.; Webster, R.W.; Mueller, D.S.; I Chilvers, M.; Faske, T.R.; Mathew, F.M.; A Bradley, C.; Damicone, J.P.; Kabbage, M.; Smith, D.L. Integrated Management of Important Soybean Pathogens of the United States in Changing Climate. J. Integr. Pest Manag. 2020, 11, 17. [Google Scholar] [CrossRef]
  15. Walsh, M.K.; Backlund, P.; Buja, L.; DeGaetano, A.; Melnick, R.; Prokopy, L.; Takle, E.; Todey, D.; Ziska, L. Climate Indicators for Agriculture; Agriculture Technical Bulletin: Washington, DC, USA, 2020. [Google Scholar]
  16. Davis, E.L.; Tylka, G.L. Soybean cyst nematode disease. Plant Heal. Instr. 2021. [Google Scholar] [CrossRef]
  17. Mueller, D.S.; Wise, K.A.; Sisson, A.J.; Smith, D.L.; Sikora, E.J.; Robertson, A.E. (Eds.) A Farmer’s Guide to Soybean Diseases; American Phytopathological Society: St. Paul, MN, USA, 2016. [Google Scholar]
  18. Hartman, G.L.; Hill, C.B. Diseases of soybean and their management. In The Soybean; Singh, G., Ed.; CABI: Wallingford, UK, 2010; pp. 276–299. [Google Scholar]
  19. Research Centre for Cultivar Testing Methodology. Available online: https://coboru.gov.pl/index_en (accessed on 1 February 2024).
  20. Dłużniewska, J.; Klimek-Kopyra, A.; Czech, T.; Dobrowolski, J.W.; Dacewicz, E. The Use of Coherent Laser Stimulation of Seeds and a Fungal Inoculum to Increase the Productivity and Health of Soybean Plants. Agronomy 2021, 11, 1923. [Google Scholar] [CrossRef]
  21. Węgorek, P.; Korbas, M.; Zamojska, J.; Kierzek, R.; Piszczek, J.; Pieczul, K. Odporność agrofagów na środki ochrony roślin. s. 87–127. [W]: “Integrowana ochrona upraw rolniczych. Podstawy integrowanej ochrony”, (M. Mrówczyński, red.); Powszechne Wydawnictwo Rolnicze i Leśne: Poznań, Poland, 2013; p. 219. [Google Scholar]
  22. Miętus, M.; Owczarek, M.; Filipiak, J. Warunki termiczne na obszarze Wybrzeża i Pomorza w świetle wybranych klasyfikacji, Materiały Badawcze IMGW. S. Meteorologia 2002, 36, 1–56. [Google Scholar]
  23. Kaczorowska, Z. Opady w Polsce w przekroju wieloletnim. Przegląd Geogr. IG PAN 1962, 33, 1–112. [Google Scholar]
  24. Stanisz, A. Przystępny Kurs Statystyki: Z Zastosowaniem STATISTICA PL na Przykładach z Medycyny. T. 3. Analizy Wie-Lowymiarowe; StatSoft: Tulsa, OK, USA, 2007. [Google Scholar]
  25. Gass, T.; Schori, A.; Fossati, A.; Soldati, A.; Stamp, P. Cold tolerance of soybean (Glycine max (L.) Merr.) during the reproductive phase. Eur. J. Agron. 1996, 5, 71–88. [Google Scholar] [CrossRef]
  26. Setiyono, T.; Weiss, A.; Specht, J.; Bastidas, A.; Cassman, K.; Dobermann, A. Understanding and modeling the effect of temperature and daylength on soybean phenology under high-yield conditions. Field Crop. Res. 2007, 100, 257–271. [Google Scholar] [CrossRef]
  27. Parent, B.; Tardieu, F. Temperature responses of developmental processes have not been affected by breeding in different ecological areas for 17 crop species. New Phytol. 2012, 194, 760–774. [Google Scholar] [CrossRef] [PubMed]
  28. Boote, K.J. Improving soybean cultivars for adaptation to climate change and climate variability. In Crop Adaptation to Climate Change; Wiley-Blackwell: Oxford, UK, 2011; pp. 370–395. [Google Scholar] [CrossRef]
  29. Câmara, G.M.S.; Sediyama, T.; Dourado-Neto, D.; Bernardes, M.S. Influence of fotoperiod and air temperature on the growth, flowering and maturation of the soybean (Glycine max. L. Merrill). Sci. Agric. 1997, 54, 149–154. Available online: https://www.scienceopen.com/document?vid=f604f4c0-fa07-4018-afaa-ff18d7c9b5aa (accessed on 2 August 2022). [CrossRef]
  30. Kumar, A.; Pandey, V.; Shekh, A.; Kumar, M. Growth and yield response of soybean (Glycine max L.) in relation to temperature, photoperiod and sunshine duration at Anand, Gujarat, India. Am. Eur. J. Agron. 2008, 1, 45–50. Available online: http://www.idosi.org/aeja/1(2)08/6.pdf?q=birla-institute-of-technology-mesra-ranchi-835215-india (accessed on 2 August 2022).
  31. Staniak, M.; Stępień-Warda, A.; Czopek, K.; Kocira, A.; Baca, E. Seeds Quality and Quantity of Soybean [Glycine max (L.) Merr.] Cultivars in Response to Cold Stress. Agronomy 2021, 11, 520. [Google Scholar] [CrossRef]
  32. Markowski, A. Influence of initial seed moisture and temperature conditions during germination and emergence on seedling survival and yields of soybean (Glycine max L. Merrill). Acta Agrobot. 1982, 35, 43–59. [Google Scholar] [CrossRef]
Figure 1. Dendrogram representing groups of cases identified by Ward’s method of cluster analysis.
Agronomy 14 00534 g001
Figure 2. Radar plot for diseases occurring in two earliness classes of soybean in the years 2017–2019 (normal years in terms of temperature and rainfall) and 2020–2022 (anomalous years in terms of temperature and rainfall). Seedling diseases (SD), bacterial leaf spot (BLS), brown spot (BS), Fusarium wilt of leaves (FWL), Fusarium wilt of stems (FWS), Ascochyta of leaves (AL), Cercospora leaf blight (CLB), frogeye leaf spot (FLS), Fusarium pod blight (FPB).
Agronomy 14 00534 g002
Figure 3. Cumulative occurrence and intensity (%) of diseases in normal and anomalous years in terms of temperature and rainfall in relation to the average yield (t/ha) of all soybean cultivars in each earliness class. Seedling diseases (SD), bacterial leaf spot (BLS), brown spot (BS), Fusarium wilt of leaves (FWL), Fusarium wilt of stems (FWS), Cercospora leaf blight (CLB), frogeye leaf spot (FLS), Fusarium pod blight (FPB).
Agronomy 14 00534 g003
Figure 4. Correlations between yield and the occurrence of soy diseases. * statistical significance of correlation at p < 0.05. Seedling diseases (SD), bacterial leaf spot (BLS), brown spot (BS), Fusarium wilt of leaves (FWL), Fusarium wilt of stems (FWS), Ascochyta of leaves (AL), Cercospora leaf blight (CLB), frogeye leaf spot (FLS), Fusarium pod blight (FPB).
Agronomy 14 00534 g004
Table 2. Characterization of rainfall on the basis of the relative precipitation index (RPI) [23].
% of Normal Rainfall <5050–7475–8990–110111–125126–150>150
Rainfall characterization of monthExtremely dryVery dryDryAverageRainyVery rainyExtremely rainy
Table 3. Characterization of weather in 2017–2022.
Month10-Day Period201720182019202020212022
T (°C) *P (mm) **Ndp (−)T (°C) *P (mm) **Ndp (−)T (°C) *P (mm) **Ndp (−)T (°C) *P (mm) **Ndp (−)T (°C) *P (mm) **Ndp (−)T (°C) *P (mm) **Ndp (−)
April111.037.8310.53.429.114.428.7005.16.464.724.69
25.542.6715.15.637.95.4310.10.214.934.197.06.25
36.360.0815.42.6111.969.6610.3727.39.659.114.85
May19.445.8517.420.229.714.2310.519.8610.414.2513.811.03
214.624.6414.832.8511.969.6611.224.6614.454.6616.200
317.158.2719.30.0014.4167.4911.890.6913.328.8714.79.43
June117.833.0220.272.6620.11.4115.629.6616.54.8318.043.67
218.428.2319.915.1323.321.2419.435.4819.57.8119.129.64
322.019.0216.173.9723.372.0119.944.2522.478.8522.800
July118.845.2519.49.2318.93.0120.219.6422.527.2220.657.26
219.929.6520.1124.2917.831.6417.452.2621.9102.8919.910.64
321.418.4522.929.2321.521.2220.55.8321.829.9522.344.25
August124.22.0123.832.6320.460.0522.08.4219.8116721.20.41
221.290.2422.010.8219.749.4521.658320.224.4322.78.63
318.516.2419.235.8321.612.0120.112.6316.085.4921.775.24
September116.147.8618.934.2317.670.0516.228.6615.21.2117.124.43
214.9113.6817.920.8214.06.0217.70015.931.2413.4236
311.075.8411.341.6713.55.4314.948613.214.4311.620.97
Avg T/
total P
16.0 ↑788 ↑13.8 ↑18.0 ↑565 ↑10.7 ↓16.5 ↑694 ↑10.5 ↓16.0 ↑485 ↑12.7 ↓15.6 ↑6715.0 ↑16.4 ↑404 ↓12.5 ↓
Apr–Sep: long-term average temperature from 1991–2020 (T): 15.5 °C, precipitation total (P): 449 mm; number of days with precipitation ≥0.1 mm: 13.3
Criteria for * temperature assessment according to Miętus et al. (2002) [22] (Table 1), ** the relative precipitation index (RPI) according to Kaczorowska [23] (Table 2), ↑—higher average temperature or precipitation total value and ↓—lower temperature or precipitation total value with respect to average values 1991–2020. The explanations for colors are presented in Table 1 and Table 2.
Table 4. Occurrence of diseases during the research period.
YearDiseaseGrowing Period
AprilMayJuneJulyAugustSeptember
312312312312312
BBCHBBCH 1–15BBCH 16–51BBCH 51–69BBCH 70–89
2017SD *
CLB
FWS
FPB
2018SD
BLS
CLB
FWS
BS
FPB
2019SD
BLS
CLB
FWS
FPB
2020SD
BLS
FWS
FWL
BS
FPB
2021SD
BLS
FWS
BS
FPB
2022SD
BLS
CLB
FWS
FWL
BS
FPB
* Seeding diseases (SD), bacterial leaf spot (BLS), brown spot (BS), Fusarium wilt of leaves (FWL), Fusarium wilt of stems (FWS), Ascochyta of leaves (AL), Cercospora leaf blight (CLB), frogeye leaf spot (FLS), Fusarium pod blight (FPB). The color intensity is related with vegetation season.
Table 5. Yield and coefficients of variation of yield for selected cultivars in normal (2017–2019) and anomalous (2020–2022) years.
CultivarClassAverage Yield
± Standard Deviation
Cv(%)
2017–2019
Aligator24.68 ± 0.286
Merlin14.45 ± 0.338
Abelina14.51 ± 0.4310
2020–2022
Acardia24.36 ± 0.6716
Viola23.80 ± 0.3710
Abelina13.96 ± 0.4110
Obelix13.89 ± 0.4612
Disclaimer/Publisher’s Note: The statements, opinions and data contained in all publications are solely those of the individual author(s) and contributor(s) and not of MDPI and/or the editor(s). MDPI and/or the editor(s) disclaim responsibility for any injury to people or property resulting from any ideas, methods, instructions or products referred to in the content.