Article

Soil Ecoenzymatic Stoichiometry Reveals Microbial Metabolic Limitations in Apple Orchards with Cover Crop and Organic Fertilizer Incorporation

1
College of Natural Resources and Environment, Northwest A&F University, Xianyang 712100, China
2
Key Laboratory of Plant Nutrition and the Agri-Environment in Northwest China, Ministry of Agriculture, Xianyang 712100, China
3
Apple Experiment Station, Northwest A&F University, Xianyang 715600, China
*
Author to whom correspondence should be addressed.
Agronomy 2024, 14(3), 581; https://doi.org/10.3390/agronomy14030581
Submission received: 30 January 2024 / Revised: 11 March 2024 / Accepted: 12 March 2024 / Published: 14 March 2024
(This article belongs to the Special Issue Improving Fertilizer Use Efficiency - Volume II)

Abstract

:
Understanding the stoichiometry of extracellular enzymes in soil, particularly in relation to nutrient acquisition (e.g., carbon, nitrogen, phosphorus), provides valuable insights into microorganisms’ resource requirements. This study investigates the metabolic constraints of soil microorganisms in response to different growth stages of apple trees under various soil management practices. A 14-year long-term experiment with a split-plot design was conducted, where the main plots received different cover crop treatments (bare vs. cover crop), and subplots were subjected to four fertilizer treatments (CK, M, NPK, MNPK). The significant main and interactive effects of cover crops, fertilizer treatment, and growth period on soil nutrients were observed (p < 0.001). Both cover crop and fertilizer treatments significantly increased the soil organic matter content, with implications for orchard resilience to drought. However, the cover factor alone did not notably influence soil carbon–nitrogen ratios or microbial communities. Microbial carbon limitations were driven by soil water dynamics and microbial biomass, while microbial phosphorus limitations were closely linked to total nitrogen levels. The results underscore the combination of cover crops and MNPK fertilizer-enhanced soil nutrient levels and enzyme activities, mitigating microbial carbon and phosphorus limitations. These findings suggest practical strategies for optimizing fertilization practices to improve soil fertility and address nutrient constraints in orchard ecosystems.

1. Introduction

The implementation of organic amendment treatments (e.g., cover crops and organic fertilizer) plays a vital role in supporting ecosystem services for agro-ecosystems. In China, the Loess Plateau stands out as the predominant apple-producing region, with the apple industry serving as a significant economic powerhouse and industrial cornerstone, driving local economic growth. The importance of the Loess Plateau in apple production cannot be overstated, as it not only contributes substantially to the region’s economy but also plays a crucial role in sustaining agricultural livelihoods and promoting regional development [1].
Cover crops have long been recognized as essential measures for soil fertility conservation and reinforcement in the Loess Plateau region. These crops play a pivotal role in enhancing soil physicochemical properties [2,3,4]. The residue decomposition of cover crops could provide abundant nutrients and increases for the soils and intercropping crops [5,6,7]. The composition of the microbial community and soil enzyme activity can also be influenced. These alterations primarily stem from the nutrients released through decomposition following grass mulching, the root exudates generated amid the grass mulching process, and the effects of grass mulching on soil moisture dynamics [8,9,10].
Various fertilization modes in orchards, such as chemical fertilizers, organic fertilizers, and a combination of organic and inorganic fertilizers, have significant impacts on the biological, physical, and chemical processes of the soil and soil properties, including the soil pH, soil microbial activity, and mineralization of organic matter. These effects, in turn, influence the nutrient availability for fruit trees’ absorption. Enhancing soil organic carbon storage in orchards through sustainable management practices like grass mulching and organic fertilizer application can reduce the dependency on chemical fertilizers to some extent. These practices are advantageous for enhancing soil nutrient absorption and utilization by fruit trees, promoting the stability of the orchard ecosystem [11]. Synergistic combinations of various orchard management strategies can further optimize nutrient absorption by fruit trees, ultimately supporting the ecological and environmental well-being of the orchard [12].
Extracellular enzymes in the soil can either survive independently or associate with the mineral components of organic soil matter. These enzymes are pivotal in microbial metabolism and the cycling of nutrients [13,14]. They can be classified into enzymes that acquire carbon (for example, β-1,4-glucosidase, BG), those obtaining nitrogen (for instance, β-N-acetylglucosaminidase, NAG; L-leucine aminopeptidase, LAP), and enzymes acquiring phosphorus (like, alkaline phosphatase, AKP) [15,16]. Sinsabaugh introduced the concept of ecological enzyme stoichiometry to investigate enzyme activity in natural ecosystems, providing insights into the interplay between microbial metabolic demands and soil nutrient availability [17]. This approach is widely utilized to explore the metabolic constraints of microorganisms concerning carbon (C), nitrogen (N), and phosphorus (P) utilization. Furthermore, for a deeper understanding of microbial metabolism characteristics, Moorhead recommends assessing the “length” and “angle” of vectors on a graph depicting the ratio of enzyme C:N to C:P acquisition. This analysis enables the quantification of carbon versus nutrient acquisition (vector length) and the relative allocation of phosphorus to nitrogen (vector angle) [18]. The growth, yield, and quality of fruit trees are typically influenced by various factors such as fruit tree species, environmental conditions, and other orchard management practices when utilizing a combination of organic and inorganic fertilizers. Moreover, the impacts of nitrogen and phosphorus derived from organic fertilizers like manure and green manure are intricately connected to the activities of microorganisms engaged in complex carbon, nitrogen, and phosphorus cycles. Consequently, studying the efficacy and consequences of organic fertilizers on fruit tree nutrition proves to be more challenging compared to chemical fertilizers due to these intricate relationships [19]. Additionally, extensive research suggests that soil enzyme activities and soil biochemical properties have high in-season variability [7,20,21]. These changes may affect soil nutrient turnover and enzyme activities, ultimately influencing crop yields.
Therefore, it becomes essential to evaluate the ecological enzyme stoichiometry and nutrient cycling facilitated by soil microorganisms in orchards. Our study investigated the activities of soil enzymes associated with carbon, nitrogen, and phosphorus acquisition under different fertilizer management and cover crop schemes during the crucial growth stages of apple trees. Furthermore, we characterized microbial metabolic limitations in each treatment using models of extracellular enzymatic stoichiometry. This study aimed to (1) scrutinize the dynamic changes in soil nutrients following the integration of cover cropping with fertilization and (2) analyze the attributes of microbial metabolic limitations under cover crop and fertilization practices.

2. Materials and Methods

2.1. Study Site and Treatments

The examination took place at the Apple Testing Station located on the Loess Plateau, part of Northwest A&F University, in Shaanxi Province, China (109°56′ E, 35°21′ N, elevated 838 m). This area’s weather pattern is typical of a subtropical monsoon climate and boasts nearly 207 days free of frost and roughly 114 days with sunlight annually. Farming practices here are entirely dependent on natural rainfall (Figure S1). The yearly average temperature is around 11 °C paired with a yearly rainfall of approximately 570 mm, with a notable 60% occurring between the months of July and September—a period marked by a higher evaporation/precipitation ratio (Figure S1). As per USDA’s soil classification, the ground here falls under Haplustalfs with an average breakdown of 8% sand, 67% silt, and 25% clay. In its initial state, the top 20 cm layer of soil demonstrated the following typical chemical properties: a pH level of 8.3, organic matter measured at 13.02 g·kg−1, total nitrogen (TN) at 1.03 g·kg−1, soil-available nitrogen (AN) at 24.90 mg·kg−1, soil-available phosphorus (AP) at 15.94 mg·kg−1, and soil-available potassium at 151.28 mg·kg−1. More detailed information about the experimental conditions and methodology is available in the publication by Zheng [22].
Primarily populated by “Fuji” apple trees (Malus pumila Mil.) planted on M.26 rootstock in 2005, the landscape adhered to a traditional arrangement of 2.0 m × 4.0 m. The investigation involved a split-plot setup comprising two cover strategies (either without or with cover crops) applied to the main plots along with the following four fertilizing methods: no fertilizing (CK), organic fertilizer application (M), chemical fertilizer use (NPK), and a mix of both organic and chemical fertilizers (MNPK). Each condition was replicated three times. In the context of the cover crop strategy (C), rape (Brassica campestris) was grown interspersed among rows of apple trees in the early part of June and mowed down in the initial days of October, after which the remaining plant parts were churned into the soil. The seeding rate was pegged at 7.5 kg per hectare annually. The fertilizers used included urea (containing 46% N), calcium superphosphate (12% P2O5), and potassium sulfate (50% K2O). For the NPK method, the chemicals were applied at 192 kg of N, 108 kg of P2O5, and 168 kg of K2O per hectare annually. The MNPK approach saw these figures halve to 96 kg of N, 54 kg of P2O5, and 84 kg of K2O per hectare annually. Decomposed goat manure was used as organic manure, dry manure containing 351.0 g·kg−1 of organic matter, 5.3 g·kg−1 of N, 6.2 g·kg−1 of P, and 9.4 g·kg−1 of K. The manure was applied at rates of 36 tons for the M strategy and 18 tons for the MNPK approach per hectare annually. Half the quantity of chemical fertilizer and the entirety of the manure were utilized as a base fertilizer at the end of October, while the leftover chemical fertilizer was deployed at the tail end of May the next year.

2.2. Soil Sample Collection

Samples representative of each season were fetched from the top 20 cm of the soil profile on 20 March, 11 May, 13 August, and 28 October 2019. These dates closely coincide with the apple tree stages of budding, fruit-setting, swelling, and maturing, respectively. For every plot, six soil samples were randomly chosen and amalgamated into one composite. This composite sample was then passed through a 2 mm sieve. Upon collection, these amalgamated samples were swiftly delivered to a laboratory, utilizing dry ice for preservation and for more in-depth analysis.

2.3. Soil Physiochemical Analysis

The soil water content (SWC) was ascertained through an oven-drying technique, drying samples at 105 °C until weight stability was reached. Dichromate oxidation was employed for the estimation of soil organic content (SOC). The total nitrogen (TN) assessment involved the Kjeldahl method [23]. Total phosphorus (TP) and Olsen-P (AP) were extracted with a mix of H2SO4-HClO4 and separately with sodium bicarbonate [24]. A 1M KCl (Sinopharm Chemical Reagent Co. Ltd., Shanghai, China) solution was used to extract available nitrogen (AN) and analyzed using a continuous flow analyzer. Based on the method described by Jones and Willett, soil-dissolved organic carbon (DOC) and nitrogen (DON) were analyzed, involving an extraction process using 2M of KCl [25]. The chloroform fumigation–extraction procedure was adopted to measure soil microbial biomass carbon (MBC) and nitrogen (MBN). Using this method, it was possible to distinguish microbial C and N from the total soil C and N. The enzyme activities of β-glucosidase (BG), N-acetyl-glucosaminidase (NAG), leucine aminopeptidase (LAP), and acid phosphatase (AKP) in the soil were measured using microplate fluorometry. Specific fluorometric substrates corresponding to BG, NAG, LAP, and PHOS (Shanghai Macklin Biochemical Technology Co., Ltd, , Shanghai, China) were used. Fluorescence readings were carried out using a specific wavelength range for excitation (365 nm) and emissions (450 nm) [26].

2.4. Quantification of Microbial Metabolic Limitation

To assess microbial limitations, vector analysis was performed through the calculation of the vector length and vector angle [18]:
Length = x 2 + y 2
Angle ( ° ) = DEGREES   ( ATAN 2 ( x , y ) )
In this equation, ‘x’ denotes the relative activity of carbon-acquiring enzymes compared to phosphorus-acquiring ones. Simultaneously, ‘y’ specifies the relative activity of carbon-acquiring enzymes as opposed to nitrogen-acquiring ones. Moreover, the vector angle represents the comparative limitation of nutrients. If the vector angle exceeds 45 degrees, it indicates a greater limitation by phosphorus (denoted as the microbial P limitation) in relation to nitrogen (termed as microbial N limitation) [27,28].

2.5. Statistical Analysis

This investigation utilized three-way repeated-measures ANOVAs to examine the effects of cover crop strategies, fertilizer application methods, and the growth period, along with their interactions, on soil physicochemical properties, enzyme activity, and microbial metabolic constraints. The threshold for significance was set at a p-value of less than 0.05. The relations among soil physicochemical parameters, enzyme activities, and microbial metabolic constraints were evaluated via Spearman’s correlation coefficients utilizing the “corrplot” package. The role of soil physicochemical variables in microbial metabolic limitations was established using a random forest classification analysis within the “randomForest” package. Potential influential pathways for various attributes on carbon (C) and phosphorus (P) limitations were explored through Partial Least Squares Path Modeling (PLS-PM), employing the “innerplot” function within the “plspm” package. Data were visually represented through bar graphs, box plots, and linear regression figures crafted using the “ggplot2” package. All statistical analyses mentioned herein were carried out using R software (v.4.0.2).

3. Results

3.1. Changes in Soil Physicochemical Properties

Cover crop, fertilizer treatment, and growth period were found to have significant main and interactive effects on soil nutrients (p < 0.001) (Figure 1, Table 1). However, the cover treatment did not have a significant impact on the nutrient ratios (C:N, C:P, N:P) (SOC:TN, SOC:TP, TN:TP) in the soil (p > 0.05), and the interaction between fertilization and cover did not significantly impact the C:N ratio (p > 0.05). On the other hand, the interaction between the growth period and fertilization, as well as the interaction between the growth period and cover, significantly affected the proportion of nutrients in the soil (p < 0.05).
In the treatment involving cover crop and CK, the content of soil moisture was found to be lower during the budding and maturity stages compared to the bare treatment but higher during the setting and swelling stages (Figure 1A). Conversely, when the cover crop was combined with M and CK, an opposite performance pattern was observed. It resulted in lower soil moisture content than the bare treatment during the budding and maturity stages, higher content during the setting stage, and no significant effect during the swelling stage. Furthermore, when comparing the cover crop NPK treatment with the bare treatment, it was either found to have no significant impact on soil moisture (during the budding, setting, and maturity stages) or significantly lower levels (during the swelling stage). Notably, in the MPNK treatment, the soil moisture in the rapeseed cover crop treatment was consistently lower than that in the bare treatment. The soil moisture of the NPK treatment in the cover crop was significantly lower than the CK during the setting and swelling periods, while the soil moisture in the NPK treatment of the non-mulching treatment was significantly higher than that of CK. In the corresponding treatment with the addition of organic fertilizer, soil moisture NPK was significantly higher than NPK in both periods. Affected by organic import, the SOC in the M and MNPK treatments at each growth stage was significantly higher than that in the NPK and CK treatments (Figure 1B). The impact of the decomposition of rapeseed SOC was greatly affected by the growth stage.

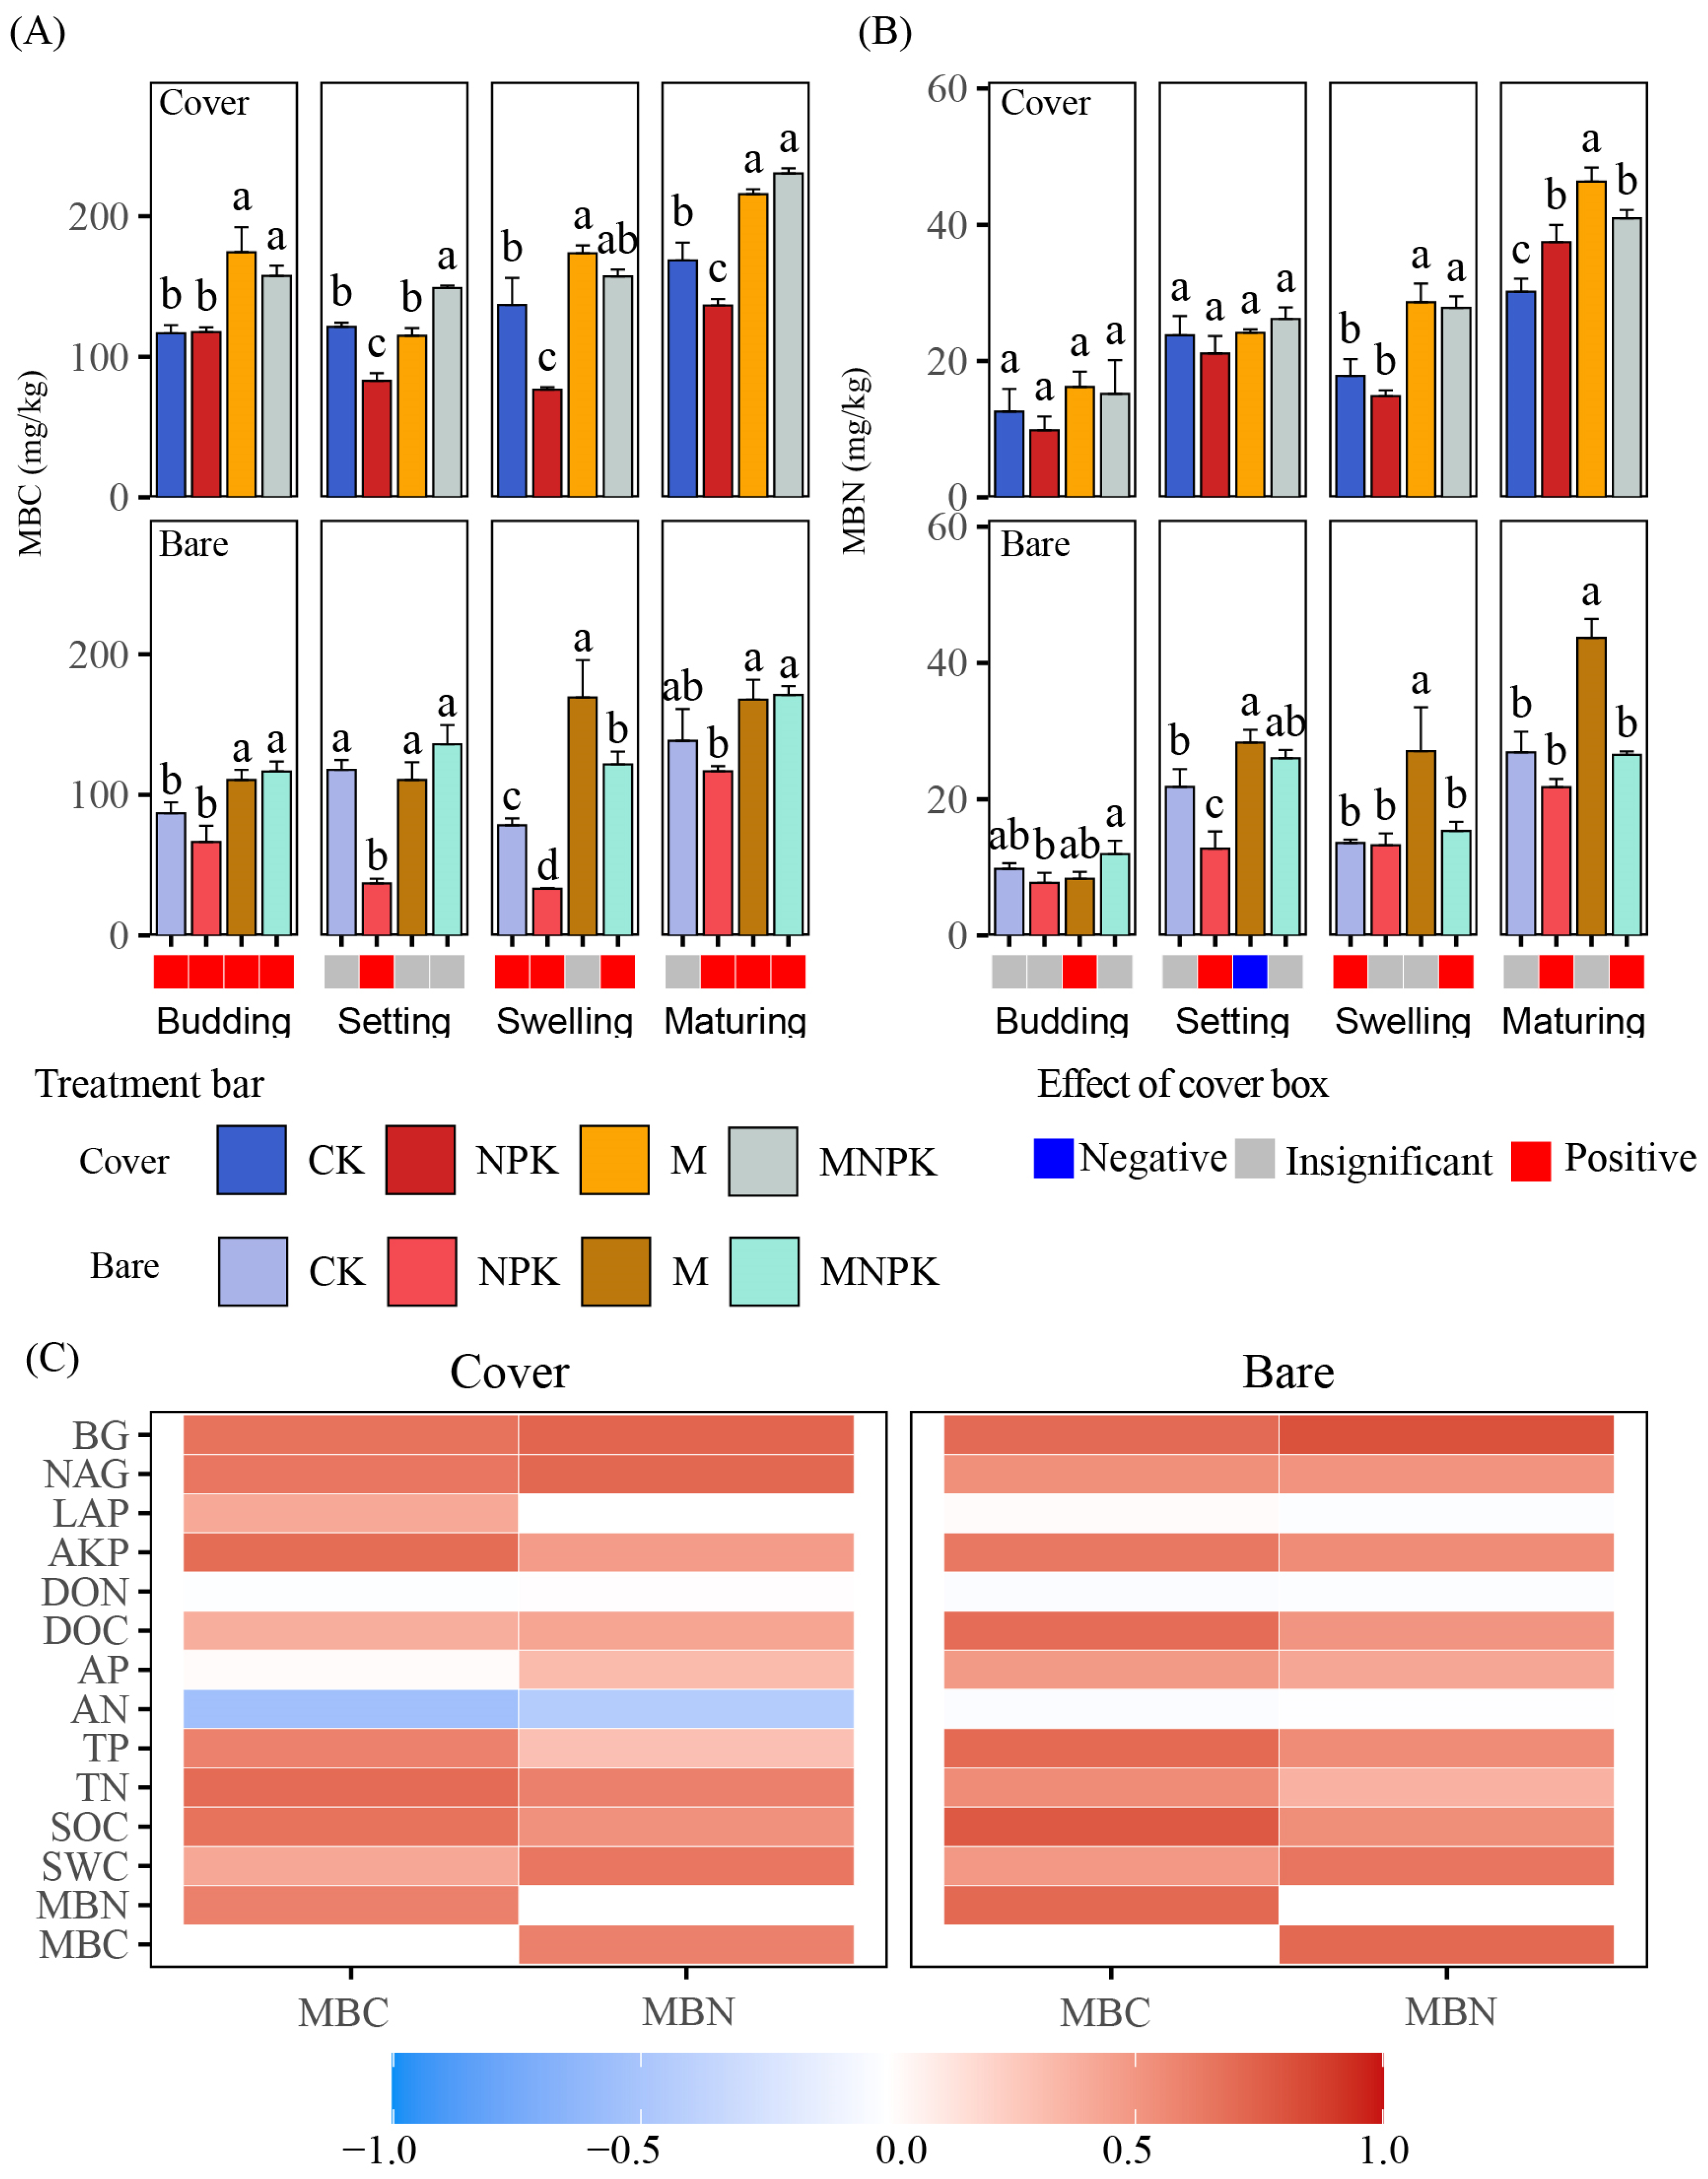
3.2. Changes in Soil Microbial Carbon and Nitrogen

Cover cropping significantly boosted soil MBC during the budding and maturity stages in all treatments except for CK. The application of NPK, whether in cover crops or bare treatments, exhibited a substantial negative effect on soil MBC and MBN. Conversely, treatments with M and MNPK showed a positive influence on soil MBC and MBN (Figure 2). The level of MBC was particularly high in the MNPK treatment during the setting period. During maturation, both MNPK and M were used with cover crops and notably amplified soil MBC. The MBN level in MNPK and M treatments exceeded that of CK and NPK during the budding and swelling periods. Correlation analysis illustrated that MBC and MBN were significantly positively correlated with soil extracellular enzyme activities (BG, NAG, AKP) and soil nutrients (DOC, TP, TN, SOC, SWC) regardless of the cover crop or bare treatment. Additionally, a significant positive correlation existed between MBC and MBN. However, AN displayed a significant negative correlation with MBC and MBN when used in conjunction with the cover crop treatment.

3.3. Changes in Soil Microbial Metabolic Limitations

The characteristics of the microbial metabolic limitation exhibited variation across different treatments and growth stages (Figure 3 and Figure S2). All data points were situated above the 1:1 line, denoting a marked phosphorus (P) limitation within the microbial community of our study area (Figure 3A). The coverage had no significant influence on the angle in the soil length. The coverage treatment only demonstrated a significant decrease in the angle during M processing, setting, and maturity while simultaneously augmenting the length during NPK, M, and MNPK processing and budding. Linear regression analysis revealed a positive correlation between vector length and vector angle (Figure 3C). Furthermore, the random forest outcomes indicated that both the angle and length of covered and uncovered treatments could be fully accounted for by the soil’s physical and chemical indicators (cover angle: 66.63, cover length: 58.26, bare angle: 58.07, cover length: 59.99) (Figure 4). Specifically, the angle of the cover crop treatment was primarily impacted by TN (20.79), the length of the cover crop treatment was principally influenced by DOC (18.34), the angle of the bare treatment was predominantly affected by TN (18.03), and the length of the bare treatment was primarily determined by MBC/MBN (23.61).
The PLS-PM analysis revealed both the direct and indirect impacts of fertilization, cover crop, and growth period on soil physicochemical properties and microbial metabolic limitations (Figure 5). The growth period directly affects soil water (0.24), soil nutrients (SOC, TN, TP, AP, DOC) (0.77), and soil microbial biomass (MBC, MBN, MBC_MBN), thereby indirectly affecting microbial C (carbon) limitation (Figure 4). Cover crops also pass the effects affecting soil water (0.62), nutrients (0.29), and microbial biomass (0.19), indirectly and directly affecting microbial C limitation (−0.54). Fertilization affects microbial C limitation indirectly through effects on soil nutrients (0.33). Soil water (0.37) and soil microbial biomass (0.77) can directly affect microbial C limitation. The effects of the growth period, cover crop, and fertilization on microbial P limitation followed similar pathways. The growth period of fruit trees affects soil nutrients (SOC, TN, AP, N:P, C:P, C:N) (0.74), and soil water (0.24) indirectly affects soil phosphorus limitation. Mulch affected both indirectly and directly (−0.49) microbial P (phosphorus) limitation by affecting soil nutrients, soil water, and soil microbial biomass (MBC, MBN). Fertilization indirectly affected microbial P limitation by affecting soil nutrients (0.26) and microbial biomass (0.17). Both soil water and nutrients can indirectly affect microbial P limitation (soil water: 0.40, soil nutrients: −0.64) by affecting microbial biomass (soil water: 0.49, soil nutrients: 0.70).

4. Discussion

4.1. Effects of Cover Crop and Fertilizer Management on Soil Physicochemical Properties

Cover crop and fertilization can significantly affect the total and available nutrients in the soil, including SOC, TN, TP, AN, and AP; such observations mirror the results from prior local long-term positioning studies [22]. Plus, prior research also indicates that the introduction of organic fertilizers increases the content of active carbon pools in soil [29]. Comparable outcomes have also been observed through similar treatments in various geographical settings [30]. During the growth stage around planting cover crops, the water and fertilizer resources utilized by grass have competed with fruit trees for nutrients and water. However, once the cover crop is cut and its residues cover the soil, the soil nutrients undergo restorative growth. The above-ground portion of the grass cover effectively reduces soil moisture and preserves water through evaporation [31]. As the grass cover degrades, it adds organic matter and available nutrients (such as nitrogen, phosphorus, and potassium) to the soil. This not only increases soil nutrient levels but also improves soil quality [32]. The cover crop also helps alleviate prolonged droughts during winter and spring in the Weibei Plateau. It allows for the cross-seasonal use of soil water and improves soil water use efficiency [33]. Both the application of organic fertilizer and cover significantly increase SOC and MBC. Organic fertilizer application increases SOC across all growth stages, whereas coverage-induced organic matter growth is influenced by the growth stage. Crop cover contains easily decomposable organic matter, which is broken down by microorganisms [34]. This study’s findings demonstrate a similar seasonal variation pattern between soil organic matter and microbial biomass carbon. Regardless of whether the soil is mulched or bare, there is a significant correlation between soil microbial biomass carbon and nitrogen. This is because mulching has no substantial impact on the carbon-to-nitrogen ratio in the soil, and microorganisms selectively absorb nutrients from the environment to maintain their own homeostasis [35].

4.2. Effects of Cover Crop and Fertilizer Management on Microbial Metabolic Limitation

The vector length exhibited an initial increase during the budding period, followed by a decrease during the swelling period, and ultimately, an increase during the maturing period (Figure 3). During the setting and maturing periods, apple trees required the absorption and storage of nutrients to meet their growth needs. Furthermore, the increase in air temperature and precipitation (Figure S1) stimulated the decomposition of organic carbon (C), nitrogen (N), and phosphorus (P) [36]. Consequently, soil microbes require more carbon resources to hydrolyze nutrients (such as N and P) from organic residues, exacerbating the depletion of soil-available C and leading to an increased microbial C limitation. The variations in soil microbial biomass during the growth periods support this hypothesis. Notably, the ratio of microbial biomass carbon to microbial biomass nitrogen (MBC/MBN) exhibited a significant decrease during the setting period, suggesting that microorganisms tend to maintain microbial biomass homeostasis, which may result in the highest level of C limitation during this period [37]. Our random forest analysis also indicated that MBC/MBN (bare treatment) and dissolved organic carbon (DOC) (the cover crop treatment) were the most important factors influencing C limitation, while total nitrogen (TN) influenced P limitation (Figure 4). These findings align with the notion that the microbial metabolic limitation in the soil is primarily influenced by the biological properties of the soil [28] and can be attributed to the direct involvement of biotic factors in the decomposition of soil organic matter [38]. Moreover, the fluctuations in DOC, microbial biomass nitrogen (MBN), and bacterial growth across the different growth periods followed a similar “bimodal” pattern to the vector length, suggesting that soil microbes are capable of regulating their physiological metabolism and displaying distinct extracellular enzyme activities to adapt to environmental changes [27]. In line with previous studies, our findings suggest that soil microorganisms tend to be P-limited. The fluctuation in P limitation across the growth periods exhibited a similar trend to that of C limitation (Figure 3), further supporting the notion that microbial C and P metabolisms are interconnected and that P limitation can intensify C limitation [27,39]. Previous research indicates that the available phosphorus content in soil can negatively impact microbial phosphorus limitation, while the soil C:P ratio has a positive effect on microbial biomass phosphorus [37]. A lower phosphorus content may play a significant role in inducing phosphorus limitation in the soil, while the application of phosphorus fertilizer can effectively alleviate microbial phosphorus limitation [40].
The microbial limitation was significantly influenced by long-term fertilizer treatment. During the budding and swelling periods, there was no significant difference in C limitation among the different fertilizer treatments. However, the fertilizer treatment decreased the relative C limitation of microorganisms during the setting and maturing periods (Figure 3), indicating a significant interaction between the fertilizer treatment and growth period in terms of C limitation. As previously mentioned, the C limitation was significantly higher during the setting and maturing periods compared to the other two periods (Figure 5A), suggesting that the application of fertilizers could reduce the microbial demand for C sources when the C limitation is more pronounced. During the budding and swelling period, microbial C limitation remained unchanged despite the changing soil environment, possibly due to limited water and nutrient availability that restrained soil microbial metabolic activity [30,41,42]. Previous studies have demonstrated that alternating periods of dryness and precipitation play a crucial role in microbial metabolism and nutrient limitation in soil microorganisms [39]. However, during the setting and maturing period, soil water no longer restricted microbial metabolism. The application of fertilizers provided ample resources, reducing the demand for carbon in nutrient metabolism and consequently decreasing soil microbial C limitation [31]. The combined application of chemical fertilizer and manure significantly decreased P limitation throughout the apple tree growth periods. Previous studies have shown that combining chemical fertilizer with manure increases the soil’s available phosphorus (AP) content, while the presence of Brassica promotes phosphorus activation in the soil and releases abundant phosphorus, thereby providing more available phosphorus for microorganisms and alleviating microbial P limitation [43]. This finding is consistent with the research results of Cui [39], who suggested a negative relationship between microbial P limitation and soil-available phosphorus.

4.3. Mechanism of Microbial C and P Limitation Turn over in Cover Crop

The PLS-PM analysis unveiled both the direct and indirect influences of fertilization, cover crop, and growth period on soil physicochemical properties as well as microbial metabolic limitations (Figure 5). In terms of microbial C limitation, cover crop, and fertilizer application enhanced the soil pool and nutrient content, directly stimulating microbial growth and increasing microbial biomass. This led to a greater demand for carbon resources and, consequently, increased microbial C limitation [44,45]. However, we observed that the fertilizer treatment decreased microbial C limitation during the setting and maturing periods (Figure 3). Supplementary research conducted on this experimental site further indicates that the organic fertilizer treatment involves a higher number of bacteria in the turnover of carbon (C) and nitrogen (N), potentially stimulating the soil carbon and nitrogen cycles [46]. This could be explained by the potential effect of the soil moisture content on the relationship between fertilization and microbial C limitation. In our study, soil water content (SWC) accounted for a higher proportion (0.61 of the total effects) in influencing soil microbial C limitation compared to soil nutrients (0.39 of the total effects). Previous research has also demonstrated that microbial C limitation remains constant under dry conditions and increases under wet conditions [31]. These findings support previous observations that soil moisture can influence the impact of fertilization on C limitation. Our results confirm the significant interactive effects of the fertilizer and growth periods on microbial C limitation and provide a basis for determining the timing of topdressing in apple orchards on the Loss Plateau.
Unlike microbial carbon limitation, the soil nutrient levels increased during cover crop cultivation and chemical fertilization, which provided additional resources for microbial production and metabolism [47]. Furthermore, this increase in soil nutrients directly alleviated the microbial phosphorus limitation (Figure 5B). These findings are consistent with previous studies that have shown the combined application of chemical fertilizers and organic matter to be effective in alleviating phosphorus limitation [48]. Additionally, the cultivation of cover crops and the use of fertilizers led to an increase in the soil microbial biomass and pool, resulting in a greater demand for nutrient resources, including phosphorus. As a result, the microbial phosphorus limitation also increased. Similarly, our study found that the use of fertilizers and cover crops significantly reduced microbial phosphorus limitation. This could be attributed to the fact that soil nutrients (−0.64 of direct effects) had a greater influence compared to the soil microbial biomass (0.42 of direct effects), which is supported by the results of our random forest classification analysis.

5. Conclusions

The effects of fertilizer and cover crops on soil physicochemical properties and microbial metabolic limitations during the four critical growth periods of apple trees were evaluated in this research. The results demonstrate that both cover crops and fertilizer significantly increase soil organic matter. During the planting period, cover crops compete with fruit trees for water and nutrients. However, the organic matter left in the soil after cover crops are cut can aid orchards in surviving continuous droughts in winter and spring while also increasing the microbial biomass carbon content. Despite this, the cover factor alone does not impact the soil carbon and nitrogen ratio and has no significant effect on soil microorganisms in terms of angle and length. Fluctuations in microbial C limitation are primarily driven by changes in soil water and microbial biomass, while TN plays a key role in microbial P limitation. Our data confirm the interactive effect of cover cropping and fertilizer treatment on soil enzyme activities and microbial metabolic limitations. Overall, the combination of cover crops and the MNPK fertilizer yields the highest level of the soil nutrient pool and enzyme activities while reducing microbial C and P limitations. These findings have implications for optimizing fertilization management designs that improve soil fertility and alleviate nutrient limitations, such as substituting chemical fertilizers with organic fertilizers and incorporating fertilization and cover cropping.

Supplementary Materials

The following supporting information can be downloaded at: https://www.mdpi.com/article/10.3390/agronomy14030581/s1, Figure S1: Precipitation (mm) and average temperature (°C) in 2019; Figure S2: Variations in soil enzymatic activity and enzymatic stoichiometry under different treatments within each growth period. (a), C-acquiring enzymes: BG; (b), N-acquiring enzymes: LAP + NAG; (c), P-acquiring enzymes AKP; (d), enzyme C:N; (e), enzyme C:P; and (f), enzyme N:P. Effects of fertilization (F), cover crop (C), and growth period (G) on these parameters were estimated using three-way repeated measures of ANOVAs. *, p < 0.05; **, p < 0.01; ***, p < 0.001. Different letters indicate significant differences (p < 0.05) under different treatments within each growth period. CK, no cover crop with no fertilizer; M, no cover crop with organic fertilizer; NPK, no cover crop with chemical fertilizer; MNPK, no cover crop with chemical fertilizer and organic fertilizer. CCK, cover crop with no fertilizer; CM, cover crop with organic fertilizer; CNPK, cover crop with chemical fertilizer; CMNPK, cover crop with chemical fertilizer and organic fertilizer. Table S1: Enzymes assayed in soils and corresponding substrates, abbreviations used in this study, and enzyme commission number; Table S2: Means (±standard deviation) of soil physicochemical properties under different treatments within each growth period.

Author Contributions

Conceptualization, B.Z. (Bingnian Zhai) and S.C.; methodology, B.Z. (Bingnian Zhai); software, B.Z. (Bangyu Zheng); validation, S.C. and B.Z. (Bingnian Zhai); formal analysis, Z.Z. (Zhiyuan Zhao); investigation, N.Y.; resources, Z.Z. (Zhaoxia Zheng); data curation, Z.Z. (Zhiyuan Zhao); writing—original draft preparation, S.C.; writing—review and editing, S.C.; visualization, S.C.; supervision, Z.Z. (Zhaoxia Zheng); project administration, B.Z. (Bingnian Zhai); funding acquisition, B.Z. (Bingnian Zhai). All authors have read and agreed to the published version of the manuscript.

Funding

This study was supported by the Earmarked Fund for China Agriculture Research System (CARS-27), the Major Project of Science and Technology of Shaanxi (2020zdzx03-02-01).

Data Availability Statement

The data and computer codes used in this study can be provided by the corresponding author upon request.

Conflicts of Interest

The authors declare no conflicts of interest.

References

  1. Li, M.; Guo, J.; Xu, C.; Lei, Y.; Li, J. Identifying Climatic Factors and Circulation Indices Related to Apple Yield Variation in Main Production Areas of China. Glob. Ecol. Conserv. 2018, 16, e00478. [Google Scholar] [CrossRef]
  2. Derpsch, R.; Franzluebbers, A.J.; Duiker, S.W.; Reicosky, D.C.; Koeller, K.; Friedrich, T.; Sturny, W.G.; Sá, J.C.M.; Weiss, K. Why Do We Need to Standardize No-Tillage Research? Soil Tillage Res. 2014, 137, 16–22. [Google Scholar] [CrossRef]
  3. Mbuthia, L.W.; Acosta-Martínez, V.; DeBryun, J.; Schaeffer, S.; Tyler, D.; Odoi, E.; Mpheshea, M.; Walker, F.; Eash, N. Long Term Tillage, Cover Crop, and Fertilization Effects on Microbial Community Structure, Activity: Implications for Soil Quality. Soil Biol. Biochem. 2015, 89, 24–34. [Google Scholar] [CrossRef]
  4. Momesso, L.; Crusciol, C.A.C.; Cantarella, H.; Tanaka, K.S.; Kowalchuk, G.A.; Kuramae, E.E. Optimizing Cover Crop and Fertilizer Timing for High Maize Yield and Nitrogen Cycle Control. Geoderma 2022, 405, 115423. [Google Scholar] [CrossRef]
  5. de Freitas, P.L.; Landers, J.N. The Transformation of Agriculture in Brazil through Development and Adoption of Zero Tillage Conservation Agriculture. Int. Soil Water Conserv. Res. 2014, 2, 35–46. [Google Scholar] [CrossRef]
  6. Liu, C.; Wang, Q.W.; Jin, Y.; Tang, J.; Lin, F.; Olatunji, O.A. Perennial Cover Crop Biomass Contributes to Regulating Soil P Availability More than Rhizosphere P-Mobilizing Capacity in Rubber-Based Agroforestry Systems. Geoderma 2021, 401, 115218. [Google Scholar] [CrossRef]
  7. Nevins, C.J.; Nakatsu, C.; Armstrong, S. Characterization of Microbial Community Response to Cover Crop Residue Decomposition. Soil Biol. Biochem. 2018, 127, 39–49. [Google Scholar] [CrossRef]
  8. Lange, M.; Habekost, M.; Eisenhauer, N.; Roscher, C.; Bessler, H.; Engels, C.; Oelmann, Y.; Scheu, S.; Wilcke, W.; Schulze, E.-D.; et al. Biotic and Abiotic Properties Mediating Plant Diversity Effects on Soil Microbial Communities in an Experimental Grassland. PLoS ONE 2014, 9, e96182. [Google Scholar] [CrossRef]
  9. Mazzola, M.; Hewavitharana, S.S.; Strauss, S.L. Brassica Seed Meal Soil Amendments Transform the Rhizosphere Microbiome and Improve Apple Production through Resistance to Pathogen Reinfestation. Phytopathology 2015, 105, 460–469. [Google Scholar] [CrossRef]
  10. Fanin, N.; Fromin, N.; Bertrand, I. Functional Breadth and Home-Field Advantage Generate Functional Differences among Soil Microbial Decomposers. Ecology 2016, 97, 1023–1037. [Google Scholar] [CrossRef]
  11. DeLonge, M.S.; Miles, A.; Carlisle, L. Investing in the Transition to Sustainable Agriculture. Environ. Sci. Policy 2016, 55, 266–273. [Google Scholar] [CrossRef]
  12. Comberti, C.; Thornton, T.F.; Wyllie de Echeverria, V.; Patterson, T. Ecosystem Services or Services to Ecosystems? Valuing Cultivation and Reciprocal Relationships between Humans and Ecosystems. Glob. Environ. Change 2015, 34, 247–262. [Google Scholar] [CrossRef]
  13. Cui, Y.; Fang, L.; Guo, X.; Wang, X.; Wang, Y.; Li, P.; Zhang, Y.; Zhang, X. Responses of Soil Microbial Communities to Nutrient Limitation in the Desert-Grassland Ecological Transition Zone. Sci. Total Environ. 2018, 642, 45–55. [Google Scholar] [CrossRef] [PubMed]
  14. Jones, D.L.; Kielland, K.; Sinclair, F.L.; Dahlgren, R.A.; Newsham, K.K.; Farrar, J.F.; Murphy, D.V. Soil Organic Nitrogen Mineralization across a Global Latitudinal Gradient. Glob. Biogeochem. Cycles 2009, 23, GS1016. [Google Scholar] [CrossRef]
  15. Burns, R.G.; DeForest, J.L.; Marxsen, J.; Sinsabaugh, R.L.; Stromberger, M.E.; Wallenstein, M.D.; Weintraub, M.N.; Zoppini, A. Soil Enzymes in a Changing Environment: Current Knowledge and Future Directions. Soil Biol. Biochem. 2013, 58, 216–234. [Google Scholar] [CrossRef]
  16. Cenini, V.L.; Fornara, D.A.; McMullan, G.; Ternan, N.; Carolan, R.; Crawley, M.J.; Clément, J.C.; Lavorel, S. Linkages between Extracellular Enzyme Activities and the Carbon and Nitrogen Content of Grassland Soils. Soil Biol. Biochem. 2016, 96, 198–206. [Google Scholar] [CrossRef]
  17. Sinsabaugh, R.L.; Shah, J.J.F. Ecoenzymatic Stoichiometry and Ecological Theory. Annu. Rev. Ecol. Evol. Syst. 2012, 43, 313–343. [Google Scholar] [CrossRef]
  18. Moorhead, D.L.; Sinsabaugh, R.L.; Hill, B.H.; Weintraub, M.N. Vector Analysis of Ecoenzyme Activities Reveal Constraints on Coupled C, N and P Dynamics. Soil Biol. Biochem. 2016, 93, 1–7. [Google Scholar] [CrossRef]
  19. Zheng, W. Study on the Effects and Mechanisms of Different Fertilization Methods on Apple Yield and Quality and Water and Fertilizer Use Efficiency under Grass Coverage. Ph.D. Thesis, Northwest A&F University, Xianyang, China, 2019. [Google Scholar]
  20. He, L.; Lu, S.; Wang, C.; Mu, J.; Zhang, Y.; Wang, X. Changes in Soil Organic Carbon Fractions and Enzyme Activities in Response to Tillage Practices in the Loess Plateau of China. Soil Tillage Res. 2021, 209, 104940. [Google Scholar] [CrossRef]
  21. Nevins, C.J.; Lacey, C.; Armstrong, S. The Synchrony of Cover Crop Decomposition, Enzyme Activity, and Nitrogen Availability in a Corn Agroecosystem in the Midwest United States. Soil Tillage Res. 2020, 197, 104518. [Google Scholar] [CrossRef]
  22. Zheng, W.; Zhao, Z.; Lv, F.; Wang, R.; Gong, Q.; Zhai, B.; Wang, Z.; Zhao, Z.; Li, Z. Metagenomic Exploration of the Interactions between N and P Cycling and SOM Turnover in an Apple Orchard with a Cover Crop Fertilized for 9 Years. Biol. Fertil. Soils 2019, 55, 365–381. [Google Scholar] [CrossRef]
  23. Bremner, J.M. Nitrogen-Total. In Methods of Soil Analysis; John Wiley & Sons, Ltd.: Hoboken, NJ, USA, 1996; pp. 1085–1121. ISBN 978-0-89118-866-7. [Google Scholar]
  24. Olsen, S.R. Sommers Methods of Soil Analysis: Chemical and Microbiological Properties; American Society of Agronomy: Madison, WI, USA, 1982; ISBN 978-0-89118-072-2. [Google Scholar]
  25. Jones, D.L.; Willett, V.B. Experimental Evaluation of Methods to Quantify Dissolved Organic Nitrogen (DON) and Dissolved Organic Carbon (DOC) in Soil. Soil Biol. Biochem. 2006, 38, 991–999. [Google Scholar] [CrossRef]
  26. Lv, F.; Zheng, W.; Zhai, B.; Li, Z. Cover Cropping and Chemical Fertilizer Seasonally Mediate Microbial Carbon and Phosphorus Metabolisms in an Apple Orchard: Evidence from the Enzymatic Stoichiometry Method. Appl. Soil Ecol. 2022, 178, 104579. [Google Scholar] [CrossRef]
  27. Sinsabaugh, R.L.; Hill, B.H.; Follstad Shah, J.J. Ecoenzymatic Stoichiometry of Microbial Organic Nutrient Acquisition in Soil and Sediment. Nature 2009, 462, 795–798. [Google Scholar] [CrossRef]
  28. Yang, Y.; Liang, C.; Wang, Y.; Cheng, H.; An, S.; Chang, S.X. Soil Extracellular Enzyme Stoichiometry Reflects the Shift from P- to N-Limitation of Microorganisms with Grassland Restoration. Soil Biol. Biochem. 2020, 149, 107928. [Google Scholar] [CrossRef]
  29. Zhang, A.; Zheng, Z.X.; Zhao, Z.Y.; Feng, T.Y.; Zheng, W.; Zhai, B.N. Effects of Long-term Combined Application of Organic and Inorganic Fertilizers on Soil Carbon Pool and Greenhouse Gas Emissions in Orchards. Huan Jing Ke Xue 2023, 44, 5823–5831. [Google Scholar] [CrossRef] [PubMed]
  30. Wang, R.; Dorodnikov, M.; Yang, S.; Zhang, Y.; Filley, T.R.; Turco, R.F.; Zhang, Y.; Xu, Z.; Li, H.; Jiang, Y. Responses of Enzymatic Activities within Soil Aggregates to 9-Year Nitrogen and Water Addition in a Semi-Arid Grassland. Soil Biol. Biochem. 2015, 81, 159–167. [Google Scholar] [CrossRef]
  31. Li, J.; Dong, L.; Liu, Y.; Wu, J.; Wang, J.; Shangguan, Z.; Deng, L. Soil Organic Carbon Variation Determined by Biogeographic Patterns of Microbial Carbon and Nutrient Limitations across a 3000-Km Humidity Gradient in China. Catena 2022, 209, 105849. [Google Scholar] [CrossRef]
  32. Du, S.; Bai, G.; Yu, J. Soil Properties and Apricot Growth under Intercropping and Mulching with Erect Milk Vetch in the Loess Hilly-Gully Region. Plant Soil 2015, 390, 431–442. [Google Scholar] [CrossRef]
  33. Zhang, H.; Ghahramani, A.; Ali, A.; Erbacher, A. Cover Cropping Impacts on Soil Water and Carbon in Dryland Cropping System. PLoS ONE 2023, 18, e0286748. [Google Scholar] [CrossRef]
  34. Martínez-García, L.B.; Korthals, G.; Brussaard, L.; Jørgensen, H.B.; De Deyn, G.B. Organic Management and Cover Crop Species Steer Soil Microbial Community Structure and Functionality along with Soil Organic Matter Properties. Agric. Ecosyst. Environ. 2018, 263, 7–17. [Google Scholar] [CrossRef]
  35. Sterner, R.W.; Elser, J.J. Ecological Stoichiometry: The Biology of Elements from Molecules to the Biosphere. In Ecological Stoichiometry; Princeton University Press: Princeton, NJ, USA, 2017; ISBN 978-1-4008-8569-5. [Google Scholar]
  36. Li, H.; Zhang, Y.Y.; Yang, S.; Wang, Z.; Feng, X.; Liu, H.; Jiang, Y. Variations in Soil Bacterial Taxonomic Profiles and Putative Functions in Response to Straw Incorporation Combined with N Fertilization during the Maize Growing Season. Agric. Ecosyst. Environ. 2019, 283, 106578. [Google Scholar] [CrossRef]
  37. Cui, Y.; Zhang, Y.; Duan, C.; Wang, X.; Zhang, X.; Ju, W.; Chen, H.; Yue, S.; Wang, Y.; Li, S.; et al. Ecoenzymatic Stoichiometry Reveals Microbial Phosphorus Limitation Decreases the Nitrogen Cycling Potential of Soils in Semi-Arid Agricultural Ecosystems. Soil Tillage Res. 2020, 197, 104463. [Google Scholar] [CrossRef]
  38. Chen, H.; Li, D.; Xiao, K.; Wang, K. Soil Microbial Processes and Resource Limitation in Karst and Non-Karst Forests. Funct. Ecol. 2018, 32, 1400–1409. [Google Scholar] [CrossRef]
  39. Cui, Y.; Fang, L.; Deng, L.; Guo, X.; Han, F.; Ju, W.; Wang, X.; Chen, H.; Tan, W.; Zhang, X. Patterns of Soil Microbial Nutrient Limitations and Their Roles in the Variation of Soil Organic Carbon across a Precipitation Gradient in an Arid and Semi-Arid Region. Sci. Total Environ. 2019, 658, 1440–1451. [Google Scholar] [CrossRef] [PubMed]
  40. Wang, X.; Cui, Y.; Wang, Y.; Duan, C.; Niu, Y.; Sun, R.; Shen, Y.; Guo, X.; Fang, L. Ecoenzymatic Stoichiometry Reveals Phosphorus Addition Alleviates Microbial Nutrient Limitation and Promotes Soil Carbon Sequestration in Agricultural Ecosystems. J. Soils Sediments 2022, 22, 536–546. [Google Scholar] [CrossRef]
  41. Ladwig, L.M.; Sinsabaugh, R.L.; Collins, S.L.; Thomey, M.L. Soil Enzyme Responses to Varying Rainfall Regimes in Chihuahuan Desert Soils. Ecosphere 2015, 6, 1–10. [Google Scholar] [CrossRef]
  42. Tapia-Torres, Y.; Elser, J.J.; Souza, V.; García-Oliva, F. Ecoenzymatic Stoichiometry at the Extremes: How Microbes Cope in an Ultra-Oligotrophic Desert Soil. Soil Biol. Biochem. 2015, 87, 34–42. [Google Scholar] [CrossRef]
  43. Hansen, V.; Eriksen, J.; Jensen, L.S.; Thorup-Kristensen, K.; Magid, J. Towards Integrated Cover Crop Management: N, P and S Release from Aboveground and Belowground Residues. Agric. Ecosyst. Environ. 2021, 313, 107392. [Google Scholar] [CrossRef]
  44. Deng, L.; Peng, C.; Huang, C.; Wang, K.; Liu, Q.; Liu, Y.; Hai, X.; Shangguan, Z. Drivers of Soil Microbial Metabolic Limitation Changes along a Vegetation Restoration Gradient on the Loess Plateau, China. Geoderma 2019, 353, 188–200. [Google Scholar] [CrossRef]
  45. Kwabiah, A.B.; Palm, C.A.; Stoskopf, N.C.; Voroney, R.P. Response of Soil Microbial Biomass Dynamics to Quality of Plant Materials with Emphasis on P Availability. Soil Biol. Biochem. 2003, 35, 207–216. [Google Scholar] [CrossRef]
  46. Zhao, Z.; Ma, Y.; Zhang, A.; Chen, Y.; Zheng, Z.; Zheng, W.; Zhai, B. Response of Apple Orchard Bacteria Co-Occurrence Network Pattern to Long-Term Organic Fertilizer Input. Appl. Soil Ecol. 2023, 191, 105035. [Google Scholar] [CrossRef]
  47. Ren, C.; Zhao, F.; Kang, D.; Yang, G.; Han, X.; Tong, X.; Feng, Y.; Ren, G. Linkages of C:N:P Stoichiometry and Bacterial Community in Soil Following Afforestation of Former Farmland. For. Ecol. Manag. 2016, 376, 59–66. [Google Scholar] [CrossRef]
  48. Zheng, L.; Chen, H.; Wang, Y.; Mao, Q.; Zheng, M.; Su, Y.; Xiao, K.; Wang, K.; Li, D. Responses of Soil Microbial Resource Limitation to Multiple Fertilization Strategies. Soil Tillage Res. 2020, 196, 104474. [Google Scholar] [CrossRef]
Figure 1. Changes in soil properties under different treatments within each growth period. (A) Soil water content; (B) soil organic carbon. Lowercase letters represent significant differences in irrigation treatments (p < 0.05) within the same apple growth stage, determined using one-way ANOVA and followed by Duncan’s multiple range test. The square at the bottom of the histogram represents the difference between the cover crop and bare ground under the same fertilization treatment during the same period. Blue indicates the negative effect of cover crop compared to bare ground, gray indicates no significant difference, and red indicates a positive effect of cover crop compared to bare ground.
Agronomy 14 00581 g001
Figure 2. Variations in soil microbial biomass under different treatments within each growth period. (A) Soil biomass carbon; (B) soil biomass nitrogen. Lowercase letters represent significant differences in irrigation treatments (p < 0.05) within the same apple growth stage, as determined by one-way ANOVA and followed by Duncan’s multiple range test. The square at the bottom of the histogram represents the difference between cover crops and bare ground under the same fertilization treatment during the same period. Blue indicates a negative effect of cover crop compared to bare ground, gray indicates no significant difference, and red indicates the positive effect of cover crop compared to bare ground. (C) Correlation between microbial biomass carbon and nitrogen, soil properties, and enzyme activity under different cover measures. Non-significant correlations are colorless red represents a significant positive correlation, and blue represents a significant negative correlation. The abbreviations are as follows: BG (β-1,4-glucosidase), NAG (β-1,4-N-acetylglucosaminidase), LAP (L-leucine aminopeptidase), AKP (alkaline phosphatase); DON (dissolved organic nitrogen), DOC (dissolved organic carbon), AP (Olsen-P), AN (nitrate and ammonium nitrogen), TP (total phosphorus), TN (total nitrogen), SOC (soil organic content), SWC (soil water content), MBC (soil microbial biomass carbon), and MBN (soil microbial biomass nitrogen).
Agronomy 14 00581 g002
Figure 3. The enzyme stoichiometry is based on the relative ratios of carbon to nitrogen acquisition versus carbon to phosphorus acquisition. (A) The relationships between vector length and angle, where the vector length represents the carbon limitation in the soil for microbes, and the vector angle indicates the soil nitrogen/phosphorous limitation for microbes; the P-requiring enzyme is represented as ln(BG)/ln(BG + AKP) and the N−requiring enzyme as ln(BG)/ln(BG + LAP + NAG) in the figure. The enzymes are represented by the following abbreviations: BG (β−1,4−glucosidase), NAG (β−1,4−N-acetylglucosaminidase), LAP (L−leucine aminopeptidase), and AKP (alkaline phosphatase). (B) A linear regression analysis was carried out to discern the relationships within the vector length; (C,D) variations in vector length and angle under different treatments within each growth period. (C) Variations in vector angle under different treatments within each growth period; (D) Variations in vector length under different treatments within each growth period. Lowercase letters denote notable differences in irrigation treatments (p < 0.05) within the identical apple growth stage, ascertained through one−way ANOVA and succeeded using Duncan’s multiple range test. The square at the histogram’s base reflects the disparity between having a cover crop and leaving the field bare under identical fertilization treatment for the same time frame. Different colors are used to represent different effects: blue denotes the detrimental effect of the cover crop in comparison to bare ground, gray signifies no substantial difference, and red shows the beneficial effect of the cover crop compared to bare ground.
Agronomy 14 00581 g003
Figure 4. Random forest and Correlation analysis of vector angle and length. The histogram on the left represents the overall explanatory power of soil properties for the angle and length, while the circle represents the importance of individual soil properties. It examines the correlation between the vector angle and length, along with soil properties, under different cover measures. Correlations that are not significant are indicated with uncolored markers; a significant positive correlation is represented by the color red, while a significant negative correlation is represented by the color blue.
Agronomy 14 00581 g004
Figure 5. The conceptual model of the impact of the growth period, covering crops, fertilizer, and soil and microbial properties on the microbial carbon and phosphorus limitations was established using Partial Least Squares Path Modeling (PLS−PM). (A) PLS−PM model of microbial carbon limitations; (B) PLS−PM model of microbial phosphorus limitations Soil: SOC, TN, TP, AP, DOC, N:P, C:P, C:N, SWC. Soil microbial properties: MBC, MBN, MBC/MBN. The red and blue arrows represent significantly positive and negative relationships, respectively (p < 0.05 *,**). Dashed gray arrows indicate non-significant (p > 0.05) relationships. The goodness of fit (GOF) statistic is used to evaluate the model. The figures adjacent to the variables indicate the explained variance (R2), while those next to the arrows are the standardized path coefficients.
Agronomy 14 00581 g005
Table 1. Three-way repeated-measures ANOVAs were used to examine the effects of cover crop treatment, fertilizer treatment, growth period, and their interactive effects on soil physicochemical properties. (Values in the table indicate mean squares, * indicates p < 0.05, ** indicates p < 0.01, *** indicates p < 0.001).
TreatmentFertilizer
(F)
Cover Crop (C)Growth Period (G)F×CF×GC×GF×C×G
df3133939
SOC (g·kg−1)72.31 ***27.06 ***7.50 ***1.53 ***3.24 ***0.95 **1.59 ***
TN (g·kg−1)0.66 ***0.41 ***0.39 ***0.06 ***0.04 ***0.03 ***0.02 ***
TP (g·kg−1)0.19 ***0.13 ***0.010.01 *0.01 **0.01 **0.01
DOC (mg·kg−1)1254.31 ***124.97 ***546.14 ***32.28 ***90.72 ***49.28 ***16.26 ***
DON (mg·kg−1)3894.2 ***3.52618.5 ***3.9904.6 ***86.3 ***25.0 ***
AN (mg·kg−1) 2113.92 ***855.99 ***2239.46 ***58.60 ***418.01 ***554.30 ***69.83 ***
AP (mg·kg−1)1270.76 ***472.15 ***371.16 ***106.50 ***75.59 ***40.36 ***19.21 ***
DOC:DON31.68 ***0.0616.27 ***1.44 ***8.79 ***6.40 ***1.94 ***
C:N6.26 ***0.6214.17 ***0.964.75 ***3.90 ***3.51 ***
C:P10.29 ***0.014.42 ***3.41 **2.39 **2.47 *1.03
N:P0.13 ***0.020.52 ***0.12 ***0.13 ***0.19 ***0.08 ***
Disclaimer/Publisher’s Note: The statements, opinions and data contained in all publications are solely those of the individual author(s) and contributor(s) and not of MDPI and/or the editor(s). MDPI and/or the editor(s) disclaim responsibility for any injury to people or property resulting from any ideas, methods, instructions or products referred to in the content.

