Article

Influence of the Depth of Nitrogen-Phosphorus Fertilizer Placement in Soil on Maize Yielding and Carbon Footprint in the Loess Plateau of China

1
College of Agriculture, Shanxi Agricultural University/Collaborative Innovation Center for High-Quality and Efficient Production of Characteristic Crops on the Loess Plateau Jointly Built by Provinces and Ministries/State Key Laboratory of Sustainable Dryland Agriculture, Taigu 030801, China
2
College of Agronomy/Key Laboratory of Crop Physi-Ecology and Tillage Science in Northwestern Loess Plateau, Ministry of Agriculture and Rural Affairs/The Chinese Institute of Water-Saving Agriculture, Northwest A&F University, Yangling 712100, China
3
Sierra Leone Agricultural Research Institute (SLARI)-Rokupr Agricultural Research Centre (RARC), PMB 1313 Freetown, Sierra Leone
4
Key Laboratory of Low-Carbon Green Agriculture in Northeastern China, Ministry of Agriculture and Rural Affairs PR China/College of Agronomy, Heilongjiang Bayi Agricultural University, Daqing 163000, China
*
Authors to whom correspondence should be addressed.
Agronomy 2024, 14(4), 805; https://doi.org/10.3390/agronomy14040805
Submission received: 19 March 2024 / Revised: 10 April 2024 / Accepted: 11 April 2024 / Published: 12 April 2024
(This article belongs to the Special Issue Improving Fertilizer Use Efficiency - Volume II)

Abstract

:
Deep fertilization is a beneficial approach for reducing nitrogen losses. However, the effects of various fertilization depths on maize (Zea mays L.) productivity and environmental footprints have not been thoroughly understood. Therefore, a field experiment was conducted to investigate the effects of different fertilization depths of 5 cm (D5), 15 cm (D15), 25 cm (D25), and 35 cm (D35) on maize productivity and environmental footprints. Reactive nitrogen (Nr) losses and greenhouse gas (GHG) emissions were assessed using life cycle analysis. We hypothesized that deep fertilization can obtain lower carbon and nitrogen footprint. The results indicated that deep fertilization decreased the N2O and NH3 emissions while increasing the CH4 uptake. Compared with D5, D15 resulted in an increase in total GHG emissions and carbon footprint (CF), whereas D25 decreased by 13.0% and 23.6%, respectively. Compared with D5, the Nr losses under D15, D25, and D35 conditions was reduced by 11.3%, 17.3%, and 21.0%, respectively, and the nitrogen footprint (NF) was reduced by 16.0%, 27.4%, and 19.0%, respectively. The maize yield under D15 and D25 increased by 5.7% and 13.8%, respectively, compared with the D5 treatment, and the net economic benefits of the ecosystem increased by 7.1% and 17.1%, respectively. In summary, applying fertilizer at a depth of 25 cm can significantly reduce the environmental footprints and increase maize productivity, making it an effective fertilization strategy in the Loess Plateau region of China.

1. Introduction

Since the Industrial Revolution, the intensification of human activities has increased greenhouse gases emissions (GHG) and reactive nitrogen losses (Nr), directly or indirectly leading to climate change [1]. To meet food demand, China must produce more grain at the expense of extensive use of chemical fertilizers. The inefficient use of chemical fertilizers in China has led to a nitrogen use efficiency of only 25%, which is far lower than the global levels of 42% and 65% in North America [2]. Therefore, China’s agricultural production contributes significantly to global agricultural greenhouse gas emissions. China is also one of the countries with the most severe carbon emissions and reactive nitrogen losses from agricultural production in the world [3]. The Chinese government has promised to reach peak carbon emissions by 2030 and achieve carbon neutrality by 2060. Therefore, it is of great significance and urgency to formulate effective agricultural management measures to reduce carbon and nitrogen losses and mitigate climate change.
Unreasonable fertilization methods in agricultural systems lead to high carbon and nitrogen emissions, which may cause environmental pollution and exacerbate global climate change [4]. You et al. [5] and Young et al. [6] reported that using efficient nitrogen fertilizer placement strategies can increase grain yield while reducing gaseous nitrogen emissions. In China, the balance between crop production and greenhouse gas emissions and nitrogen losses has become very important. Therefore, there is an urgent need to develop reasonable fertilization methods to reduce carbon emissions and nitrogen losses while improving crop productivity in agricultural systems.
Deep fertilization is considered an effective method to ensure adequate nutrient supply during crop growth through precise fertilization at the roots of crops [7]. Deep fertilization promotes the absorption of soil nutrients by roots and reduces soil nutrient content [8]. It has advantages in improving fertilizer utilization efficiency, reducing greenhouse gas emissions, increasing crop yield, and improving economic benefits [9]. Therefore, it is increasingly accepted and promoted by farmers around the world and has good application prospects [10]. However, the effect of deep fertilization is mainly concentrated in rice fields and is rarely applied in dry lands. In Bangladesh, Gaihre et al. [11] and Islam et al. [12] reported that compared with surface application, deep application of urea can reduce nitrous oxide emissions by 61–84%, increase rice yield by 28%, and improve nitrogen use efficiency by 67%. Liu et al. [13] also showed that compared with surface urea placement, deep urea placement can reduce nitrous oxide emissions by 29–31% and methane emissions by 36–39%, increase rice yield by 21.6%, and increase the net ecosystem economic benefits (NEEBs) by 45%. Deep fertilization increased rape and summer maize yields by 24–55% [14] and 2.94–10.88% [7], respectively. But Ke et al. [15] reported that deep application of urea significantly increased the leaching loss of mineral nitrogen compared to broadcast urea in paddy fields. Previous studies have shown that reducing methane emissions from paddy field or increasing methane uptake in forests [16], grasslands [17], and drylands [18] has high potential for mitigating climate change. However, methane uptake in drylands has not been fully investigated in previous studies. It is unclear whether deep placement can increase methane uptake. In addition, there are few studies that comprehensively evaluate the ecological and economic benefits of different fertilization depths for spring maize production, and the relationship between the two is unclear.
In recent years, carbon footprint (CF) and nitrogen footprint (NF) have attracted much attention in the process of policy formulation in different countries. CF is determined through life cycle analysis (LCA) to quantify greenhouse gas emissions caused by human activities, while NF is used to estimate Nr losses [19,20,21]. The carbon footprint mainly includes carbon emissions from agricultural inputs (such as agricultural machinery, fuel, and pesticides), and carbon emissions from crop production in the form of N2O and CH4 [22]. Greenhouse gas emissions from farmland are mainly related to chemical fertilizer inputs; especially, greenhouse gases generated by nitrogen fertilizers account for 36 to 52% of the total greenhouse gas emissions [23,24,25]. Previous studies have found that greenhouse gas emissions caused by nitrogen application and mechanical fuel in agricultural production in China account for 8–49% and 6–40% of the total agricultural greenhouse gas emissions, respectively [26]. Furthermore, the carbon footprint of crop production in China is much higher than that of the United States, Canada, and India [27]. Nitrogen footprint mainly includes the loss of reactive nitrogen in agricultural machinery, fuel, oil, and pesticides production processes, as well as the loss of reactive nitrogen in the form of N2O emission, ammonia volatilization, nitrate nitrogen, and ammonium nitrogen leaching caused by fertilization in crop production process [3,28,29]. Liu et al. [13] reported that deep placement of urea significantly reduced the carbon footprint from paddy fields using the life cycle analysis. However, the impact of different fertilization depths on the environmental footprints, including the CF and NF of crops and NEEBs in agricultural inputs and crop production, especially in drylands, have not been reported.
Therefore, in this study, we conducted experiments with different fertilization depths on spring maize. We hypothesized that optimizing fertilization depth will affect greenhouse gas emissions and reactive nitrogen losses. Our research objectives are as follows: (i) to reveal the relationship between the GHG emissions, Nr losses, and soil inorganic nitrogen; (ii) to reveal the mechanism of deep fertilizer placement on CF, NF, and NEEB in maize production; (iii) to identify the fertilization depth that will obtain the most suitable ecological and agricultural economic benefits, thereby providing a theoretical reference for developing suitable fertilization strategies for maize.

2. Materials and Methods

2.1. Experimental Site Description

The spring maize field experiment was conducted for two consecutive growing seasons in 2019 and 2020 at the Cao Xin Zhuang experimental site of Northwest A&F University, Shaanxi Province, China. The experimental site has an altitude of 521 m and is situated at longitude 34°17′59″ N and latitude 108°4′12″ E. The annual average temperature, precipitation, soil evaporation, sunshine hours, and frost-free days were 13 °C, 630 mm, 1500 mm, 2463.8 h, and 210 days, respectively, over the previous 20 years. The physical and chemical properties of the soil before the experiment are shown in Table S1. The daily temperature and rainfall during the experimental phases are shown in Figure S1. Due to the high potassium content in the soil at the experimental site, we decided not to use potassium fertilizer during the experiment.

2.2. Experimental Design and Practice Management

The experiment followed a randomized block design with three replicates per treatment, and each plot area was 42 m2 (7 m × 6 m). Four treatments were established with fertilization depths of 5(D5), 15(D15), 25(D25), and 35(D35) cm, respectively. Additionally, a non-fertilization control (CK) was included to assess the efficiency of fertilizer utilization. The amount of fertilization was determined based on the practices of local farmers. We applied 225 kg ha−1 of N (urea, N ≥ 46%, China Oil and Gas Company Limited, Yinchuan, China) and 120 kg ha−1 of P2O5 (superphosphate, P2O5 ≥ 12%,Yuxi Quanjun Fertilizer Industry co., Ltd, Yuxi, China) before sowing.
Before the experiment started, the quantities of nitrogen and phosphate added to each row of plots were determined, and nitrogen fertilizer was mixed with phosphate fertilizer. The “deep strip placement” method was applied to the respective soil depths. Maize seeds were sown at the top of the fertilized band. Prior to the experiment, the experimental field was manually applied with chemical fertilizer at the required depth in a manually ditched band after being deep-loosened (to a depth of 40 cm) with a deep-loosening machine. Maize variety “Zhengdan 958” was planted on 15 April 2019 and again on 4 May 2020 with a flat cropping pattern. Harvesting was carried out on 8 September 2019 and 24 September 2020. In the experimental field, we sowed 75,000 maize seeds per hectare, with two maize seeds in each hole. Next, some plants were pruned while leaving one plant in the V3. The spacing between plants in the same row was 22.2 cm, and the spacing between rows of plants was 60 cm. The experimental field was managed in accordance with local customs, and irrigation was not performed during the maize growth period. After harvesting, we removed the maize straw from the study area, because it can be used as biomass energy for home heating or feed for livestock.

2.3. Biomass, N Uptake, Nitrogen Use Efficiency, and Maize Yield

Three similar maize plants were collected at maize maturity to calculate the total biomass. N concentration in the different plant organs were measured by the H2SO4–H2O2 method, and the nitrogen uptake and use efficiency were calculated. Meanwhile, the maize yield was calculated at maize maturity.

2.4. Measurement Methods

We measured the soil NH3 volatilization, N2O emission, and CH4 uptake with the static box method [30]. The detailed gaseous collection measurement and calculation method was shown in the Supplementary Materials.
The following formulas were used to determine the global warming potential (GWP, g CO2-eq ha−1) and greenhouse gas emission intensity (GHGI, g CO2-eq ha−1) [13], and Figure S2 displays the N2O and CH4 emission flux:
G W P = E N 2 O × 298 + E C H 4 × 25
G H G I = G W P G r a i n   y i e l d
where E N 2 O and E C H 4 are the cumulative emissions of N2O and CH4 in the whole maize growth period, respectively; 298 and 25 are global warming potential (GWP) factors (100 years).

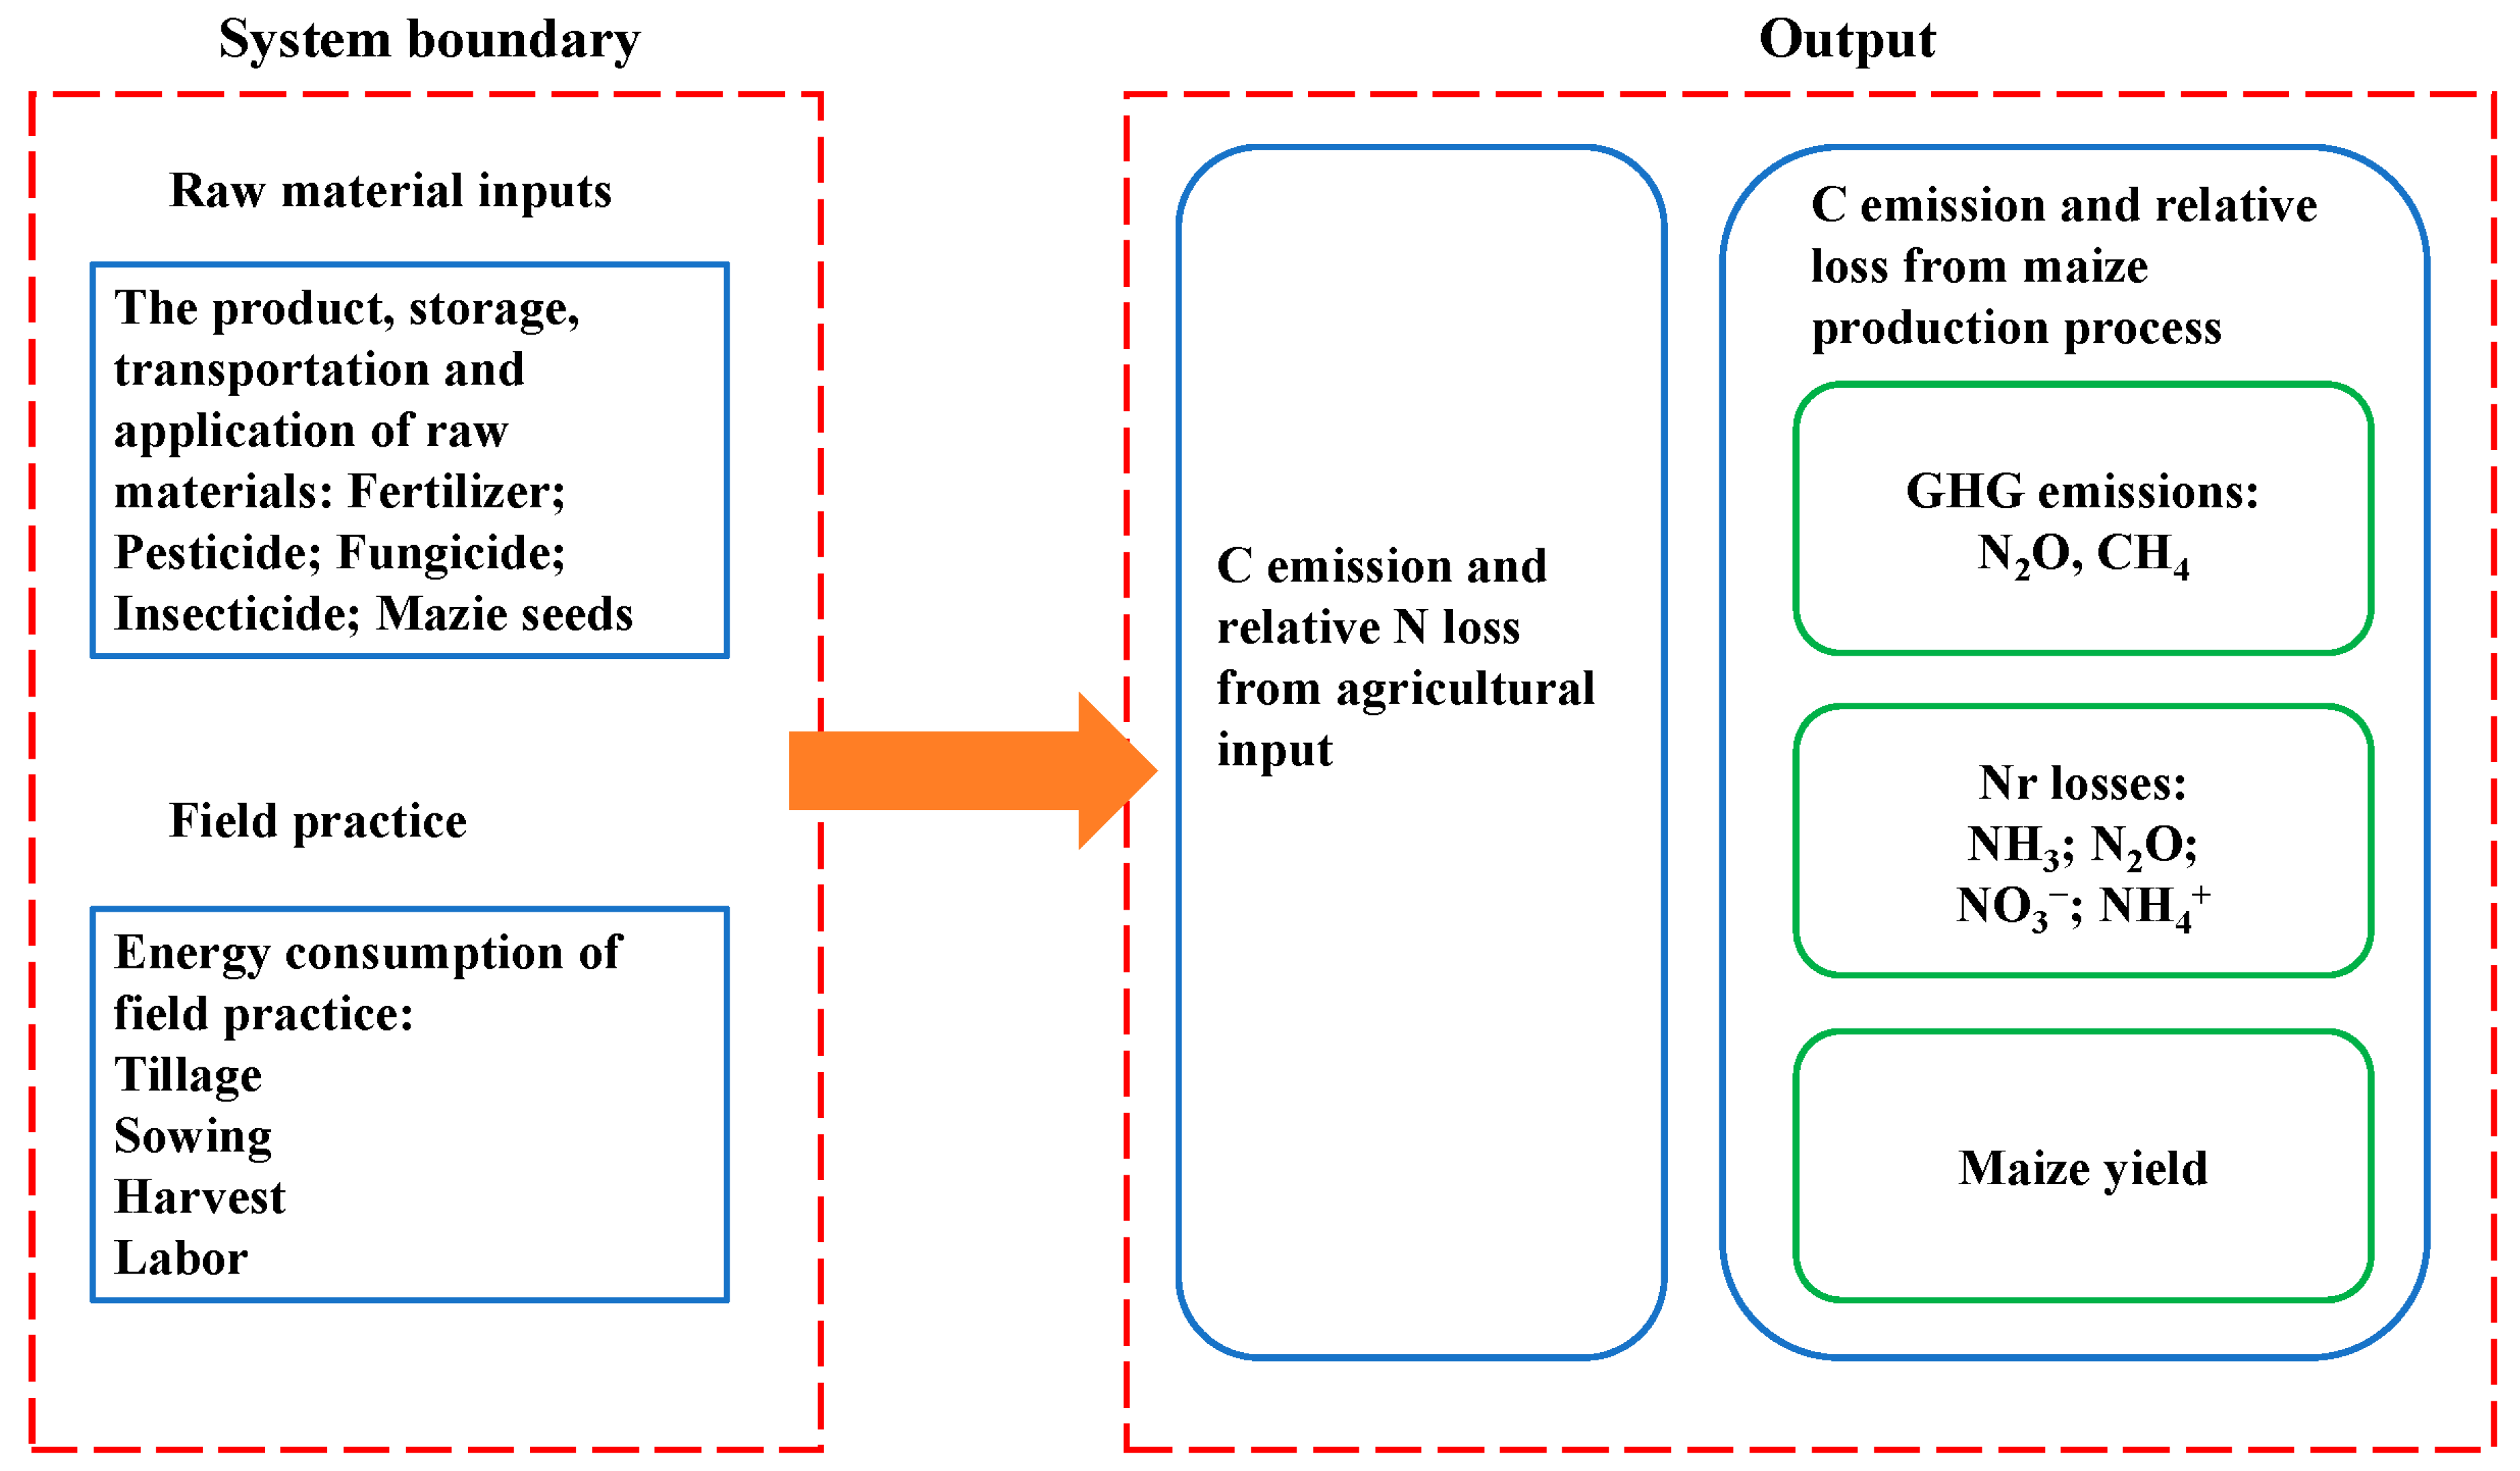
2.5. System Boundaries and Functional Units

The entire spring maize production process served as the study’s definition of the system boundary. The total GHG emissions and total Nr losses in the whole process from the acquisition of the raw agricultural input materials to the spring maize harvest were calculated using the life cycle method as CO2-eq and N-eq, respectively (Figure 1). The GHG emissions and Nr loss coefficient for the raw agricultural input materials are shown in Table 1.

2.6. Measurement of Carbon Footprint and Nitrogen Footprint

The GHG emissions from agricultural inputs include the emissions from production, transfer, and use of raw materials, and the fuel used in mechanical operations [13]. CF was calculated using the following formulae [13]:
T o t a l   G H G   e m i s s i o n s = E i n p u t + E N 2 O × 298 + E C H 4 × 25
E i n p u t = A i × F i
C F = T o t a l   G H G   e m i s s i o n G r a i n   y i e l d
where E i n p u t denotes the GHG emissions from agricultural inputs; E N 2 O and E C H 4 are the cumulative emissions of N2O and CH4 in the whole maize growth period, respectively; 298 and 25 are global warming potential (GWP) factors (100 years), A i represents the quantity of each agricultural input, F i represents the GHG emission factor for each agricultural input [13], and CF is the average for the whole maize growth periods in 2019 and 2020.
The Nr for agricultural inputs includes the losses from raw materials during production and transportation, due to diesel usage in mechanical operations. The main environmental effect of plant nutrients such as NO3 and NH4+ is the eutrophication of water bodies, while N2O is mainly the greenhouse effect, and NH3 and other NOX can directly affect the respiratory health of people. Furthermore, the weight of active nitrogen was determined according to different research purposes. Eutrophication potential was used to evaluate the impact of eutrophication on the loss of Nr to the environment during the whole maize growth period [25]. The following formulas were used to determine NF [25], and Figure S2 depicts the NH3 volatilization flux:
T o t a l   N r   l o s s e s = N E i n p u t + N V N H 3 + N E N 2 O + N L N O 3 + N L N H 4 +
N E i n p u t = l n × N n
N F = T o t a l   N r   l o s s e s G r a i n   y i e l d
N V N H 3 = T o t a l   N H 3 × 0.833 × 1000
N E N 2 O = T o t a l   N 2 O × 0.476 × 1000
N L N O 3 = N × σ × 62 14 × 0.238 × 1000
N L N H 4 + = N × γ × 18 14 × 0.786 × 1000
where N E i n p u t denotes the Nr losses from agricultural inputs, l n denotes the amount of various agricultural inputs, N n is the loss factor for Nr from various agricultural inputs; N V N H 3 , N E N 2 O , N L N O 3 , and N L N H 4 + are the Nr losses in the whole crop growth period, where N is the amount of nitrogen applied; σ and γ represent the leaching coefficients for NO3 and NH4+ in the maize growth process, i.e., 0.226 and 0.175, respectively [32]; 62 14 and 18 14 are the molecular weight ratios for NO3 and NH4+; and 0.833, 0.476, 0.238, and 0.786 are the potential eutrophication factors for NH3, N2O, NO3, and NH4+ [19,29,31].

2.7. Measurement of Net Ecosystem Economic Benefits (NEEBs) and per NEEB

The formulae were used to calculate the NEEBs and per NEEB were as following [13]:
N E E B = G r a i n   y i e l d   c o s t s A g r i c u l t u r a l   a c t i v i t y   c o s t s G W P   c o s t s
G H G   e m i s s i o n   p e r   N E E B = T o t a l   G H G   e m i s s i o n s N E E B
N r   l o s s   p e r   N E E B = T o t a l   N r   l o s s e s N E E B
In this study, the price of maize was treated as 1.8 CNY kg−1, and the GWP cost was the carbon transaction cost (103 CNY ha−1 CO2-eq) (1$ = 6.54 CNY).

2.8. Statistical Analyses

From a Chinese Life Cycle Database [31], the coefficients for reactive nitrogen losses and greenhouse gas emissions were determined. The mean values for the following variables were recorded between 2019 and 2020: total greenhouse gas emissions, total reactive nitrogen loss, carbon and nitrogen footprint, and net ecosystem benefits. With SPSS 19.0 for Windows (SPSS, Inc., Chicago, IL, USA), analysis of variance was performed to examine the results. Using the least significant difference test (p = 0.05) (n = 3), multiple comparisons between various treatments were carried out. The OriginLab 2020 (Northampton, Massachusetts, USA) produced all of the graphs. In order to ascertain whether there was a significant relationship between cumulative CH4 emission, N2O emission, NH3 volatilization and biomass, maize yield, N absorption, and nitrogen usage efficiency, we performed linear regression analysis to examine the data in 2019 and 2020. In Figure S3, information on the soil’s NO3−N and NH4+−N content is displayed. The data from 2019 and 2020 were analyzed using exponential and linear regression techniques to see whether there were any significant correlations between soil NO3−N, NH4+−N content, NH3 volatilization flow, CH4 absorption flux, and N2O emission flux.

3. Results

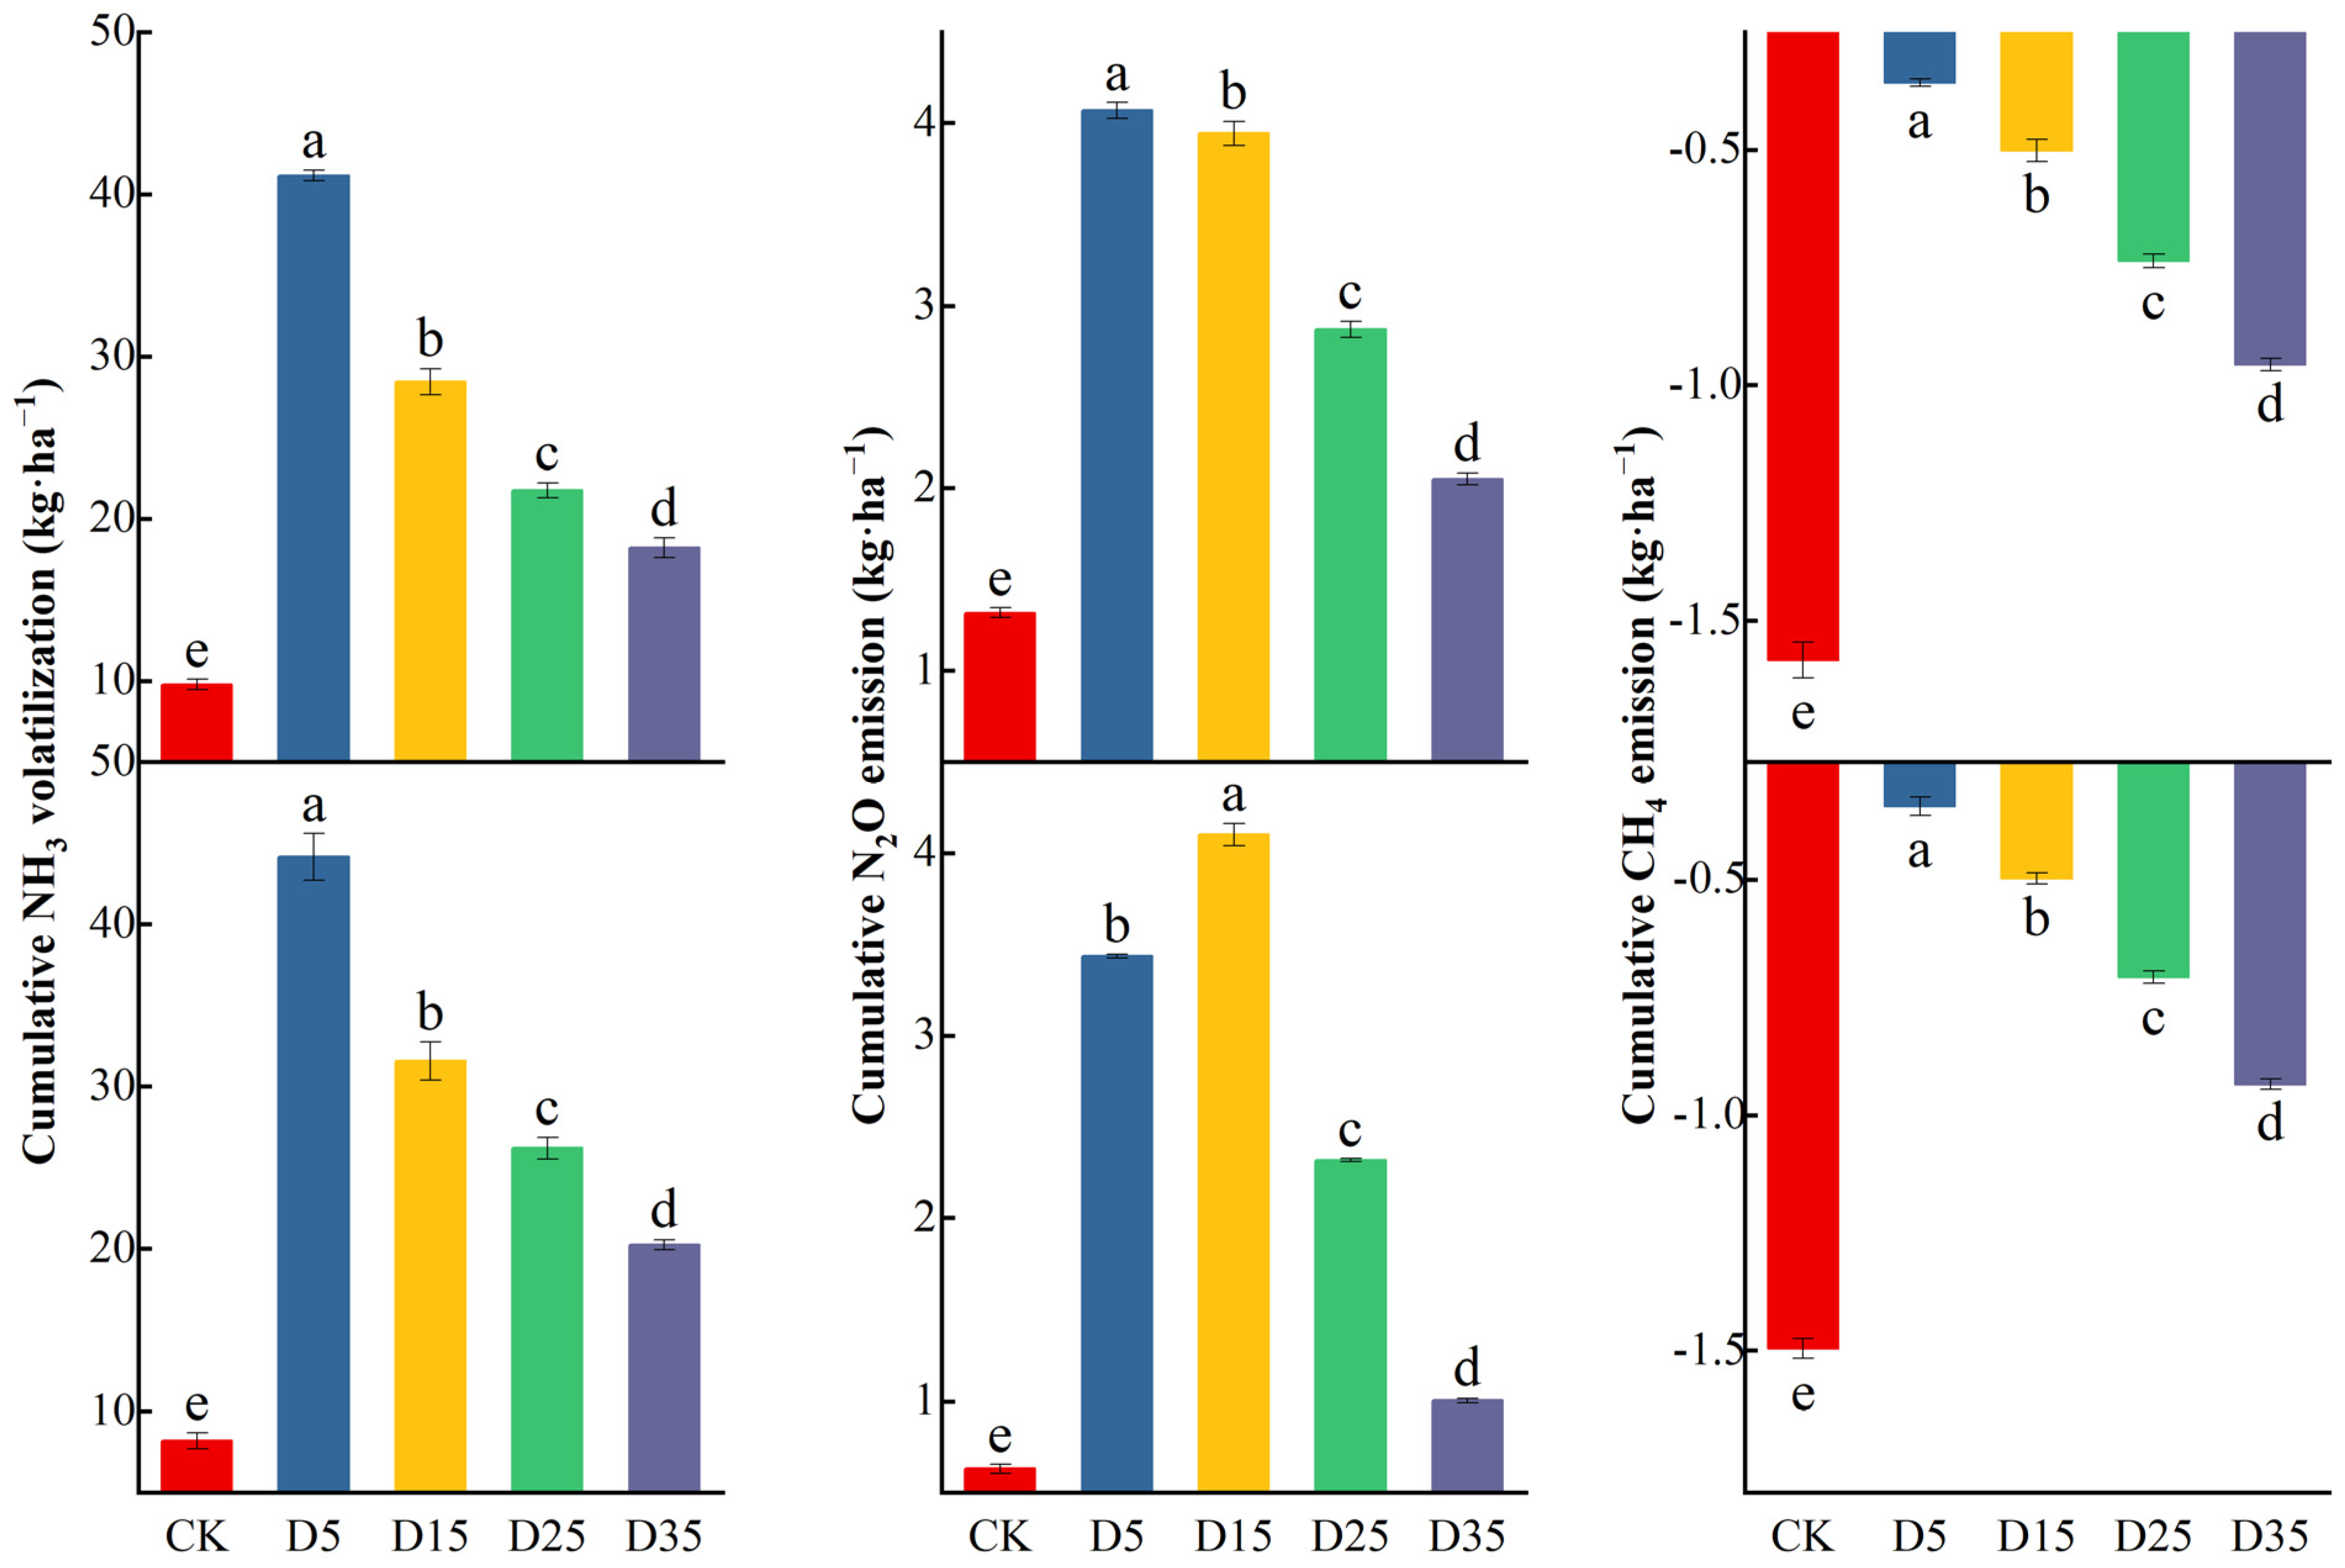
3.1. Gaseous Nitrogen Emissions

Deep fertilization significantly affected the NH3 volatilization, N2O emission, and CH4 uptake during 2019–2020 (Figure 2). Increasing fertilization depth reduced the accumulate volatilization of NH3 and enhanced the accumulate absorption of CH4. According to the mean value during 2019–2020, compared with D5, D15, D25, and D35, it significantly decreased total NH3 emission amount by 29.69%, 43.82%, and 54.95% and increased total CH4 uptake amount by 42.35%, 105.63%, and 169.13%. Significant reductions in total N2O emissions were observed at deeper fertilization depths. Compared with D5, reductions of 30.84% and 59.29% were achieved at D25 and D35, respectively. However, at a shallow fertilization depth, the stability of N2O emission reduction due to deep application of nitrogen and phosphorus fertilizer was not consistent. While a significant reduction in N2O emissions was observed at D15 compared to D5 in 2019, an increase in N2O emissions was noted in the 2020 experiment.

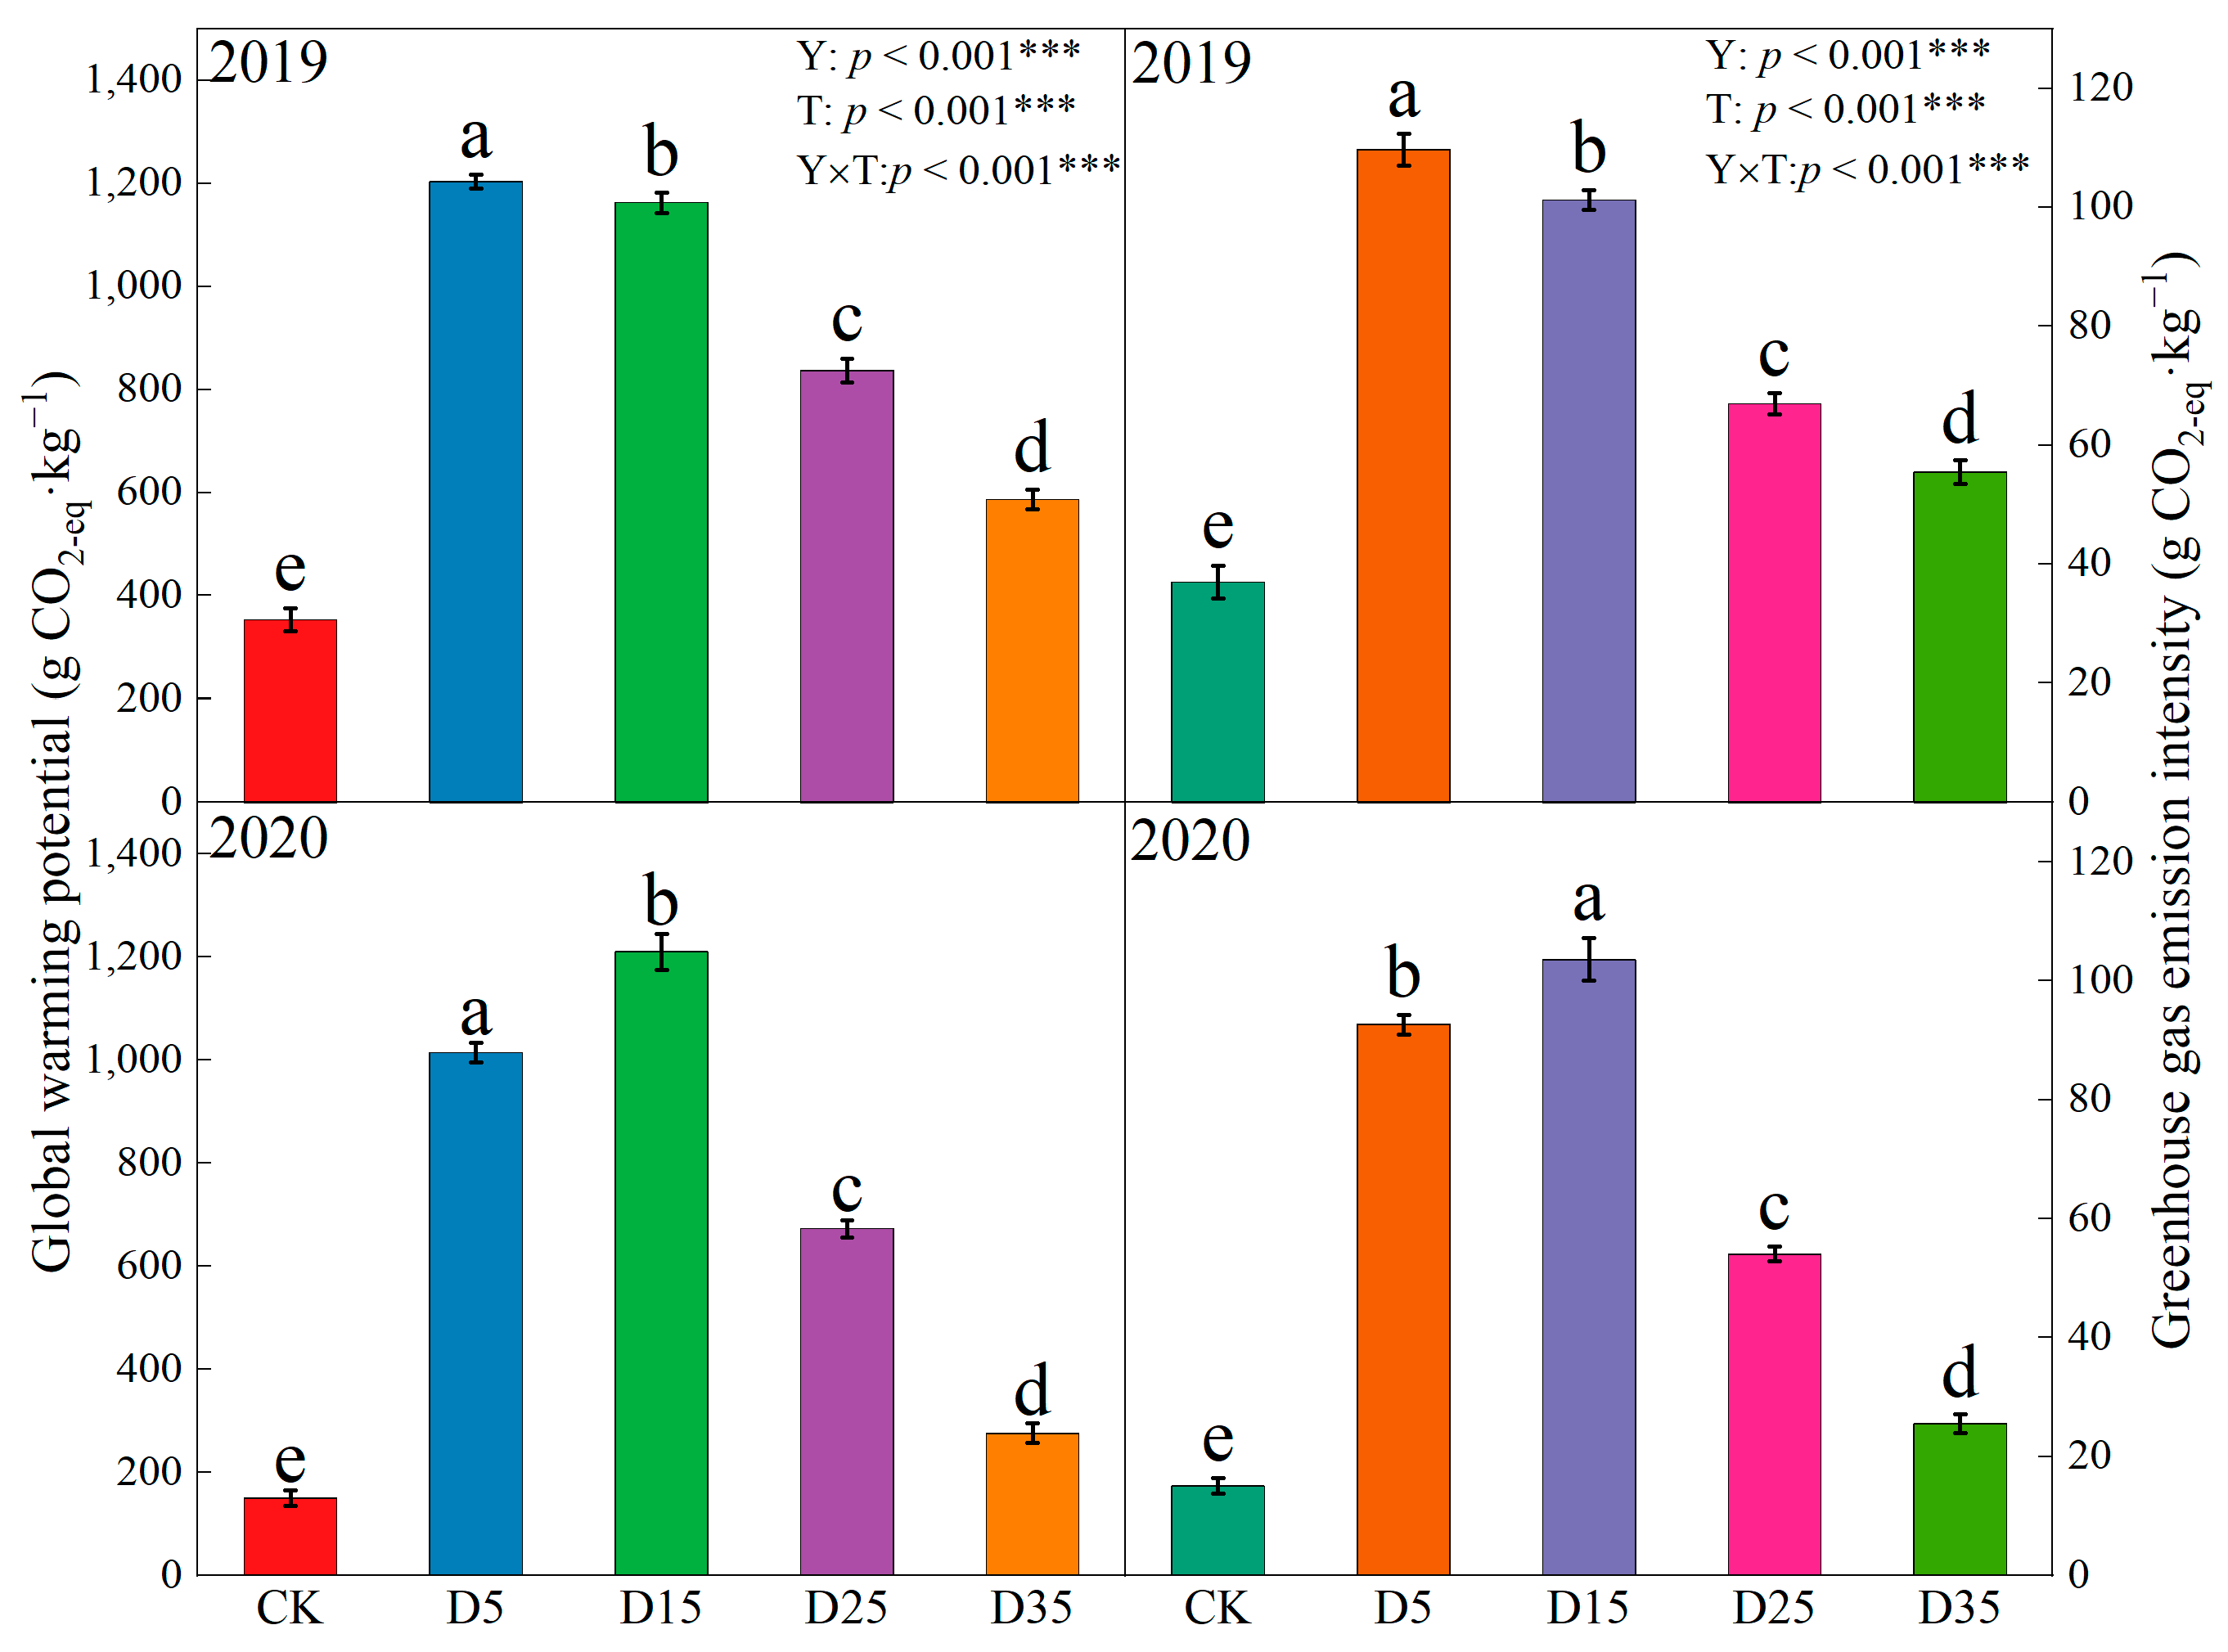
3.2. Global Warming Potential and Greenhouse Gas Emission Intensity

Fertilization depth, experimental years, and interaction effects all had a substantial impact on GWP and GHGI (Figure 3). In comparison to D5, deep fertilization (D25 and D35) significantly lowered the GWP and GHGI. D35 and D25 similarly reduced the GWP and GHGI by 61.10% and 59.98%, respectively, while D15 increased by 6.96% and 1.21%. Between yields of maize, GWP, and GHGI, there was a clear negative correlation (Figure 4).

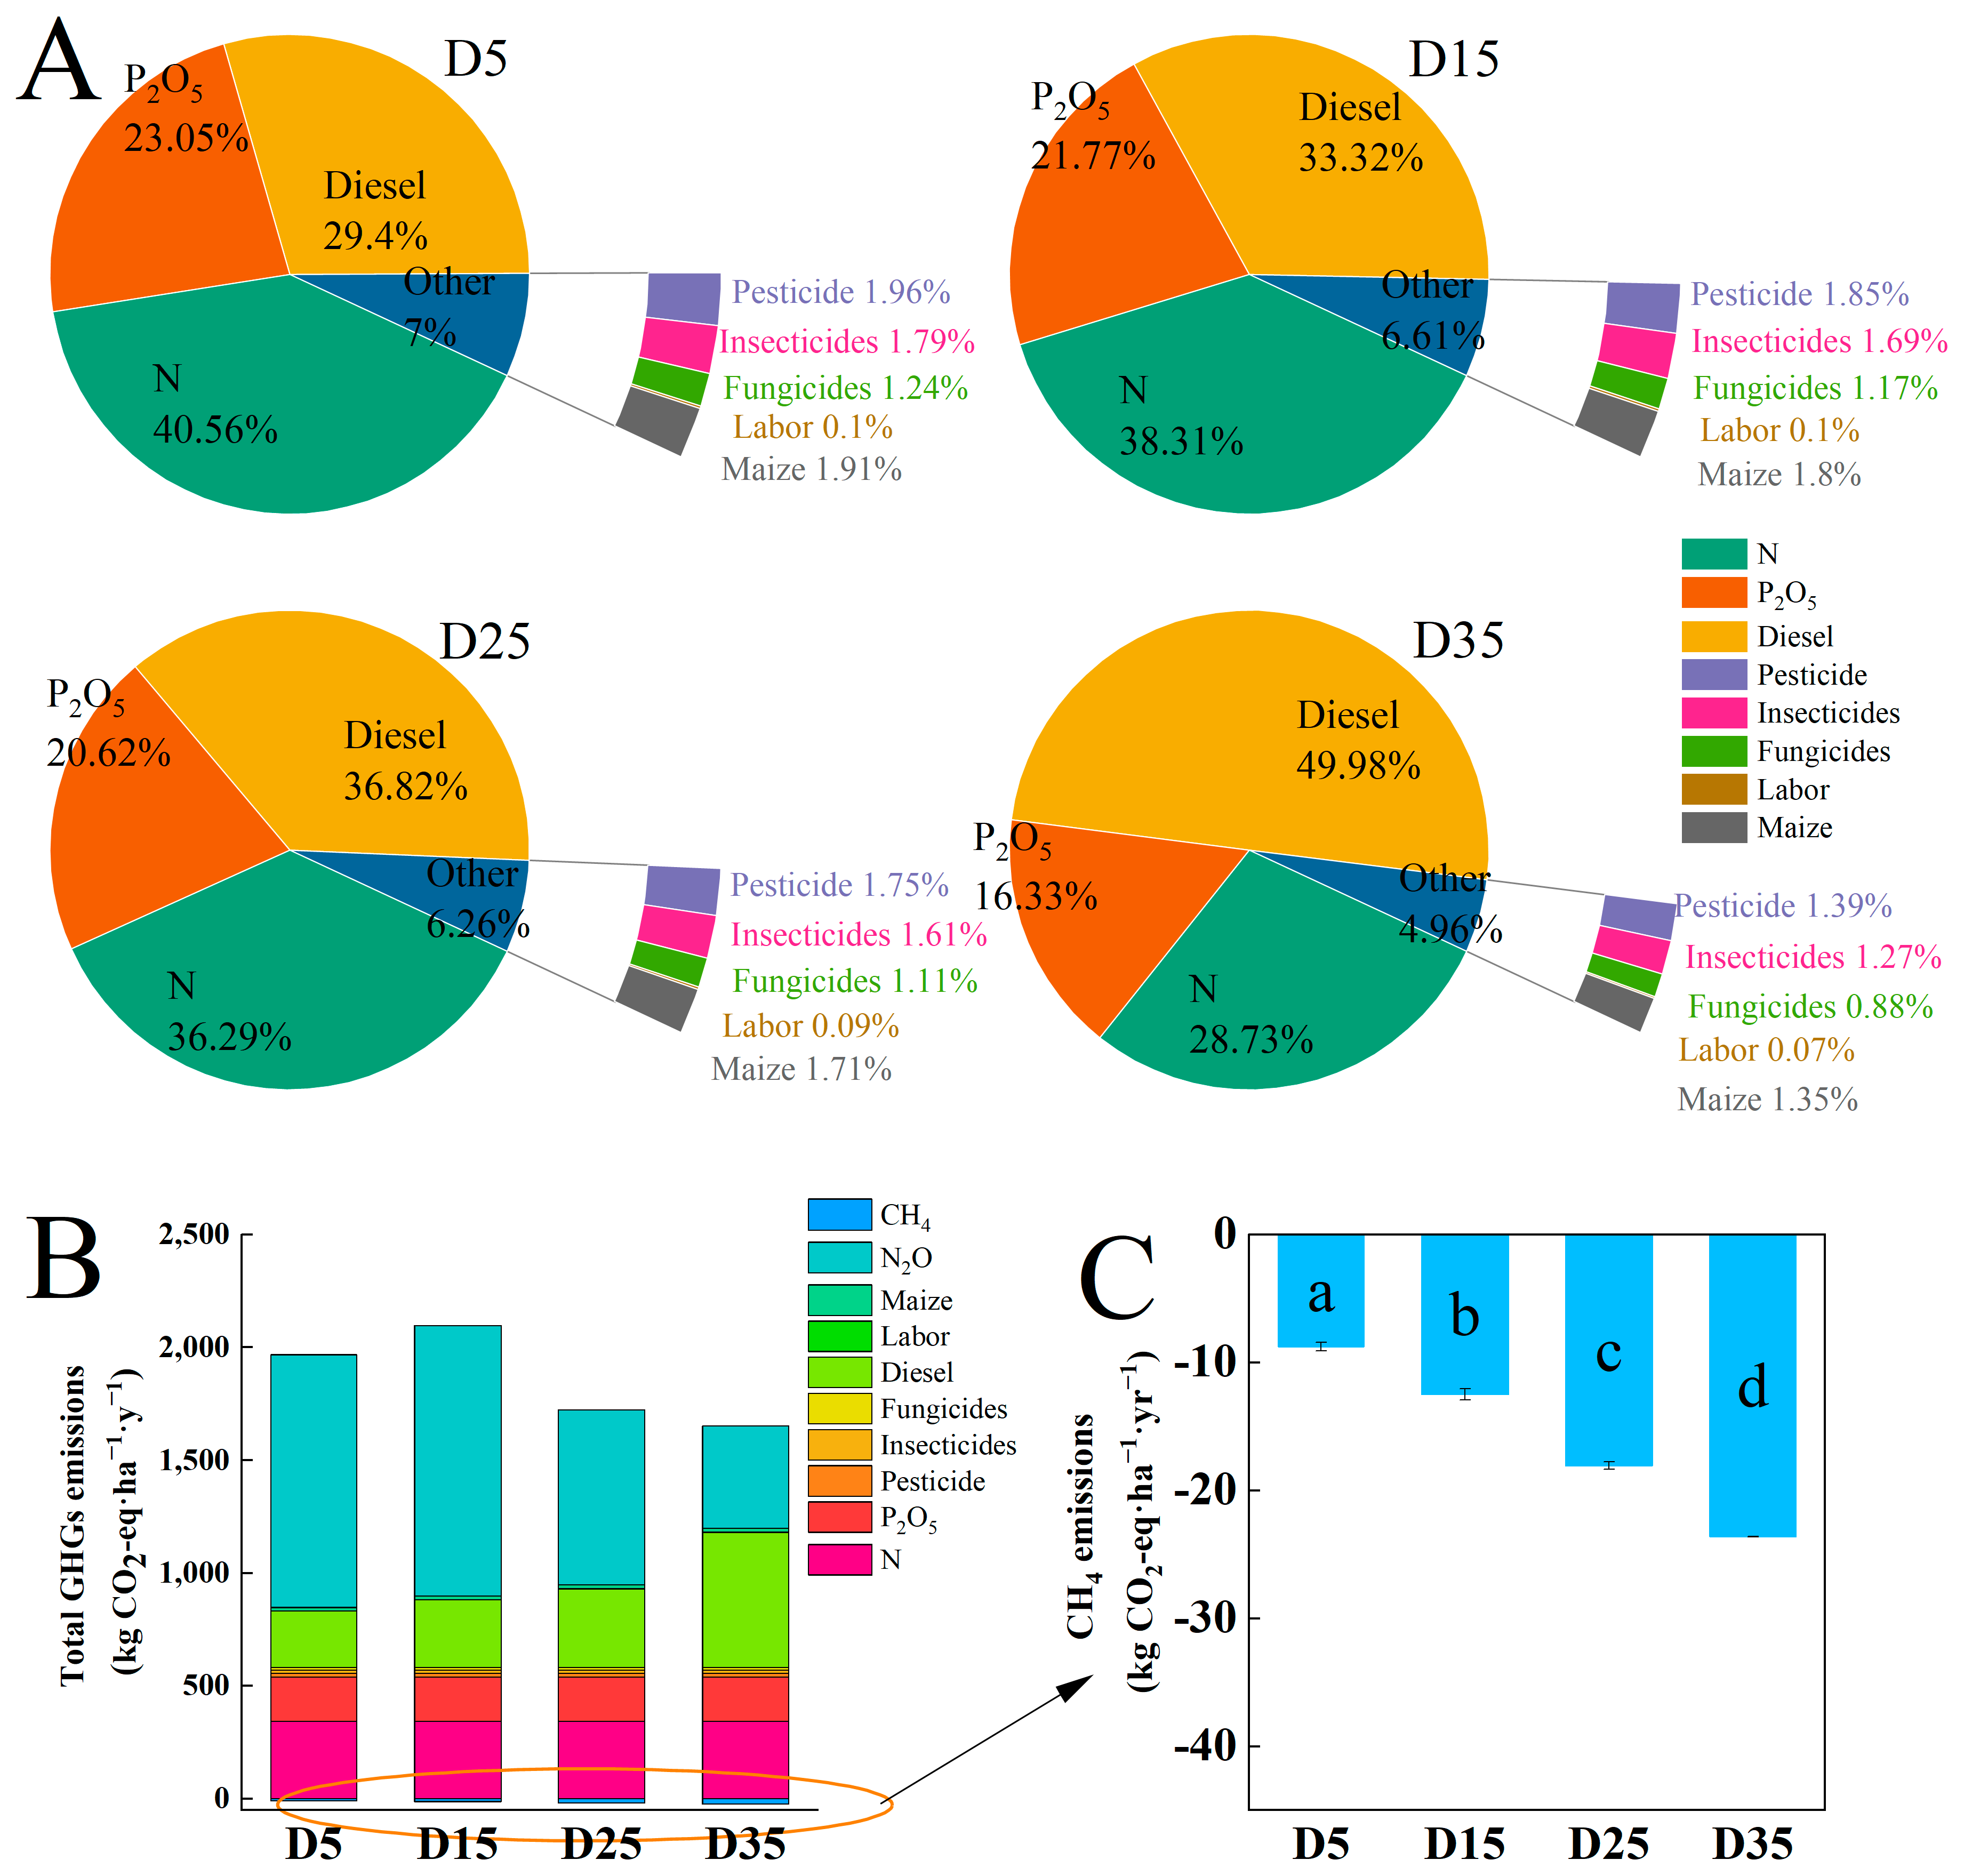
3.3. Greenhouse Gas Emissions from Maize Field and Agricultural Inputs

The total greenhouse gas emissions from agricultural inputs increased as fertilization depth increased, as indicated in Table 2 and Figure 5 (249.5–598.8 kg CO2-eq ha−1). Under D15, D25, and D35, the total GHG emissions from agricultural inputs rose by 5.9%, 11.8%, and 41.2%, respectively, compared to D5. Fertilizer (N and P2O5) was the main source of greenhouse gas emissions, accounting for 63.6%, 60.1%, 56.9%, and 45.06% of the total greenhouse gas emissions from agricultural inputs, under D5, D15, D25, and D35, and diesel was the second second-highest source with 29.4%, 33.3%, 36.8%, and 50.0%. The contribution of the diesel increased with the increase in the fertilization depth.
According to Figure 5 (p < 0.05), there were significant differences in the overall GHG emissions across the various fertilization depths treatments. Under D5, D15, D25, and D35, the total GHG emissions were 2207.5, 2384.5, 2102.9, and 2278.2 kg CO2-eq ha−1, respectively. The total emissions of greenhouse gases increased under D15 by 6.49%, while they considerably decreased under D25 and D35 compared to D5 by 13.00% and 16.78% (p < 0.05). As fertilization depth increased so did the contributions of agricultural inputs to overall greenhouse gas emissions; the contribution under D35 was 73.52%. Under D5, D15, and D25, N2O accounted for the majority of the emissions of all GHGs. But under D35, the majority of the GHG emissions came from diesel.

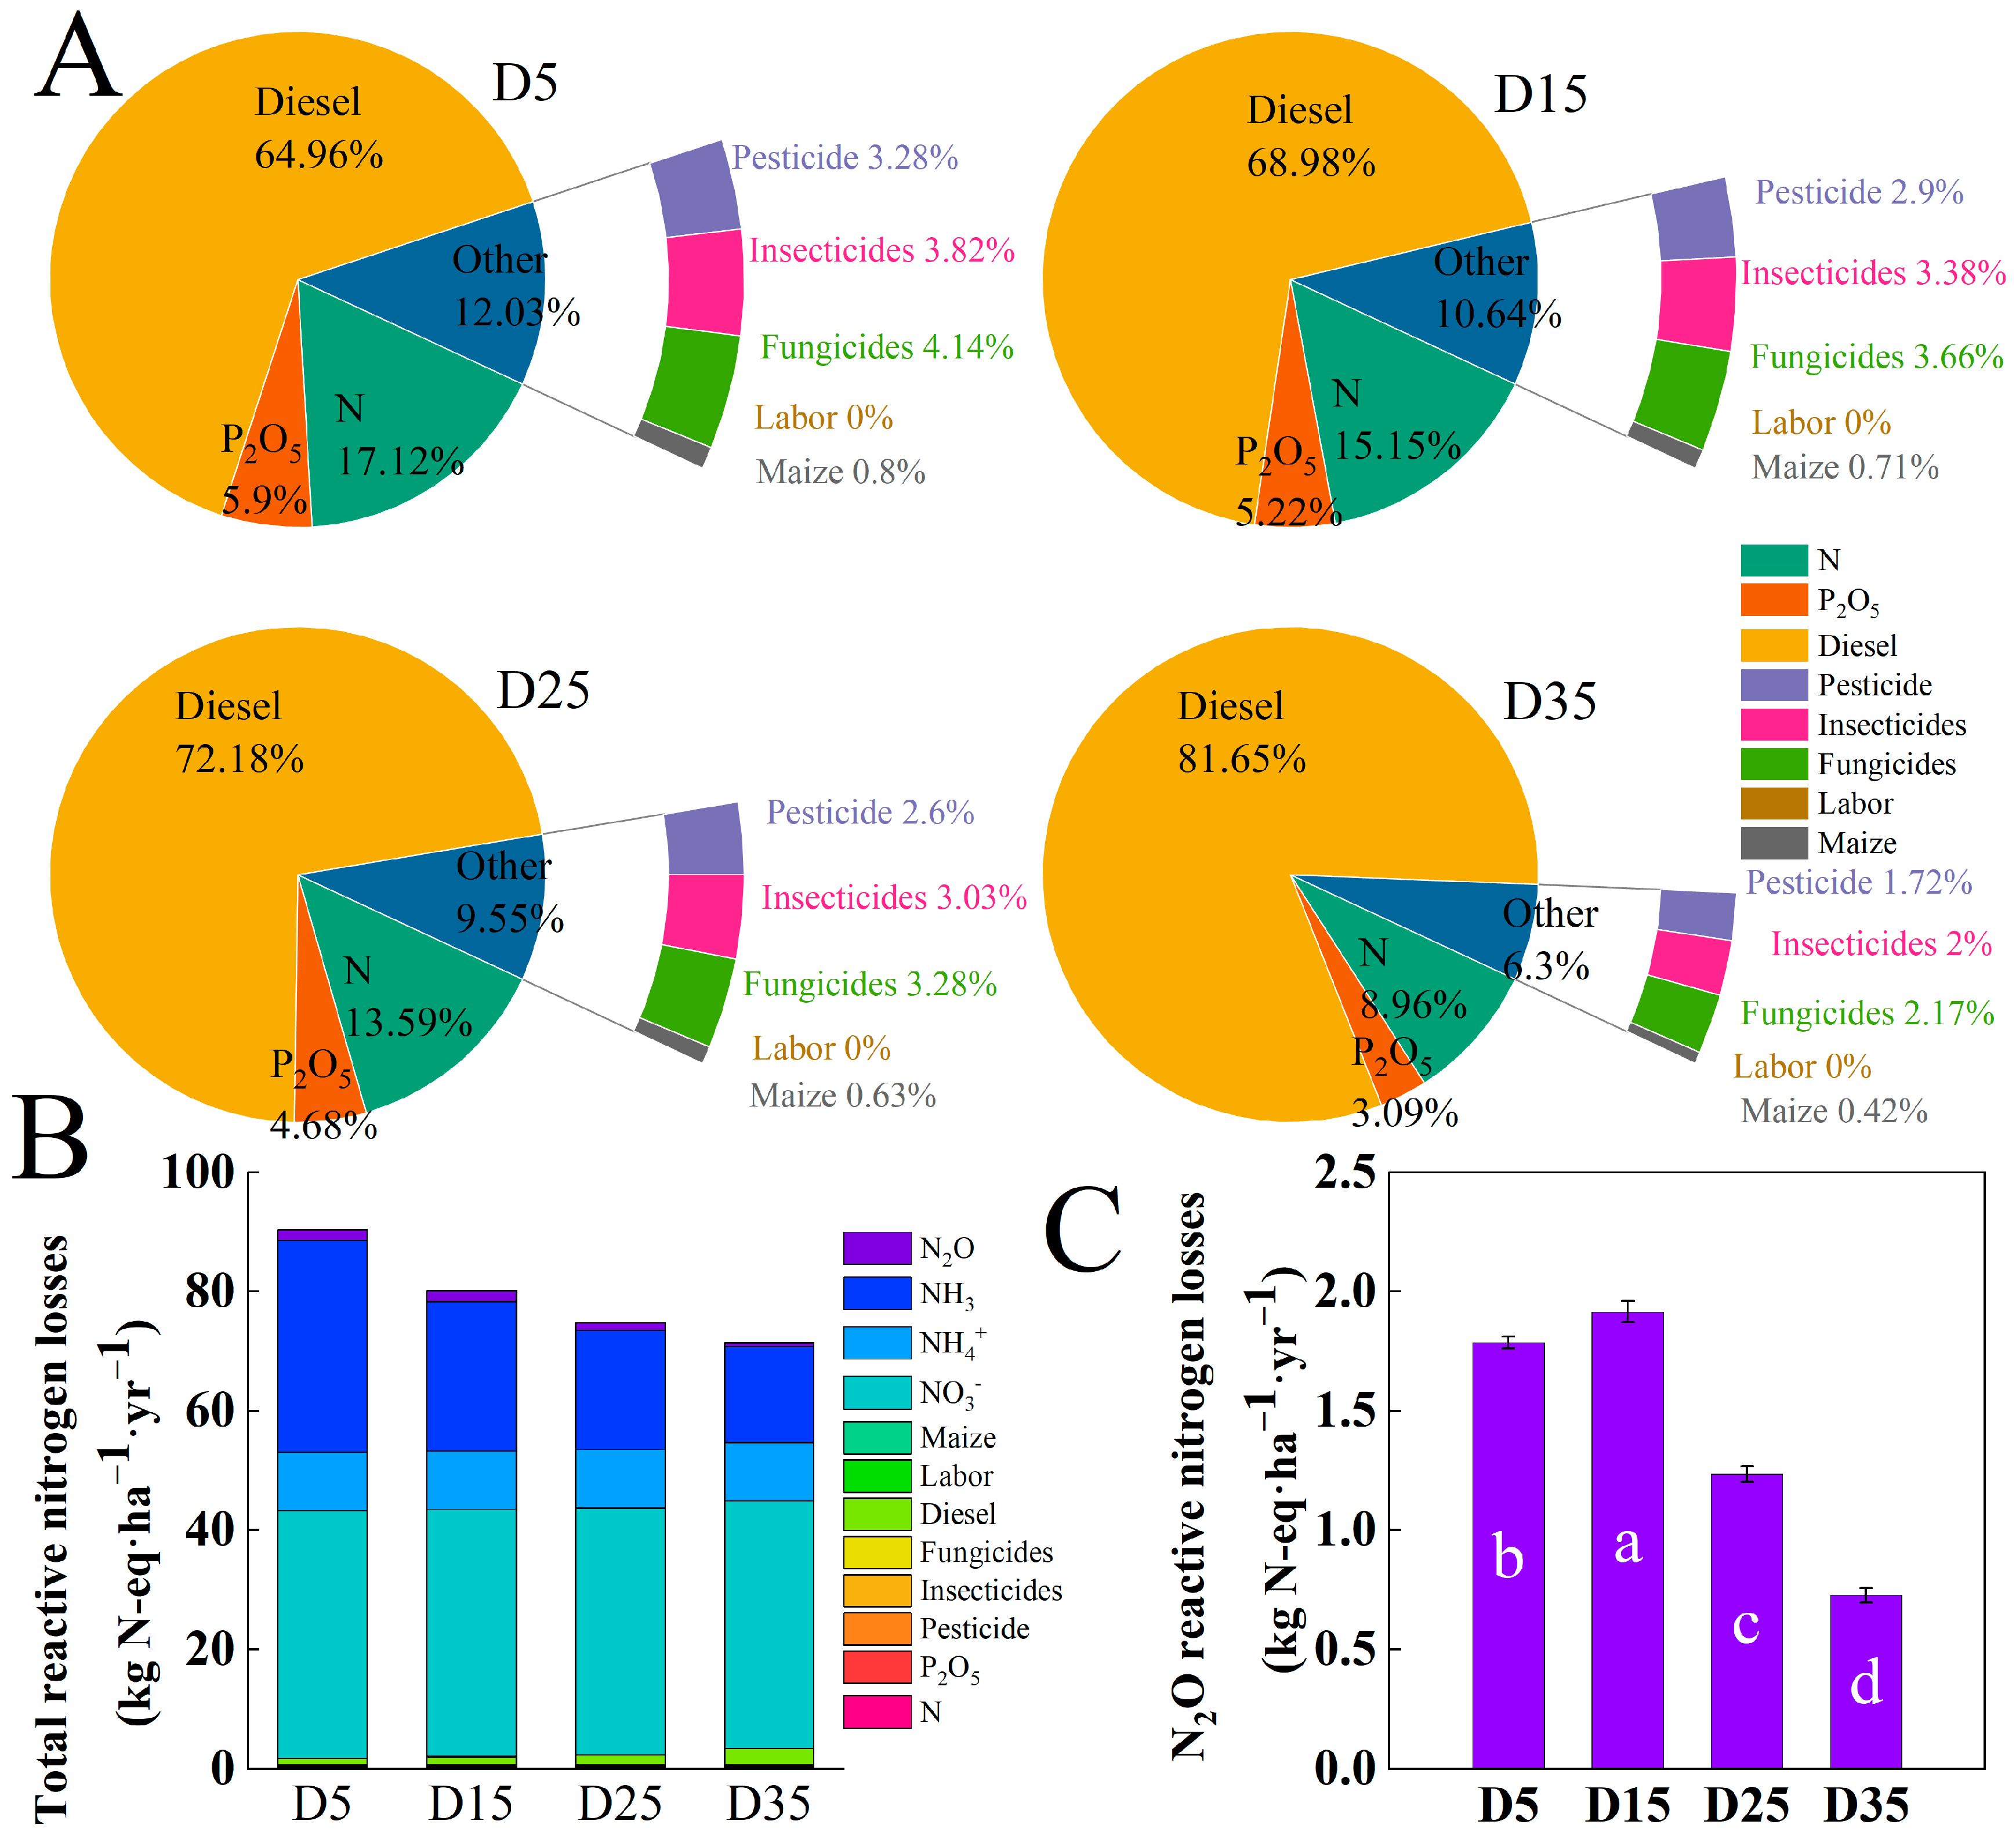
3.4. Nr Losses from Maize Field and Agricultural Inputs

The reactive nitrogen losses increased as the depth of fertilization increased, as indicated in Table 3 and Figure 6. The Nr losses from the agricultural inputs under D15, D25, and D35 rose by 13.0%, 26.0%, and 91.0%, respectively, in comparison to D5 (1.8 kg N-eq ha−1). Diesel use was the major cause of nitrogen loss for agricultural inputs (65.0–81.7%), followed by fertilizer (11.0–23.0%).
According to Figure 6 (p < 0.05), the total Nr losses considerably decreased as fertilization depth increased. The Nr losses under D15, D25, and D35 substantially decreased by 11.3%, 17.3%, and 21.0% (p < 0.05), respectively, compared to D5 (90.20 kg N-eq ha−1). As the fertilization depth increased the Nr losses brought on by ammonia volatilization and nitrous oxide emissions reduced. In comparison to D5, the ammonia-volatilization-related Nr losses decreased under D25 and D35 by 43.82% and 54.95%, respectively (p < 0.05), and the nitrous-oxide-emissions-related Nr losses decreased by 30.84% and 59.29% (p < 0.05). When compared to D5, the Nr losses under D15 caused by ammonia volatilization decreased by 29.69%, but those caused by nitrous oxide emission increased by 7.23%. The primary and second-highest contributors of the overall Nr losses were NO3−N leaching and NH3 volatilization. Under D5, D15, D25, and D35, the contributions of the Nr losses from agricultural inputs to the total Nr losses were 2.0%, 2.5%, 3.0%, and 4.8%, respectively.

3.5. Carbon and Nitrogen Footprints and Net Ecosystem Economic Benefits

In Figure 7, CF and NF are depicted. When compared to the other treatments, the CF under D15 was higher (0.18 kg CO2-eq kg−1 grain; p < 0.05). The CF under D25 and D35 dropped by 23.6% and 14.7% when compared to D5 (0.18 kg CO2-eq kg−1 grain). NF under D15, D25, and D35 dropped by 16.0%, 27.4%, and 19.0%, respectively, compared to D5 (8.64 g N-eq kg−1 grain) (p < 0.05).
NEEB was considerably impacted by fertilization depth (p < 0.05) (Figure 7). NEEB grew 7.1% and 17.2% under D15 and D25 (p < 0.05), respectively, compared to D5 (13408.1 CNY ha−1), but dropped by 10.4% under D35 (p < 0.05). The variations in GHG emissions as measured by NEEB were comparable to those in CF. The Nr loss per NEEB was reduced by 25.8% and 7.1% under D25 and D35 (p < 0.05) compared to D5 (0.15 kg CO2-eq CNY−1), respectively. The Nr loss per NEEB under D15, D25, and D35 considerably decreased by 17.2%, 29.4%, and 11.8%, respectively, when compared to D5 (6.71 g N-eq CNY−1).

3.6. Maize Productivity

The average maize yields increased by 5.68% under D15 and by 13.83% under D25, respectively, in comparison to D5 (Table 4). The mean biomass and N uptake under D25 was higher by 12.65% and 17.41% than D5 and high by 6.06% and 8.07% under D15. D35 obtained lower biomass, maize yield, and N uptake than D5 in 2019 and 2020. D25 obtained the highest NUE in 2019 and 2020, i.e., 43.28% and 43.64%, followed by D15. However, D35 had the lowest NUE during 2019 (30.94%) and 2020 (28.53%).

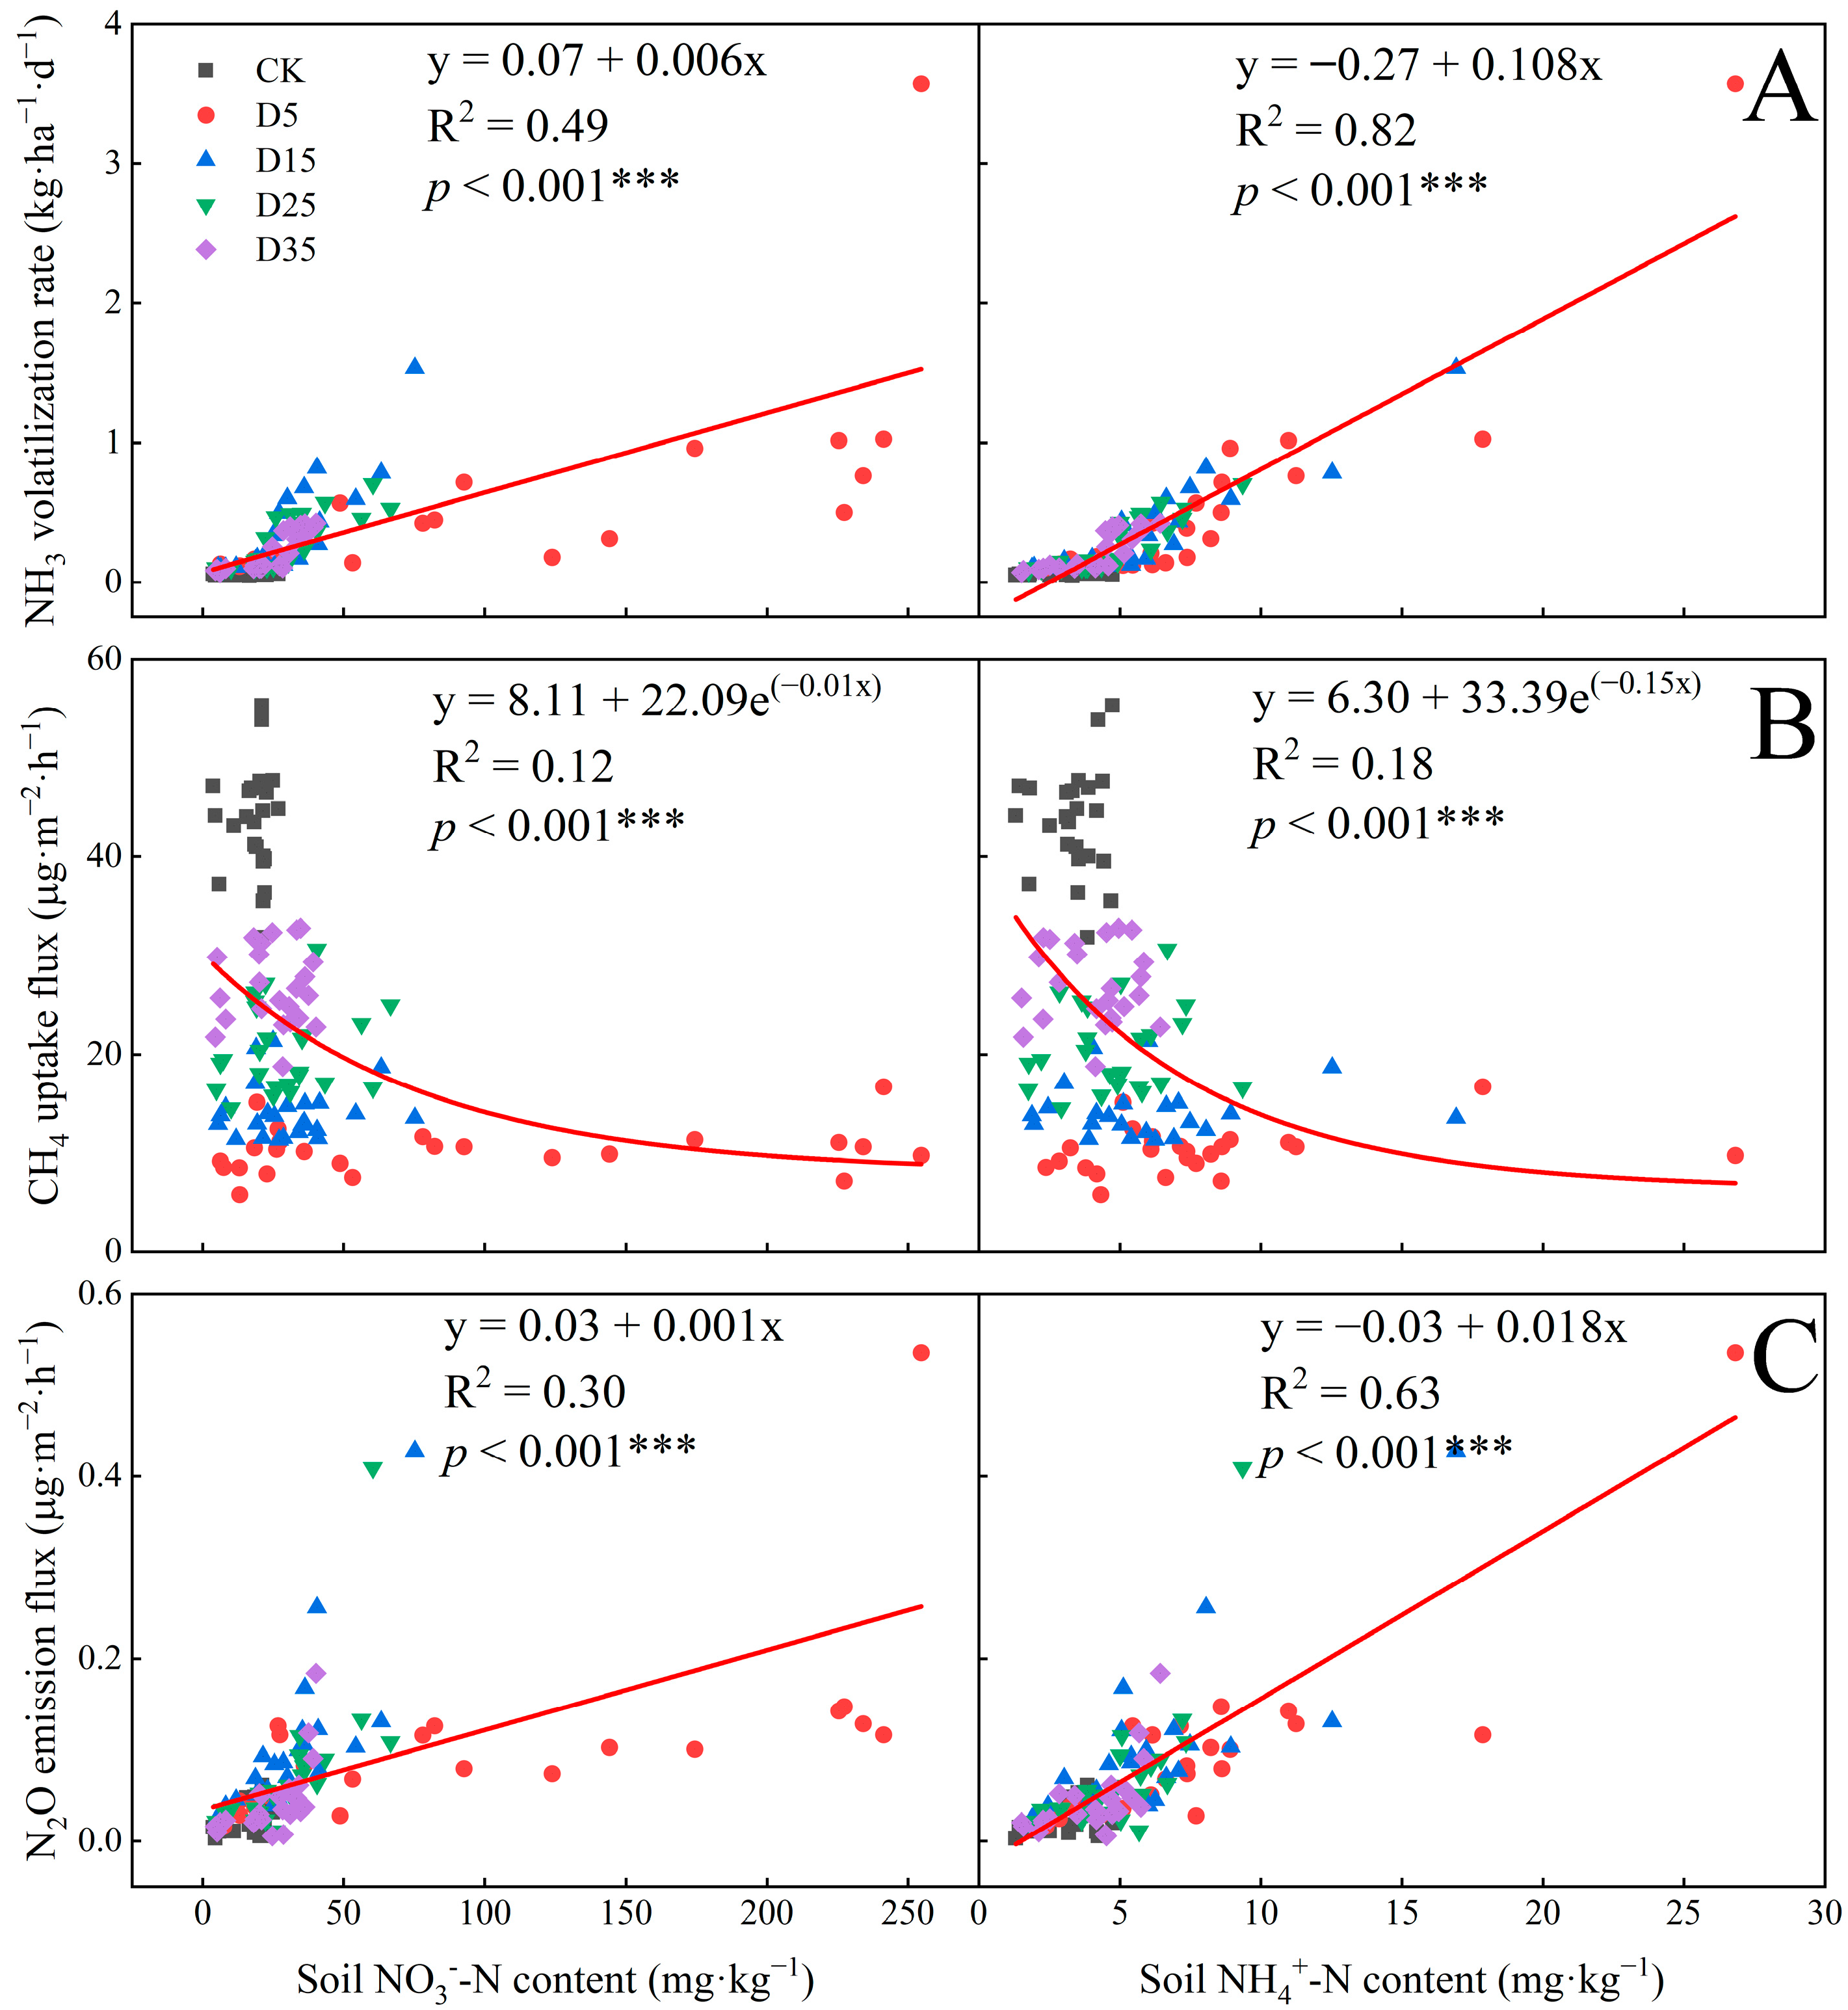
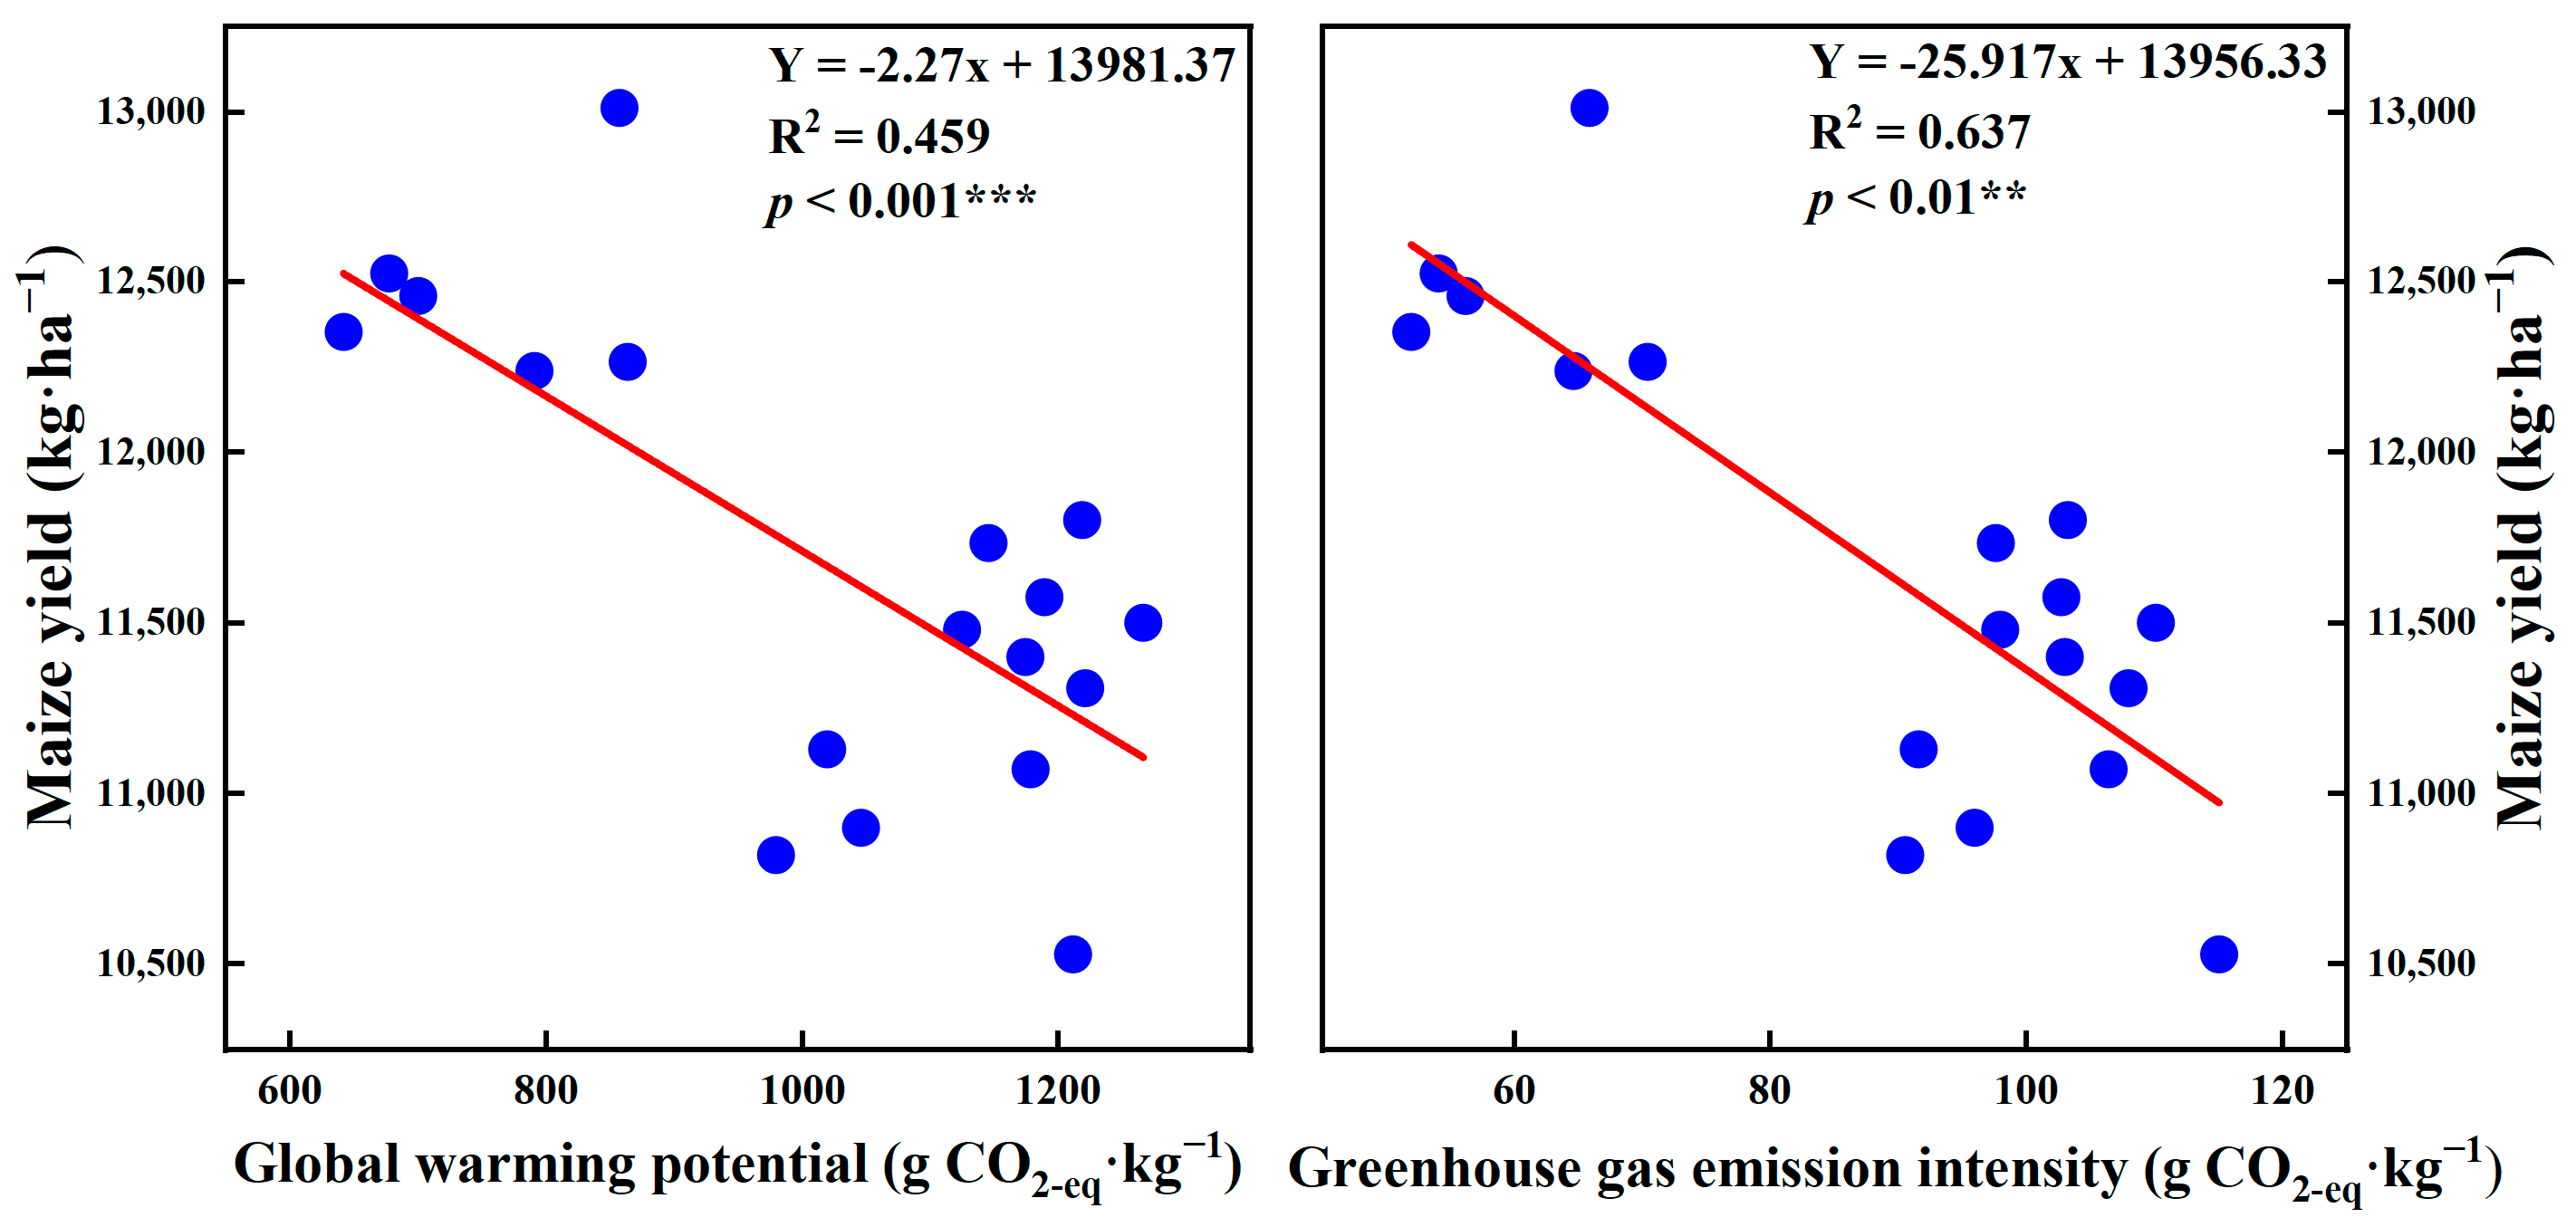
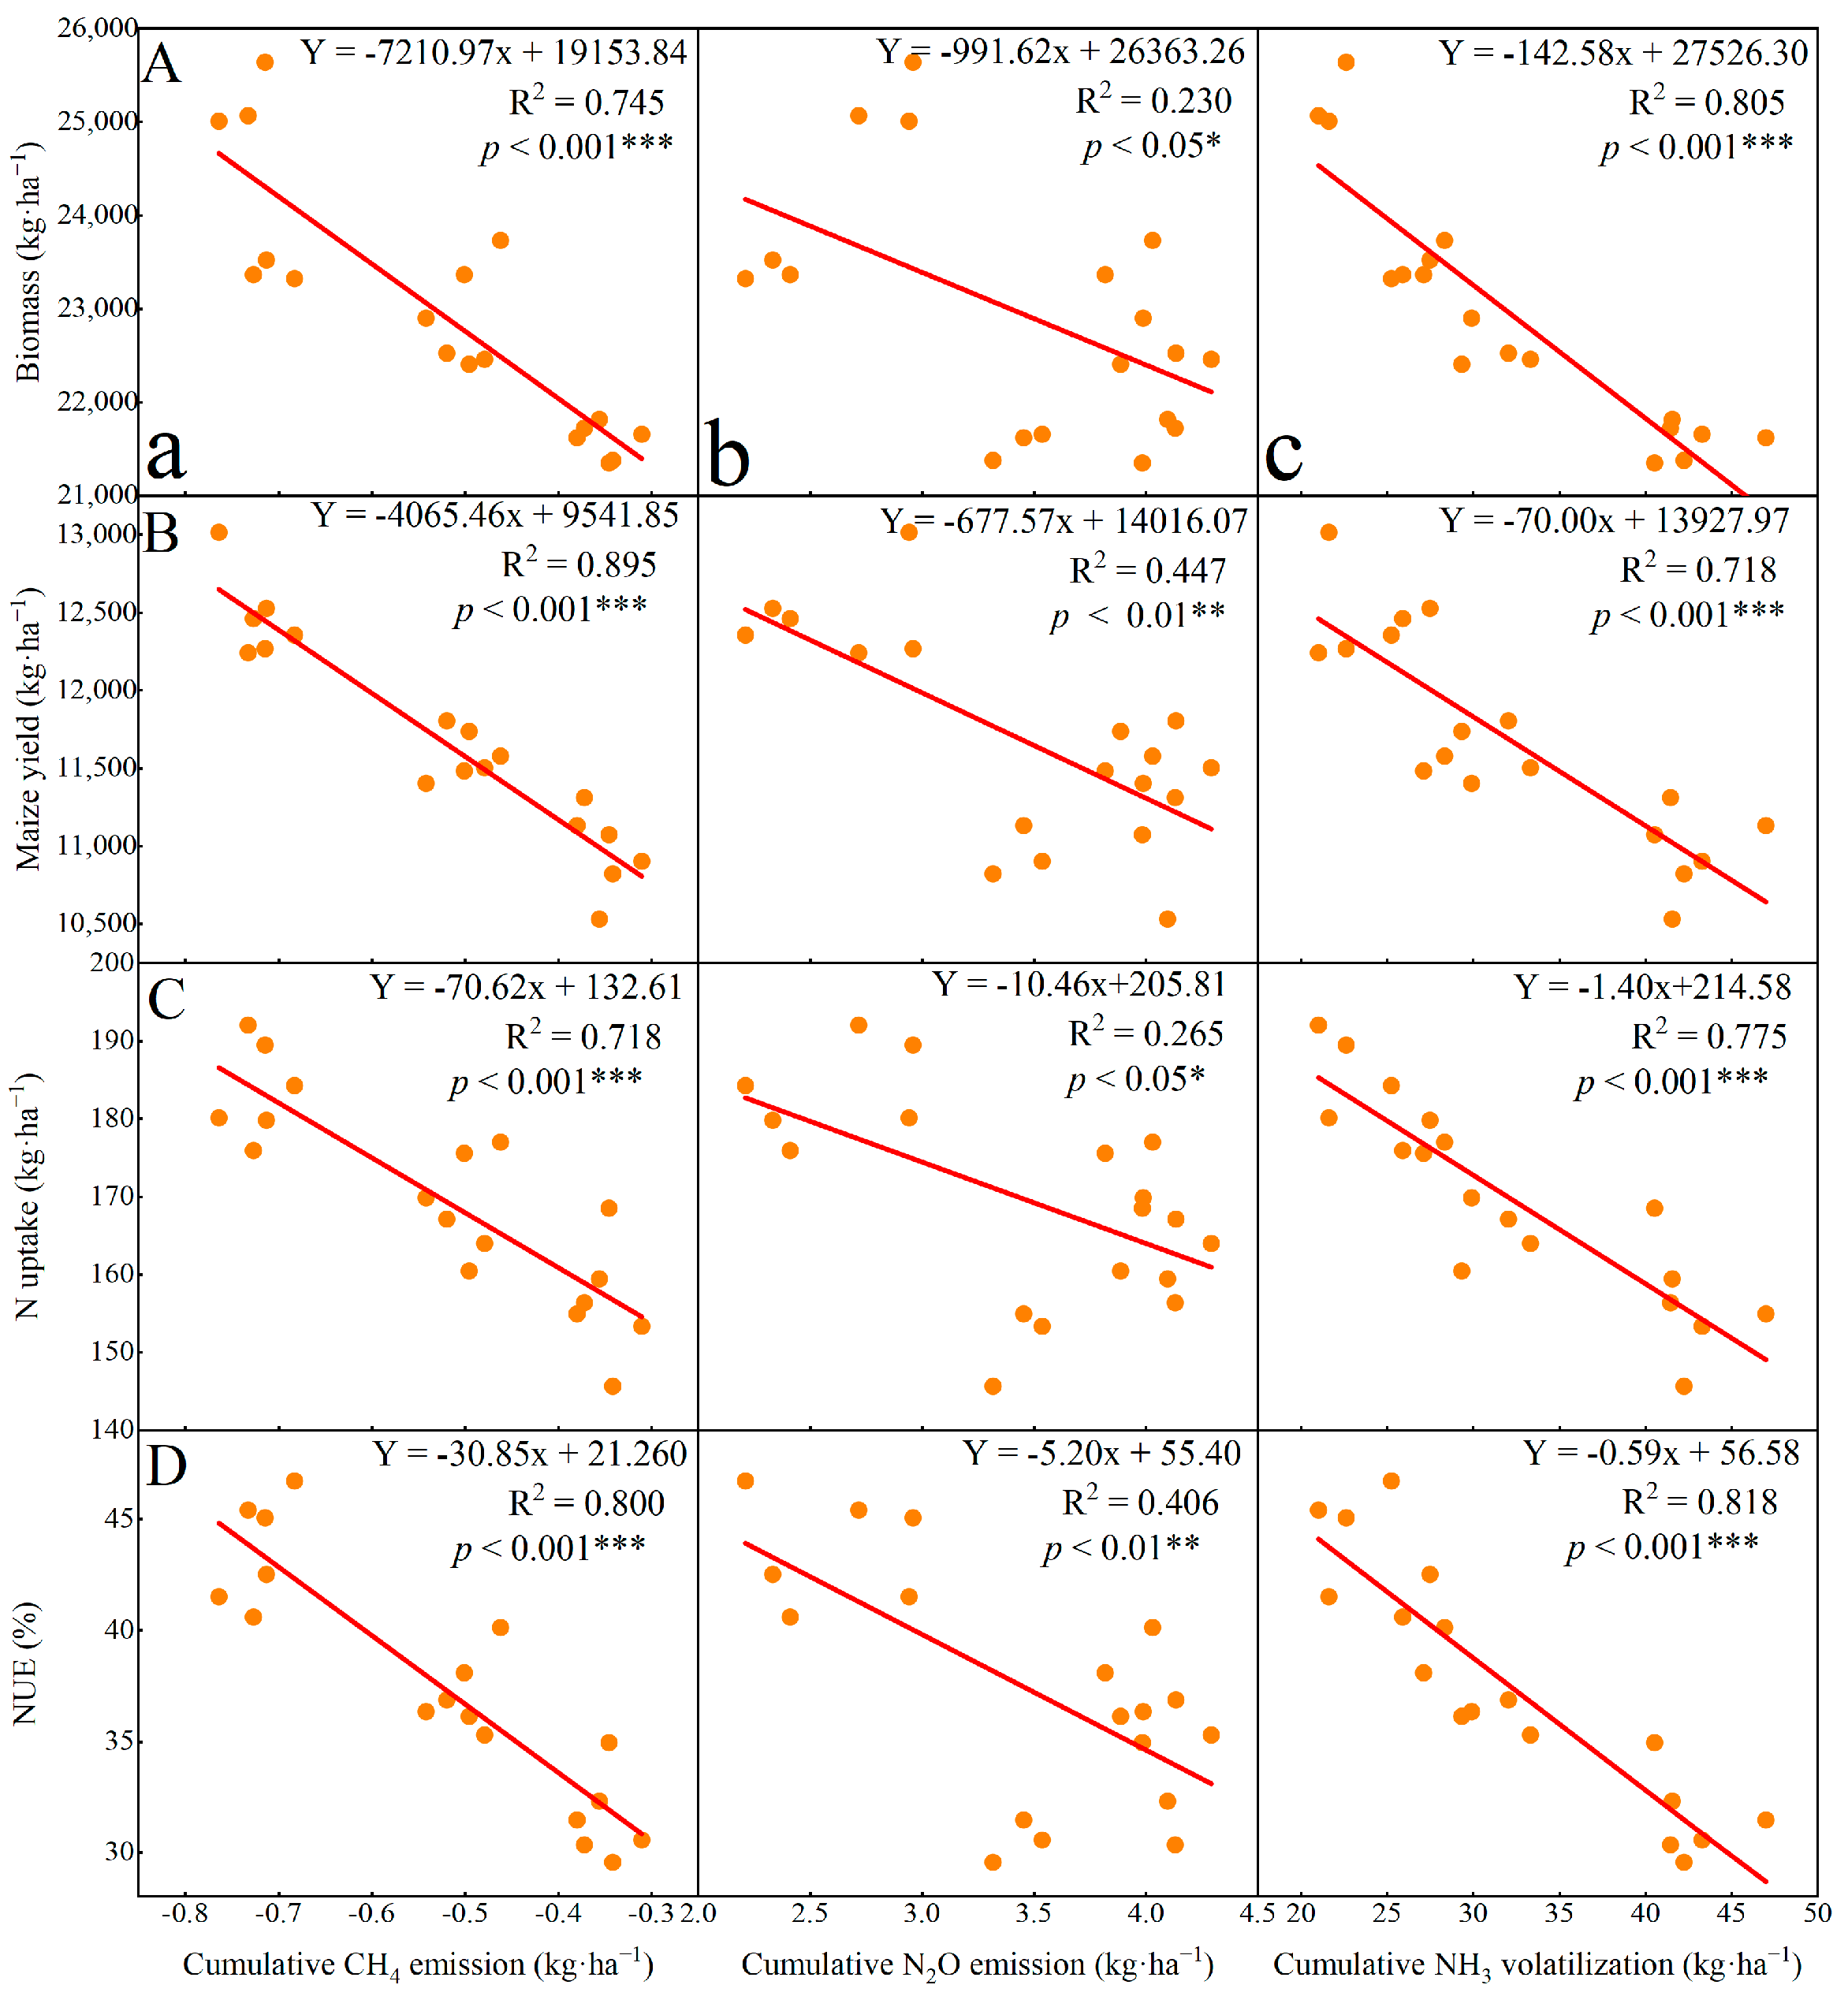
3.7. Relationship between Maize Productivity and Greenhouse Emission and Ammonia Volatilization

Methane emission and biomass, maize yield, N intake, and NUE all showed a substantial negative connection (Figure 8). The relationships between ammonia volatilization or nitrous oxide emission and maize productivity were likewise shown to be negative.

4. Discussion

4.1. Deep Fertilization Enhanced Soil CH4 Uptake and Decreased Gaseous N Emission

Dryland soils are generally considered to be methane sinks, while paddy fields are sources of methane [13,33]. During the growth period of maize, fertilization improves the soil’s ability to absorb methane, and it increases with the depth of fertilization, but the absorption rate is always lower than that without fertilization. Previous studies reported that deep application of nitrogen fertilizer significantly reduced methane emissions during the growth period of rice [13]. Similarly, deep fertilization significantly increased methane absorption rate in this study. Increasing fertilization depth can reduce methane emissions or increase methane absorption because of the following two reasons. (1) Higher NH4+−N and NO3−N concentrations in the soil will inhibit the soil’s absorption of methane. NH4+−N has a molecular structure similar to CH4, and methanotrophs can co-oxidize NH4+. Excessive ammonium ions may compete with CH4 molecules, thereby reducing the oxidation and absorption of methane in soil [34]. After deep fertilization, the distribution of NH4+−N and NO3−N in the soil changed, and the contents of NH4+−N and NO3−N in shallow soil reduced [9], while the shallow soil was the main area of methane absorption [18]. (2) Plant root exudates can affect the methane absorption process, and methanotrophs show greater methane oxidation capacity in the rhizosphere [35]. After deep fertilization, the nutrients concentration of deep soil increased, which can adjust the vertical distribution of roots, increase the proportion of roots in deep soil [36], improve rhizosphere oxygen utilization, increase soil methane oxidation levels, consume methane, reduce methane emissions, or promote methane absorption [18]. A previous study on forests has also shown that methane oxidation capacity increases with vegetation maturity [37]. However, according to Adviento-Borbe and Linquist [38], more nitrogen may cause methane emissions to rise, while fertilization depth had no impact on either methane emissions or absorption, possibly because the experimental crop tested was rice. Long-term soil flooding during rice production reduces the availability of oxygen to the roots, and thus, methane production is not related to the position where nitrogen is applied.
According to our study, deep fertilization greatly reduced gaseous N emission, which is in line with earlier findings [9]. The key factor controlling the generation of N2O and NH3 was the soil available N content. Deep fertilization transfers soil available nitrogen from the surface soil layer to the deep soil layer, reducing the NO3-N and NH4+−N contents of the surface soil, while the humidity and aeration of the deep soil reduces N2O production [39]. In addition, the temperature of the deep soil is lower than that of the surface soil, but the temperature decrease is smaller, which can reduce N2O emissions [40] and NH3 volatilization [41]. In addition to soil factors, D25 had the highest yield and biomass, while the increase in aboveground biomass and leaf area reduced the intensity of sunlight and air flow, thereby reducing NH3 volatilization [42]. After deep fertilization, N2O and NH3 emissions were finally reduced under the influence of multiple factors. Second, deep fertilization applies fertilizer into the root zone to promote root growth and enhance N absorption [39], hence improving fertilizer utilization efficiency and reducing gaseous N loss.
Our findings were in line with earlier research that indicated that soil inorganic nitrogen content is crucial in influencing greenhouse gas emissions [33]. A positive linear relationship was observed between the ammonia volatilization flux, nitrous oxide emission flux, and soil inorganic nitrogen content (Figure 9). However, the methane uptake flux showed a negative exponential relationship with the inorganic nitrogen content. Our observation results support the conclusion of Peng et al. [43], Aronso and Helliker [44] and Chang et al. [45], who found that high inorganic nitrogen inhibited methane uptake in forest and non-paddy soils.
We aimed to decrease the GWP and GHGI by optimizing the fertilization depth. According to the research findings, appropriate fertilization depth (25 cm) could reduce GWP and GHGI, supporting the view of Liu et al. [13]. Our research indicated that deep fertilizer successfully decreased greenhouse gas emissions while increasing maize production.

4.2. Deep Fertilization Decreased Carbon Footprint

Previous studies have shown that chemical fertilizers in agriculture are the primary source of greenhouse gas emissions, accounting for 50.7% of the total greenhouse gas emissions during crop production [46,47]. This study found that agricultural inputs are a major source of greenhouse gas emissions. The proportion of agricultural inputs in greenhouse gas emissions gradually increased with increased fertilization depth, reaching a peak of 73.5% at a fertilization depth of 35 cm. In this study, nitrogen fertilizer input is still the largest source of greenhouse gas emissions, and diesel oil is the second largest source of greenhouse gas emissions. When the fertilization depth was 5 cm, the greenhouse gas emissions caused by nitrogen fertilizer accounted for 40.6% of the total emissions, which was similar to other conventional fertilization studies [48,49]. In fact, the only variable in this study was the fertilization depth, and as the depth of fertilization increased, more intensive high-power machinery traction was required, thereby increasing diesel consumption. We used artificial furrows for fertilizer application, and we calculated the diesel inputs for different fertilization depths based on the proportion of human resources used for furrow production and the amount of diesel consumed relative to the conventional fertilization depth. Therefore, the results obtained were basically consistent with the data obtained by directly using mechanical trenching and fertilization. Previous studies have indicated that chemical fertilizers are the primary source of agricultural greenhouse gas emissions, because they involve external fertilizer application or the conventional fertilization depth, and thus, the consumption of diesel is responsible for producing less greenhouse gas emissions [50]. Some studies have also found that the power consumed for irrigation is the primary source of agricultural greenhouse gas emissions because irrigation in the wheat–maize rotation system requires large amounts of electrical energy [22]. Another study also suggested that nitrogen fertilizer is the main source of greenhouse gas emissions among the agricultural inputs in paddy fields [13], which is consistent with our results.
The total greenhouse gas emissions of this study were lower than previous paddy field studies [51], but similar to those of dryland peanut and wheat production [20]. These differences are largely attributed to the fact that while only nitrous oxide and agricultural inputs are considered for the production of dryland crops such as wheat and maize, previous studies have typically included nitrous oxide and methane emissions when assessing paddy field greenhouse gas emissions [51,52,53]. Previous research has shown that dryland agriculture primarily results in methane uptake. This effect of reducing greenhouse gas emissions is often ignored when calculating total greenhouse gas emissions, resulting in assessment results that are slightly higher than the actual results [25]. In fact, methane contributes about 18% to the atmospheric radiation of the greenhouse effect, and drylands are important methane sinks, accounting for about 6% of the total methane consumption [54]. Therefore, we considered methane in the total greenhouse gas emission assessment of this study, which is different from the total greenhouse gas emission assessment of other dryland crops, which is also one of the innovations of our study. Our results showed that methane absorption by dryland soils can help reduce greenhouse gas emissions and effectively mitigate climate change. Methane absorption increases with increasing fertilization depth, indicating that changing fertilization methods to affect greenhouse gas emissions produced by methane can also effectively reduce greenhouse gas emissions [13]. Similarly, a previous study found that optimized fertilization can reduce greenhouse gas emissions and reduce nitrogen losses [55].
In agricultural activities, CF can consider production and ecological factors to convey more information. This study evaluated CF under different fertilization depths and found that the changes in CF and total greenhouse gas emissions were basically consistent, with total greenhouse gas emissions and maize yield responding significantly to fertilization depth. The total greenhouse gas emissions were significantly reduced under D25, and corn yield was significantly increased, resulting in a significant decrease in CF compared with D5. Since paddy fields are a source of methane emissions and contribute more to CF than dryland spring maize production, the amount of CF in this study was significantly lower than previously observed in paddy fields [19,33]. Previous studies suggested that changes in soil organic carbon content, straw and root weight, and soil respiration should be considered when assessing CF. However, according to other studies, changes in soil organic carbon should only be considered when returning straw to fields causes substantial changes in soil organic carbon content [56]. The root weight was difficult to determine, and soil respiration directly produces CO2, so this study only considered the greenhouse effect caused by nitrous oxide and methane and directly caused by fertilization. For the planting industry that relies on photosynthesis, it has two characteristics: carbon emissions and carbon sinks. Carbon sinks should be considered when estimating agricultural carbon emissions [57]. A previous study showed that crops accumulating more dry matter mean they can fix more carbon from the atmosphere and ultimately exhibit carbon sequestration throughout their growth [58]. In this study, yield and biomass were highest under D25, so we believe that 25 cm deep fertilizer application can improve the crop’s ability to fix carbon from the atmosphere and reduce carbon emissions throughout the growth cycle.

4.3. Deep Fertilization Decreased Nitrogen Footprint

Numerous studies have demonstrated that the major contributors to Nr loss in agricultural environments are ammonia volatilization, NO3−N and NH4+−N leaching following the application of nitrogen fertilizer [19,25,28,59,60,61], and consistent results have been obtained in previous studies. Diesel was the main contributor to the Nr loss from agricultural inputs, accounting for 65.0–81.7%. Agricultural inputs and nitrous oxide accounted for relatively small amounts of the total Nr losses. Ammonia volatilization and NO3−N and NH4+−N production accounted for a large proportion of the Nr losses. Optimizing fertilization depths can significantly reduce the loss caused by ammonia volatilization, which is of great importance for reducing the Nr losses in agriculture.
This study did not measure the Nr loss of NO3−N and NH4+−N, but the Nr loss factor provided by the Chinese Life Cycle Database was used in the calculation. Fertilizing at appropriate depths (15 cm and 25 cm) promotes root growth and development, enhances nitrogen absorption, and ultimately improves nitrogen utilization efficiency [7,10]. Therefore, we believe that under D15 and D25 conditions, the calculated Nr losses caused by NO3−N and NH4+−N are slightly higher than the actual loss, which further indicated that it is feasible to reduce Nr loss by appropriately increasing fertilization depth. NF is a standard indicator of nitrogen loss, which combines all of the Nr losses in the crop production process with the yield to represent the Nr losses per unit of grain produced. Previous studies have shown that adopting appropriate agronomic measures can reduce NF and improve ecosystem service functions [19,62]. The NF range of fertilization treatments was 5.99–8.25 g N-eq kg−1 grain, which is consistent with the NF range of 5.1–7.7 g N-eq kg−1 grain found in rice production [31]. In a previous study conducted in the Loess Plateau region of China, the NF of wheat was 64–91 g N-eq kg−1 grain [25], which was significantly higher than the NF values observed in this study, although the total Nr was approximately the same. Due to low rainfall during the production period in the Loess Plateau region, wheat yields are poor, ultimately leading to higher NF values [30,63]. Previous studies have shown that changing the type of urea, such as applying slow-release urea or controlled-release urea, is of great significance in promoting the efficient use of nitrogen by crops and reducing nitrogen loss [64]. Zheng et al. [8] found that the mixed application of urea and nitrification inhibitors or urease inhibitors during summer maize production by dryland farming in the Loess Plateau region of China significantly reduces nitrous oxide and ammonia volatilization, improves the nitrogen use efficiency, and reduces Nr loss, thereby decreasing NF, which also provided inspiration for our subsequent research.

4.4. Effects of Deep Fertilization on Maize Productivity, NEEB, and the Technology Adoption Potential

Our results confirmed the findings of Xia et al. [65], a meta-analysis, which showed that deep nitrogen placement can improve grain yield, total nitrogen absorption, and nitrogen utilization efficiency. Compared with surface fertilization treatment, proper adjustment of fertilization depth can greatly increase maize yield. The reason is that deep fertilization fixes nutrients in the position where the roots absorb nutrients, reducing the impact on maize yield, as well as reducing the risk of downward leaching of nitrogen [10]. Furthermore, the immobilization of nitrogen in deep soil reduces its loss in the form of volatile ammonia and nitrous oxide emissions [66]. Appropriate depth of fertilization will also promote crop rooting, which will help the roots develop deeper into the soil and obtain the water and nutrients needed for growth and development [7]. These factors lead to significant increases in crop yields and fertilizer utilization efficiency after selecting the appropriate fertilization depth. Due to differences in soil texture, precipitation, and farming practices across regions, the optimal depth of fertilization may vary, so further research is still being conducted in different locations and regions.
To fully assess the whole economic benefits of the crop production process, NEEB can be used to link agronomic expenses to environmental costs and benefits [23]. We found that adopting appropriate fertilization depth increases the economic cost of agricultural inputs but also significantly increases crop yields and significantly reduces environmental costs, thereby significantly reducing NEEB. Our approach supports the goal of achieving maximum economic benefits with minimum environmental pollution in agricultural production [67]. In addition, we found that reduced yields and increased economic costs of agricultural inputs are difficult to offset the costs of reducing greenhouse gas emissions, thus significantly reducing the economic benefits under D35. Therefore, agricultural inputs must be considered when assessing the benefits of this plant production model.
The results obtained in this study support our hypothesis that deep fertilization can increase the methane uptake capacity of drylands, reduce carbon emissions and nitrogen losses, and significantly increase corn yields, which is beneficial to agroecosystems. The aim of our experiment was also achieved.
Our study demonstrated that optimizing fertilization depth can effectively increase maize productivity while reducing the environmental footprint. Can farmers accept the deep application technology of chemical fertilizers? Because existing equipment cannot meet the requirements of a reasonable fertilization plan, it is difficult for farmers to accept deep fertilization technology. Fortunately, agricultural equipment has evolved to the point where it can fully meet global fertilization needs [68], allowing farmers to accept this approach to some extent. However, as the depth of fertilization increases, mechanical operations require more diesel, which increases the cost of fertilization and is also the biggest concern for farmers. In order to increase farmers’ enthusiasm, the government may consider increasing planting subsidies while promoting this technology in the future. Our study showed that maize yield was highest when fertilizer was applied at a soil depth of 25 cm, followed by 15 cm. Meanwhile, performance in terms of environmental benefits also reflected yield performance, with D25 having the lowest environmental cost, followed by 15 cm depth. Therefore, the results of this study indicated that for spring maize production in the Loess Plateau region, the optimal depth for deep application of nitrogen and phosphorus fertilizers is 25 cm. However, increasing the depth of fertilization will significantly increase the intensity of mechanical use and diesel consumption. We advocate further optimizing the fertilization location within the 15–25 cm soil layer to determine a more effective and appropriate fertilization depth.

5. Conclusions

This study found that deep fertilization significantly increased methane absorption flux in spring maize fields. Soil inorganic matter inhibited the CH4 uptake. Fertilizer inputs and diesel were the primary and second-highest source of GHG emissions from the agricultural inputs, and the contribution of diesel to emissions increased as the fertilization depth increased. The contribution of agricultural inputs to the total Nr loss increased with the increase in fertilization depth. An appropriate fertilization depth significantly reduced the likelihood of global warming and the carbon and nitrogen footprint in the maize production system and significantly improved maize productivity and NEEB. Greenhouse gas emission and the loss of reactive nitrogen led to a decrease in maize production. Fertilizing at 25 cm depth can increase the economic and ecological benefits of dryland spring maize production and can be used as an alternative fertilization strategy for sustainable maize production system.

Supplementary Materials

The following supporting information can be downloaded at: https://www.mdpi.com/article/10.3390/agronomy14040805/s1, Figure S1: Daily precipitation and temperature during maize growth and fallow seasons in 2019 and 2020 at the experimental site; Figure S2: Surface N2O flux (mg m−2 h−1), NH3 volatilization (kg ha−1 d−1), and cumulative N2O emission (kg ha−1), NH3 volatilization (kg ha−1) during maize growth stages under different deep fertilization depth treatments in 2019 and 2020. CK: No N-P placement in the soil; and D5, D15, D25, and D35 indicate N-P deep-band placement at depths of 5, 15, 25, and 35 cm below the soil surface, respectively. Vertical bars represent the least significant test values at p = 0.05. and standard errors (n = 3); Figure S3: Soil NO3−N and NH4+−N content at 0–10 cm soil depth under different deep fertilization depth treatments during 2019 and 2020; Table S1: Physical and chemical properties of the soil before the experiment.

Author Contributions

Conceptualization, Z.J. and P.W.; Methodology, P.W.; Software, P.W.; Validation, P.W.; Formal analysis, Z.J. and P.W.; Investigation, Z.J. and P.W.; Data curation, P.W.; Writing—original draft, H.H. and P.W.; Writing—review & editing, H.H., Q.W., F.L., Z.Z., B.L., G.Z., B.C., K.B., T.C., Z.G., P.Z., Z.J. and P.W.; Visualization, P.W.; Project administration, Z.J.; Funding acquisition, Z.J. All authors have read and agreed to the published version of the manuscript.

Funding

This research was supported by National Key Research and Development Program of China (2023YFD1900503), Fundamental Research Program of Shanxi Province (202203021222148), Doctoral Research Starting Project at Shanxi Agricultural University (2023BQ26), Award Scientific Program for Excellent Doctors in Shanxi Province (SXBYKY2023008), National Natural Science Foundation of China (Nos. 31801314, 31901475, and 32071955), Ministerial and Provincial Co-Innovation Centre for Endemic Crops Production with High-quality and Efficiency in Loess Plateau, the Key Laboratory of Low-carbon Green Agriculture in Northeastern China, Ministry of Agriculture and Rural Affairs P. R. China (LCGANE16).

Data Availability Statement

The original contributions presented in the study are included in the article/Supplementary Material, further inquiries can be directed to the corresponding author.

Conflicts of Interest

The authors declare that there are no known conflicts of interest associated with this publication.

References

  1. Gan, Y.; Liang, C.; Wang, X.; McConkey, B. Lowering carbon footprint of durum wheat by diversifying cropping systems. Field Crops Res. 2011, 122, 199–206. [Google Scholar] [CrossRef]
  2. Cui, Z.; Zhang, H.; Chen, X.; Zhang, C.; Ma, W.; Huang, C.; Zhang, W.; Mi, G.; Miao, Y.; Li, X. Pursuing sustainable productivity with millions of smallholder farmers. Nature 2018, 555, 363–366. [Google Scholar] [CrossRef]
  3. Ma, R.; Yu, K.; Xiao, S.; Liu, S.; Ciais, P.; Zou, J. Data-driven estimates of fertilizer-induced soil NH3, NO and N2O emissions from croplands in China and their climate change impacts. Glob. Chang. Blol. 2022, 28, 1008–1022. [Google Scholar] [CrossRef] [PubMed]
  4. Maaz, T.M.; Sapkota, T.B.; Eagle, A.J.; Kantar, M.B.; Bruulsema, T.W.; Majumdar, K. Meta-analysis of yield and nitrous oxide outcomes for nitrogen management in agriculture. Glob. Chang. Blol. 2021, 27, 2343–2360. [Google Scholar] [CrossRef] [PubMed]
  5. You, L.; Ros, G.H.; Chen, Y.; Shao, Q.; Young, M.D.; Zhang, F.; De Vries, W. Global mean nitrogen recovery efficiency in croplands can be enhanced by optimal nutrient, crop and soil management practices. Nat. Commun. 2023, 14, 5747. [Google Scholar] [CrossRef]
  6. Young, M.D.; Ros, G.H.; de Vries, W. Impacts of agronomic measures on crop, soil, and environmental indicators: A review and synthesis of meta-analysis. Agric. Ecosyst. Environ. 2021, 319, 107551. [Google Scholar] [CrossRef]
  7. Cheng, Y.; Wang, H.-Q.; Liu, P.; Dong, S.-T.; Zhang, J.-W.; Zhao, B.; Ren, B.-Z. Nitrogen placement at sowing affects root growth, grain yield formation, N use efficiency in maize. Plant Soil 2020, 457, 355–373. [Google Scholar] [CrossRef]
  8. Zheng, Y.; Yue, Y.; Li, C.; Wang, Y.; Zhang, H.; Ren, H.; Gong, X.; Jiang, Y.; Qi, H. Revolutionizing Maize Crop Productivity: The Winning Combination of Zigzag Planting and Deep Nitrogen Fertilization for Maximum Yield through Root–Shoot Ratio Management. Agronomy 2023, 13, 1307. [Google Scholar] [CrossRef]
  9. Wu, P.; Liu, F.; Li, H.; Cai, T.; Zhang, P.; Jia, Z. Suitable fertilizer application depth can increase nitrogen use efficiency and maize yield by reducing gaseous nitrogen losses. Sci. Total Environ. 2021, 781, 146787. [Google Scholar] [CrossRef]
  10. Liu, T.; Fan, D.; Zhang, X.; Chen, J.; Li, C.; Cao, C. Deep placement of nitrogen fertilizers reduces ammonia volatilization and increases nitrogen utilization efficiency in no-tillage paddy fields in central China. Field Crops Res. 2015, 184, 80–90. [Google Scholar] [CrossRef]
  11. Gaihre, Y.K.; Singh, U.; Islam, S.M.; Huda, A.; Islam, M.; Satter, M.A.; Sanabria, J.; Islam, M.R.; Shah, A. Impacts of urea deep placement on nitrous oxide and nitric oxide emissions from rice fields in Bangladesh. Geoderma 2015, 259–260, 370–379. [Google Scholar] [CrossRef]
  12. Islam, S.M.; Gaihre, Y.K.; Biswas, J.C.; Singh, U.; Ahmed, M.N.; Sanabria, J.; Saleque, M. Nitrous oxide and nitric oxide emissions from lowland rice cultivation with urea deep placement and alternate wetting and drying irrigation. Sci. Rep. 2018, 8, 17623. [Google Scholar] [CrossRef] [PubMed]
  13. Liu, T.; Li, S.; Guo, L.; Cao, C.; Li, C.; Zhai, Z.; Zhou, J.; Mei, Y.; Ke, H. Advantages of nitrogen fertilizer deep placement in greenhouse gas emissions and net ecosystem economic benefits from no-tillage paddy fields. J. Clean. Prod. 2020, 263, 121322. [Google Scholar] [CrossRef]
  14. Su, W.; Liu, B.; Liu, X.; Li, X.; Ren, T.; Cong, R.; Lu, J. Effect of depth of fertilizer banded-placement on growth, nutrient uptake and yield of oilseed rape (Brassica napus L.). Eur. J. Agron. 2015, 62, 38–45. [Google Scholar] [CrossRef]
  15. Ke, J.; He, R.; Hou, P.; Ding, C.; Ding, Y.; Wang, S.; Liu, Z.; Tang, S.; Ding, C.; Chen, L. Combined controlled-released nitrogen fertilizers and deep placement effects of N leaching, rice yield and N recovery in machine-transplanted rice. Agric. Ecosyst. Environ. 2018, 265, 402–412. [Google Scholar] [CrossRef]
  16. Nakano, T.; Inoue, G.; Fukuda, M. Methane consumption and soil respiration by a birch forest soil in West Siberia. Tellus B 2004, 56, 223–229. [Google Scholar] [CrossRef]
  17. Fang, H.; Cheng, S.; Yu, G.; Cooch, J.; Wang, Y.; Xu, M.; Li, L.; Dang, X.; Li, Y. Low-level nitrogen deposition significantly inhibits methane uptake from an alpine meadow soil on the Qinghai–Tibetan Plateau. Geoderma 2014, 213, 444–452. [Google Scholar] [CrossRef]
  18. Nan, W.; Li, S.; Dong, Z.; Yao, P. CH4 fluxes and diffusion within soil profiles subjected to different fertilizer regimes on China’s Loess Plateau. Agric. Ecosyst. Environ. 2020, 287, 106679. [Google Scholar] [CrossRef]
  19. Xue, J.-F.; Pu, C.; Liu, S.-L.; Zhao, X.; Zhang, R.; Chen, F.; Xiao, X.-P.; Zhang, H.-L. Carbon and nitrogen footprint of double rice production in Southern China. Ecol. Indic. 2016, 64, 249–257. [Google Scholar] [CrossRef]
  20. He, S.; Chen, Y.; Xiang, W.; Chen, X.; Wang, X.; Chen, Y. Carbon and nitrogen footprints accounting of peanut and peanut oil production in China. J. Clean. Prod. 2021, 291, 125964. [Google Scholar] [CrossRef]
  21. Ledgard, S.F.; Wei, S.; Wang, X.; Falconer, S.; Zhang, N.; Zhang, X.; Ma, L. Nitrogen and carbon footprints of dairy farm systems in China and New Zealand, as influenced by productivity, feed sources and mitigations. Agric. Water Manag. 2019, 213, 155–163. [Google Scholar] [CrossRef]
  22. Wang, Z.-b.; Zhang, H.-l.; Lu, X.-h.; Wang, M.; Chu, Q.-q.; Wen, X.-y.; Chen, F. Lowering carbon footprint of winter wheat by improving management practices in North China Plain. J. Clean. Prod. 2016, 112, 149–157. [Google Scholar] [CrossRef]
  23. Li, B.; Fan, C.; Zhang, H.; Chen, Z.; Sun, L.; Xiong, Z. Combined effects of nitrogen fertilization and biochar on the net global warming potential, greenhouse gas intensity and net ecosystem economic budget in intensive vegetable agriculture in southeastern China. Atmos. Environ. 2015, 100, 10–19. [Google Scholar] [CrossRef]
  24. Liu, C.; Cutforth, H.; Chai, Q.; Gan, Y. Farming tactics to reduce the carbon footprint of crop cultivation in semiarid areas. A review. Agron. Sustain. Dev. 2016, 36, 69. [Google Scholar] [CrossRef]
  25. Wang, L.; Li, L.; Xie, J.; Luo, Z.; Zhang, R.; Cai, L.; Coulter, J.A.; Palta, J.A. Managing the trade-offs among yield, economic benefits and carbon and nitrogen footprints of wheat cropping in a semi-arid region of China. Sci. Total Environ. 2021, 768, 145280. [Google Scholar] [CrossRef]
  26. Zhang, D.; Shen, J.; Zhang, F.; Li, Y.; Zhang, W. Carbon footprint of grain production in China. Sci. Rep. 2017, 7, 4126. [Google Scholar] [CrossRef]
  27. Grassini, P.; Cassman, K.G. High-yield maize with large net energy yield and small global warming intensity. Proc. Natl. Acad. Sci. USA 2012, 109, 1074–1079. [Google Scholar] [CrossRef]
  28. Liang, L.; Ridoutt, B.G.; Lal, R.; Wang, D.; Wu, W.; Peng, P.; Hang, S.; Wang, L.; Zhao, G. Nitrogen footprint and nitrogen use efficiency of greenhouse tomato production in North China. J. Clean. Prod. 2019, 208, 285–296. [Google Scholar] [CrossRef]
  29. Xu, Q.; Hu, K.; Liang, H.; Leghari, S.J.; Knudsen, M.T. Incorporating the WHCNS model to assess water and nitrogen footprint of alternative cropping systems for grain production in the North China Plain. J. Clean. Prod. 2020, 263, 121548. [Google Scholar] [CrossRef]
  30. Xu, Y.; Wang, Y.; Ma, X.; Liu, X.; Zhang, P.; Cai, T.; Jia, Z. Ridge-furrow mulching system and supplementary irrigation can reduce the greenhouse gas emission intensity. Sci. Total Environ. 2020, 717, 137262. [Google Scholar] [CrossRef]
  31. Chen, Z.; Xu, C.; Ji, L.; Feng, J.; Li, F.; Zhou, X.; Fang, F. Effects of multi-cropping system on temporal and spatial distribution of carbon and nitrogen footprint of major crops in China. Glob. Ecol. Conserv. 2020, 22, e00895. [Google Scholar] [CrossRef]
  32. Lin, Z.-c.; Dai, Q.-g.; Ye, S.-c.; Wu, F.-g.; Jia, Y.-s.; Chen, J.-d.; Xu, L.-s.; Zhang, H.-c.; Huo, Z.-y.; Ke, X. Effects of nitrogen application levels on ammonia volatilization and nitrogen utilization during rice growing season. Rice Sci. 2012, 19, 125–134. [Google Scholar] [CrossRef]
  33. Zheng, J.; Wang, H.; Fan, J.; Zhang, F.; Guo, J.; Liao, Z.; Zhuang, Q. Wheat straw mulching with nitrification inhibitor application improves grain yield and economic benefit while mitigating gaseous emissions from a dryland maize field in northwest China. Field Crops Res. 2021, 265, 108125. [Google Scholar] [CrossRef]
  34. Yang, N.; Lü, F.; He, P.; Shao, L. Response of methanotrophs and methane oxidation on ammonium application in landfill soils. Appl. Microbiol. Biotechnol. 2011, 92, 1073–1082. [Google Scholar] [CrossRef]
  35. Chen, S.; Fu, W.; Cai, L.; Xing, Z.; Mou, B.; Wang, Y.; Wu, S.; Zhao, T. Metabolic diversity shapes vegetation-enhanced methane oxidation in landfill covers: Multi-omics study of rhizosphere microorganisms. Waste Manag. 2023, 172, 151–161. [Google Scholar] [CrossRef]
  36. Chen, X.; Ren, H.; Zhang, J.; Zhao, B.; Ren, B.; Wan, Y.; Liu, P. Deep phosphorus fertilizer placement increases maize productivity by improving root-shoot coordination and photosynthetic performance. Soil Tillage Res. 2024, 235, 105915. [Google Scholar] [CrossRef]
  37. Liu, J.; Xu, Y.; Zhu, Y.; Yin, W.; Fan, D.; Yan, G.; Raza, S.T.; Lu, Z.; Chen, Z. Enhanced soil methane oxidation in both organic layer and topsoil during the succession of subtropical forests. Process Saf. Environ. 2023, 170, 865–876. [Google Scholar] [CrossRef]
  38. Adviento-Borbe, M.A.A.; Linquist, B. Assessing fertilizer N placement on CH4 and N2O emissions in irrigated rice systems. Geoderma 2016, 266, 40–45. [Google Scholar] [CrossRef]
  39. Wang, Y.; Xu, Y.; Guo, Q.; Zhang, P.; Cai, T.; Jia, Z. Adopting nitrogen deep placement based on different simulated precipitation year types enhances wheat yield and resource utilization by promoting photosynthesis capacity. Field Crops Res. 2023, 294, 108862. [Google Scholar] [CrossRef]
  40. Liu, C.; Wang, Y.; Chen, H.; Sun, Q.; Jiang, Q.; Wang, Z. High level of winter warming aggravates soil carbon, nitrogen loss and changes greenhouse gas emission characteristics in seasonal freeze-thaw farmland soil. Sci. Total Environ. 2023, 905, 167180. [Google Scholar] [CrossRef]
  41. Deng, X.; Xu, T.; Xue, L.; Hou, P.; Xue, L.; Yang, L. Effects of warming and fertilization on paddy N2O emissions and ammonia volatilization. Agric. Ecosyst. Environ. 2023, 347, 108361. [Google Scholar] [CrossRef]
  42. Bhuiyan MS, I.; Rahman, A.; Loladze, I.; Das, S.; Kim, P.J. Subsurface fertilization boosts crop yields and lowers greenhouse gas emissions: A global meta-analysis. Sci. Total Environ. 2023, 876, 162712. [Google Scholar] [CrossRef]
  43. Peng, Y.; Wang, G.; Li, F.; Yang, G.; Fang, K.; Liu, L.; Qin, S.; Zhang, D.; Zhou, G.; Fang, H. Unimodal response of soil methane consumption to increasing nitrogen additions. Environ. Sci. Technol. 2019, 53, 4150–4160. [Google Scholar] [CrossRef] [PubMed]
  44. Aronson, E.; Helliker, B. Methane flux in non-wetland soils in response to nitrogen addition: A meta-analysis. Ecology 2010, 91, 3242–3251. [Google Scholar] [CrossRef]
  45. Chang, R.; Liu, X.; Wang, T.; Li, N.; Bing, H. Stimulated or inhibited response of methane flux to nitrogen addition depends on nitrogen levels. J. Geophys. Res.-Biogeosci. 2021, 126, e2021JG006600. [Google Scholar] [CrossRef]
  46. Xu, X.; Lan, Y. Spatial and temporal patterns of carbon footprints of grain crops in China. J. Clean. Prod. 2017, 146, 218–227. [Google Scholar] [CrossRef]
  47. Liu, W.; Zhang, G.; Wang, X.; Lu, F.; Ouyang, Z. Carbon footprint of main crop production in China: Magnitude, spatial-temporal pattern and attribution. Sci. Total Environ. 2018, 645, 1296–1308. [Google Scholar] [CrossRef] [PubMed]
  48. Zhang, G.; Liu, S.; Wang, X.; Wang, X.; Zhang, Y.; Zhao, D.; Wen, X.; Han, J.; Liao, Y. Mixed application of controlled-release urea and normal urea can improve crop productivity and reduce the carbon footprint under straw return in winter wheat-summer maize cropping system. Eur. J. Agron. 2023, 151, 127002. [Google Scholar] [CrossRef]
  49. Feng, X.; Sun, T.; Guo, J.; Cai, H.; Qian, C.; Hao, Y.; Yu, Y.; Deng, A.; Song, Z.; Zhang, W. Climate-smart agriculture practice promotes sustainable maize production in northeastern China: Higher grain yield while less carbon footprint. Field Crops Res. 2023, 302, 109108. [Google Scholar] [CrossRef]
  50. Jiang, Z.; Zhong, Y.; Yang, J.; Wu, Y.; Li, H.; Zheng, L. Effect of nitrogen fertilizer rates on carbon footprint and ecosystem service of carbon sequestration in rice production. Sci. Total Environ. 2019, 670, 210–217. [Google Scholar] [CrossRef]
  51. Gong, H.; Li, J.; Sun, M.; Xu, X.; Ouyang, Z. Lowering carbon footprint of wheat-maize cropping system in North China Plain: Through microbial fertilizer application with adaptive tillage. J. Clean. Prod. 2020, 268, 122255. [Google Scholar] [CrossRef]
  52. Zhang, X.-Q.; Pu, C.; Zhao, X.; Xue, J.-F.; Zhang, R.; Nie, Z.-J.; Chen, F.; Lal, R.; Zhang, H.-L. Tillage effects on carbon footprint and ecosystem services of climate regulation in a winter wheat–summer maize cropping system of the North China Plain. Ecol. Indic. 2016, 67, 821–829. [Google Scholar] [CrossRef]
  53. Xue, J.-F.; Yuan, Y.-Q.; Zhang, H.-L.; Ren, A.-X.; Lin, W.; Sun, M.; Gao, Z.-Q.; Sun, D.-S. Carbon footprint of dryland winter wheat under film mulching during summer-fallow season and sowing method on the Loess Plateau. Ecol. Indic. 2018, 95, 12–20. [Google Scholar] [CrossRef]
  54. Meng, C.; Wang, F.; Yang, K.; Shock, C.C.; Engel, B.A.; Zhang, Y.; Tao, L.; Gu, X. Small wetted proportion of drip irrigation and non-mulched treatment with manure application enhanced methane uptake in upland field. Agric. For. Meteorol. 2020, 281, 107821. [Google Scholar] [CrossRef]
  55. Ju, X.-T.; Xing, G.-X.; Chen, X.-P.; Zhang, S.-L.; Zhang, L.-J.; Liu, X.-J.; Cui, Z.-L.; Yin, B.; Christie, P.; Zhu, Z.-L. Reducing environmental risk by improving N management in intensive Chinese agricultural systems. Proc. Natl. Acad. Sci. USA 2009, 106, 3041–3046. [Google Scholar] [CrossRef] [PubMed]
  56. Li, S.; Hu, M.; Shi, J.; Tian, X.; Wu, J. Integrated wheat-maize straw and tillage management strategies influence economic profit and carbon footprint in the Guanzhong Plain of China. Sci. Total Environ. 2021, 767, 145347. [Google Scholar] [CrossRef] [PubMed]
  57. Cui, Y.; Khan, S.U.; Sauer, J.; Zhao, M. Exploring the spatiotemporal heterogeneity and influencing factors of agricultural carbon footprint and carbon footprint intensity: Embodying carbon sink effect. Sci. Total Environ. 2022, 846, 157507. [Google Scholar] [CrossRef] [PubMed]
  58. Dachraoui, M.; Sombrero, A. Effect of tillage systems and different rates of nitrogen fertilisation on the carbon footprint of irrigated maize in a semiarid area of Castile and Leon, Spain. Soil Tillage Res. 2020, 196, 104472. [Google Scholar] [CrossRef]
  59. Xue, J.-F.; Liu, S.-L.; Chen, Z.-D.; Chen, F.; Lal, R.; Tang, H.-M.; Zhang, H.-L. Assessment of carbon sustainability under different tillage systems in a double rice cropping system in Southern China. Int. J. Life Cycle Assess. 2014, 19, 1581–1592. [Google Scholar] [CrossRef]
  60. Wang, X.; Feng, Y.; Yu, L.; Shu, Y.; Tan, F.; Gou, Y.; Luo, S.; Yang, W.; Li, Z.; Wang, J. Sugarcane/soybean intercropping with reduced nitrogen input improves crop productivity and reduces carbon footprint in China. Sci. Total Environ. 2020, 719, 137517. [Google Scholar] [CrossRef]
  61. Wang, L.; Coulter, J.A.; Li, L.; Luo, Z.; Chen, Y.; Deng, X.; Xie, J. Plastic mulching reduces nitrogen footprint of food crops in China: A meta-analysis. Sci. Total Environ. 2020, 748, 141479. [Google Scholar] [CrossRef] [PubMed]
  62. Leach, A.M.; Galloway, J.N.; Bleeker, A.; Erisman, J.W.; Kohn, R.; Kitzes, J. A nitrogen footprint model to help consumers understand their role in nitrogen losses to the environment. Environ. Dev. 2012, 1, 40–66. [Google Scholar] [CrossRef]
  63. Zhang, S.; Lövdahl, L.; Grip, H.; Tong, Y.; Yang, X.; Wang, Q. Effects of mulching and catch cropping on soil temperature, soil moisture and wheat yield on the Loess Plateau of China. Soil Tillage Res. 2009, 102, 78–86. [Google Scholar] [CrossRef]
  64. Bai, J.; Li, Y.; Zhang, J.; Xu, F.; Bo, Q.; Wang, Z.; Li, Z.; Li, S.; Shen, Y.; Yue, S. Straw returning and one-time application of a mixture of controlled release and solid granular urea to reduce carbon footprint of plastic film mulching spring maize. J. Clean. Prod. 2021, 280, 124478. [Google Scholar] [CrossRef]
  65. Xia, L.; Lam, S.K.; Chen, D.; Wang, J.; Tang, Q.; Yan, X. Can knowledge-based N management produce more staple grain with lower greenhouse gas emission and reactive nitrogen pollution? A meta-analysis. Glob. Chang. Blol. 2017, 23, 1917–1925. [Google Scholar] [CrossRef]
  66. Yao, Y.; Zhang, M.; Tian, Y.; Zhao, M.; Zhang, B.; Zhao, M.; Zeng, K.; Yin, B. Urea deep placement for minimizing NH3 loss in an intensive rice cropping system. Field Crops Res. 2018, 218, 254–266. [Google Scholar] [CrossRef]
  67. Guan, X.-K.; Wei, L.; Turner, N.C.; Ma, S.-C.; Yang, M.-D.; Wang, T.-C. Improved straw management practices promote in situ straw decomposition and nutrient release, and increase crop production. J. Clean. Prod. 2020, 250, 119514. [Google Scholar] [CrossRef]
  68. Patuk, I.; Hasegawa, H.; Borodin, I.; Whitaker, A.C.; Borowski, P.F. Simulation for design and material selection of a deep placement fertilizer applicator for soybean cultivation. Open Eng. 2020, 10, 733–743. [Google Scholar] [CrossRef]
Figure 1. System boundary used for life cycle analysis to estimate carbon and nitrogen footprints for spring maize production.
Agronomy 14 00805 g001
Figure 2. Cumulative N2O emission (kg ha−1), NH3 volatilization (kg ha−1), and CH4 emission (kg ha−1) during maize growth stages under different deep fertilization depth treatments in 2019 and 2020. CK: No N-P placement in the soil; and D5, D15, D25, and D35 indicate N-P deep-band placement at depths of 5, 15, 25, and 35 cm below the soil surface, respectively. Vertical bars represent standard errors (n = 3). Lowercase letters indicate significant differences among treatments.
Agronomy 14 00805 g002
Figure 3. Global warming potential (GWP, g CO2-eq·ha−1) and greenhouse gas intensity (GHGI, g CO2-eq·ha−1) under different deep fertilization depth treatments in 2019 and 2020. CK: No N-P placement in the soil; and D5, D15, D25, and D35 indicate N-P deep-band placement at depths of 5, 15, 25, and 35 cm below the soil surface, respectively. Vertical bars represent standard errors (n = 3). Lowercase letters indicate significant differences among treatments. *** indicate the significant level at p < 0.001.
Agronomy 14 00805 g003
Figure 4. Relationship between global warming potential (GWP) or greenhouse gas intensity (GHGI) and maize yield under different deep fertilization depth treatments during 2019 and 2020. ** and *** indicate the significant level at p < 0.01 and p < 0.001.
Agronomy 14 00805 g004
Figure 5. Proportion of GHGs emissions (A) due to agricultural inputs, average GHG emissions (B), and CH4 emissions (C) under different deep fertilization depth treatments during 2019 and 2020. CK: No N-P placement in the soil; and D5, D15, D25, and D35 indicate N-P deep-band placement at depths of 5, 15, 25, and 35 cm below the soil surface, respectively. Lowercase letters indicate significant differences among treatments (LSD test, p < 0.05). Vertical bars represent the standard error (n = 3).
Agronomy 14 00805 g005
Figure 6. Proportions of reactive nitrogen losses (A) due to agricultural inputs, average reactive nitrogen losses (B), and N2O reactive nitrogen losses (C) under different deep fertilization depth treatments during 2019 and 2020. CK: No N-P placement in the soil; and D5, D15, D25, and D35 indicate N-P deep-band placement at depths of 5, 15, 25, and 35 cm below the soil surface, respectively. Lowercase letters indicate significant differences among treatments (LSD test, p < 0.05). Vertical bars represent the standard error (n = 3).
Agronomy 14 00805 g006
Figure 7. Net ecosystem economic benefits (A), average carbon footprints (B), nitrogen footprints (C), and GHG emissions (D), and Nr losses per NEEB (E) under different deep fertilization depth treatments during 2019 and 2020. CK: No N-P placement in the soil; and D5, D15, D25, and D35 indicate N-P deep-band placement at depths of 5, 15, 25, and 35 cm below the soil surface, respectively. Lowercase letters indicate significant differences among treatments (LSD test, p < 0.05). Vertical bars represent the standard error (n = 3).
Agronomy 14 00805 g007
Figure 8. Relationship between cumulative CH4 emission (a), N2O emission (b), NH3 volatilization (c), and Biomass (A), maize yield (B), N uptake (C), and nitrogen use efficiency (NUE, D) under different deep fertilization depth treatments during 2019 and 2020. * p < 0.05, ** p < 0.01, *** p < 0.001.
Agronomy 14 00805 g008
Figure 9. Relationship between soil NO3−N, NH4+−N content, and NH3 volatilization flux (A), CH4 uptake flux (B), and N2O emission flux (C) under different deep fertilization depth treatments during 2019 and 2020. *** p < 0.001.
Agronomy 14 00805 g009
Table 1. Emissions factors for agricultural inputs to maize production in China.
ItemGHG EmissionsNr LossesSourcesReference
Coefficient (CO2-eq)Coefficient (N-eq)
N (kg·kg−1)1.530.89 × 10−3CLCD 0.7Chen et al., 2020 [31]
P2O5 (kg·kg−1)1.630.54 × 10−3
Pesticide (kg·kg−1)16.613.53 × 10−3
Insecticides (kg·kg−1)10.154.49 × 10−3
Fungicides (kg·kg−1)10.57.05 × 10−3
Diesel (kg·ha−1)4.994.66 × 10−3
Labor (kg·person−1·day−1)0.86-
Maize (kg·kg−1)1.930.88 × 10−3
Note: CLCD indicates Chinese Life Cycle Database.
Table 2. Average greenhouse gas (GHG) emissions due to agricultural inputs for maize production under different treatments during 2019–2020 growing seasons in China.
ItemGHG Emissions (kg CO2-eq·ha−1)
CKD5D15D25D35
N0344.25344.25344.25344.25
P2O50195.60195.60195.60195.60
Pesticide 16.6116.6116.6116.6116.61
Insecticides15.2315.2315.2315.2315.23
Fungicides10.5010.5010.5010.5010.50
Diesel 149.7249.5299.4349.3598.8
Labor 0.860.860.860.860.86
Maize16.2116.2116.2116.2116.21
Total209.11848.76898.66948.5671198.06
Note: CK: No N-P placement in the soil; D5, D15, D25, and D35 indicate N-P deep placement at depths of 5, 15, 25, and 35 cm below the surface, respectively.
Table 3. Average reactive nitrogen (Nr) losses due to agricultural inputs for maize production under different treatments during 2019–2020 growing seasons in China.
ItemNr Losses (g N-eq·ha−1)
CKD5D15D25D35
N0306.38306.38306.38306.38
P2O50105.62105.62105.62105.62
Pesticide 58.6358.6358.6358.6358.63
Insecticides68.3668.3668.3668.3668.36
Fungicides74.0374.0374.0374.0374.03
Diesel 697.601162.671395.201627.742790.41
Labor -----
Maize14.2714.2714.2714.2714.27
Total912.891789.962022.502255.033417.70
Note: CK: No N-P placement in the soil; D5, D15, D25, and D35 indicate N-P deep placement at depths of 5, 15, 25, and 35 cm below the surface, respectively.
Table 4. The biomass, maize yield, fertilizer uptake, and use efficiency under different deep-band placement fertilizer treatments during 2019 and 2020.
YearTreatmentN UptakeNUEBiomassYield
kg·ha−1%kg·ha−1kg·ha−1
2019CK88.21 d 18,379.95 d9548.45 d
D5161.43 c32.54 c21,628.35 c10,971.43 bc
D15174.13 b38.19 b23,331.38 b11,487.09 b
D25187.19 a43.99 a25,237.00 a12,507.13 a
D35157.83 c30.94 c21,215.30 c10,588.24 c
2020CK82.61 d 18,354.50 d9982.03 d
D5151.30 c30.53 c21,551.53 c10,951.10 c
D15163.84 b36.10 b22,463.023 b11,680.44 b
D25179.99 a43.28 a23,403.25 a12,447.11 a
D35146.81 c28.53 c21,255.70 c10,797.55 c
ANOVAYear********
Treatment************
Y × TNSNS***NS
Note: CK: No N-P placement in the soil; D5, D15, D25, and D35 indicate N-P deep placement at depths of 5, 15, 25, and 35 cm below the surface, respectively. Different letters in a column mean significant differences at the 5% level. NS indicate no significant. * p < 0.05, *** p < 0.001.
Disclaimer/Publisher’s Note: The statements, opinions and data contained in all publications are solely those of the individual author(s) and contributor(s) and not of MDPI and/or the editor(s). MDPI and/or the editor(s) disclaim responsibility for any injury to people or property resulting from any ideas, methods, instructions or products referred to in the content.

