Article

Early Detection of Rice Leaf Blast Disease Using Unmanned Aerial Vehicle Remote Sensing: A Novel Approach Integrating a New Spectral Vegetation Index and Machine Learning

1
College of Information and Electrical Engineering, Shenyang Agricultural University, Shenyang 110866, China
2
Liaoning Key Laboratory of Intelligent Agricultural Technology, Shenyang 110866, China
*
Author to whom correspondence should be addressed.
Agronomy 2024, 14(3), 602; https://doi.org/10.3390/agronomy14030602
Submission received: 17 February 2024 / Revised: 8 March 2024 / Accepted: 15 March 2024 / Published: 17 March 2024

Abstract

:
Leaf blast is recognized as one of the most devastating diseases affecting rice production in the world, seriously threatening rice yield. Therefore, early detection of leaf blast is extremely important to limit the spread and propagation of the disease. In this study, a leaf blast-specific spectral vegetation index RBVI = 9.78 R 816 R 724 − 2.08( ρ 736 / R 724 ) was designed to qualitatively detect the level of leaf blast disease in the canopy of a field and to improve the accuracy of early detection of leaf blast by remote sensing by unmanned aerial vehicle. Stacking integrated learning, AdaBoost, and SVM were used to compare and analyze the performance of the RBVI and traditional vegetation index for early detection of leaf blast. The results showed that the stacking model constructed based on the RBVI spectral index had the highest detection accuracy (OA: 95.9%, Kappa: 93.8%). Compared to stacking, the detection accuracy of the SVM and AdaBoost models constructed based on the RBVI is slightly degraded. Compared with conventional SVIs, the RBVI had higher accuracy in its ability to qualitatively detect leaf blast in the field. The leaf blast-specific spectral index RBVI proposed in this study can more effectively improve the accuracy of UAV remote sensing for early detection of rice leaf blast in the field and make up for the shortcomings of UAV hyperspectral detection, which is susceptible to interference by environmental factors. The results of this study can provide a simple and effective method for field management and timely control of the disease.

1. Introduction

Rice is one of the most important food crops in the world and is the main food ration for nearly half of the world’s population [1,2]. However, with the change in global climate, the outbreak of rice diseases has been exacerbated by the frequent occurrence of abnormal weather, such as typhoons and heavy rains. Leaf blast, caused by the rice blast fungus, is considered the most infectious and destructive fungal disease in the major rice-growing regions of the world [3]. Under cloudy and rainy weather conditions, leaf blast can break out throughout rice’s growth and development period and spread quickly, and pathogenicity is strong. At the same time, leaf blast disease develops in rice leaves, causing serious damage to leaf tissue cells, reducing photosynthesis in rice plants, and affecting rice growth and development. Disease fungi can form conidia between 10 and 35 °C (25–28 °C is optimal) and spread rapidly between plants by air and water currents, invading rice plants and spreading to neighboring cell tissues, causing disease in rice plants [4]. Under normal circumstances, leaf blast reduces rice yield by 10–30%. And under favorable climatic conditions, it will lead to 90–100% yield loss in rice [5]. In addition to causing yield loss, leaf blast can also jeopardize the natural environment. The application of deleterious agents after leaf blast is the main measure to control the further spread of the disease. However, excessive or indiscriminate application of disease control agents will not only lead to plant damage but also more likely to lead to the pollution of the natural environment (e.g., water and soil) in the field, and the misuse of agents will also increase the production cost of farmers. Therefore, there is an urgent need for a rapid, efficient, and large-scale detection tool for the precise detection and control of rice leaf blast.
Accurate early detection of diseases in the field environment is an important measure to prevent and control large-scale outbreaks of rice leaf blast, as well as a key link to reducing the abuse of pharmaceuticals and avoiding environmental pollution. Up to now, the early detection of crop diseases has been mainly carried out by visual hand inspection. This method relies heavily on experienced plant protection staff to conduct visual field site inspections or field sampling. This method has high accuracy and reliability. However, it needs to consume a lot of human and material resources. Another method with high accuracy is the biochemical detection (polymerase chain reaction) method. However, this in-house method requires more specialized knowledge and sophisticated testing instruments. It is difficult to meet the current requirements for efficient and accurate early detection and control of rice diseases. At the same time, both of these methods suffer from the inability to detect large crop areas rapidly. In recent years, many researchers have gradually favored remote sensing technology as an emerging crop detection technology [6,7]. At the same time, the technology is one of the few detection means that can rapidly obtain crop growth and development information over a large area [8]. Many studies have shown that remote sensing technology has good potential for application in several crop information detection fields, such as crop nutrition detection, growth detection, and disease detection. In disease detection, hyperspectral remote sensing technology can effectively distinguish crop diseases due to its rich narrowband and high resolution to obtain subtle changes in crop physiological and biochemical characteristics caused by various stresses [9,10]. However, although hyperspectral remote sensing data have shown great advantages in disease detection, the large number of narrow bands and spectral information in the data bring more redundant feature information for the use of the data. On the other hand, the high cost of hyperspectral instrumentation has also greatly limited the popularization and application of this technology.
Data dimension reduction is the main way of hyperspectral data processing and the key to obtaining effective disease features. Existing data downscaling methods can be categorized into feature compression, feature wavelength screening, and vegetation indices (VIs) extraction. Feature compression can compress, and dimension reduction reduces the dimensionality of the original spectral data and decreases the influence of invalid information [11,12]. However, this method destroys the physical properties of the original spectra to some extent during the linear or nonlinear compression process. At the same time, the practicality of data compression may be limited by the method’s computerized system (the original spectral data still need to be acquired during the application process), which greatly restricts its practical popularization and application for crop disease detection at different scales [2,13]. Different from feature compression, to extract disease feature information, feature wavelength screening does not change the original spectral data and only screens a few or dozens of spectral wavelength data containing the main key disease features from the original spectral data, which reduces the data dimensionality and has strong interpretability [14,15]. However, the influence of various factors, such as lighting conditions, results in a large instability of spectral feature wavelengths, affecting the reliability and generalization ability of the detection model. At the same time, more methods do not consider the inter-band correlation in the screening process, resulting in the introduction of useless features or the omission of important information [16,17].
In recent years, as an effective tool capable of characterizing physiological and biochemical changes in crops, spectral vegetation indices (SVIs) have gained more and more researchers’ attention and studies in crop detection [18,19]. Compared with spectral feature wavelength screening, SVIs can improve the sensitivity of the information contained in spectra through specific relational expressions and, to a certain extent, can reduce the impact of environmental factors, such as changes in illumination, with better stability [20,21]. It has been shown that SVIs have good potential for application in crop disease detection. For example, Abdulridha et al. [22] successfully detected and differentiated target spot and bacterial spot in tomatoes by constructing vegetation indices and concluded that the photochemical reflectance index (PRI) and chlorophyll index (CHl green) were effective in differentiating between the two tomato diseases under indoor and outdoor conditions. Su et al. [23] studied and analyzed winter wheat yellow rust using UAV multispectral imagery and concluded that ratio vegetation index (RVI), normalized difference vegetation index (NDVI), and optimized soil adjusted vegetation index (OSAVI) are the best SVIs for distinguishing between healthy and diseased plants. It was also shown that NIR and red wavelengths are the best spectral regions for detecting the disease. Abdulridha et al. [24] detected canker-infected citrus by UAV hyperspectral remote sensing, and comparative analysis concluded that the anthocyanin reflectance index (ARI) and transform chlorophyll absorption in reflectance index (TCARI) were the most promising vegetation indices for detecting canker-infected citrus among the 31 available vegetation indices. However, based on the fact that common conventional SVIs, although having variable responses to crop physiological and biochemical properties, are unable to characterize the specific spectral responses of host–pathogen interactions, they cannot quantitatively or qualitatively describe the response mechanism to a particular kind of disease, which, in turn, leads to a large error in large-area disease detection [4,25,26]. Therefore, developing specific SVIs applicable to a certain crop disease can be expected to quantify the disease detection process. And it can effectively simplify the spectral sensor.
In view of this, this study used UAV hyperspectral remote sensing to acquire hyperspectral images of rice leaf blast at different disease levels, including healthy, mild, and severe, under field conditions to analyze the variability of spectral responses to leaf blast infection at different disease levels and to develop targeted specific SVIs to improve the accuracy of remote sensing detection of rice diseases.

2. Materials and Methods

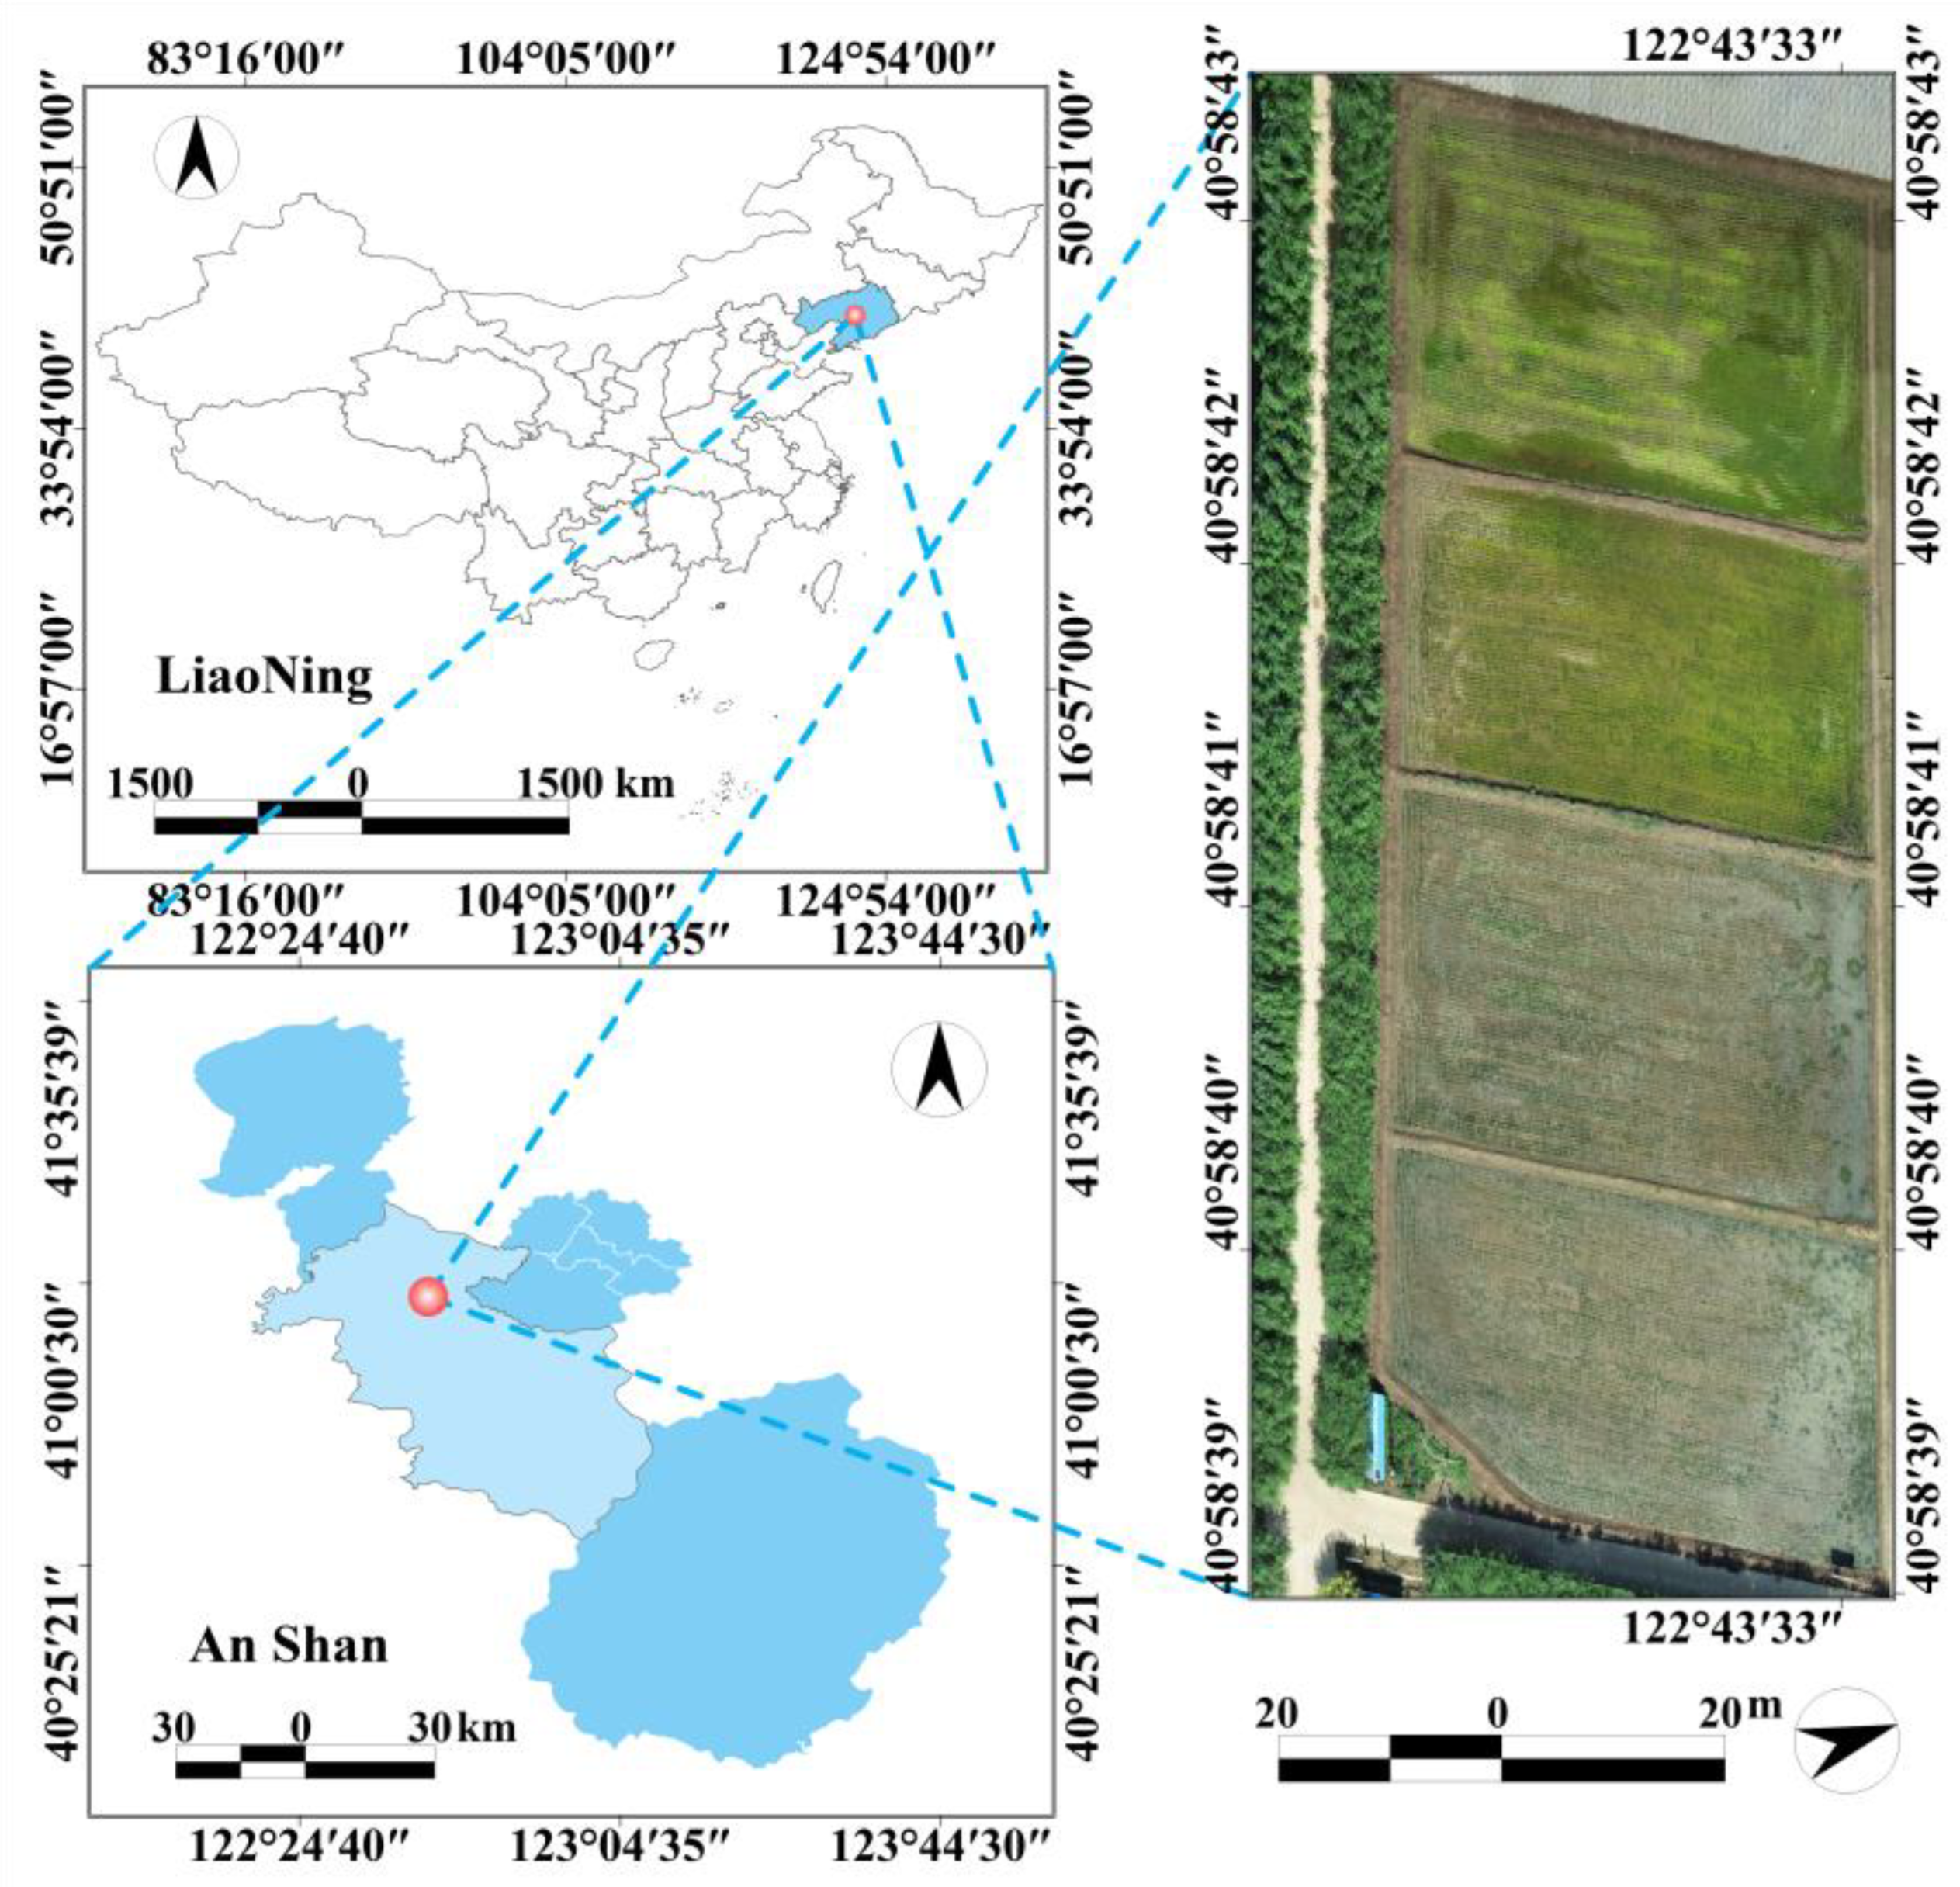
2.1. Experimental Setup

The rice leaf blast experiment was conducted in 2021–2022 at the experimental base of Shenyang Agricultural University in Haicheng City, Liaoning Province (122°43′32.39″ N, 40°58′42.24″ E), as shown in Figure 1. The area shown in the test plot belongs to the temperate monsoon climate zone, with an average annual temperature of 10.4 °C, rainfall of 721.3 mm, mild temperature, abundant rainfall, and a climate suitable for crop growth.
Artificial dyeing test plot (2021): the test plot area was 0.39 hm2, and Shennong 9816, which is sensitive to leaf blast, was selected as the test variety. Rice transplanting occurred on 25 May 2021 at a planting density of 30 cm × 17 cm, and nitrogen, phosphorus, and potash fertilizers were applied according to the local fertilization standards, which were 89, 40, and 53 kg/hm2, respectively. Leaf blast fungi cultivated indoors were mixed with water in a certain proportion to configure a spore suspension at a concentration of 9 mg/100 mL, and an artificial disease test was conducted at 5:00 p.m. on 6 July. In the field, the configured suspension was sprayed evenly onto the rice leaves until the rest spread over the leaves. Meanwhile, to promote rice disease, moist black plastic bags were used to wrap the rice until they were removed at 7 a.m. on the second day. We used manual spraying of disease control agents for prevention and control to prevent and control the disease in healthy rice plots, and other field management was normal. Five days after inoculation with the disease (11 July), rice in the inoculated area showed symptoms of leaf blast. With the assistance of plant protection staff, we began canopy hyperspectral image collection and ground survey of the extent of the disease.
Natural incidence area (2022): the test plot area was 0.39 hm2, and the planting rice variety was Yanfeng 47, producing a density of 30 cm × 20 cm. On 12 July 2022, under the detection of the plant protection staff, the field appeared to have a leaf blast disease infestation.

2.2. Data Acquisition

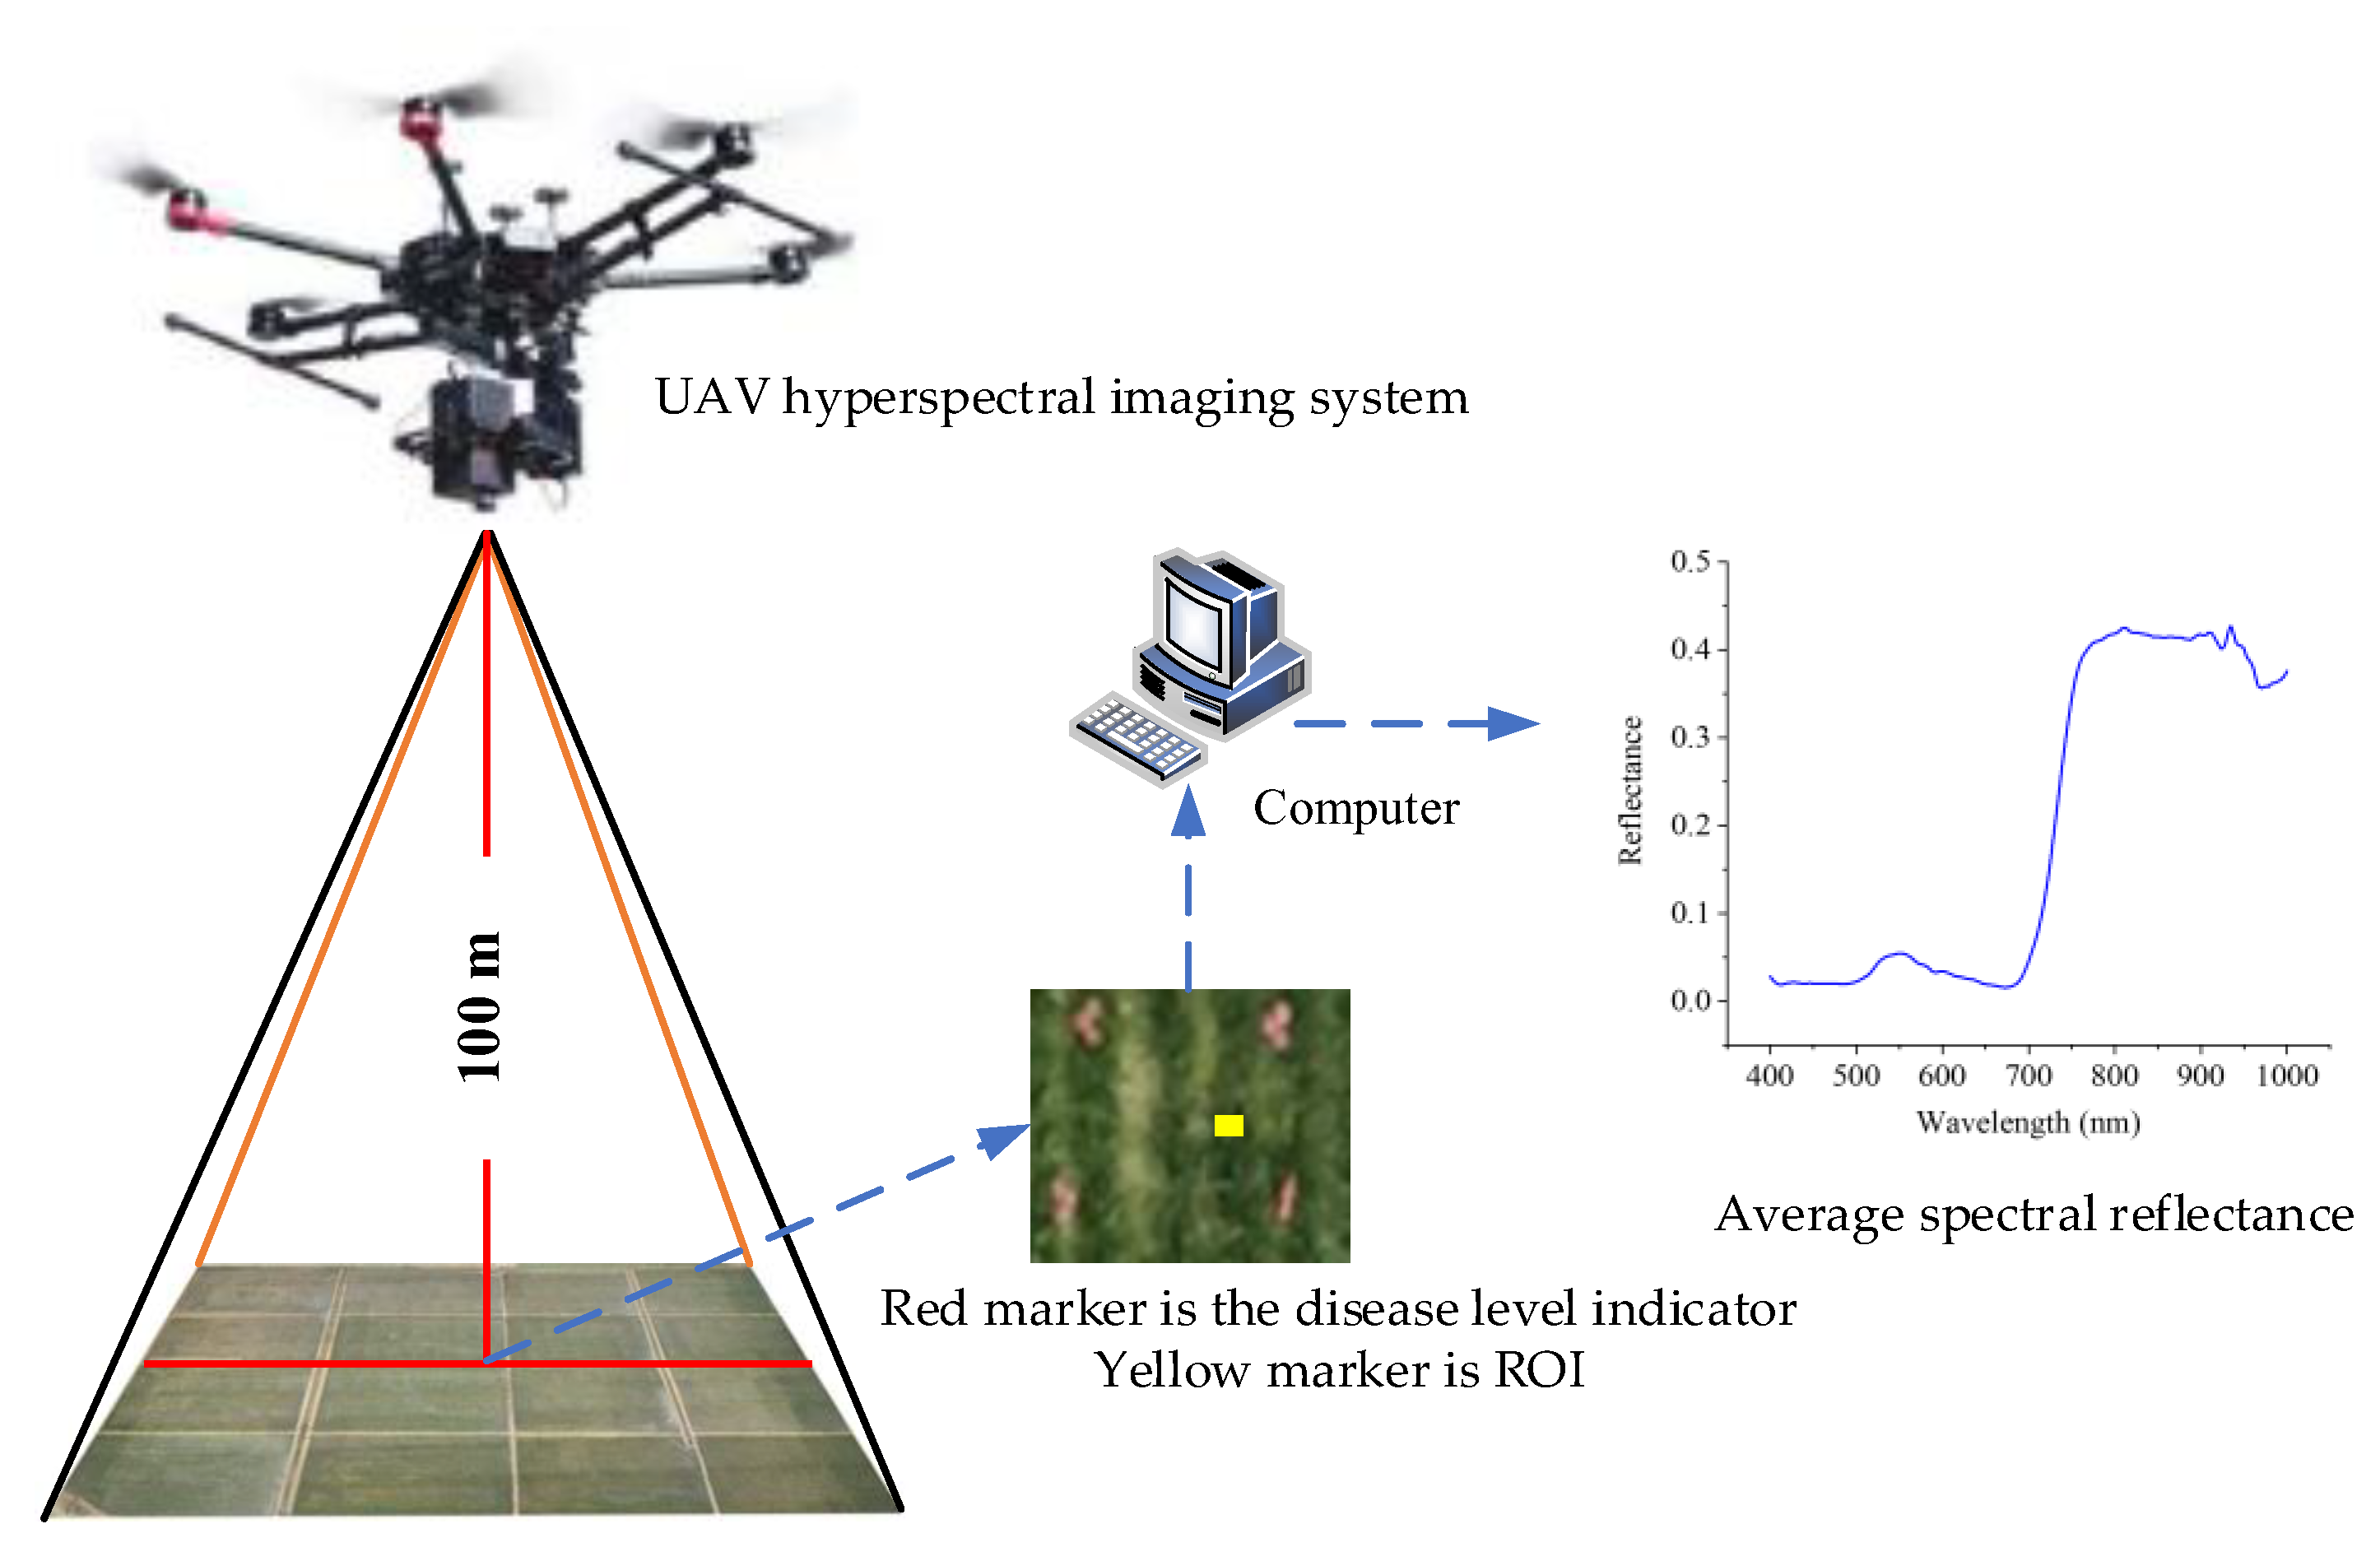
2.2.1. UAV Hyperspectral Remote Sensing Data Acquisition

A GaiaSky-mini2-VN hyperspectral imager from Sichuan Shuangli Hepu, China, was used to acquire hyperspectral images of rice at critical fertility stages (nodulation and pre-sprouting) in the field canopy using an M600 PRO six-rotor UAV from DJI, China (Figure 2). The spectral range is 400–1000 nm, with a resolution of 3.5 nm and a pixel pitch of 4.54 µm. The flight altitude of the UAV in the experiment was set at 100 m, and the hyperspectral image data acquisition was carried out when the weather was clear and cloudless. At the same time, data acquisition was concentrated between 11 a.m. and 1 p.m. to reduce the influence of external factors such as weather and lighting conditions. A black-and-white standard version of the hyperspectral imager must be calibrated before each acquisition of hyperspectral images.
Meanwhile, the calibrated whiteboard was arranged next to the rice field and photographed along with the area during the UAV flight to be used for atmospheric correction later. After hyperspectral image acquisition, each pixel point in the hyperspectral image was labeled using the classical normalized vegetation index (NDVI) to distinguish between the vegetation index region and non-vegetation region (water, soil, etc.), which served to remove the effect of water, soil, etc., on the extraction of the spectral reflectance of the vegetation. We used ENVI 5.3 software to create regions of interest (ROIs) in the healthy and diseased areas, and the mean value of the spectral reflectance of the pixels occupied by rice in each ROI was used as the spectral reflectance for that degree of disease. At the same time, the spectral reflectance using the SG smoothing method removed the effect of noise due to the environment, instrumentation, etc.

2.2.2. Ground Truth Data Survey

To obtain the disease levels of rice leaf blast in the canopy of the field, during the survey, we marked the survey area of early leaf blast in the field by GPS positioning and field markers (e.g., the marked area in Figure 2). Thirty rice leaves were randomly selected from different plants in the surveyed area. The surveyed leaves were evaluated for the level of disease by visual survey (classified into leaf disease levels of 0–5 based on the percentage of diseased spot areas on the leaves). Then, according to the “GTB 15790-2009 rules of investigation and forecast of the rice blast [27]”, the rice leaf disease level and the number of leaves with different levels in the region were counted, and the disease index (DI) was calculated. The formula of DI is shown below.
D I = n x i × D i n × D M ,
where x i is the number of diseases at all levels of rice leaves in the disease investigation area, D i is the representative value of disease degree at all levels, n investigates the total number of rice leaves, and D M is a representative value of the highest level of disease.
At the same time, we classified the disease level of leaf blast at the canopy scale according to the Chinese standard (GTB 15790-2009) [27] based on the disease index obtained from the calculation, and the specific disease level classification is shown in Table 1.
Ultimately, to ensure the validity and balance of the data for different disease levels, we obtained 720 data entries for the two years 2021 and 2022 (501 acquired in 2021 and 219 in 2022). Data on 167 asymptomatic, mild, and severe symptoms of infestation were obtained in 2021, respectively. And the data of 73 asymptomatic, mild, and severe symptom infestations were obtained in 2022, respectively.

2.3. Experimental Methods

2.3.1. Constructing the Leaf Blast Spectral Vegetation Index

SVIs can provide spectral reflectance changes caused by stress infestation in a highly intuitive and interpretable expression. Therefore, this study developed a leaf blast SVIS based on healthy, light, and heavy canopy-scale rice leaf blast spectral data to provide theoretical support for detecting early rice leaf blast in the field. In this study, the development of rice leaf blast SVIs at the low-altitude canopy scale consisted of three main steps: determining the leaf blast-sensitive spectral region, designing a computational expression for leaf blast SVIs, and screening optimal spectral features and analyzing the detection performance of SVIs.
First, we analyzed spectral data for different disease levels of leaf blast. As shown in Figure 3, under disease infestation, the average spectral reflectance curves of rice canopies with varying levels of disease showed some changes, and the spectral reflectance curves showed a flattening trend, especially in the red-edge region and near-infrared region. In the red-edge region, the slopes of the spectral reflectance curves of different degrees of disease showed a reduced performance compared to the healthy spectrum (Figure 3B). In the near-infrared region, on the other hand, the spectral reflectance gradually decreased as the degree of disease increased. As elaborated by Zhao et al. [28], due to the infestation of the disease, the cellular structure of the canopy leaves is damaged, multiple reflectance is reduced, the content of biochemical components such as chlorophyll is reduced, and anisotropy is not obvious, which in turn contributes to the significant changes in the spectra. The red-light region showed an opposite trend compared to the near-infrared region. As the degree of disease increases, the reflectance values in the red-light region show an increasing trend. At the same time, the change in the red-light region contributes to the gradual flattening of the spectral curve. Therefore, in the subsequent determination of the computational expressions and screening of the optimal spectral features of the SVIs of leaf blast, we mainly analyze the comparison from the red-light, red-edge, and near-infrared regions. At the same time, a comparative analysis of the spectral reflectance of different disease levels based on the spectral coefficient of variation (CV) showed that the CV for asymptomatic, mild, and severe symptoms was 0.1176, 0.1072, and 0.1045, respectively (the CVs for the different disease levels were all less than 0.15). The results show a variability in spectral reflectance for different disease levels and that the spectral reflectance is relatively stable.
Secondly, it can be seen from the above analysis of the changes in spectral reflectance of different disease levels that there is a significant difference between the visible region (390–760 nm) and the near-infrared region (760–1000 nm) in the hyperspectral spectrum of crop canopies. The spectral reflectance shows a trend of first low and then high changes, respectively. Because of the strong absorption in the visible region and high reflection in the near-infrared region, crop spectra are often used to enhance or characterize the implied crop information by performing various linear or nonlinear combinations of ratios, differences, normalization, etc., to form significant contrasts. Examples include difference vegetation index (DVI) and ratio vegetation index (RVI). DVI and RVI showed a gradual decrease with the increase in disease level. The reason for this is that when the leaf blast fungus interacts with rice, the color change at the spot with the disruption of the cellular structure leads to an increase in the reflectance in the red band and a decrease in the spectral reflectance in the near-infrared band [29]. As for the normalized vegetation index (NDVI), it can effectively reflect the health and growth of crops. In disease detection, NDVI can effectively detect the late symptoms of crop diseases, but the effect is not obvious for the early signs of diseases [30].
Meanwhile, in addition to the above combinations, spectral differential transformation processing is often used for the construction of SVIs, and spectral differentiation can significantly increase the feature differentiation between different disease levels in the red-edge region (680–760 nm), especially at the early stage of disease development [31,32]. The SVIs developed in this study were designed to detect rice leaf blast at different disease levels qualitatively. Hence, a combination of wavelength difference, wavelength ratio, and spectral differential transformations seems appropriate. We also performed normalized ratios for any two wavelengths, but the correlation with disease degree was poor.
Finally, combining the above analyses, we found that R N I R and ρ R e d e d g e had the same trend for different disease levels, while R N I R showed the opposite. At the same time, the two trends mentioned above can increase with the increase in disease severity (Red, Red-edge, and NIR represent the spectral wavelengths in the red, red-edge, and near-infrared regions, respectively; R and ρ represent the spectral reflectance and differential spectral reflectance, respectively). Therefore, from the above trends, we can conclude that as the severity of the disease advances, the value of R N I R R R e d will gradually decrease, showing a monotonically reducing change. Similarly, ρ R e d e d g e R R e d will have lower rates than healthy samples as the level of disease increases. Meanwhile, since the theoretical value of hyperspectral reflectance obtained by UAV hyperspectral remote sensing is between 0 and 1 (the hyperspectral reflectance in this study is between 0 and 0.6), there is an inconspicuous phenomenon of the degree of change in the values of R N I R R R e d and ρ R e d e d g e R R e d between health and mild symptoms, which can result in overlapping portions of the symptoms between health and mild symptoms. Therefore, we used the coefficient method to adjust the weight coefficient relationship between R N I R R R e d and ρ R e d e d g e R R e d , which in turn further improves the sensitivity and variability of vegetation indices to leaf blast disease infestation.
Therefore, based on the above forms of combining SVIs and the spectral response laws of different disease degrees, we constructed one leaf blast-specific SVI to increase the variability of the spectra of varying disease degrees, as shown in Equation (2). ( α and β are the weighting coefficients).
R B V I = α R N I R R R e d + β ρ R e d e d g e R R e d
To improve the robustness and transferability of the SVIs proposed in this study, we used Fisher’s discriminant analysis to screen the optimal and differential spectral wavelengths in the RBVI, respectively. The Fisher discriminant analysis method determines the differential spectral wavelengths with better separability. This method can classify points in high dimensional space by selecting the optimal direction and projecting them into low dimensional space, ensuring that the selected features have large interclass differences and small intraclass variations [33]. Meanwhile, an exhaustive algorithm was used to arbitrarily combine the spectral wavelengths in the visible and near-infrared regions to screen the spectral wavelengths with the best correlation. To determine the ability of the proposed RBVI to detect diseases, we analyzed the proposed RBVI in comparison with conventional SVIs (shown in Table S1).

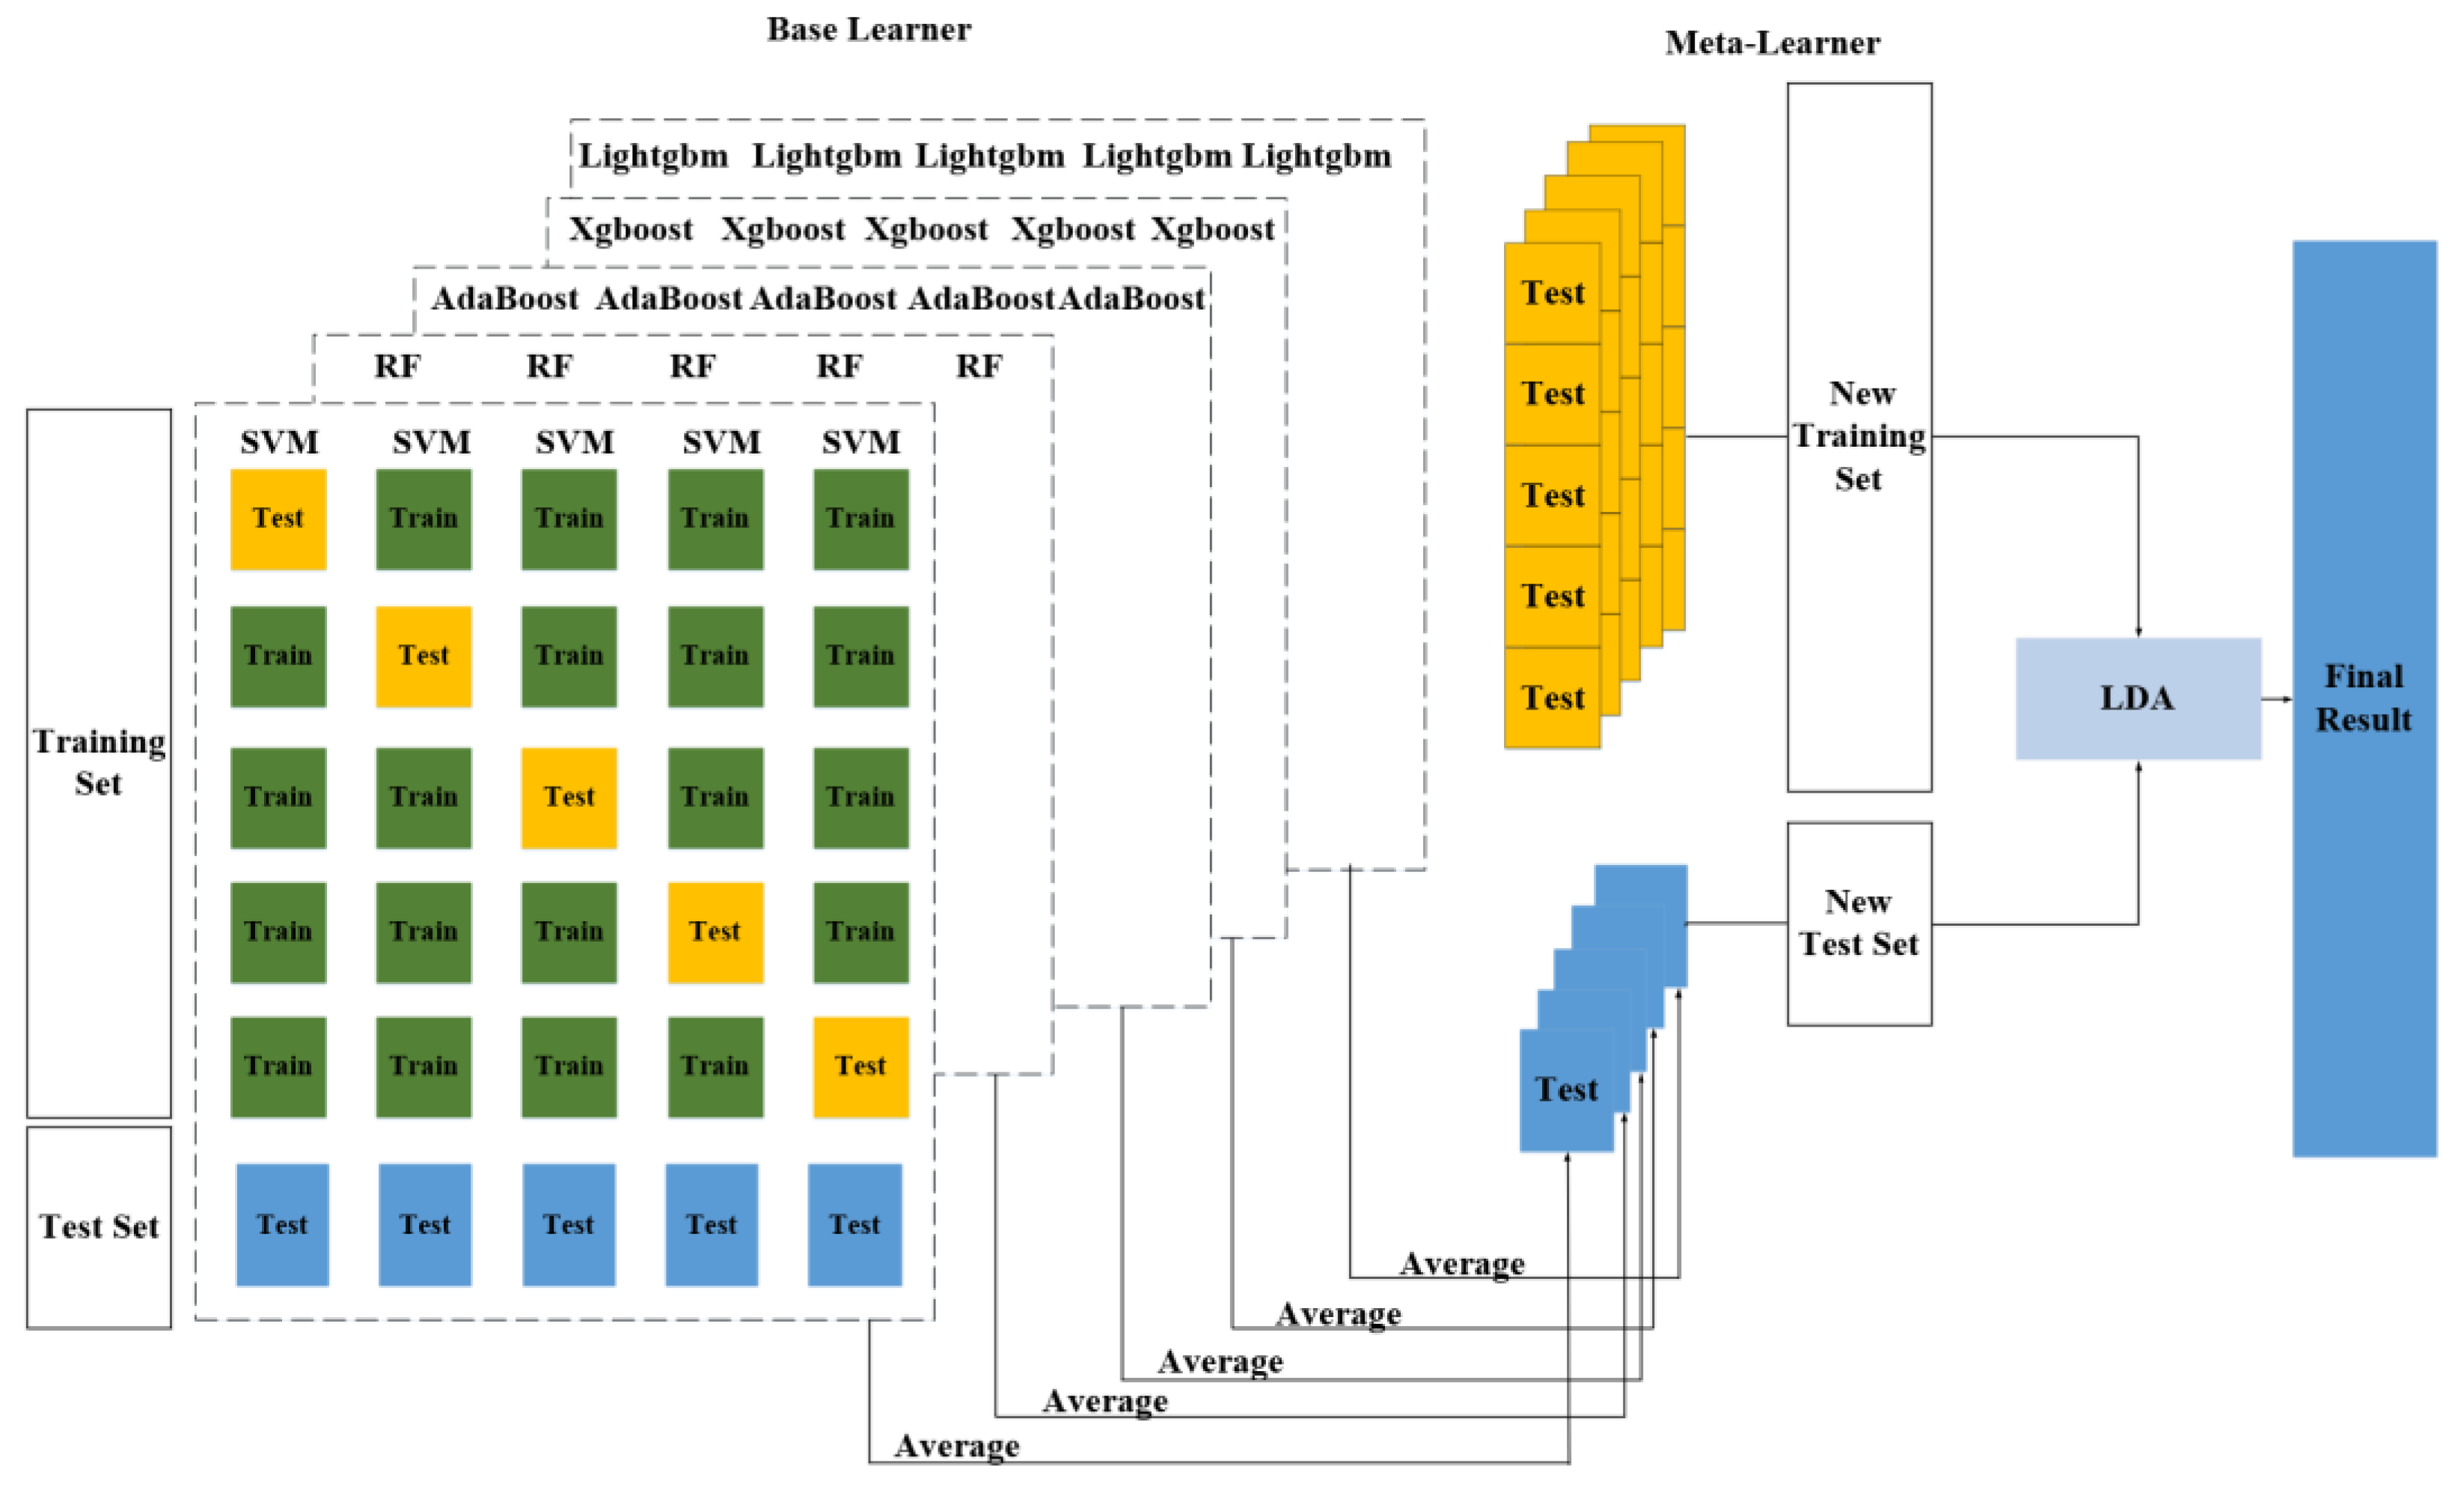
2.3.2. Stacking Integrated Learning Detection Models

The stacking integrated learning model consists of a base learner and a meta-learner, which combine multiple base learner models and a meta-learner to obtain a strong learner with high stability and accuracy. To improve the accuracy of UAV hyperspectral remote sensing for detecting rice leaf blast, each base learner applies its machine learning algorithm to process the training data separately. Then, multiple machine learning algorithms are fused according to the stacking integrated learning fusion strategy to obtain a strong learner with a better detection effect, as shown in Figure 4. At the same time, stacking integrated learning can gather the advantages of individual machine learning algorithms and make up for the shortcomings of some algorithms in terms of accuracy and stability, improving the robustness and generalization of the detection model. Given this, we choose five detection models, including random forest (RF) [34], support vector machine (SVM) [35], AdaBoost [36], Lightgbm [37], and Xgboost [38], which have strong learning ability and good generalization, as the base learners. The selection of simple and stable machine learning algorithms for the meta-learner can effectively improve the accuracy of disease detection to avoid the risk of overfitting, so we chose linear discriminant analysis (LDA) as the meta-learner. At the same time, the combination of the prediction results of all base learners was used to train the meta-learner, and the model results of the meta-learner were used as the final detection results and compared and analyzed with the RF, SVM, AdaBoost, Lightgbm, and XgBoost models.
The specific steps of the algorithm are as follows: (1) the original data are divided into training and test sets; (2) each base learner is trained and learned using 5-fold cross-validation, and the prediction results are used as the training set for the meta-learner; (3) the divided test set is input into the base learner for testing, and the test results are averaged as the new test set; (4) the newly constructed training and test sets are inputted into the meta-learner for training, and the obtained test results are the final test results.

2.3.3. Evaluation Indicators

To evaluate the accuracy of the constructed model, overall accuracy (OA), Kappa coefficient, user’s accuracy (UA), and producer’s accuracy (PA) were used as the evaluation metrics of the model (As shown in Table 2). The above metrics were calculated based on true positive (TP), true negative (TN), false positive (FP), and false negative (FN) values. The specific calculation formula is as follows:
O A = T P + T N T P + T N + F P + F N
p e = i = 1 m ( T P i + F N i ) ( T P i + F P i ) N 2
K a p p a = O A p e 1 p e

3. Results and Analysis

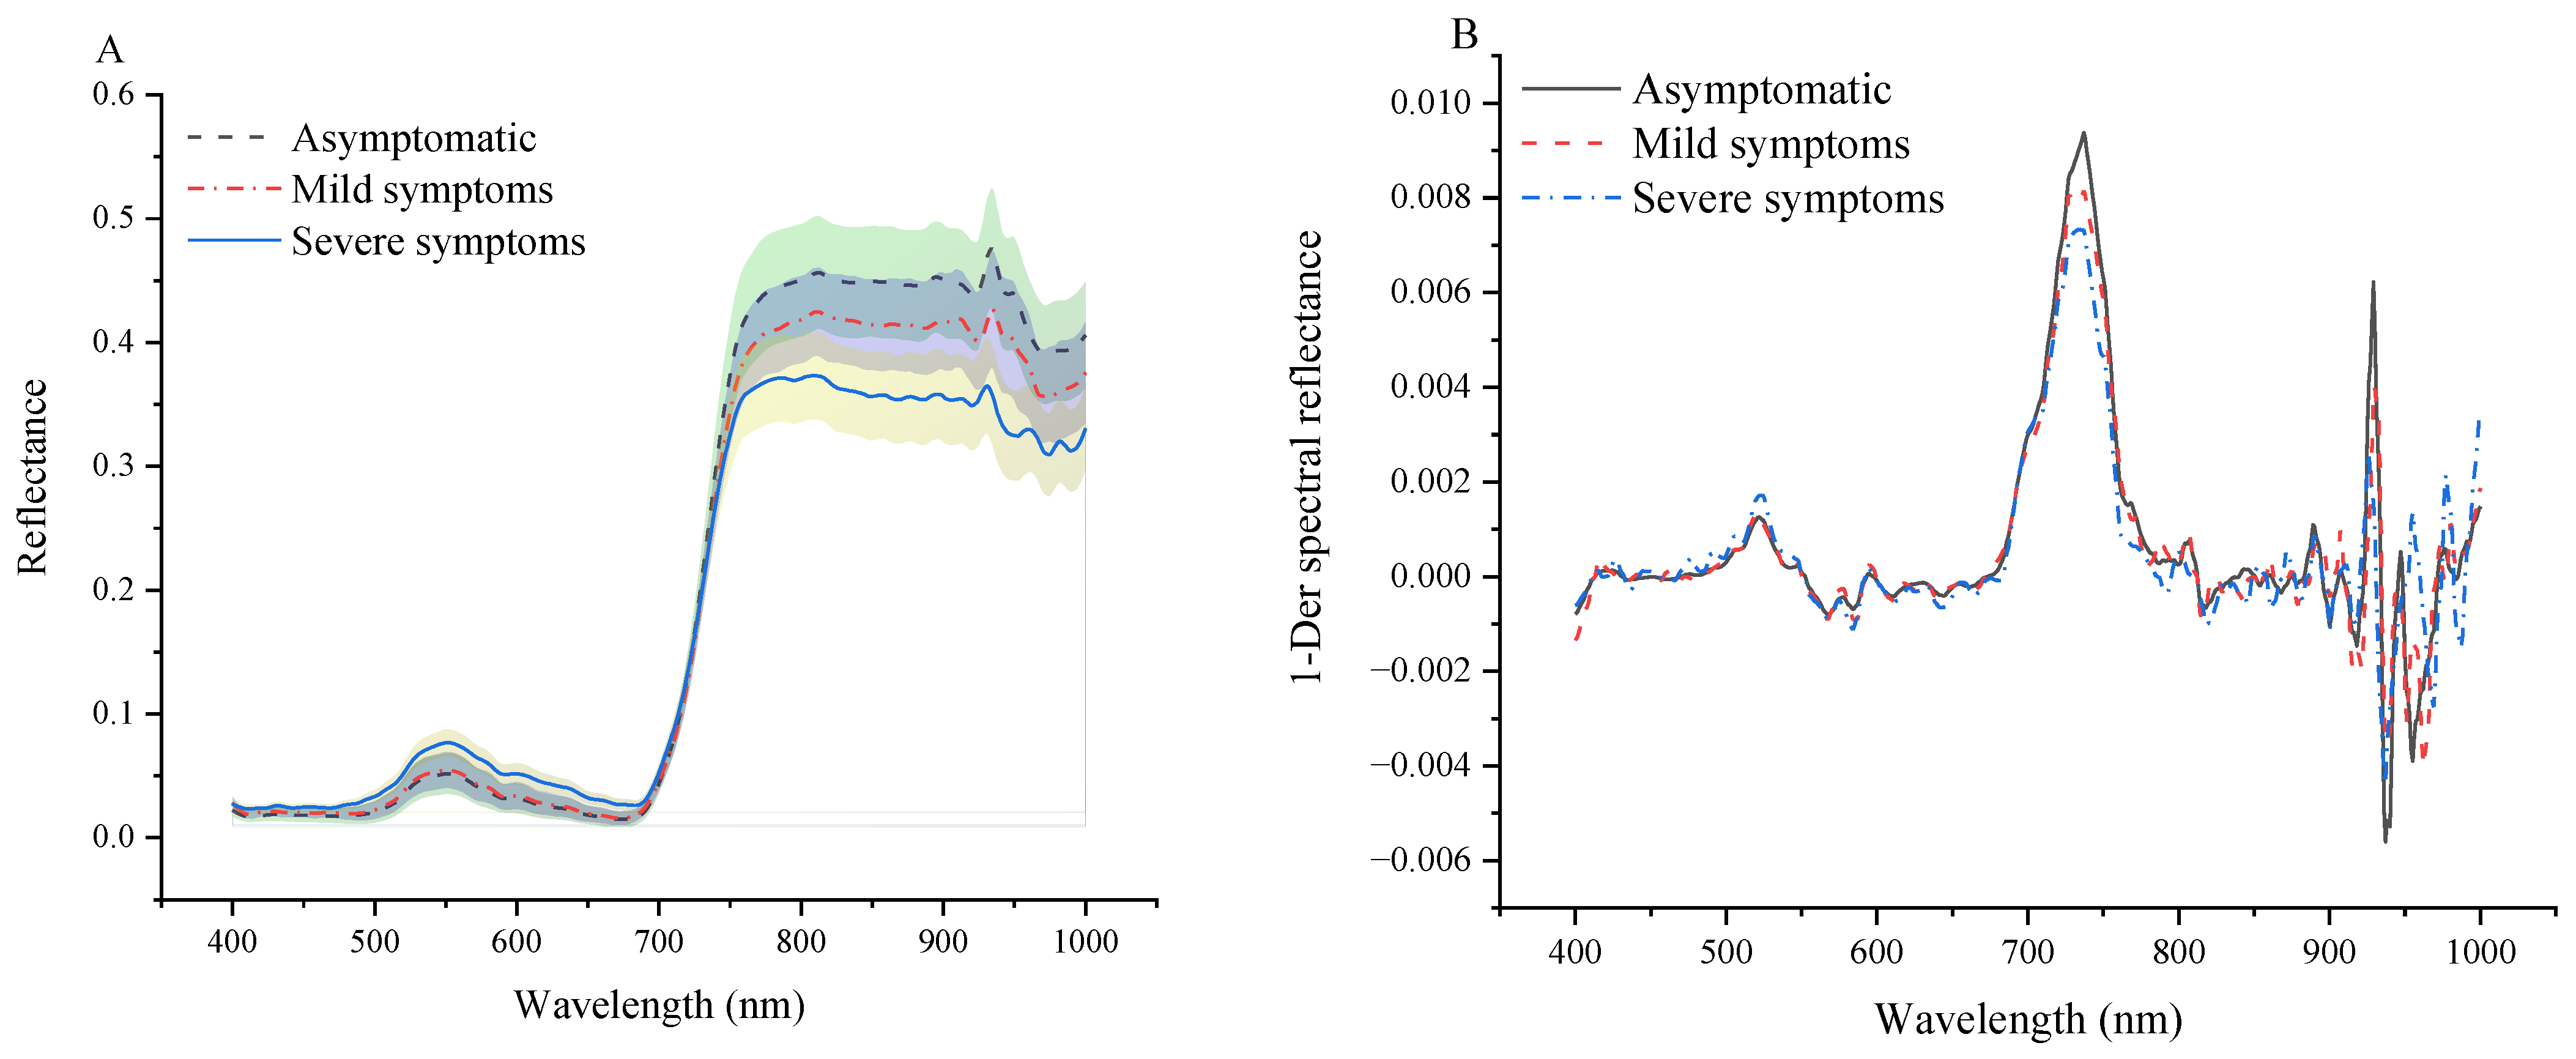
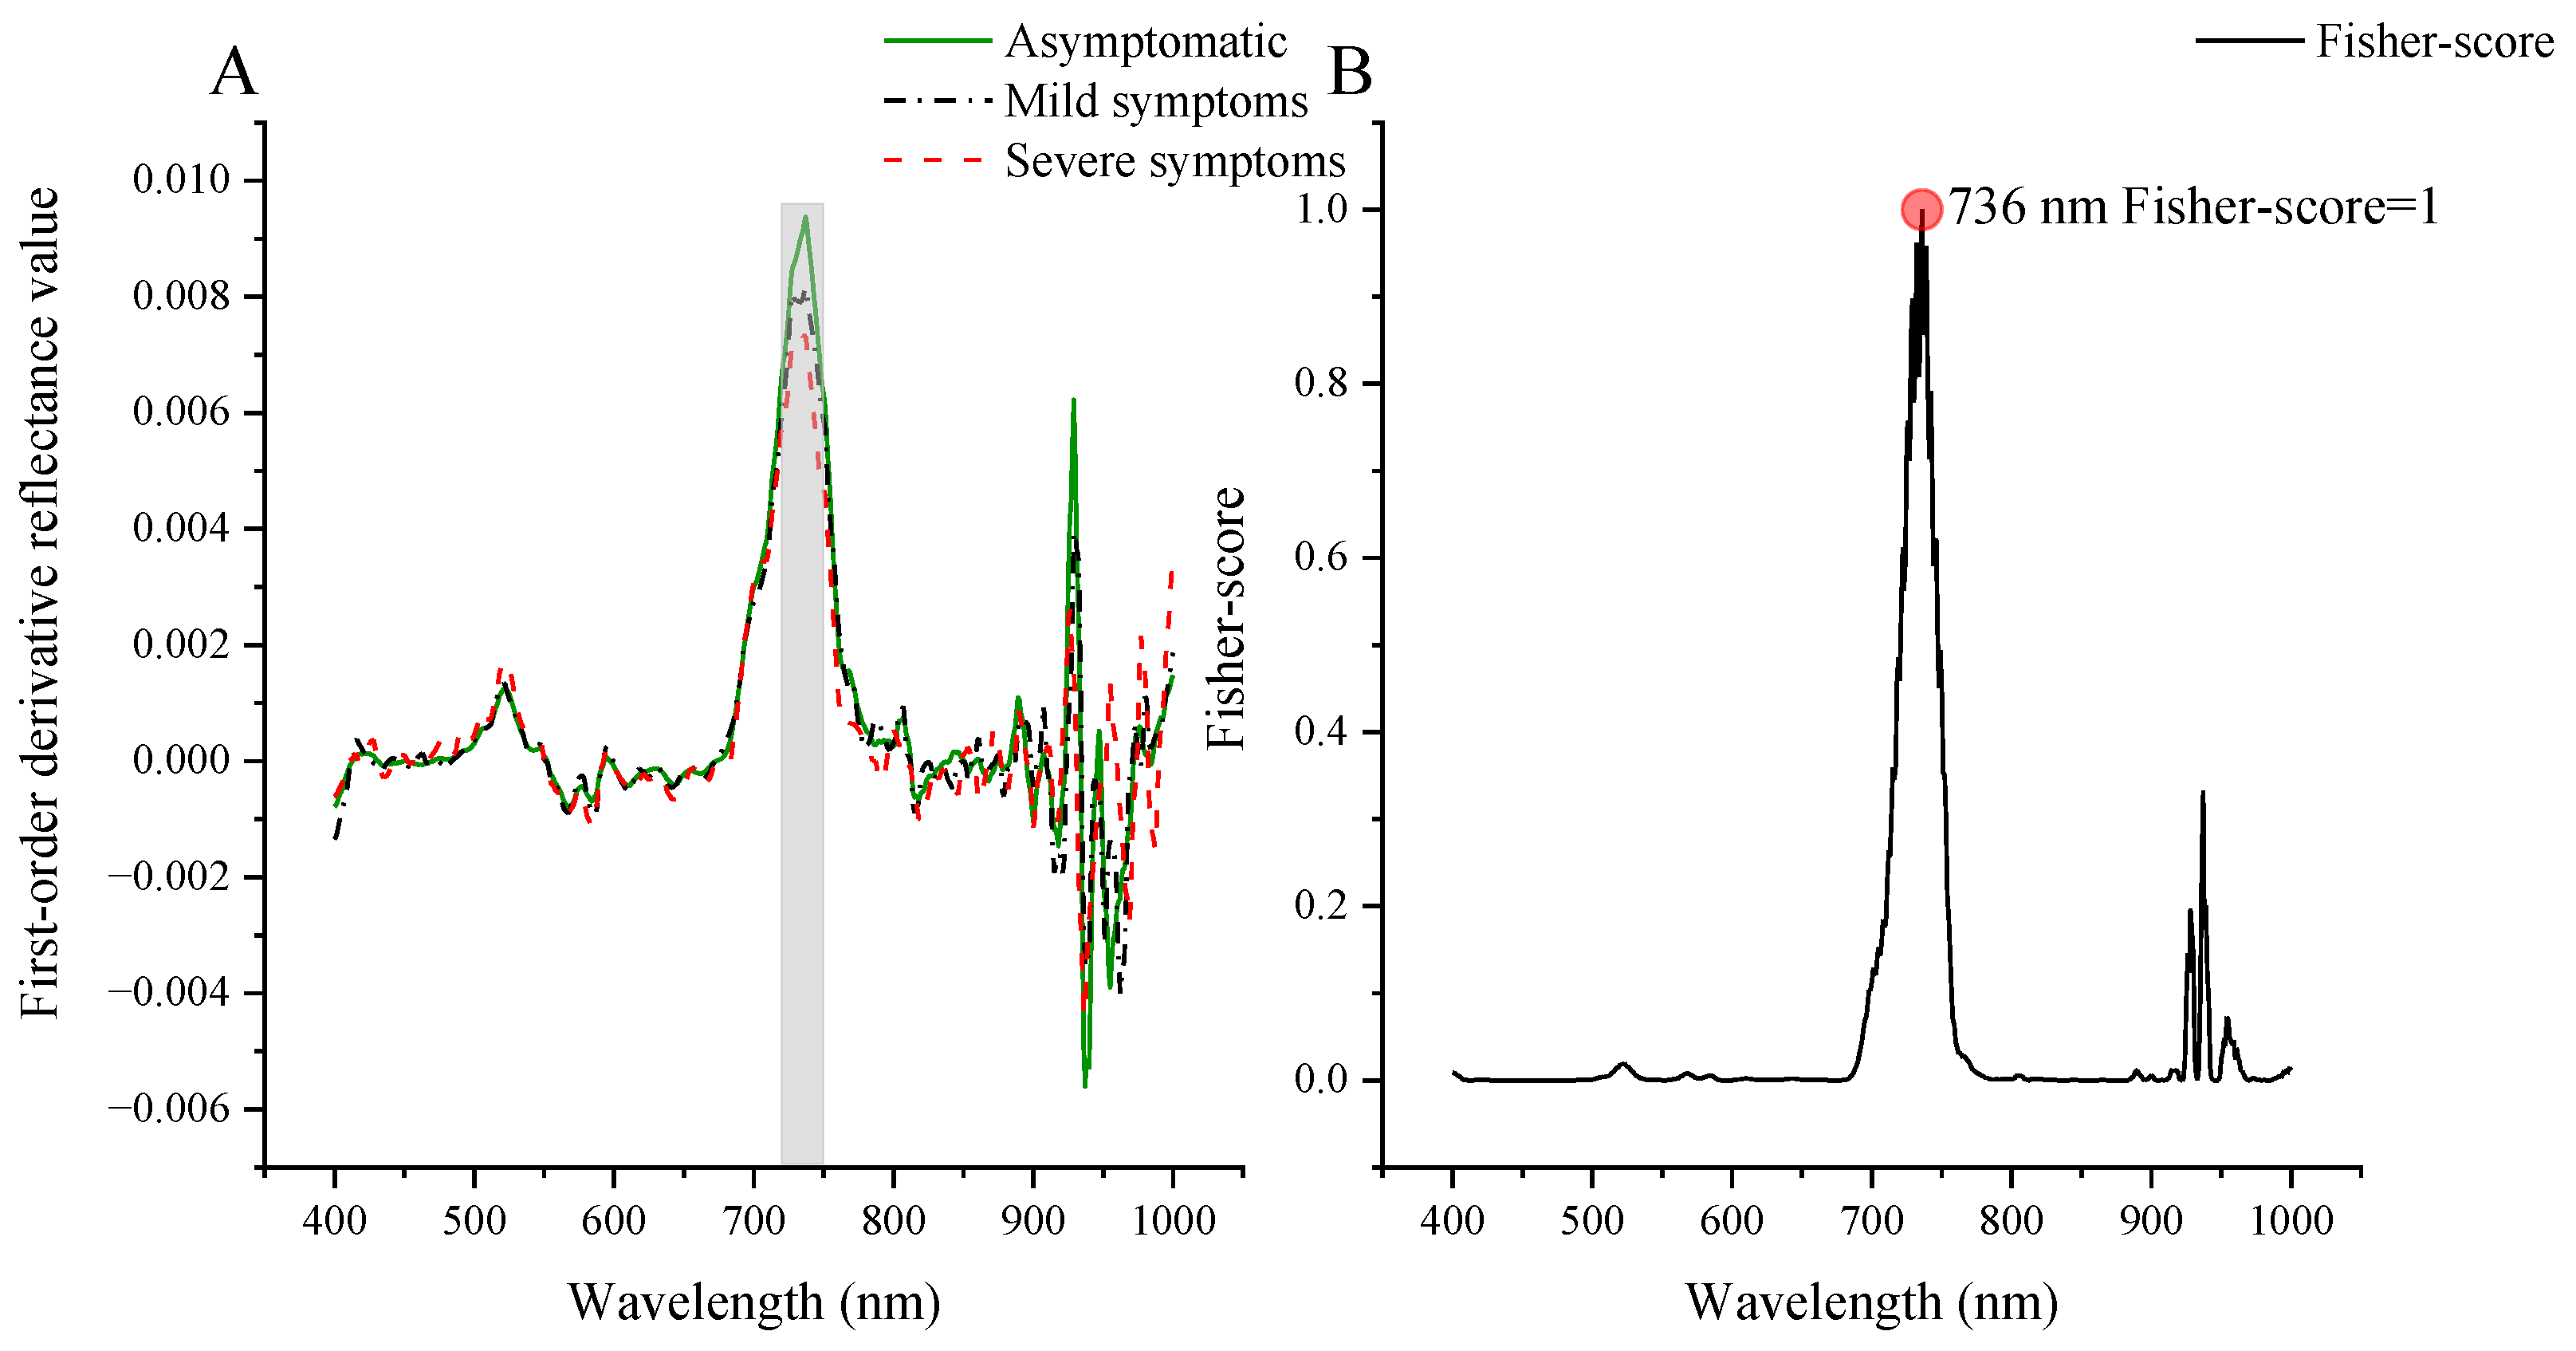
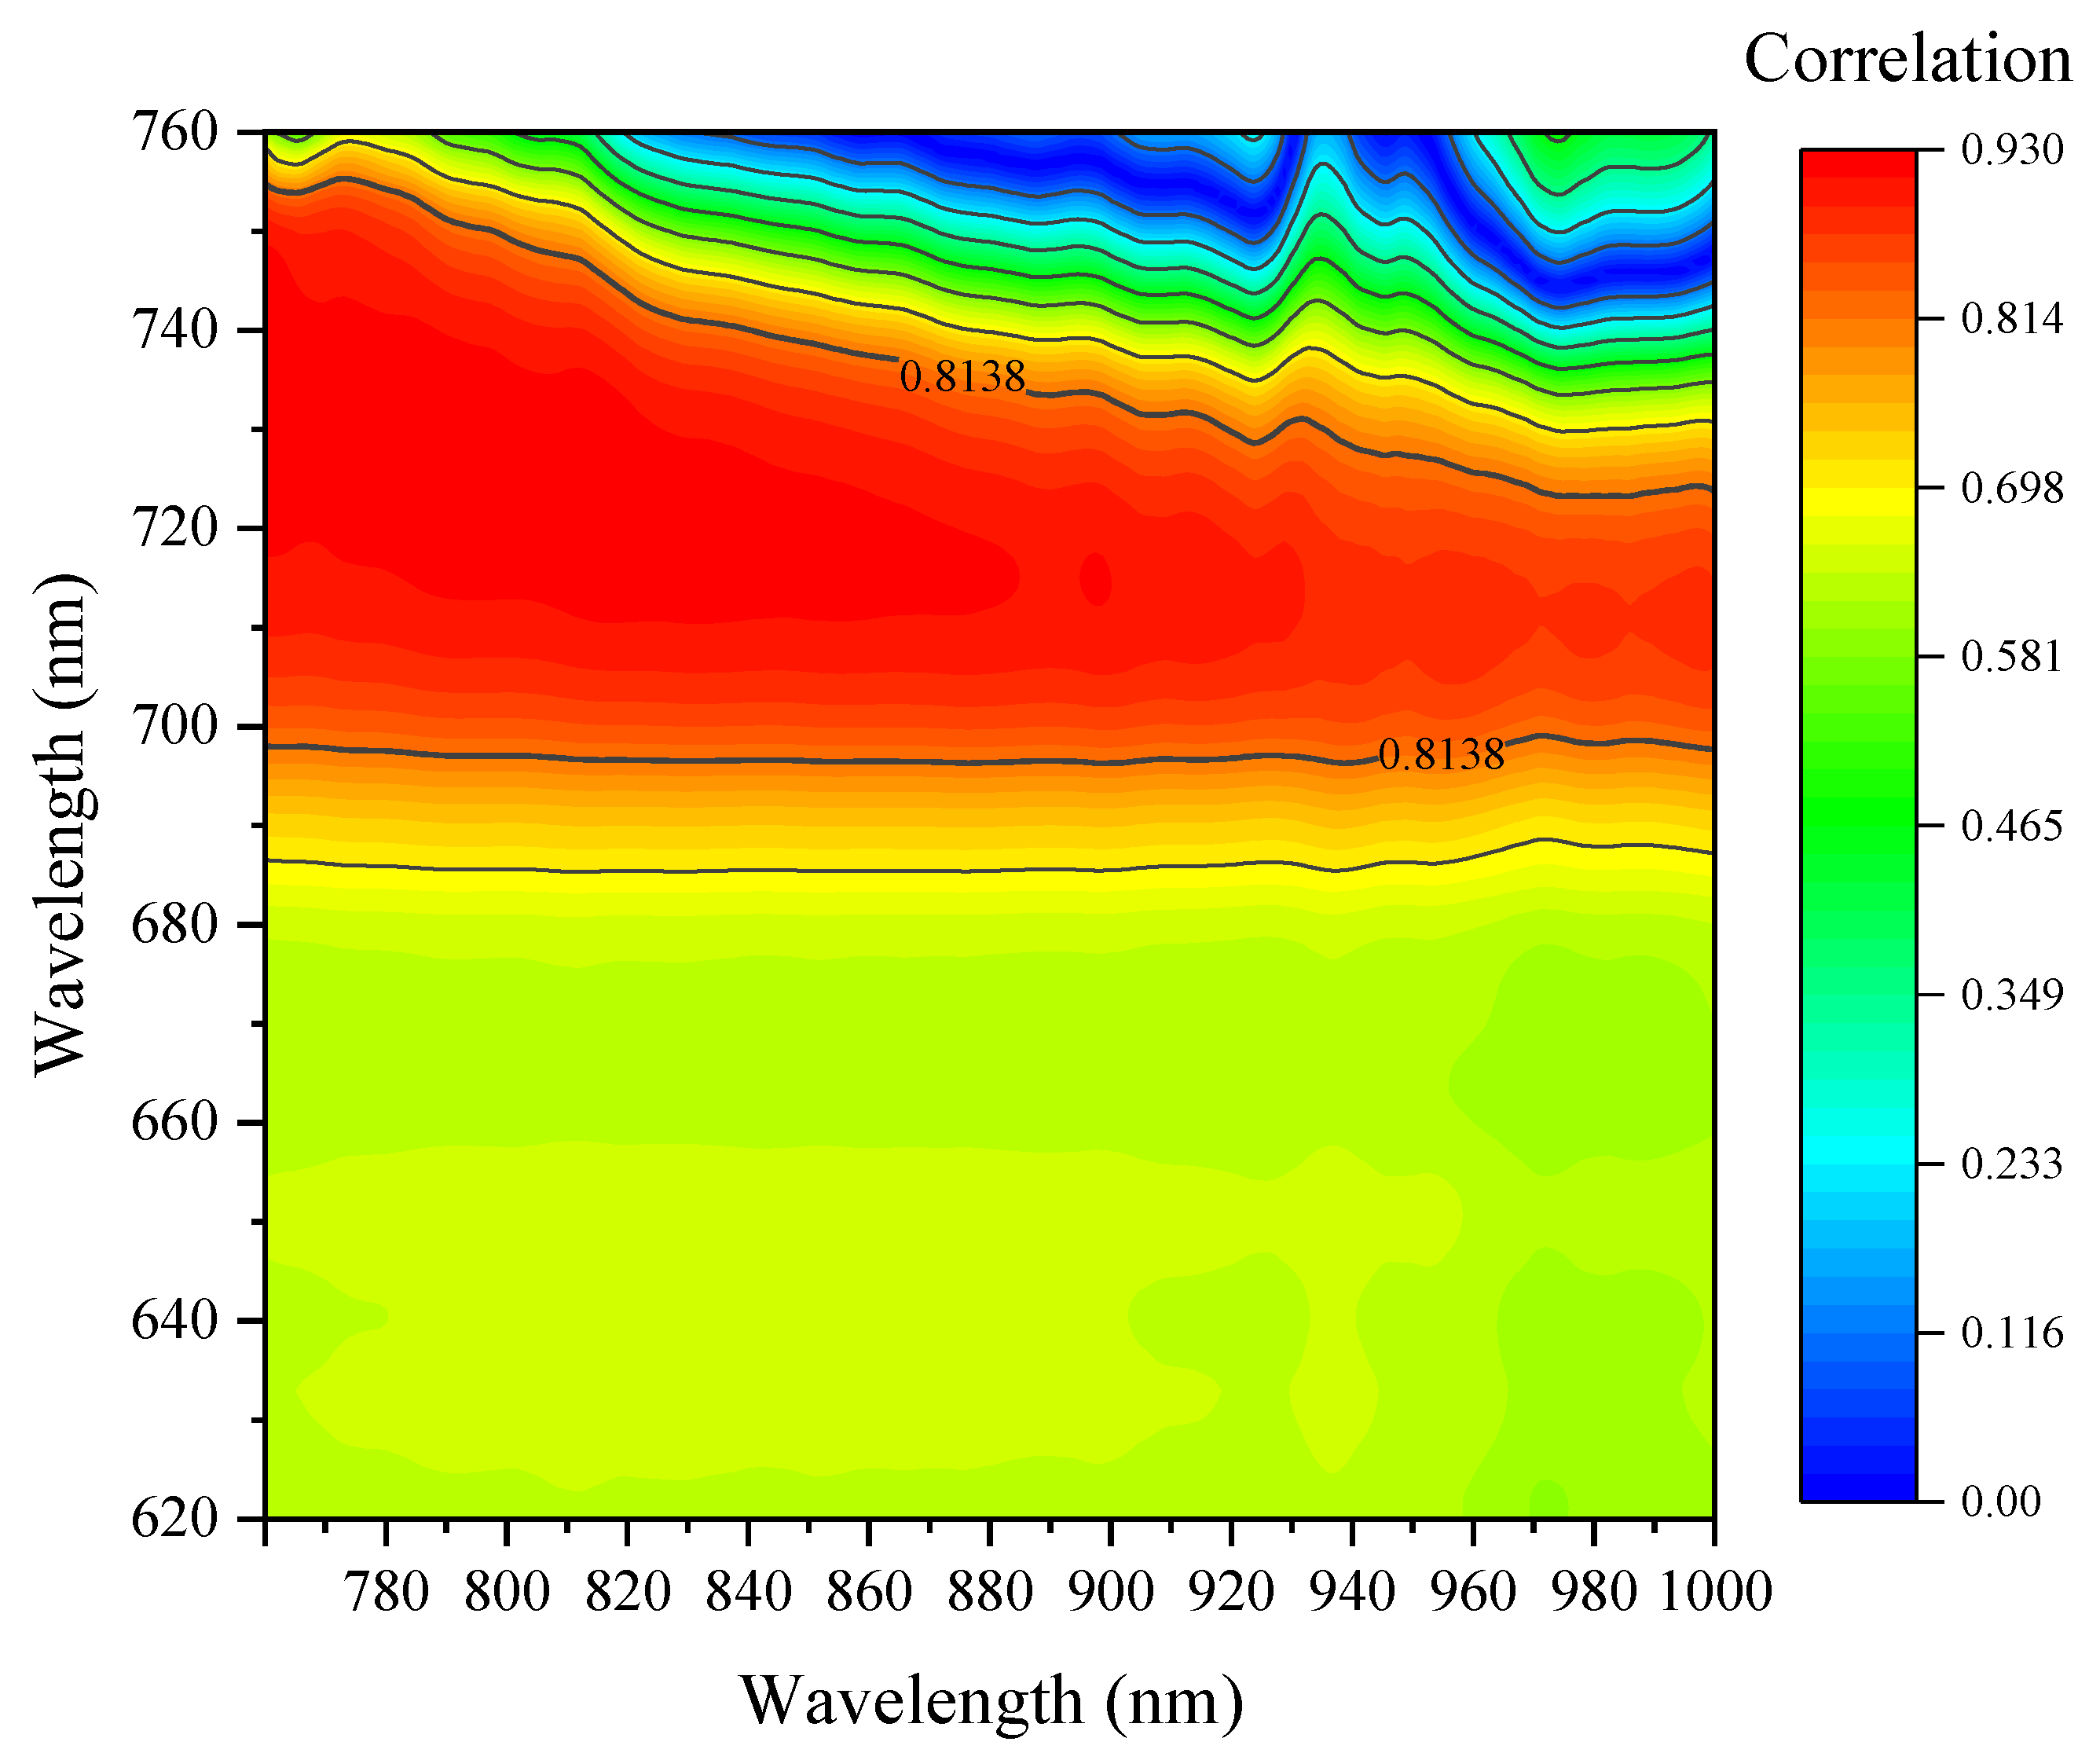
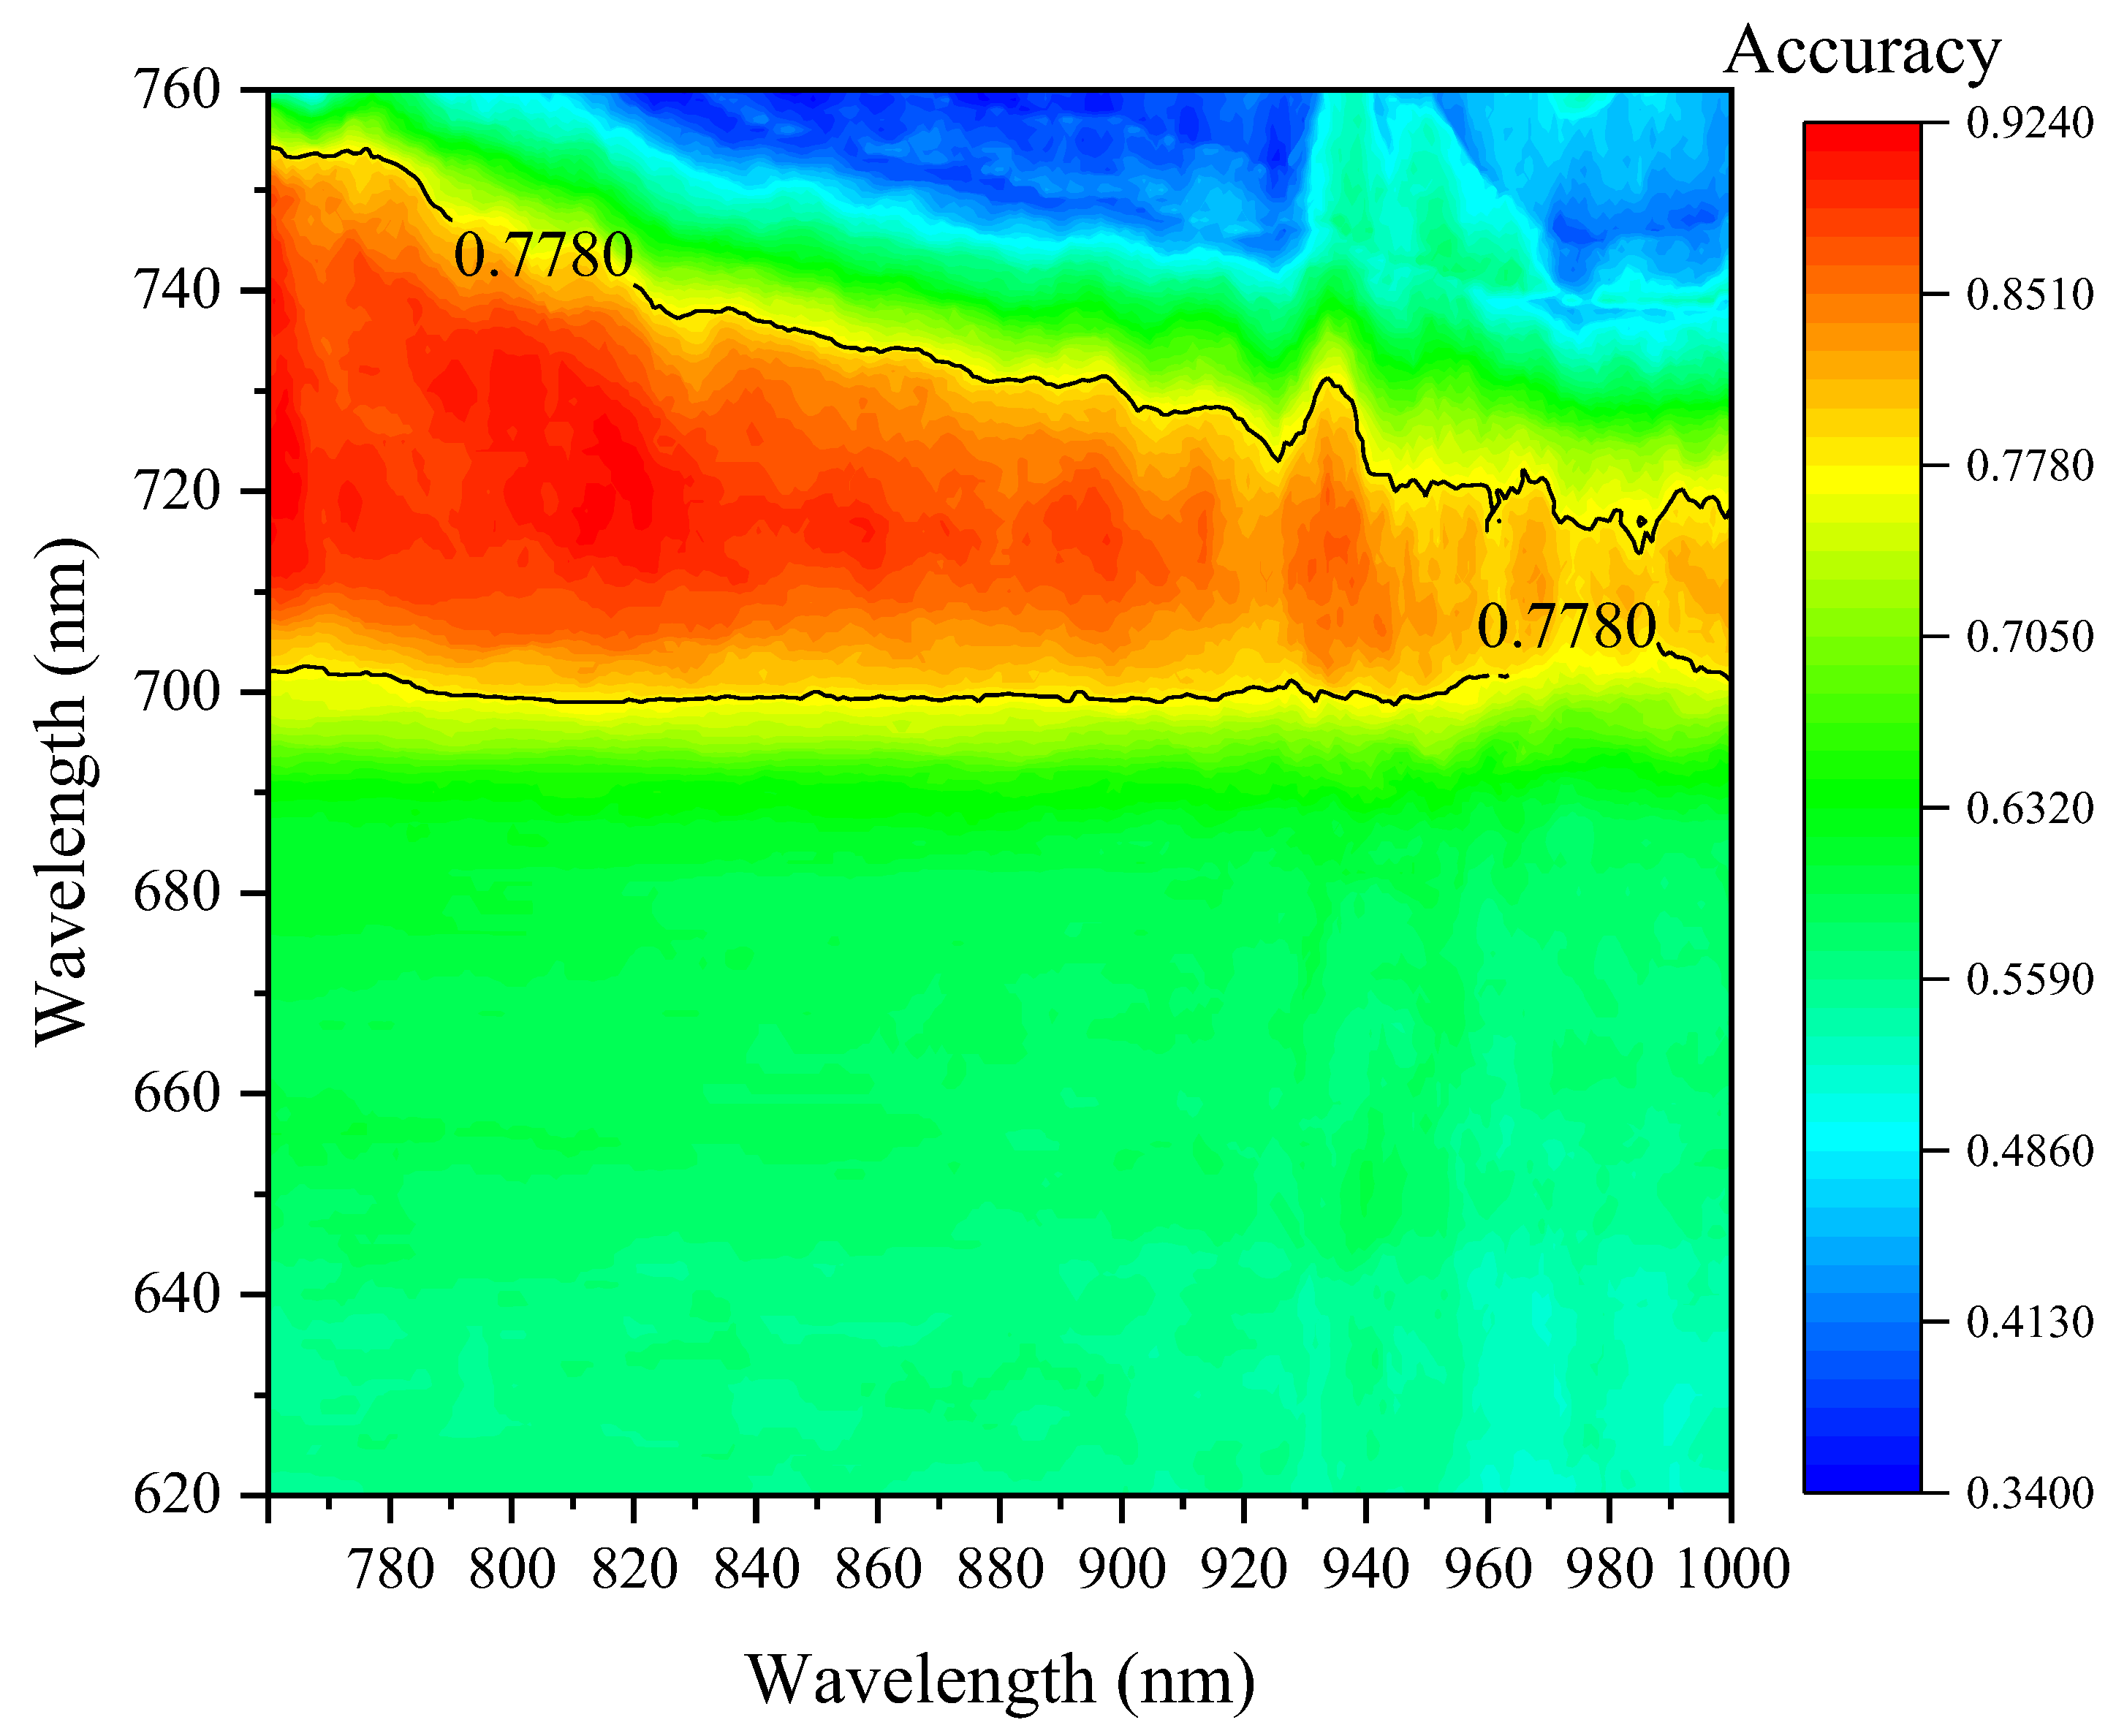
3.1. Construction of a New Spectral Vegetation Index

The process of determining the red wavelengths, near-infrared wavelengths, and red-edge wavelengths of the differential spectra in the newly constructed RBVI can be divided into three steps. First, Fisher discriminant analysis is used to determine the separability of each wavelength in the first-order differential spectrum to filter the best ρ R e d e d g e , as shown in Figure 5. In Figure 5A, we can tentatively determine that the first-order differential spectra of different disease levels have significant variability in the 720–750 nm interval. However, from Figure 5A, we cannot determine exactly the spectral wavelength corresponding to the peaks with the best separability. The reason is that the average first-order differential spectroscopy curves of different disease levels can only present rough features and not characterize all curve features. Therefore, the first-order differential spectra were statistically analyzed using Fisher discriminant analysis to screen the optimal first-order differential spectral wavelengths. As shown in Figure 5B, the Fisher discriminant analysis was modeled over the entire differential spectral region to obtain the weighting coefficients at every other differential spectral wavelength. The results show that the weighting coefficient curves of all differential spectral wavelengths are highly similar to the average differential spectral curves, especially in the red-edge and near-infrared regions. Among them, the highest peak value is presented at 736 nm in the red-edge region (Fisher score = 1). Therefore, ρ 736 was determined to have the best separability and was screened as the best feature of the differential spectrum for calculating the RBVI.
Secondly, an exhaustive algorithm was used to determine the optimal wavelength combinations of R R e d and R N I R in the ranges of 620–760 nm and 760–1000 nm, respectively, to obtain SVIs that are sensitive to leaf blast at different disease levels, as shown in Figure 6.
As can be seen in Figure 6, the sum of R N I R R R e d and ρ R e d e d g e R R e d constructed from R R e d and R N I R acquired in the spectral ranges of 698–756 nm vs. 760–1000 nm had a high correlation with the degree of disease (correlation: 0.8138–0.930). The highest correlation was achieved when R R e d and R N I R were chosen as 724 nm and 816 nm, respectively, with a correlation of 0.9257. At the same time, to further validate and select 724 nm and 816 nm, respectively, for the separability in recognizing different disease levels of leaf blast, we constructed the LDA model by using the exhaustive method in the red and near-infrared regions to judge the best wavelength selection, as shown in Figure 7. We obtained high accuracy (OA > 88.75%) in recognizing leaf blast in the field with different disease levels by obtaining R N I R and R N I R in the 710–747 nm and 760–865 nm range, respectively. The best detection accuracy (OA = 92.22%) was obtained when R N I R and R N I R were chosen as 724 nm and 816 nm, respectively. After verifying all possible spectral wavelengths, R N I R and R N I R were determined to be 724 nm and 816 nm, respectively.
Finally, we determined the weight coefficients by fitting Fisher’s linear discriminant to the training dataset. We concluded that the RBVI achieved the best correlation (correlation: 0.9381) when α and β were 9.78 and −2.08, respectively. The RBVI was finally determined, as shown in Equation (6).
R B V I = 9.78 R 816 R 724 2.08 ρ 736 R 724

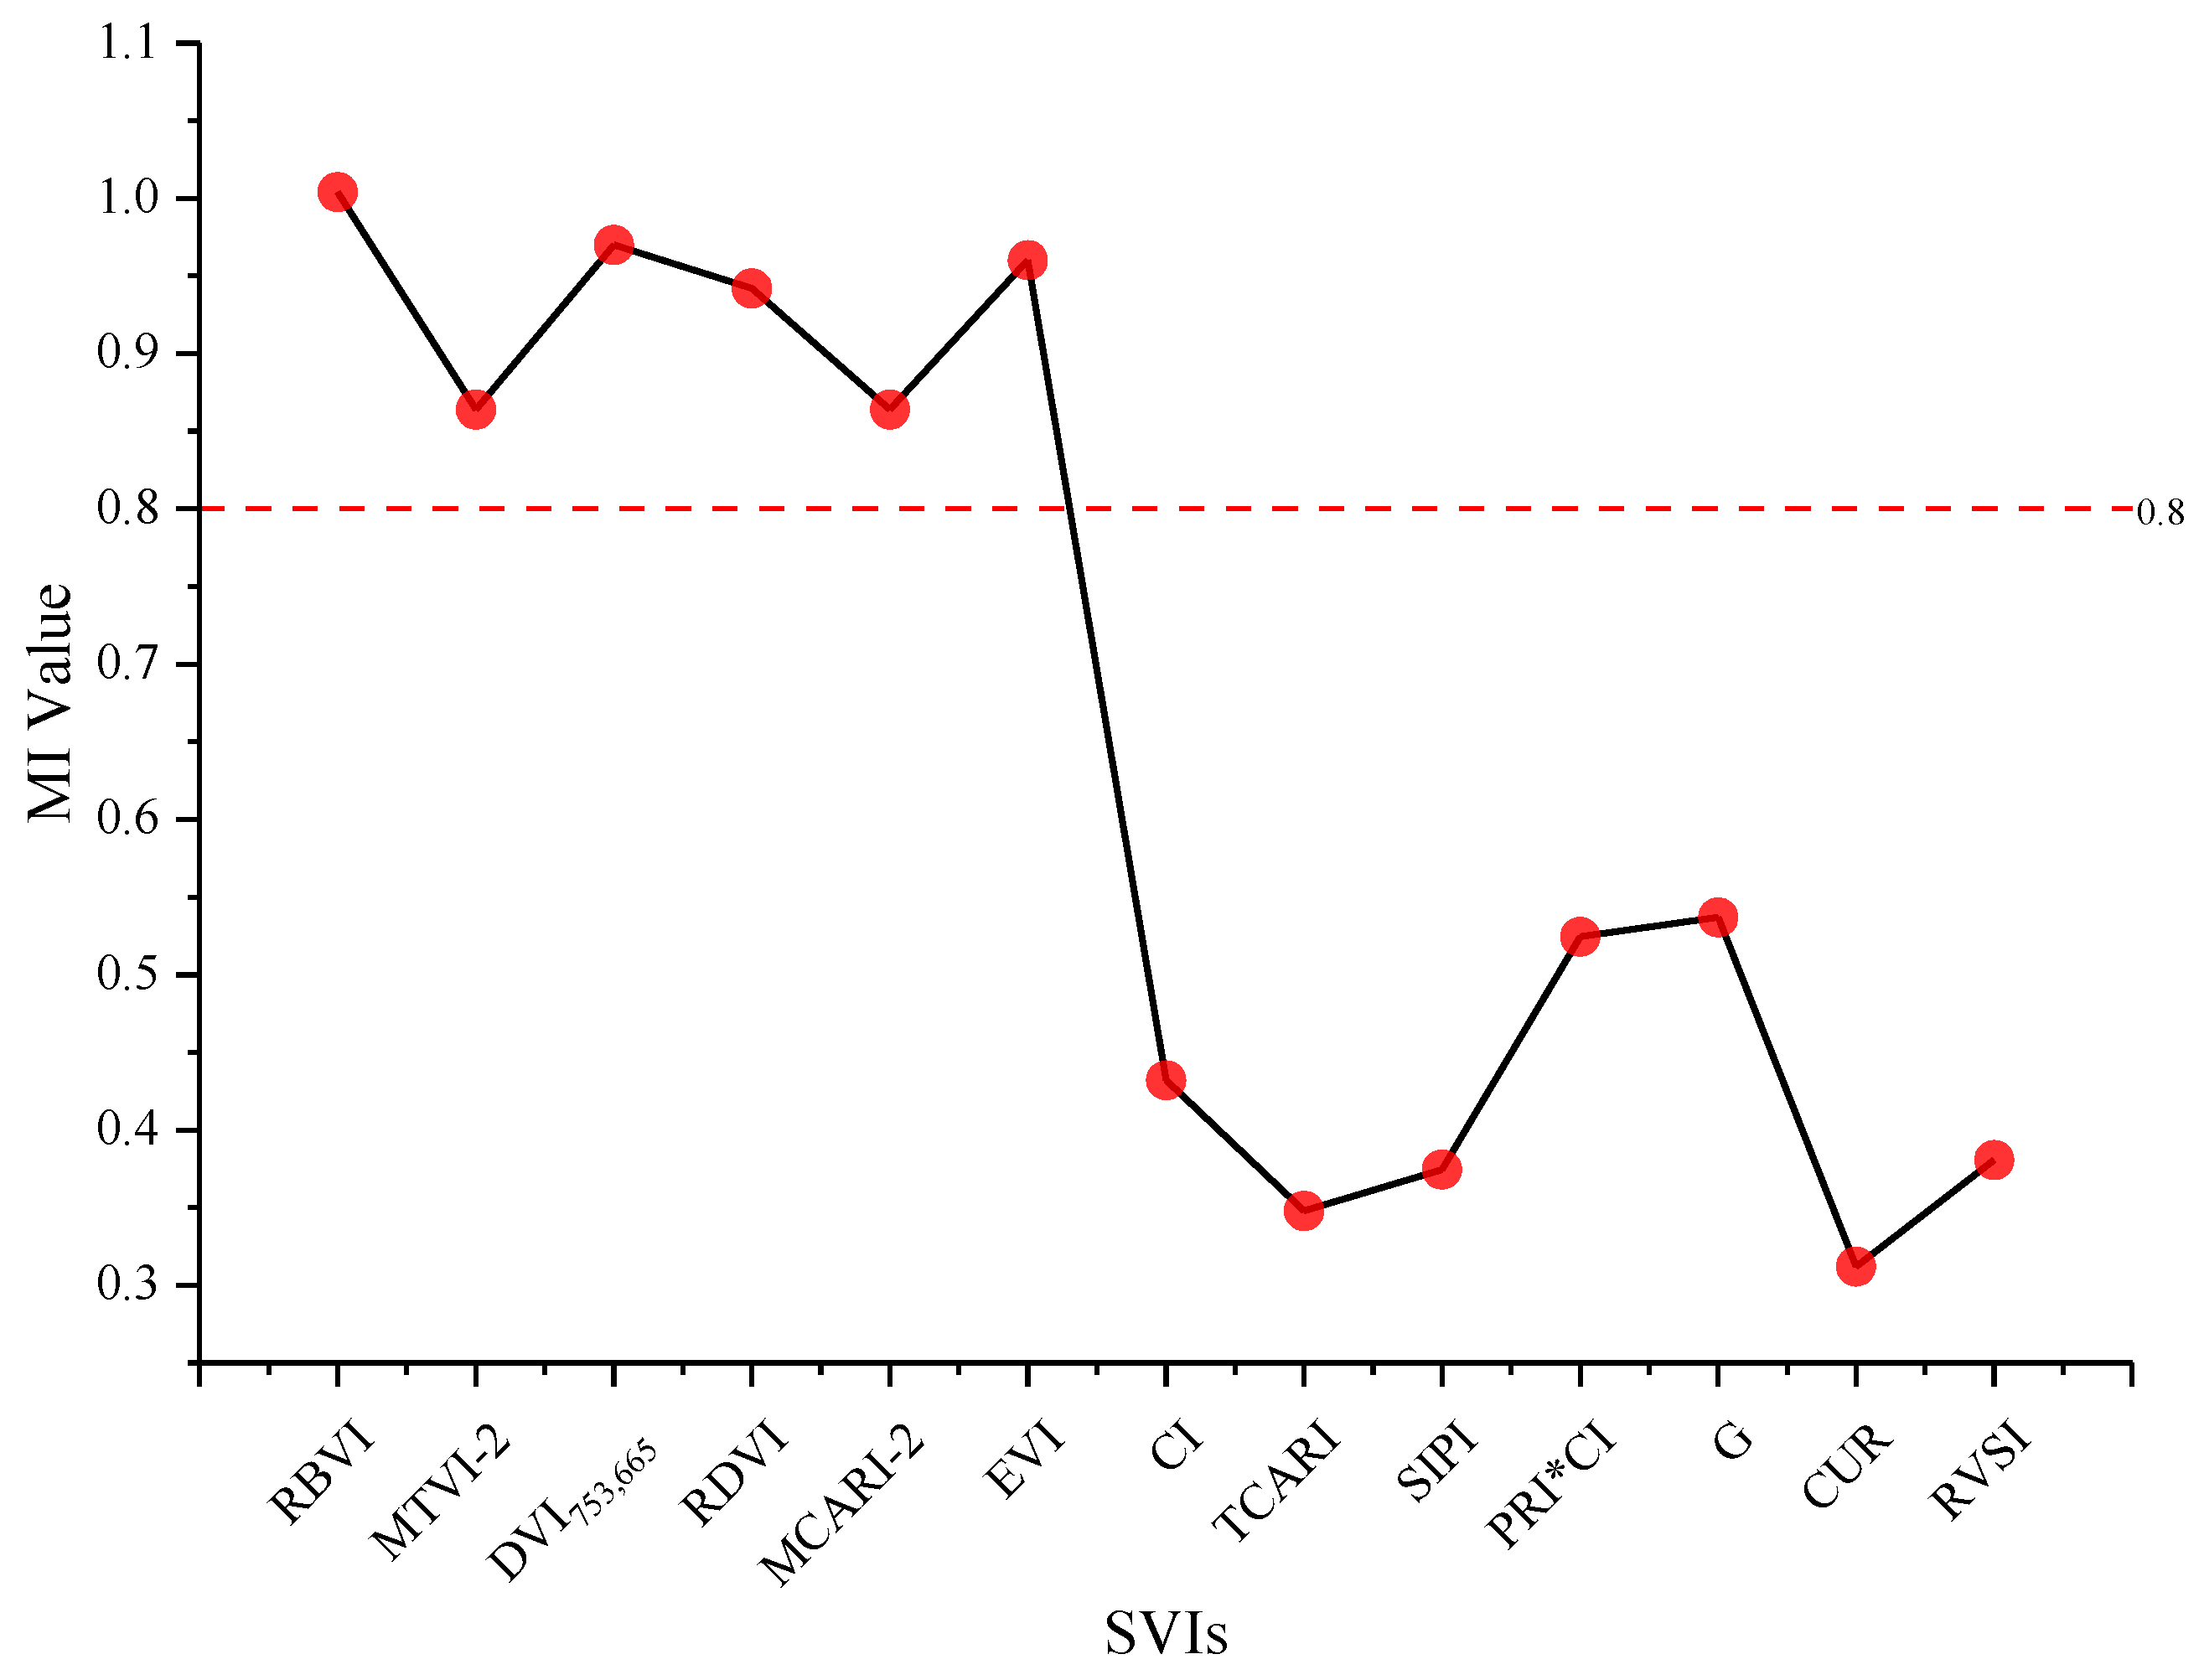
3.2. Comparative Analysis of RBVI and Traditional SVIs

To preliminarily verify the validity of the SVIs proposed in this study, we first conducted a comparative analysis of 20 SVIs (including the SVIs proposed in this study) using Spearman’s correlation analysis, and the results are shown in Figure 8. As a whole, different types of SVIs showed large variability in their correlation with disease levels. A portion of SVIs showed strong correlations with disease levels, such as MTVI-2, DVI753,665, RDVI, MCARI-2, EVI, G, and our proposed RBVI. These seven SVIs were significantly correlated with disease class at the 0.01 level (|R|: 0.80–0.94). Among them, our proposed RBVI showed better correlations of −0.9381. In contrast, six SVIs, such as CI, TCARI, and PRI × CI, showed strong correlations (|R|: 0.50–0.72) with the disease levels, and the rest of the SVIs showed poor correlations (|R|: 0.09–0.50). Therefore, it was concluded that the existing 13 SVIs and the RBVI proposed in this study have a good correlation with the severity of leaf blast and have a high application value for remote sensing detection of leaf blast.
To further screen the discriminative ability of each SVI in leaf blast detection, the mutual information (MI) method, which is computationally small and highly interpretive, was used to rank the feature validity. The value of MI can be interpreted as the amount of information shared between the variables. The higher the value, the greater the interdependence between the two variables. Mutual information captures not only linear relationships between variables but also nonlinear relationships. The MI values between different SVIs and leaf blast disease levels were calculated, and the results are shown in Figure 9.
As seen from Figure 9, the 13 SVIs with good correlation had different responses to the detection ability of leaf blast. From the overall determination results, eight SVIs had good discriminatory power with MI values greater than 0.5. In contrast, six SVIs, RBVI, MTVI-2, DVI753,665, RDVI, MCARI-2, and EVI, had significant discriminatory ability with MI values greater than 0.80. The RBVI had the highest MI value (MI = 1.00), indicating that our proposed SVIs have a strong early discrimination ability for leaf blast. Therefore, this study used the six SVIs above with significant discriminatory ability for separate modeling to determine the best SVIs for leaf blast detection.

3.3. Results and Analysis of Leaf Blast Detection Based on Stacking Integrated Learning Models

To validate the effectiveness of our proposed SVIs and screen for the best SVIs, a stacking integrated learning leaf blast early detection model was constructed by combining multiple machine learning models (training model for 2022 data, testing model for 2023 data). The modeling results are shown in Table 3.
As can be seen in Table 3, all six SVIs after preliminary screening had good detection accuracy, with an OA greater than 87.6% and Kappa greater than 81.5%. Compared with the common SVIs (RDVI, etc.), the newly developed RBVI had the highest detection accuracy with an OA and Kappa of 95.9% and 93.8%, respectively. Compared with the second-best EVI, it had further improved leaf blast detection accuracy with a 2.3% improvement in OA and 3.4% in Kappa. These results indicate that the proposed RBVI has good detection accuracy in rice leaf blast detection and can better characterize leaf blast at different disease levels.
In addition, a comparison of UA and PA for different disease levels is also shown in Table 3. The results showed consistency with the overall detection accuracy. Compared with other SVIs, the precision of the RBVI in detecting UA and PA at different disease levels was relatively good, especially showing that the RBVI had better sensitivity and specificity on mild symptoms.

3.4. Comparison and Analysis of the Results of Leaf Blast Detection with Other Models

Based on the different SVIs, our models were compared and analyzed with AdaBoost, SVM, RF, Lightgbm, and XgBoost models. The detection results of the RF, Lightgbm, and XgBoost models are shown in Table S2, and the detection results of the AdaBoost and SVM models are shown in Table 4. We selected the better two models (AdaBoost and SVM) from five models, including AdaBoost, for further comparative analysis. The results show that AdaBoost with SVM constructed based on the RBVI has the highest detection accuracy from the perspective of different SVIs. Meanwhile, the modeling accuracy of the RBVI was slightly higher than that of EVI, RDVI, and DVI753,665 and much higher than that of MTVI-2 and MCARI-2. This further indicates that the RBVI is significantly sensitive to detecting leaf blast and can characterize the disease more adequately. While analyzed from the perspective of different models, better detection accuracy (OA > 85.8% and Kappa > 78.7%) was achieved in both SVM and AdaBoost modeling. Among them, the SVM leaf blast detection modeling with the RBVI had higher accuracy with an OA and Kappa of 95.4% and 93.2%, respectively. However, compared with the stacking integrated learning model, the detection accuracy of SVM still needs to be improved. Because of this, it can be seen in the comparative analysis of different SVIs and different modeling approaches that the RBVI can better characterize the disease characteristics of varying disease levels of rice early leaf blast at the canopy scale. Using the stacking integrated learning model can help improve the accuracy of early detection of rice leaf blast in the field.

4. Discussion

Early detection of rice leaf blast is vital for scientific management and early control of rice fields. In the existing research, most researchers have used spectroscopic technology to carry out an in-depth analysis of early disease detection at the leaf scale of rice, explored the spectral response mechanism and change rule of early disease stress on rice leaves, and achieved better research results. However, this cannot be used and promoted on a large scale outdoors. At the canopy scale, especially in low-altitude remote sensing, it has been documented that using UAVs with spectral sensors for disease detection of crop diseases has a high potential for application [39,40]. However, there is still inapplicability in the early detection of diseases [41]. Therefore, in this study, a rice leaf blast spectral vegetation index (RBVI) was proposed based on UAV hyperspectral remote sensing data to improve the accuracy of early detection of rice leaf blast in the field.
The high accuracy and separability of the RBVI are due to the structure of the spectral vegetation index, the determination of spectral and differential spectral wavelengths, and the weighting coefficients. For the vegetation index structure, it has been shown in existing studies that the use of three-wavelength or feature construction of SVIs can further improve the ability of spectral detection of crops [42]. The reason is that, in general, compared with two-wavelength vegetation indices, three-wavelength vegetation indices can obtain richer crop information with better stability and accuracy—for example, plant senescence reflectance index (PSRI) and healthy index (HI) for monitoring crop senescence and stress. Also, how the three wavelengths are combined for computing is particularly important, which is key to further improving the variability among different substances (different disease levels). At the same time, this combination operation also needs to be determined by combining the special spectral response change law of other detection substances. For example, in this study, by analyzing the spectral response law of healthy, mildly infected, and severely infected rice leaf blast, it was concluded that in the red and near-infrared spectral region, the spectral reflectance showed the change rule of increasing and decreasing with the increase in disease level, respectively.
Moreover, after the spectral reflectance curve was processed by first-order differentiation, it showed a gradual decrease in differential spectral reflectance with increased disease level in the red-edge region. It is the combination of the spectral response law and the use of combinatorial operations that further highlights this variability. As for the determination of the optimal spectral wavelength and differential spectral wavelength, it has been shown in previous studies that the correlation between diseases and crops can show a specific spectral response [43], and this response can be used for crop disease detection. And in this study, Fisher’s discriminant analysis and exhaustive algorithm methods were used to screen the spectral wavelengths and differential spectral wavelengths in the vegetation index of RBVIs that were best correlated with different disease levels of leaf blast, respectively. In this way, it was determined that the selected spectral wavelengths had a higher correlation with the differential spectral wavelengths for leaf blast. Finally, based on the training data, a fitting analysis was performed by Fisher’s linear discriminant method to determine the better weighting coefficients in the RBVI, which were used to improve the differentiability of the RBVI for early diseases.
To show the ability of the RBVI to detect leaf blast in canopy rice, we used JM distance [2] and the probability histogram [23] for further demonstration and comparative analysis with EVI and MCARI-2. As shown in Table 5, EVI, MCARI-2, and RBVI were distinguishable (JM distance > 1.0) among different leaf blast levels. Among them, our proposed RBVI performed best. The JM distances between A and M and M and S were greater than 1.5, which did not reach the best standard threshold for interclass separability (JM distance > 1.8) but still had better separability than EVI and MCARI-2. Also, the low interclass separability of neighboring disease levels was expected. The reason is a greater similarity in the early spectral data of diseases acquired by UAV hyperspectral remote sensing, especially between neighboring disease levels. And a better interclass separability was presented between A and S with a JM distance of 2.0. Meanwhile, we constructed a probability histogram to demonstrate more intuitively the discriminatory ability of the EVI, MCARI-2, and RBVI in the early detection of leaf blast (Figure 10). It can be seen that the probability distribution of the RBVI has less overlap between different leaf blast levels, followed by the EVI, and the worst is MCARI-2. This indicates that the RBVI has better discriminatory ability compared to the EVI and MCARI-2. Therefore, as a whole, the proposed RBVI has a stronger discriminative ability for early leaf blast levels.
Qualitative studies can generally be processed and analyzed using traditional statistical analysis methods. However, UAV hyperspectral remote sensing for detecting rice leaf blast in the field is susceptible to the external environment and manual investigation factors, so more complex processing and analyzing methods, such as machine learning (ML) algorithms, are needed. Recently, ML algorithms have been successfully applied in disease detection in various food crops, such as wheat, corn, peanut, and rice.
SVM is a more commonly used ML algorithm in qualitative research and is widely used in disease detection. Compared to other classification algorithms, SVM’s excellent correctness rate is due to using the structural rather than empirical principle of risk-minimizing induction [44]. However, in our study, SVM did not achieve the best disease detection results, and the model accuracy was second only to the stacking integrated model because SVM overly pursues the transformation of nonlinear classification in low-dimensional space into linear variety in the high-dimensional area, which drives the model into overfitting [45]. As an iteratively optimized ML classification algorithm, AdaBoost can train different classifiers for the same training set and assemble these classifiers to form a stronger final classifier [46]. However, this study found that AdaBoost is not the best ML algorithm in remote sensing for detecting early leaf blast disease in rice. The possible reason for this is the presence of the external environment (light, wind speed) on the hyperspectral data acquired by UAV remote sensing, affecting AdaBoost’s modeling accuracy. Although the overall detection accuracy of the SVM and AdaBoost models did not meet expectations, the modeling results from different SVIs showed that our proposed RBVI could obtain disease characteristics of varying leaf blast disease levels more accurately than other SVIs.
At the same time, under certain circumstances, the use of unique ML algorithms (e.g., SVM) is more prone to the risk of overfitting phenomena [47]. Therefore, to solve this problem, we use an integrated learning algorithm that fuses multiple ML algorithms to obtain a strong learner with better detection results. In this study, five ML algorithms, such as RF, SVM, AdaBoost, Lightgbm, and Xgboost, were used to construct a strong learner based on the principle of stacking integration, and LDA was used as the final classifier of the model. Previous studies reported stacking models in different research areas, such as crop nutrition detection, image recognition, and medical treatment. At the same time, it had not been used for crop disease detection. In our study, the stacking model achieved the best detection accuracy compared to the SVM and AdaBoost models. The stacking model constructed based on the RBVI obtained the highest early detection accuracy (95.9% for OA and 93.8% for Kappa). The possible reason is that the organic stacking of multiple ML algorithms can draw the advantages of different algorithms and improve the generalization and accuracy of the model. It also shows that using stacking integrated learning for crop disease detection is successful.
To show the performance of the RBVI with the stacking model in detecting early leaf blast in rice in the field, Figure 11 shows a graph of the results of leaf blast detection in rice in the area at different times. Also, to highlight the effects of early disease detection, the water bodies in the field were defined as the same color as the bare soil. As shown in Figure 11a, we calibrated the degree of disease in the ground survey, with blue markers for mild and other features for severe. Our comparative analysis revealed great consistency between the areas of different disease levels of leaf blast detected by the RBVI stacking model on 18 July 2023 and the areas of the ground survey. At the same time, the site of leaf blast disease increased with increasing time of infection (without control), which is consistent with the law of disease spread. The large area of disease in the lower right corner of the image is due to the fact that this is the location of the water source of the field, where the disease occurs more severely due to the effects of water temperature and water flow.
In summary, the early detection models for rice leaf blast proposed in this study have achieved relatively promising research results. However, here, we have to elaborate on the study’s limitations. The UAV hyperspectral images were all chosen to be acquired when the weather was clear and cloudless to reduce the interference of weather and other external environments on the data and models. In addition, a single rice variety was used for the experiment to more accurately assess the susceptibility of RBVI to leaf blast in the field. In our future research, we will consider acquiring UAV hyperspectral images from multiple regions and in different weather environments to enhance the diversity of data and thus further improve the model’s generalization ability. Meanwhile, combining rice growth environment information with remote sensing spectral information for research prediction and forecasting of rice blast disease will also be the focus of our future research.

5. Conclusions

In this study, a leaf blast-specific vegetation index, RBVI, was developed by extracting the information on the spectral reflectance of a rice canopy from hyperspectral images acquired by UAV remote sensing to achieve qualitative detection of asymptomatic, mildly symptomatic, and severely symptomatic leaf blast-infected rice in the field. In order to more significantly highlight the characteristics of different disease levels of leaf blast, we determined the index structure of the RBVI by combining the characteristics of spectral reflectance variation with monotonicity analysis. Then, the best spectral features for calculating the RBVI were screened by correlation analysis and exhaustive search to ensure that the screened spectral features had better sensitivity and specificity for different disease degrees of leaf blast. The results showed that the stacking model for early detection of leaf blast constructed based on the RBVI had the highest detection accuracy, with an OA and Kappa of 95.9% and 93.8%, respectively. The results were also slightly improved compared to the SVM model constructed based on the RBVI with the AdaBoost model. In addition, in order to further indicate the separability of the RBVI for leaf blast, JM distance and a probability histogram were used for comparative analysis. The analysis results showed that the RBVI had a stronger ability to discriminate and differentiate early leaf blast classes compared to other SVIs. Therefore, combining the RBVI with the stacking model can help to improve the detection accuracy of early leaf blast in the field and detect the early signs of rice blast in time. The application of this method can not only reduce the influence of environmental factors such as light changes to a certain extent and improve the accuracy of early detection of rice leaf blast in the field, but it can also reduce the use of chemical pesticides before the spread of the disease by early intervention, thus reducing the negative impact on the environment.

Supplementary Materials

The following supporting information can be downloaded at: https://www.mdpi.com/article/10.3390/agronomy14030602/s1, Table S1: Spectral vegetation indices used in this study and their formulations; Table S2: RF, Lightgbm and XgBoost model detection results; Table S3: Stacking model parameter [48,49,50,51,52,53,54,55,56,57,58,59].

Author Contributions

D.Z.: methodology, software, validation, formal analysis, visualization, investigation, data curation, resources, writing—original draft, writing—review and editing. Y.C.: formal analysis, validation, data curation, investigation, resources. J.L. (Jinpeng Li): data curation, software. Q.C.: data curation, software. J.L. (Jinxuan Li): data curation, visualization. F.G.: data curation, investigation. T.X.: methodology, validation, investigation, funding acquisition, project administration, supervision. S.F.: data curation, resources, validation, software. All authors have read and agreed to the published version of the manuscript.

Funding

This research was supported by a grant from the Liaoning Province Applied Basic Research Program Project (2023JH2/101300120) and the National Natural Science Foundation of China Youth Program (32201652).

Data Availability Statement

The raw data supporting the conclusions of this article will be made available by the authors on request.

Conflicts of Interest

The authors declare no conflict of interest.

References

  1. Tian, L.; Xue, B.; Wang, Z.; Li, D.; Yao, X.; Cao, Q.; Zhu, Y.; Cao, W.; Cheng, T. Spectroscopic detection of rice leaf blast infection from asymptomatic to mild stages with integrated machine learning and feature selection. Remote Sens. Environ. 2021, 257, 112350. [Google Scholar] [CrossRef]
  2. Feng, S.; Zhao, D.; Guan, Q.; Li, J.; Liu, Z.; Jin, Z.; Li, G.; Xu, T. A deep convolutional neural network-based wavelength selection method for spectral characteristics of rice blast disease. Comput. Electron. Agric. 2022, 199, 107199. [Google Scholar] [CrossRef]
  3. Deng, Y.W.; Zhai, K.R.; Xie, Z.; Yang, D.Y.; Zhu, X.D.; Liu, J.Z.; Wang, X.; Qin, P.; Yang, Y.Z.; Zhang, G.M.; et al. Epigenetic regulation of antagonistic receptors confers rice blast resistance with yield balance. Science 2017, 355, 962–965. [Google Scholar] [CrossRef] [PubMed]
  4. Tian, L.; Wang, Z.; Xue, B.; Li, D.; Zheng, H.; Yao, X.; Zhu, Y.; Cao, W.; Cheng, T. A disease-specific spectral index tracks Magnaporthe oryzae infection in paddy rice from ground to space. Remote Sens. Environ. 2023, 285, 113384. [Google Scholar] [CrossRef]
  5. Samanta, S.; Nayak, S.; Dhua, U.; Mukherjee, A.K. Genotypic-phenotypic diversity and distinctiveness among Magnaporthe grisea isolates from rice and weed Echinochloa colonum. J. Phytopathol. 2021, 169, 581–596. [Google Scholar] [CrossRef]
  6. Hutt, C.; Bolten, A.; Huging, H.; Bareth, G. UAV LiDAR Metrics for Monitoring Crop Height, Biomass and Nitrogen Uptake: A Case Study on a Winter Wheat Field Trial. PFG-J. Photogramm. Remote Sens. Geoinf. Sci. 2023, 91, 65–76. [Google Scholar] [CrossRef]
  7. Yang, B.; Zhu, W.X.; Rezaei, E.E.; Li, J.; Sun, Z.G.; Zhang, J.Q. The Optimal Phenological Phase of Maize for Yield Prediction with High-Frequency UAV Remote Sensing. Remote Sens. 2022, 14, 1559. [Google Scholar] [CrossRef]
  8. Zheng, Q.; Huang, W.J.; Cui, X.M.; Shi, Y.; Liu, L.Y. New Spectral Index for Detecting Wheat Yellow Rust Using Sentinel-2 Multispectral Imagery. Sensors 2018, 18, 868. [Google Scholar] [CrossRef]
  9. Gorlich, F.; Marks, E.; Mahlein, A.K.; Konig, K.; Lottes, P.; Stachniss, C. UAV-Based Classification of Cercospora Leaf Spot Using RGB Images. Drones 2021, 5, 34. [Google Scholar] [CrossRef]
  10. Barreto Alcantara, A.A.; Ispizua Yamati, F.R.; Varrelmann, M.; Paulus, S.; Mahlein, A.-K. Disease incidence and severity of Cercospora leaf spot in sugar beet assessed by multispectral unmanned aerial images and machine learning. Plant Dis. 2022, 107, 188–200. [Google Scholar] [CrossRef]
  11. Sonobe, R.; Sugimoto, Y.; Kondo, R.; Seki, H.; Sugiyama, E.; Kiriiwa, Y.; Suzuki, K. Hyperspectral wavelength selection for estimating chlorophyll content of muskmelon leaves. Eur. J. Remote Sens. 2021, 54, 512–523. [Google Scholar] [CrossRef]
  12. Lapajne, J.; Knapic, M.; Zibrat, U. Comparison of Selected Dimensionality Reduction Methods for Detection of Root-Knot Nematode Infestations in Potato Tubers Using Hyperspectral Imaging. Sensors 2022, 22, 367. [Google Scholar] [CrossRef] [PubMed]
  13. Zhao, L.; Zeng, Y.; Liu, P.; He, G.J. Band Selection via Explanations From Convolutional Neural Networks. IEEE Access 2020, 8, 56000–56014. [Google Scholar] [CrossRef]
  14. Al-Saddik, H.; Simon, J.C.; Cointault, F. Assessment of the optimal spectral bands for designing a sensor for vineyard disease detection: The case of “Flavescence doree”. Precis. Agric. 2019, 20, 398–422. [Google Scholar] [CrossRef]
  15. Pham, Q.T.; Liou, N.S. The development of on-line surface defect detection system for jujubes based on hyperspectral images. Comput. Electron. Agric. 2022, 194, 106743. [Google Scholar] [CrossRef]
  16. Zhang, C.; Kovacs, J.M. The application of small unmanned aerial systems for precision agriculture: A review. Precis. Agric. 2012, 13, 693–712. [Google Scholar] [CrossRef]
  17. Yang, S.; Zhang, H.Q.; Fan, W.M. Characteristic wavelengths selection of rice spectrum based on adaptive sliding window permutation entropy. Food Sci. Technol. 2022, 42, e38922. [Google Scholar] [CrossRef]
  18. Marang, I.J.; Filippi, P.; Weaver, T.B.; Evans, B.J.; Whelan, B.M.; Bishop, T.F.A.; Murad, M.O.F.; Al-Shammari, D.; Roth, G. Machine Learning Optimised Hyperspectral Remote Sensing Retrieves Cotton Nitrogen Status. Remote Sens. 2021, 13, 1428. [Google Scholar] [CrossRef]
  19. Crusiol, L.G.T.; Sun, L.; Sun, Z.; Chen, R.Q.; Wu, Y.F.; Ma, J.C.; Song, C.X. In-Season Monitoring of Maize Leaf Water Content Using Ground-Based and UAV-Based Hyperspectral Data. Sustainability 2022, 14, 9039. [Google Scholar] [CrossRef]
  20. Anderegg, J.; Hund, A.; Karisto, P.; Mikaberidze, A. In-Field Detection and Quantification of Septoria Tritici Blotch in Diverse Wheat Germplasm Using Spectral-Temporal Features. Front. Plant Sci. 2019, 10, 473679. [Google Scholar] [CrossRef]
  21. Domingues Franceschini, M.H.; Bartholomeus, H.; van Apeldoorn, D.; Suomalainen, J.; Kooistra, L. Intercomparison of Unmanned Aerial Vehicle and Ground-Based Narrow Band Spectrometers Applied to Crop Trait Monitoring in Organic Potato Production (vol 17, 1428, 2017). Sensors 2017, 17, 2265. [Google Scholar] [CrossRef] [PubMed]
  22. Abdulridha, J.; Ampatzidis, Y.; Kakarla, S.C.; Roberts, P. Detection of target spot and bacterial spot diseases in tomato using UAV-based and benchtop-based hyperspectral imaging techniques. Precis. Agric. 2020, 21, 955–978. [Google Scholar] [CrossRef]
  23. Su, J.Y.; Liu, C.J.; Coombes, M.; Hu, X.P.; Wang, C.H.; Xu, X.M.; Li, Q.D.; Guo, L.; Chen, W.H. Wheat yellow rust monitoring by learning from multispectral UAV aerial imagery. Comput. Electron. Agric. 2018, 155, 157–166. [Google Scholar] [CrossRef]
  24. Abdulridha, J.; Batuman, O.; Ampatzidis, Y. UAV-Based Remote Sensing Technique to Detect Citrus Canker Disease Utilizing Hyperspectral Imaging and Machine Learning. Remote Sens. 2019, 11, 1373. [Google Scholar] [CrossRef]
  25. Huo, L.N.; Persson, H.J.; Lindberg, E. Early detection of forest stress from European spruce bark beetle attack, and a new vegetation index: Normalized distance red & SWIR (NDRS). Remote Sens. Environ. 2021, 255, 112240. [Google Scholar] [CrossRef]
  26. Liu, L.Y.; Dong, Y.Y.; Huang, W.J.; Du, X.P.; Ren, B.Y.; Huang, L.S.; Zheng, Q.; Ma, H.Q. A Disease Index for Efficiently Detecting Wheat Fusarium Head Blight Using Sentinel-2 Multispectral Imagery. IEEE Access 2020, 8, 52181–52191. [Google Scholar] [CrossRef]
  27. GBT 15790-2009; Rules of Investigation and Forecast of the Rice Blast. 2009. Available online: https://www.chinesestandard.net/AMP/Related.amp.aspx/GBT15790-2009 (accessed on 16 February 2024).
  28. Zhao, D.X.; Feng, S.; Cao, Y.L.; Yu, F.H.; Guan, Q.; Li, J.P.; Zhang, G.S.; Xu, T.Y. Study on the Classification Method of Rice Leaf Blast Levels Based on Fusion Features and Adaptive-Weight Immune Particle Swarm Optimization Extreme Learning Machine Algorithm. Front. Plant Sci. 2022, 13, 879668. [Google Scholar] [CrossRef] [PubMed]
  29. Guan, Q.; Song, K.; Feng, S.; Yu, F.H.; Xu, T.Y. Detection of Peanut Leaf Spot Disease Based on Leaf-, Plant-, and Field-Scale Hyperspectral Reflectance. Remote Sens. 2022, 14, 4988. [Google Scholar] [CrossRef]
  30. Lee, C.C.; Koo, V.C.; Lim, T.S.; Lee, Y.P.; Abidin, H. A multi-layer perceptron-based approach for early detection of BSR disease in oil palm trees using hyperspectral images. Heliyon 2022, 8, e09252. [Google Scholar] [CrossRef]
  31. Huang, L.S.; Wu, Z.C.; Huang, W.J.; Ma, H.Q.; Zhao, J.L. Identification of Fusarium Head Blight in Winter Wheat Ears Based on Fisher’s Linear Discriminant Analysis and a Support Vector Machine. Appl. Sci. 2019, 9, 3894. [Google Scholar] [CrossRef]
  32. Ahmadi, P.; Muharam, F.M.; Ahmad, K.; Mansor, S.; Abu Seman, I. Early Detection of Ganoderma Basal Stem Rot of Oil Palms Using Artificial Neural Network Spectral Analysis. Plant Dis. 2017, 101, 1009–1016. [Google Scholar] [CrossRef]
  33. Fisher, M.C.; Henk, D.A.; Briggs, C.J.; Brownstein, J.S.; Madoff, L.C.; McCraw, S.L.; Gurr, S.J. Emerging fungal threats to animal, plant and ecosystem health. Nature 2012, 484, 186–194. [Google Scholar] [CrossRef]
  34. Ham, J.; Yangchi, C.; Crawford, M.M.; Ghosh, J. Investigation of the random forest framework for classification of hyperspectral data. IEEE Trans. Geosci. Remote Sens. 2005, 43, 492–501. [Google Scholar] [CrossRef]
  35. Platt, J. Sequential Minimal Optimization: A Fast Algorithm for Training Support Vector Machines. In Advances in Kernel Methods-Support Vector Learning; MIT Press: Cambridge, MA, USA, 1998; Volume 208. [Google Scholar]
  36. Freund, Y.; Schapire, R.E. A Decision-Theoretic Generalization of On-Line Learning and an Application to Boosting. J. Comput. Syst. Sci. 1997, 55, 119–139. [Google Scholar] [CrossRef]
  37. Meng, Q. LightGBM: A Highly Efficient Gradient Boosting Decision Tree. In Proceedings of the 31st Conference on Neural Information Processing Systems (NIPS 2017), Long Beach, CA, USA, 4–9 December 2017. [Google Scholar]
  38. Chen, T.Q.; Guestrin, C.; Assoc Comp, M. XGBoost: A Scalable Tree Boosting System. In Proceedings of the KDD’16: Proceedings of the 22nd ACM SIGKDD International Conference on Knowledge Discovery and Data Mining, San Francisco, CA, USA, 13–17 August 2016; pp. 785–794. [Google Scholar]
  39. Abdulridha, J.; Ampatzidis, Y.; Qureshi, J.; Roberts, P. Laboratory and UAV-Based Identification and Classification of Tomato Yellow Leaf Curl, Bacterial Spot, and Target Spot Diseases in Tomato Utilizing Hyperspectral Imaging and Machine Learning. Remote Sens. 2020, 12, 2732. [Google Scholar] [CrossRef]
  40. Zhang, H.; Huang, L.; Huang, W.; Dong, Y.; Weng, S.; Zhao, J.; Ma, H.; Liu, L. Detection of wheat Fusarium head blight using UAV-based spectral and image feature fusion. Front. Plant Sci. 2022, 13, 1004427. [Google Scholar] [CrossRef]
  41. Guo, A.; Huang, W.; Dong, Y.; Ye, H.; Ma, H.; Liu, B.; Wu, W.; Ren, Y.; Ruan, C.; Geng, Y. Wheat Yellow Rust Detection Using UAV-Based Hyperspectral Technology. Remote Sens. 2021, 13, 123. [Google Scholar] [CrossRef]
  42. Cao, Z.S.; Cheng, T.; Ma, X.; Tian, Y.C.; Zhu, Y.; Yao, X.; Chen, Q.; Liu, S.Y.; Guo, Z.Y.; Zhen, Q.M.; et al. A new three-band spectral index for mitigating the saturation in the estimation of leaf area index in wheat. Int. J. Remote Sens. 2017, 38, 3865–3885. [Google Scholar] [CrossRef]
  43. Huang, W.; Guan, Q.; Luo, J.; Zhang, J.; Zhao, J.; Liang, D.; Huang, L.; Zhang, D. New Optimized Spectral Indices for Identifying and Monitoring Winter Wheat Diseases. IEEE J. Sel. Top. Appl. Earth Obs. Remote Sens. 2014, 7, 2516–2524. [Google Scholar] [CrossRef]
  44. Hesami, M.; Naderi, R.; Tohidfar, M.; Yoosefzadeh-Najafabadi, M. Development of support vector machine-based model and comparative analysis with artificial neural network for modeling the plant tissue culture procedures: Effect of plant growth regulators on somatic embryogenesis of chrysanthemum, as a case study. Plant Methods 2020, 16, 112. [Google Scholar] [CrossRef] [PubMed]
  45. Guo, Y.; Wang, X.L.; Huang, Y.M.; Xu, L. Collaborative driving style classification method enabled by majority voting ensemble learning for enhancing classification performance. PLoS ONE 2021, 16, e0254047. [Google Scholar] [CrossRef]
  46. Zhang, Q.W.; Wang, Z.C.; Duan, S.H.; Cao, B.Y.; Wu, Y.T.; Chen, J.; Zhang, H.B.; Wang, M. An Improved End-to-End Autoencoder Based on Reinforcement Learning by Using Decision Tree for Optical Transceivers. Micromachines 2022, 13, 31. [Google Scholar] [CrossRef]
  47. Yeom, S.; Giacomelli, I.; Menaged, A.; Fredrikson, M.; Jha, S. Overfitting, robustness, and malicious algorithms: A study of potential causes of privacy risk in machine learning. J. Comput. Secur. 2020, 28, 35–70. [Google Scholar] [CrossRef]
  48. Haboudane, D.; Miller, J.R.; Pattey, E.; Zarco-Tejada, P.J.; Strachan, I.B. Hyperspectral vegetation indices and novel algorithms for predicting green LAI of crop canopies: Modeling and validation in the context of precision agriculture. Remote Sens. Environ. 2004, 90, 337–352. [Google Scholar] [CrossRef]
  49. Roujean, J.-L.; Breon, F.-M. Estimating PAR absorbed by vegetation from bidirectional reflectance measurements. Remote Sens. Environ. 1995, 51, 375–384. [Google Scholar] [CrossRef]
  50. Liu, H.; Huete, A. A feedback based modification of the NDVI to minimize canopy background and atmospheric noise. IEEE Trans. Geosci. Remote Sens. 1995, 33, 457–465. [Google Scholar] [CrossRef]
  51. Haboudane, D.; Miller, J.R.; Tremblay, N.; Zarco-Tejada, P.J.; Dextraze, L. Integrated narrow-band vegetation indices for prediction of crop chlorophyll content for application to precision agriculture. Remote Sens. Environ. 2002, 81, 416–426. [Google Scholar] [CrossRef]
  52. Penuelas, J.; Frederic, B.; Filella, I. Semi-empirical indices to assess carotenoids/chlorophyll A ratio from leaf spectral reflectances. Photosynthetica 1995, 31, 221–230. [Google Scholar]
  53. Chappelle, E.; Kim, M.; McMurtrey, J. Ratio Analysis of Reflectance Spectra (RARS): An Algorithm for the Remote Estimation of the Concentrations of Chlorophyll A, Chlorophyll B, and Carotenoids in Soybean Leaves. Remote Sens. Environ. 1992, 39, 239–247. [Google Scholar] [CrossRef]
  54. Merzlyak, M.; Gitelson, A.; Chivkunova, O.; Rakitin, V. Non-destructive optical detection of pigment changes during leaf senescence and fruit ripening. Physiol. Plant. 1999, 106, 135–141. [Google Scholar] [CrossRef]
  55. Garrity, S.; Bohrer, G.; Maurer, K.; Mueller, K.; Vogel, C.; Curtis, P. A comparison of multiple phenology data sources for estimating seasonal transitions in deciduous forest carbon exchange. Agric. For. Meteorol. 2011, 151, 1741–1752. [Google Scholar] [CrossRef]
  56. Calderón Madrid, R.; Navas Cortés, J.; Lucena, C.; Zarco-Tejada, P. High-resolution airborne hyperspectral and thermal imagery for early detection of Verticillium wilt of olive using fluorescence, temperature and narrow-band spectral indices. Remote Sens. Environ. 2013, 139, 231–245. [Google Scholar] [CrossRef]
  57. Mahlein, A.K.; Rumpf, T.; Welke, P.; Dehne, H.W.; Plumer, L.; Steiner, U.; Oerke, E.C. Development of spectral indices for detecting and identifying plant diseases. Remote Sens. Environ. 2013, 128, 21–30. [Google Scholar] [CrossRef]
  58. Zarco-Tejada, P.; Miller, J.; Mohammed, G.; Noland, T.; Sampson, P. Chlorophyll Fluorescence Effects on Vegetation Apparent Reflectance: II. Laboratory and Airborne Canopy-Level Measurements with Hyperspectral Data. Remote Sens. Environ. 2000, 74, 596–608. [Google Scholar] [CrossRef]
  59. Merton, R.; Huntington, J. Early simulation results of the ARIES-1 satellite sensor for multi-temporal vegetation research derived from AVIRIS. In Proceedings of the Eighth Annual JPL Airborne Earth Science Workshop, Pasadena, CA, USA, 8–14 February 1999. [Google Scholar]
Figure 1. Rice leaf blast test plot.
Agronomy 14 00602 g001
Figure 2. UAV hyperspectral remote sensing data acquisition.
Agronomy 14 00602 g002
Figure 3. Variation of spectral reflectance and differential spectral reflectance for different disease levels. (A) Spectral reflectance. (B) Differential spectral reflectance.
Agronomy 14 00602 g003
Figure 4. Stacking model structure.
Agronomy 14 00602 g004
Figure 5. First-order differential spectra with Fisher weighting coefficients. (A) Differential spectral reflectance. (B) The Fisher score for differential spectral wavelengths of 400–1000 nm.
Agronomy 14 00602 g005
Figure 6. Contour map of the correlation between RBVI and different disease levels.
Agronomy 14 00602 g006
Figure 7. Contour maps visualizing the separability of the red and near-infrared spectral regions at different disease levels.
Agronomy 14 00602 g007
Figure 8. Correlation statistics between different SVIs and the extent of leaf blast disease.
Agronomy 14 00602 g008
Figure 9. Results of MI values for 21 spectral vegetation indices.
Agronomy 14 00602 g009
Figure 10. Histogram of the probability of different leaf blast levels for RBVI, EVI, and MCARI-2. (A) Histogram of the probability of different leaf blast levels for RBVI. (B) Histogram of the probability of different leaf blast levels for EVI. (C) Histogram of the probability of different leaf blast levels for MCARI-2.
Agronomy 14 00602 g010
Figure 11. Graphs showing the results of early detection of rice leaf blast in the field at different times. (a) Original image; (b) classification result on 18 July; (c) classification result on 22 July; (d) classification result on 26 July.
Agronomy 14 00602 g011
Table 1. Classification of disease level of rice leaf blast.
RankDisease SeverityDisease Index
AAsymptomaticDI = 0
MMild symptoms0 < DI < 10
SSevere symptoms10 < DI < 30
Table 2. Definition of the confusion matrix.
PositiveNegativeUA (%)
PositiveTrue Positive (TP)False Negative (FN)TP/(TP + FN) × 100%
NegativeFalse Positive (FP)True Negative (TN)TN/(TN + FP) × 100%
PA (%)TP/(TP + FP) × 100%TN/(TN + FN) × 100%
Table 3. Stacking model detection results for different SVIs.
SVIs AMSUA
(%)
OA
(%)
Kappa
(%)
RBVIA7300100.095.993.8
M567191.8
S037095.9
PA (%)93.695.798.6
EVIA721098.693.690.4
M464587.7
S046994.5
PA (%)94.792.893.2
RDVIA694094.593.289.7
M265689.0
S037095.9
PA (%)97.290.392.1
DVI753,665A712097.391.387.0
M959580.8
S037095.9
PA (%)88.892.293.3
MTVI-2A658089.088.182.2
M1156676.7
S017298.6
PA (%)85.586.292.3
MCARI-2A658089.087.781.5
M1156676.7
S027197.3
PA (%)85.584.992.3
Note: overall accuracy (OA); producer’s accuracy (PA); user’s accuracy (UA), asymptomatic (A); mild symptoms (M); severe symptoms (S).
Table 4. AdaBoost and SVM model detection results for different SVIs.
MethodsSVIs AMSUA (%)OA (%)Kappa (%)
AdaBoostRBVIA7300100.095.092.5
M667091.8
S046994.5
PA (%)93.694.498.6
EVIA721098.693.289.7
M566290.4
S076690.4
PA (%)88.690.893.3
RDVIA712097.391.887.7
M760682.2
S037095.9
PA (%)91.092.392.1
DVI753,665A703095.990.986.3
M959580.8
S037095.9
PA (%)88.690.893.3
MTVI-2A6112083.687.280.8
M862384.9
S056893.2
PA (%)88.478.595.8
MCARI-2A6112083.686.379.5
M856976.7
S017298.6
PA (%)88.481.288.9
SVMRBVIA7300100.095.493.2
M567191.8
S046994.5
PA (%)88.478.490.8
EVIA703095.993.289.7
M465489.0
S046994.5
PA (%)94.690.394.5
RDVIA685093.291.387.0
M462784.9
S037095.9
PA (%)94.489.990.9
DVI753,665A694094.590.485.6
M859680.8
S037095.9
PA (%)89.689.492.1
MTVI-2A6112083.585.878.8
M858779.5
S046994.5
PA (%)88.478.490.8
MCARI-2A6112083.585.878.8
M858779.5
S046994.5
PA (%)88.478.490.8
Note: overall accuracy (OA); producer’s accuracy (PA); user’s accuracy (UA), asymptomatic (A); mild symptoms (M); severe symptoms (S).
Table 5. JM distances for different leaf blast levels for RBVI, EVI, and MCARI-2.
SVIs[A, M][A, S][M, S]
EVI1.591.991.39
MCARI-21.031.931.37
RBVI1.652.001.52
Note: JM distance between 0 and 1 indicates that SVI has interclass separability, JM distance between 1 and 1.8 means that SVI has some interclass separability, and JM distance between 1.8 and 2.0 suggests that SVI has good interclass separability. A: asymptomatic, M: mild symptoms, S: severe symptoms.
Disclaimer/Publisher’s Note: The statements, opinions and data contained in all publications are solely those of the individual author(s) and contributor(s) and not of MDPI and/or the editor(s). MDPI and/or the editor(s) disclaim responsibility for any injury to people or property resulting from any ideas, methods, instructions or products referred to in the content.

