Article

Impact of Winter Cover Crops on Total and Microbial Carbon and Nitrogen in Black Soil

College of Forestry, Northeast Forestry University, Harbin 150000, China
*
Author to whom correspondence should be addressed.
Agronomy 2024, 14(3), 603; https://doi.org/10.3390/agronomy14030603
Submission received: 22 February 2024 / Revised: 11 March 2024 / Accepted: 14 March 2024 / Published: 17 March 2024

Abstract

:
Winter cover crops have been shown to promote the accumulation of microbial biomass carbon and nitrogen, enhance nutrient cycling, reduce erosion, improve ecosystem stability, etc. In the black soil area of Northeast China, Triticum aestivum L., Medicago sativa L., Vicia villosa Roth., Triticum aestivum L. and Medicago sativa L. mixed planting, Triticum aestivum L. and Vicia villosa Roth. mixed planting, and winter fallow fields (CK) were selected to investigate the effects of winter cover crops on soil total carbon and nitrogen and microbial biomass carbon and nitrogen. The results showed that (1) after seasonal freeze-thaw, the rate of change in SOC (−2.49~6.50%), TN (−1.54~5.44%), and C/N (−1.18~1.16%) was less than that in SMBC (−80.91~−58.33%), SMBN (−65.03~332.22%), and SMBC/SMBN (−45.52~−90.03%); (2) winter cover crops not only alleviated the negative effects of seasonal freeze-thaw, which reduces SMBC and qMBC, but also increased SMBN and qMBN; (3) there was an extremely significant (p < 0.01) positive correlation between SOC and TN, a significant (p < 0.05) negative correlation between SMBC and SMBN, and there was no significant correlation between SOC and SMBC or between TN and SMBN; (4) alkali-hydrolysable nitrogen had the greatest impact on SOC and TN, while the soil’s saturation degree had the greatest impact on SMBC and SMBN; and (5) the Triticum aestivum L. monoculture was the most effective in conserving soil microbial carbon and nitrogen. In conclusion, winter cover crops can mitigate the reduction in soil microbial biomass carbon caused by seasonal freeze-thaw and also increase the soil microbial nitrogen content in the black soil region of Northeast China, of which Triticum aestivum L. monoculture showed the best performance.

1. Introduction

Black soils have high organic matter and fertility, which are very suitable for farming [1]. With its high productivity, the black soil region in Northeast China accounts for about a quarter of China’s grain production, so it is crucial for China’s food security [2]. However, these centuries-long large-scale agricultural reclamation activities, starting from the end of the Qing Dynasty, have resulted in the thinning of the soil layers of farmland soils in this region, a serious degradation of soil quality, and a massive loss of soil organic carbon and nitrogen [3,4,5,6].
Soil organic carbon and nitrogen cycling is the most basic ecological process in agriculture ecosystems and is closely related to soil quality and essential for soil productivity and even ecosystem stability [7,8]. As a comparison with the turnover time of organic soil, which is 5 to 10 years, the turnover time of soil microbial biomass is 1 to 3 years or even less than 1 year. Thus, soil microbial biomass can respond rapidly to the minor environmental changes of soil, which is a current research hotspot of the soil research field [9,10,11]. Soil microbial biomass carbon and nitrogen are crucial components of soil microbial biomass and are not only commonly used as a measure of soil fertility but also serve as an inter-conversion link between inorganic and organic carbon or nitrogen [12,13]. The soil quotient of microbial biomass carbon (or nitrogen) is the ratio of soil microbial biomass carbon (or soil microbial biomass nitrogen) to soil organic carbon (or soil total nitrogen), which reflects both their assimilation by microbes and the demands of soil microbial maintenance [14]. Its value is directly proportional to the accumulation of soil nutrients affecting the input and loss of soil organic matter. It is the basis for characterizing the change rate of soil nutrients that are converted into microbial biomass [15,16,17], which is often used as a measure of soil nutrients and quality conditions. The carbon-to-nitrogen ratio is closely related to the carbon and nitrogen cycling in ecosystems, affecting the process of plants absorbing or releasing organic matter from the soil, and it is an important factor in measuring the efficiency of plant nutrient utilization. The microbial biomass’s carbon-to-nitrogen ratio reflects the community structure characteristics of soil microorganisms [18,19]. Soil carbon and nitrogen also interact with each other and with other environmental factors. In the context of global climate change, their relationship has become a current research hotspot.
Cover crops can effectively supplement the nutrient loss caused by exposed farmland, and the vegetation cover formed on the surface can effectively alleviate soil erosion and improve the physical and chemical quality of that soil [20,21]. Cover crops can increase the relative abundance of the dominant bacterial phyla in soil, increase soil microbial biomass, moderate soil microbial characteristics, and increase soil microbial activity [22,23,24]. Meanwhile, cover crops can change the rate of soil carbon input and the rate of organic matter loss, reducing nitrogen loss [25]. A number of cover crops have been put into actual agricultural production practice, such as Triticum aestivum L., Medicago sativa L., and Vicia villosa Roth L. [26,27]. Currently, there are relatively more studies in the southern region of China on the improvement of the soil physical and chemical environment, soil nutrient and biological properties, and the carbon and nitrogen cycling of cover crops, while there are relatively few studies on the effects of winter cover crops on the soil quality of black soil in the northeastern region of China. It is not clear to what extent cover crops affect soil carbon, nitrogen, and microbial biomass, or how the soil’s physical and chemical factors affect soil carbon, nitrogen, and microbial biomass after seasonal freeze-thaw.
The objective of this study is to identify the changes in soil total carbon and nitrogen and soil microbial biomass carbon and nitrogen before and after seasonal freeze-thaw under different monocultures and mixed cover crops, and further explore their influence factors. The final goal is to provide a scientific reference for improving the soil functions of farmland ecosystems in black soil regions and achieving the sustainable use of black soil.

2. Materials and Methods

2.1. Location of the Field

The research site is located at Keshan Farm, Keshan County, Qiqihar City, Heilongjiang Province (125°07′40″~125°37′30″ E, 48°11′15″~48°24′07″ N). The climate is temperate continental steppic, supratemperate, and lower subhumid, with an average annual precipitation of 501.7 mm and an average temperature over the last 10 years of 2.1 °C [28]. The soil types in this region are mainly black soil (Phaeozems in the WRB; Mollisols in the USST), mostly loamy clay or clay loam. A long history of reclamation has led to serious soil erosion in the area, with the soil erosion area of sloping farmland accounting for 67% of the total farmland area.
The basic physical and chemical properties of the sampling soil are given in Table 1.

2.2. Experimental Design and Sample Collection

The experiment was conducted from September 2022 to May 2023 on the cover crop plots of Keshan Farm. Triticum aestivum L. (Ta), Medicago sativa L. (Ms), and Vicia villosa Roth. (Vr), which are suitable for growing on black soil in Northeast China, were selected as cover crops to be planted in this study for monoculture and mixed sowing. Six treatments were set up in this experiment: Ta (Poaceae Barnhart), Ms (Fabaceae Lindl.), Vr (Fabaceae Lindl.), Ta and Ms (Poaceae Barnhart mixed with Fabaceae Lindl.), Ta and Vr (Poaceae Barnhart mixed with Fabaceae Lindl.), and naked land without a cover crop (CK). Cover crops were seeded uniformly on September 10, 2022. Each cover crops’ plot was 5 m × 10 m in size. The sowing amounts were Ta 3000 g, Ms 200 g, Vr 400 g, Ta 1500 g + Ms 100 g, and Ta 1500 g + Vr 200 g. Each experimental plot was sampled before freeze-thaw (1 November 2022) and after freeze-thaw (8 May 2023). There was no duplication of the plots, but five points were selected for the sampling of surface soil (0–10 cm) using the S-shaped random sampling method within each plot. Both undisturbed (100 cm3) and disturbed soils (about 1 kg) were collected. The undisturbed soils were utilized for the determination of mass water content and bulk density. The disturbed soil samples were brought back to the laboratory and the five sample points’ soil was mixed well. Part of the soil was naturally air dried; impurities such as plant residues and gravel were removed. This was used to determine the total soil organic carbon and total nitrogen after grinding and passing through a 100-mesh sieve (0.15 mm opening size). Another portion of the air-dried soil was ground and sieved through a 2 mm mesh (2 mm opening size) for measuring soil alkali-hydrolysable nitrogen and pH. The remaining fresh soil, sieved through a 2 mm mesh, was promptly stored at 4 °C in a refrigerator for the subsequent analysis of its soil microbial biomass carbon and nitrogen content. Each indicator was repeated 3 times.

2.3. Indicator Measurements and Data Processing

Soil total organic carbon (SOC) and total nitrogen (TN) were quantified using the elemental analyser method [29]. Soil microbial biomass carbon (SMBC) and soil microbial biomass nitrogen (SMBN) were quantified using the chloroform fumigation extraction method [30]. pH was measured using the potentiometric method with an aqueous solution. [31]. Alkali-hydrolysable nitrogen was determined using the alkaline hydrolysis diffusion method [32]. Mass water content was determined by the drying method [33]. The soil bulk density was determined by the ring knife method [32]. Soil capillary porosity was measured using the water immersion method [32]. Soil total porosity, volume water content, soil saturation degree, quotient of microbial biomass carbon (qMBC), quotient of microbial biomass nitrogen (qMBN), carbon-to-nitrogen ratio (SOC/TN), and microbial biomass carbon-to-nitrogen ratio (SMNC/SMBN) were obtained by calculation methods.
Comparing the changes in various indicators of the cover crops’ plots before and after freeze-thaw with the changes in fallowed land can be better reflect the sensitivity of the soil to the impact of seasonal freeze-thaw on various indicators with different winter cover crops than only focusing on the content of various indicators before or after seasonal freeze-thaw. Thus, we proposed the freeze-thaw change rate, which is calculated as follows:
freeze-thaw change rate (△Ftcr) = (index contentafter freeze-thaw − index contentbefore freeze-thaw)/index contentbefore freeze-thaw × 100%.
A statistical analysis was performed with a t-test and one-way ANOVA using SPSS software (version 26.0, IBM SPSS, Chicago, IL, USA), for which the p values of <0.05 and <0.01 were considered to be significant (*) and extremely significant (**), respectively. Origin 2021 (OriginLab, Northampton, PA, USA) was used to plot all data. Redundancy analysis (RDA) was performed using Canoco 5 software (Cabit Information Technology Co., Ltd., Shanghai, China).

3. Results

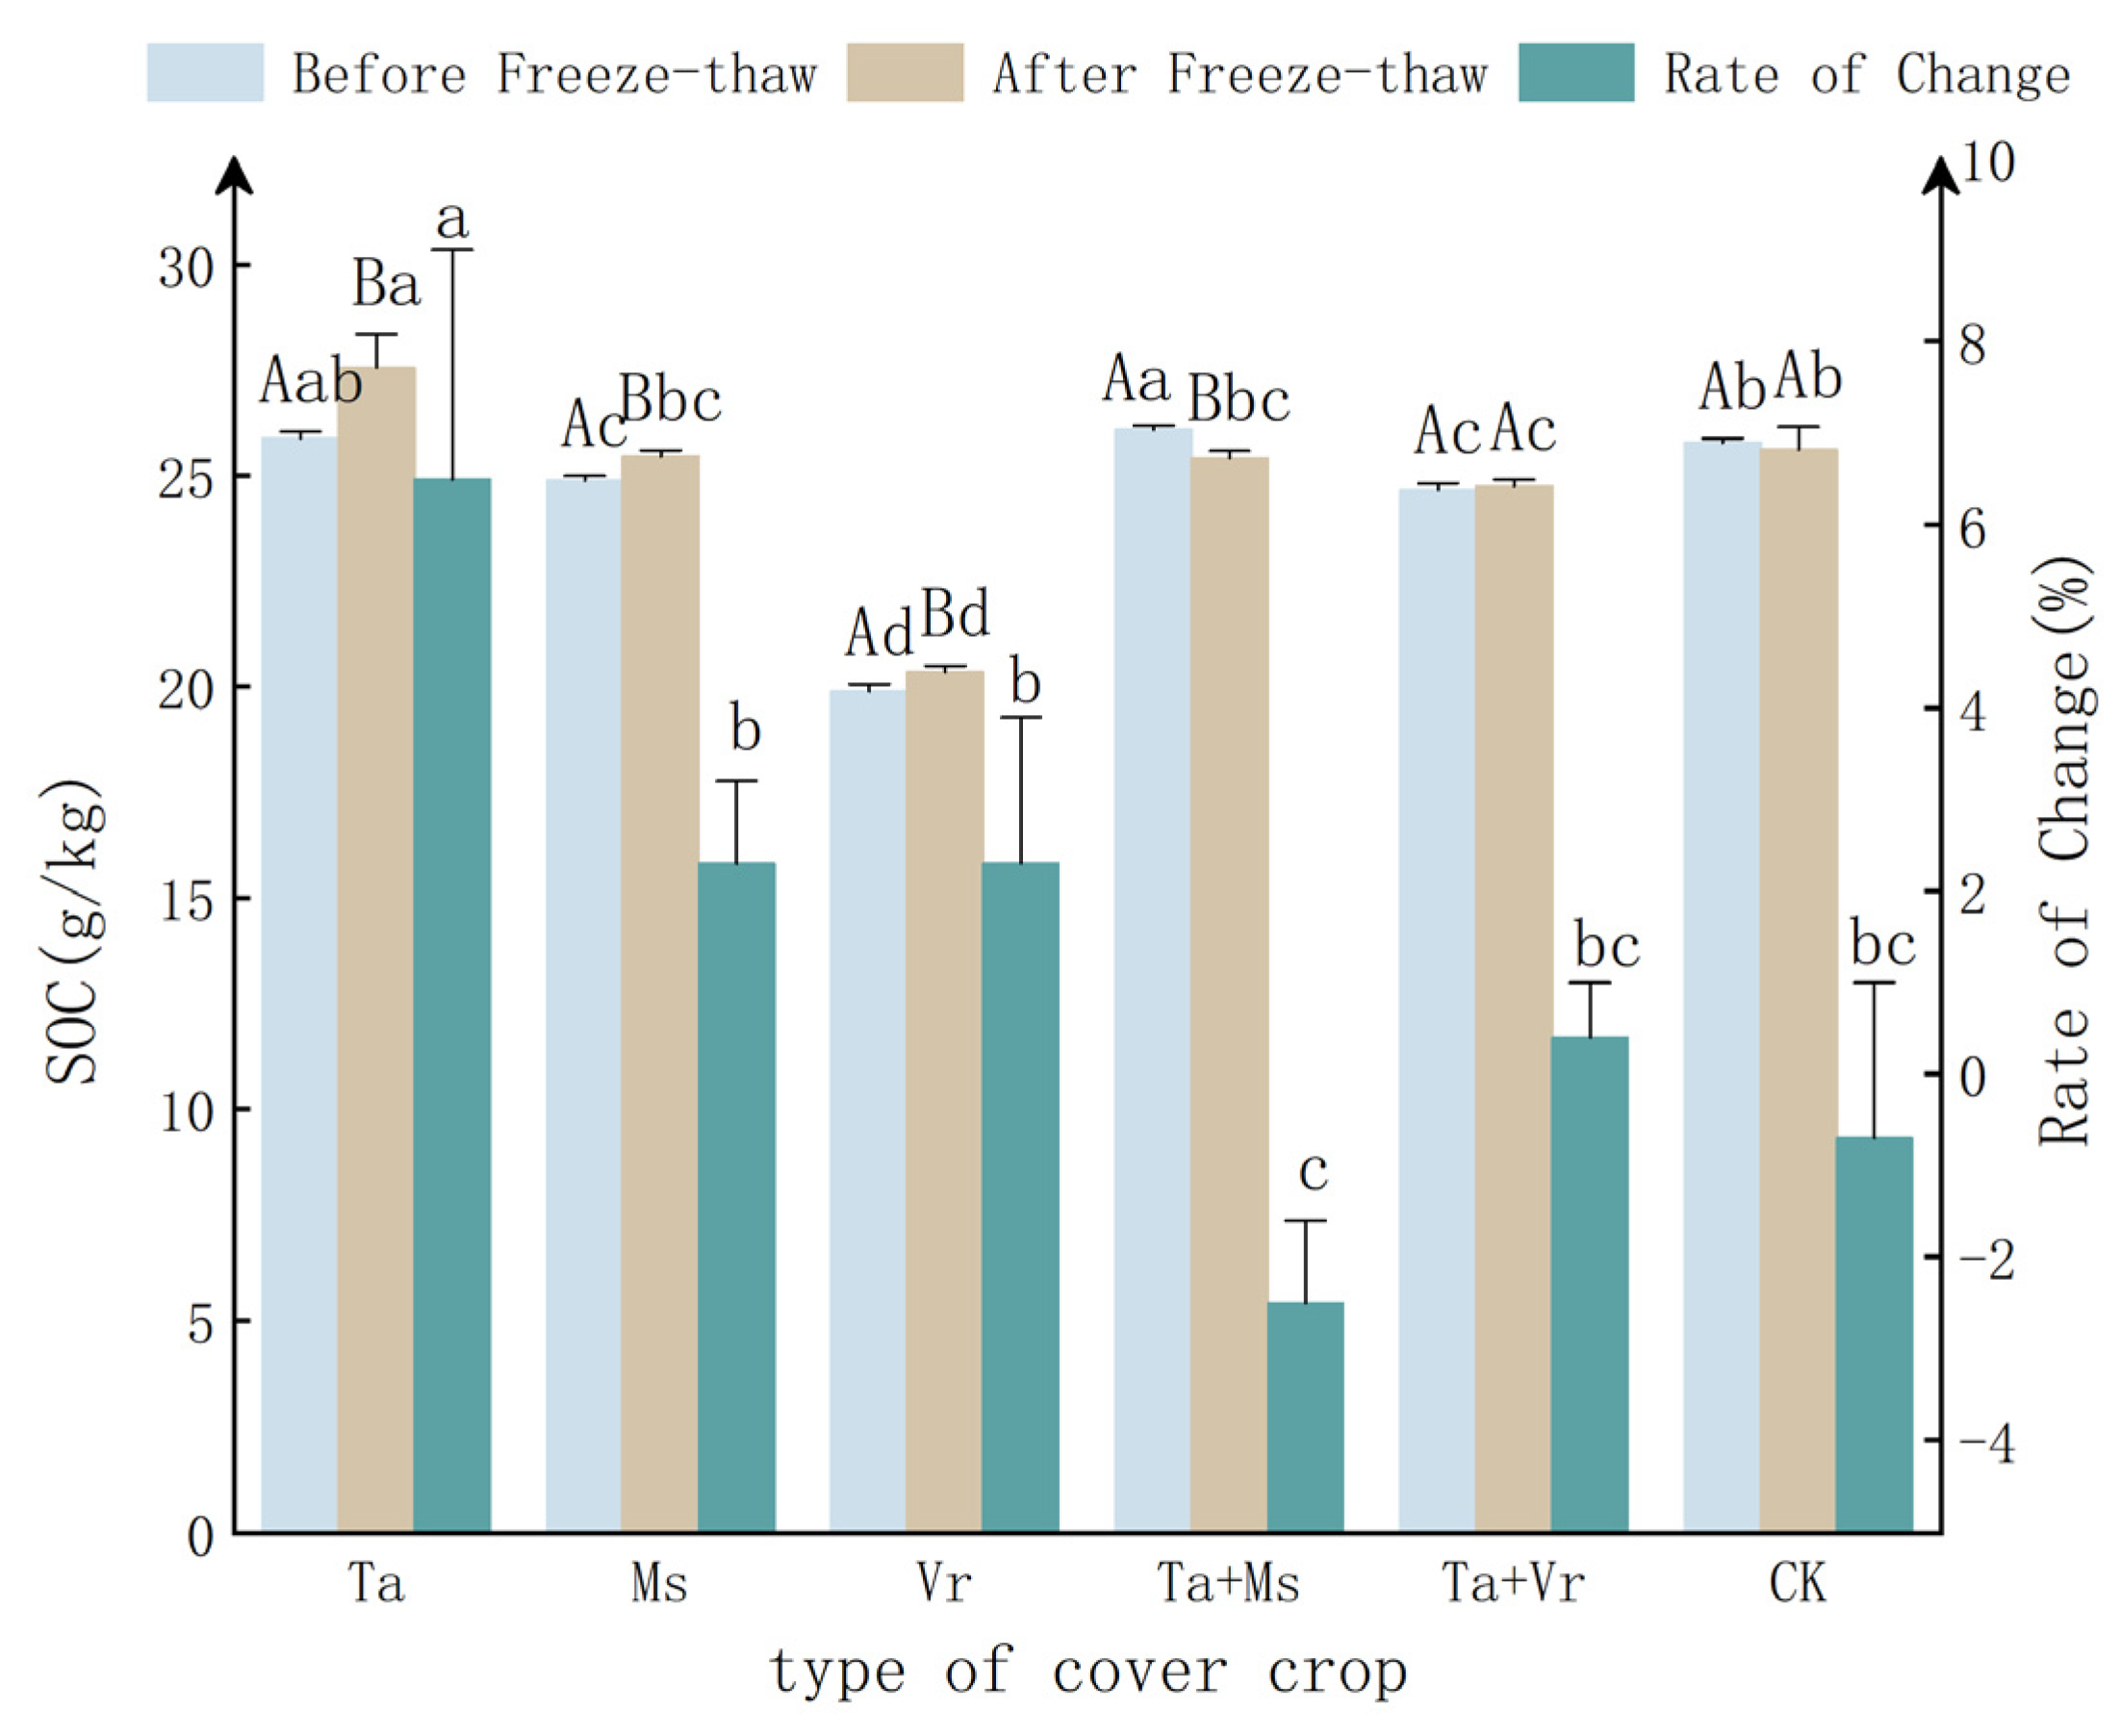
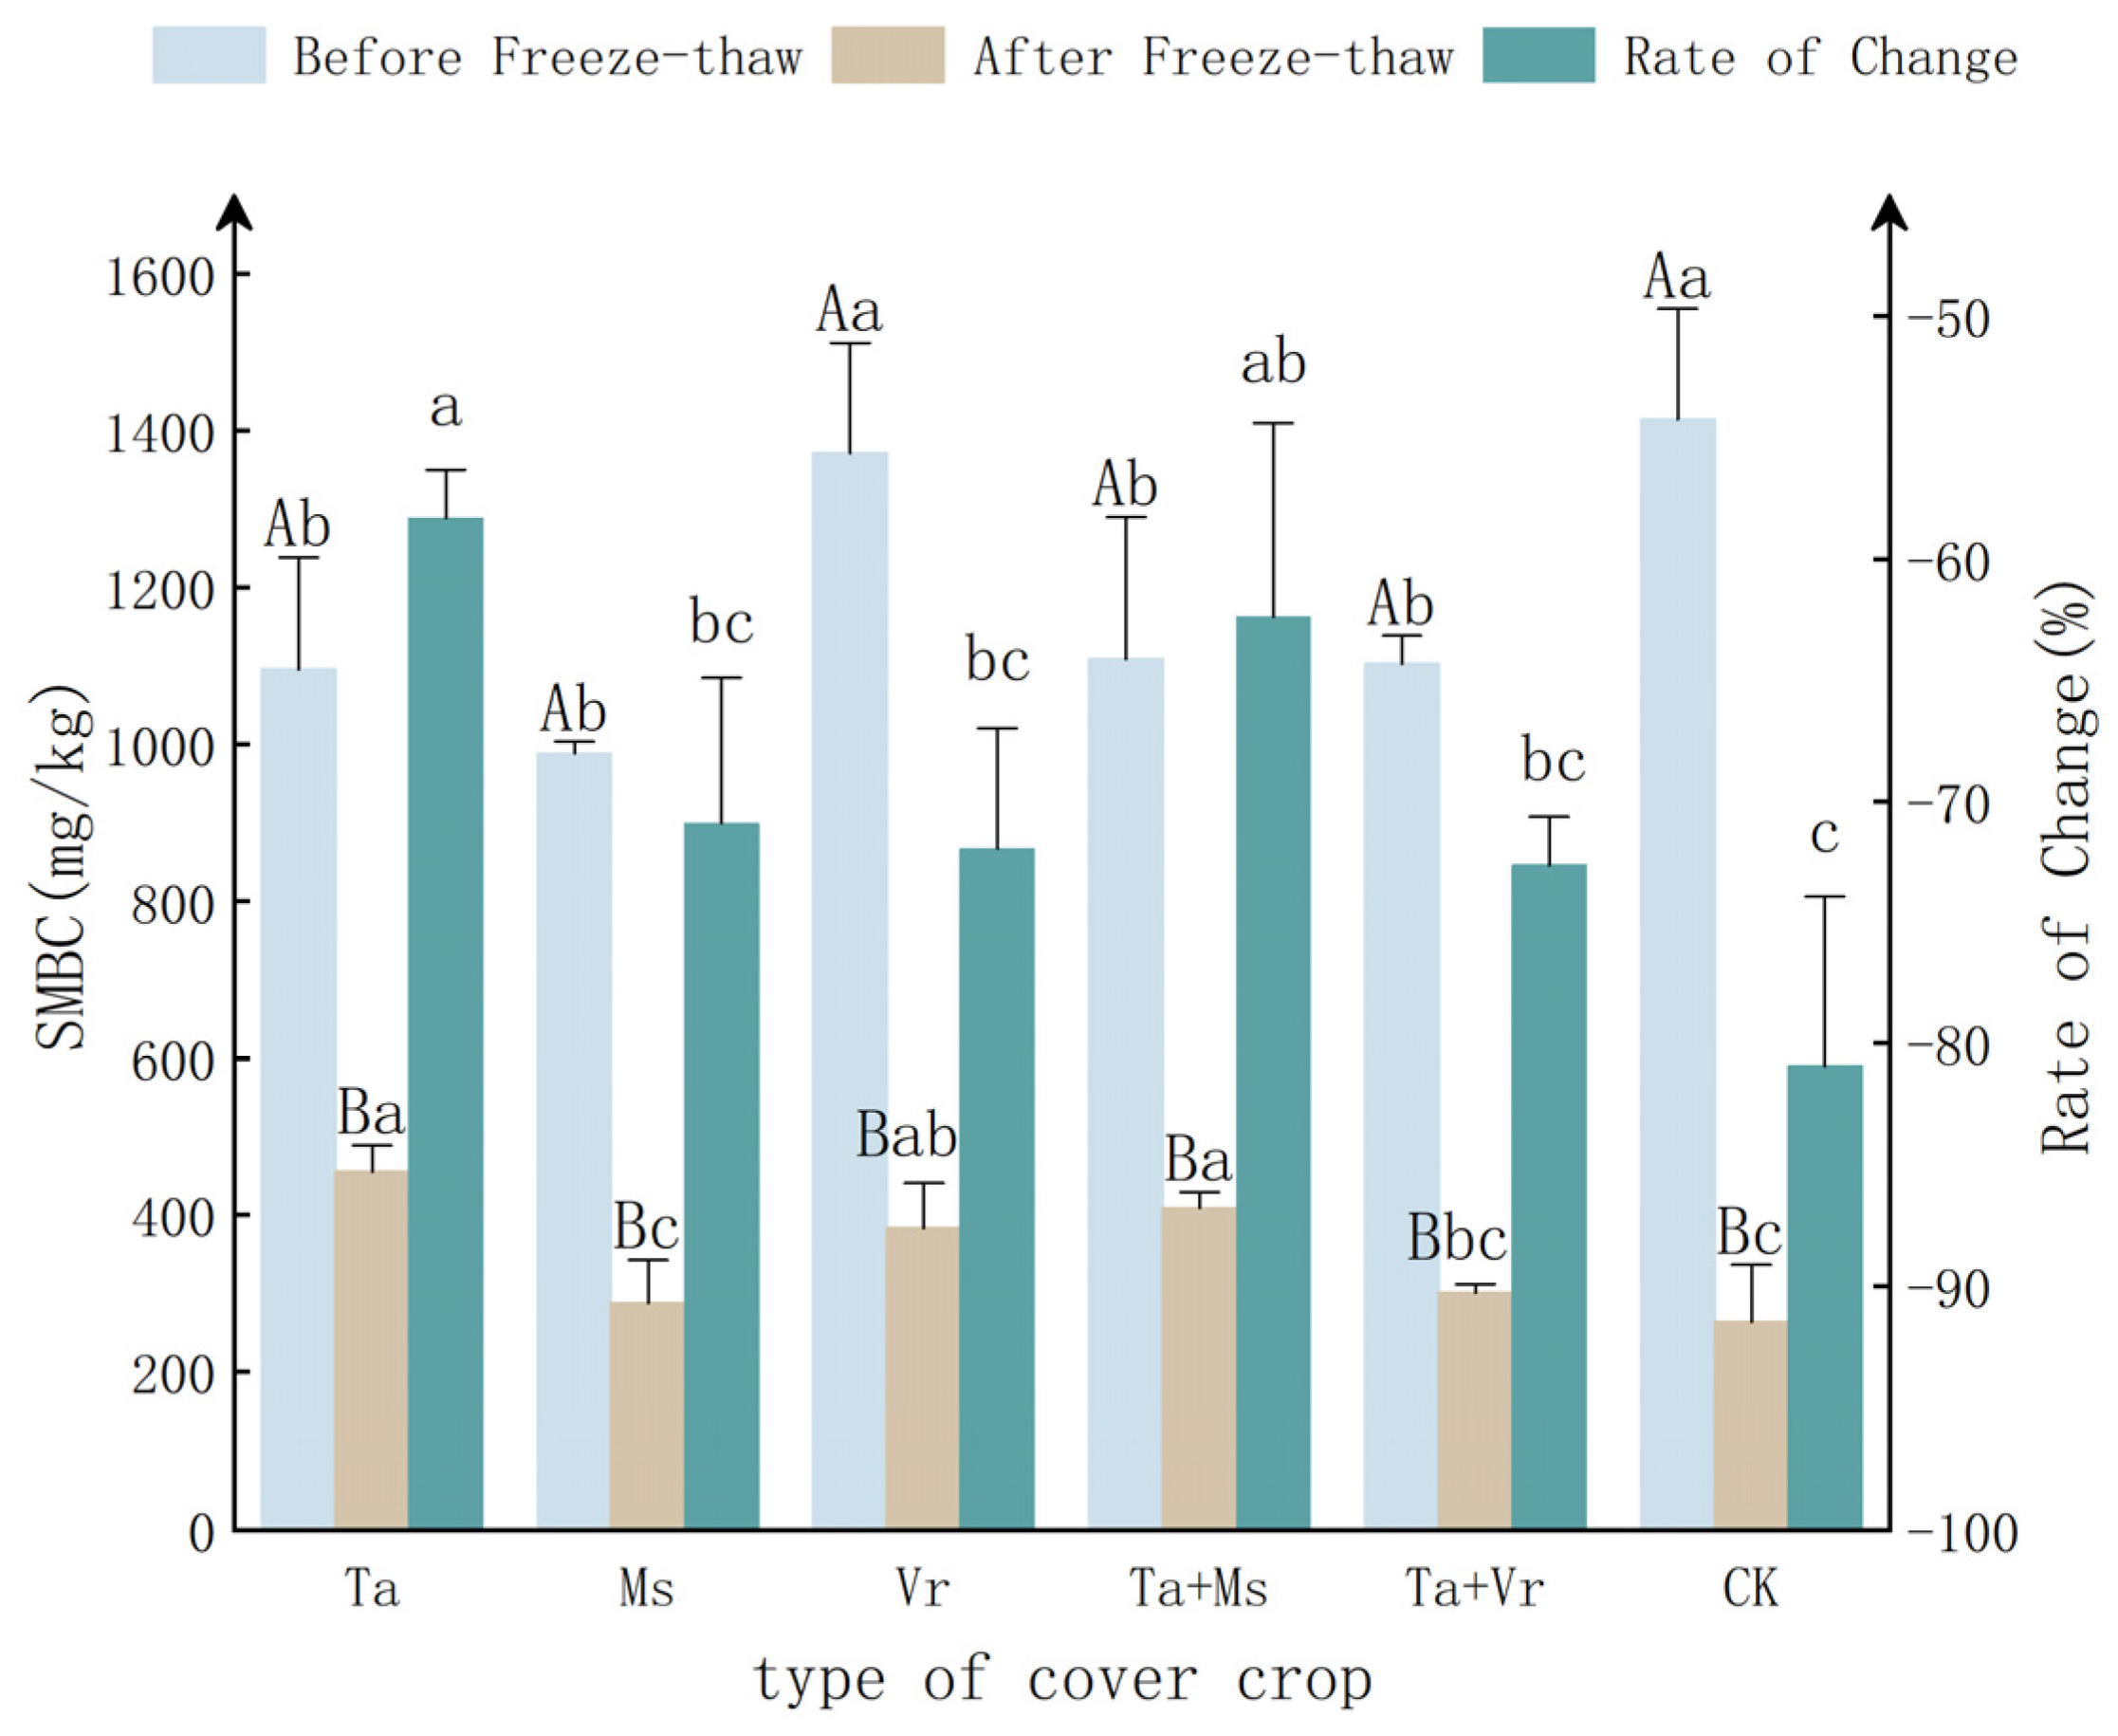
3.1. The Impact of Cover Crops on SOC and SMBC

As seen in Figure 1, before seasonal freeze-thaw, the SOC content of all plots was Ta + Ms (26.07 g/kg) > Ta (25.88 g/kg) > CK (25.79 g/kg) > Ms (24.88 g/kg) > Ta + Vr (24.66 g/kg) > Vr (19.88 g/kg), with Ta + Ms being significantly higher than CK, and Ms, Vr, and Ta + Vr being significantly lower than CK (p < 0.05). After seasonal freeze-thaw, the SOC content of all plots was Ta (27.57 g/kg) > CK (25.63 g/kg) > Ms (25.46 g/kg) > Ta + Ms (25.42 g/kg) > Ta + Vr (24.75 g/kg) > Vr (20.35 g/kg). Compared with the CK, the SOC content of Ta significantly increased, and the SOC content of Vr and Ta + Vr significantly decreased (p < 0.05). Compared with before freeze-thaw, the SOC content of Ta, Ms, and Vr significantly increased after freeze-thaw (p < 0.05). Seasonal freeze-thaw caused a significant decrease in the SOC content of Ta + Ms (p < 0.05). The SOC content of CK decreased after the plot experienced freeze-thaw, but not significantly (p > 0.05).
The rate of the freeze-thaw change in the SOC of each plot was Ta (6.50%) > Vr (2.33%) > Ms (2.30%) > Ta + Vr (0.38%) > CK (−0.66%) > Ta + Ms (−2.49%). Ta was significantly higher than other plots, and the rate of the freeze-thaw change in the SOC of all cover crops plots was higher than that in CK (p < 0.05), except for Ta + Ms.
As seen in Figure 2, before seasonal freeze-thaw, the SMBC content of all plots was CK (1414.85 mg/kg) > Vr (1371.49 mg/kg) > Ta + Ms (1108.72 mg/kg) > Ta + Vr (1102.46 mg/kg) > Ta (1095.53 mg/kg) > Ms (988.73 mg kg). The SMBC content of all cover crops plots significantly lower than that of CK (p < 0.05), except for Vr. After seasonal freeze-thaw, the SMBC content of all plots was Ta (454.31 mg/kg) > Ta + Ms (408.20 mg/kg) > Vr (382.03 mg/kg) > Ta + Vr (301.12 mg/kg) > Ms (287.19 mg/kg) > CK (263.47 mg/kg). Compared with CK, the SMBC content of Ta, Ta + Ms, and Vr significantly increased (p < 0.05). Compared with before seasonal freeze-thaw, SMBC content of all plots significantly decreased after seasonal freeze-thaw (p < 0.05).
The freeze-thaw change rate of SMBC in each plot was Ta (−58.33%) > Ta + Ms (−62.38%) > Ms (−70.91%) > Vr (−71.96%) > Ta + Vr (−72.65%) > CK (−80.91%). The freeze-thaw change rate of SMBC with Ta was higher than that in other plots, showing significant differences with Ms, Vr, Ta + Vr, and CK (p < 0.05).

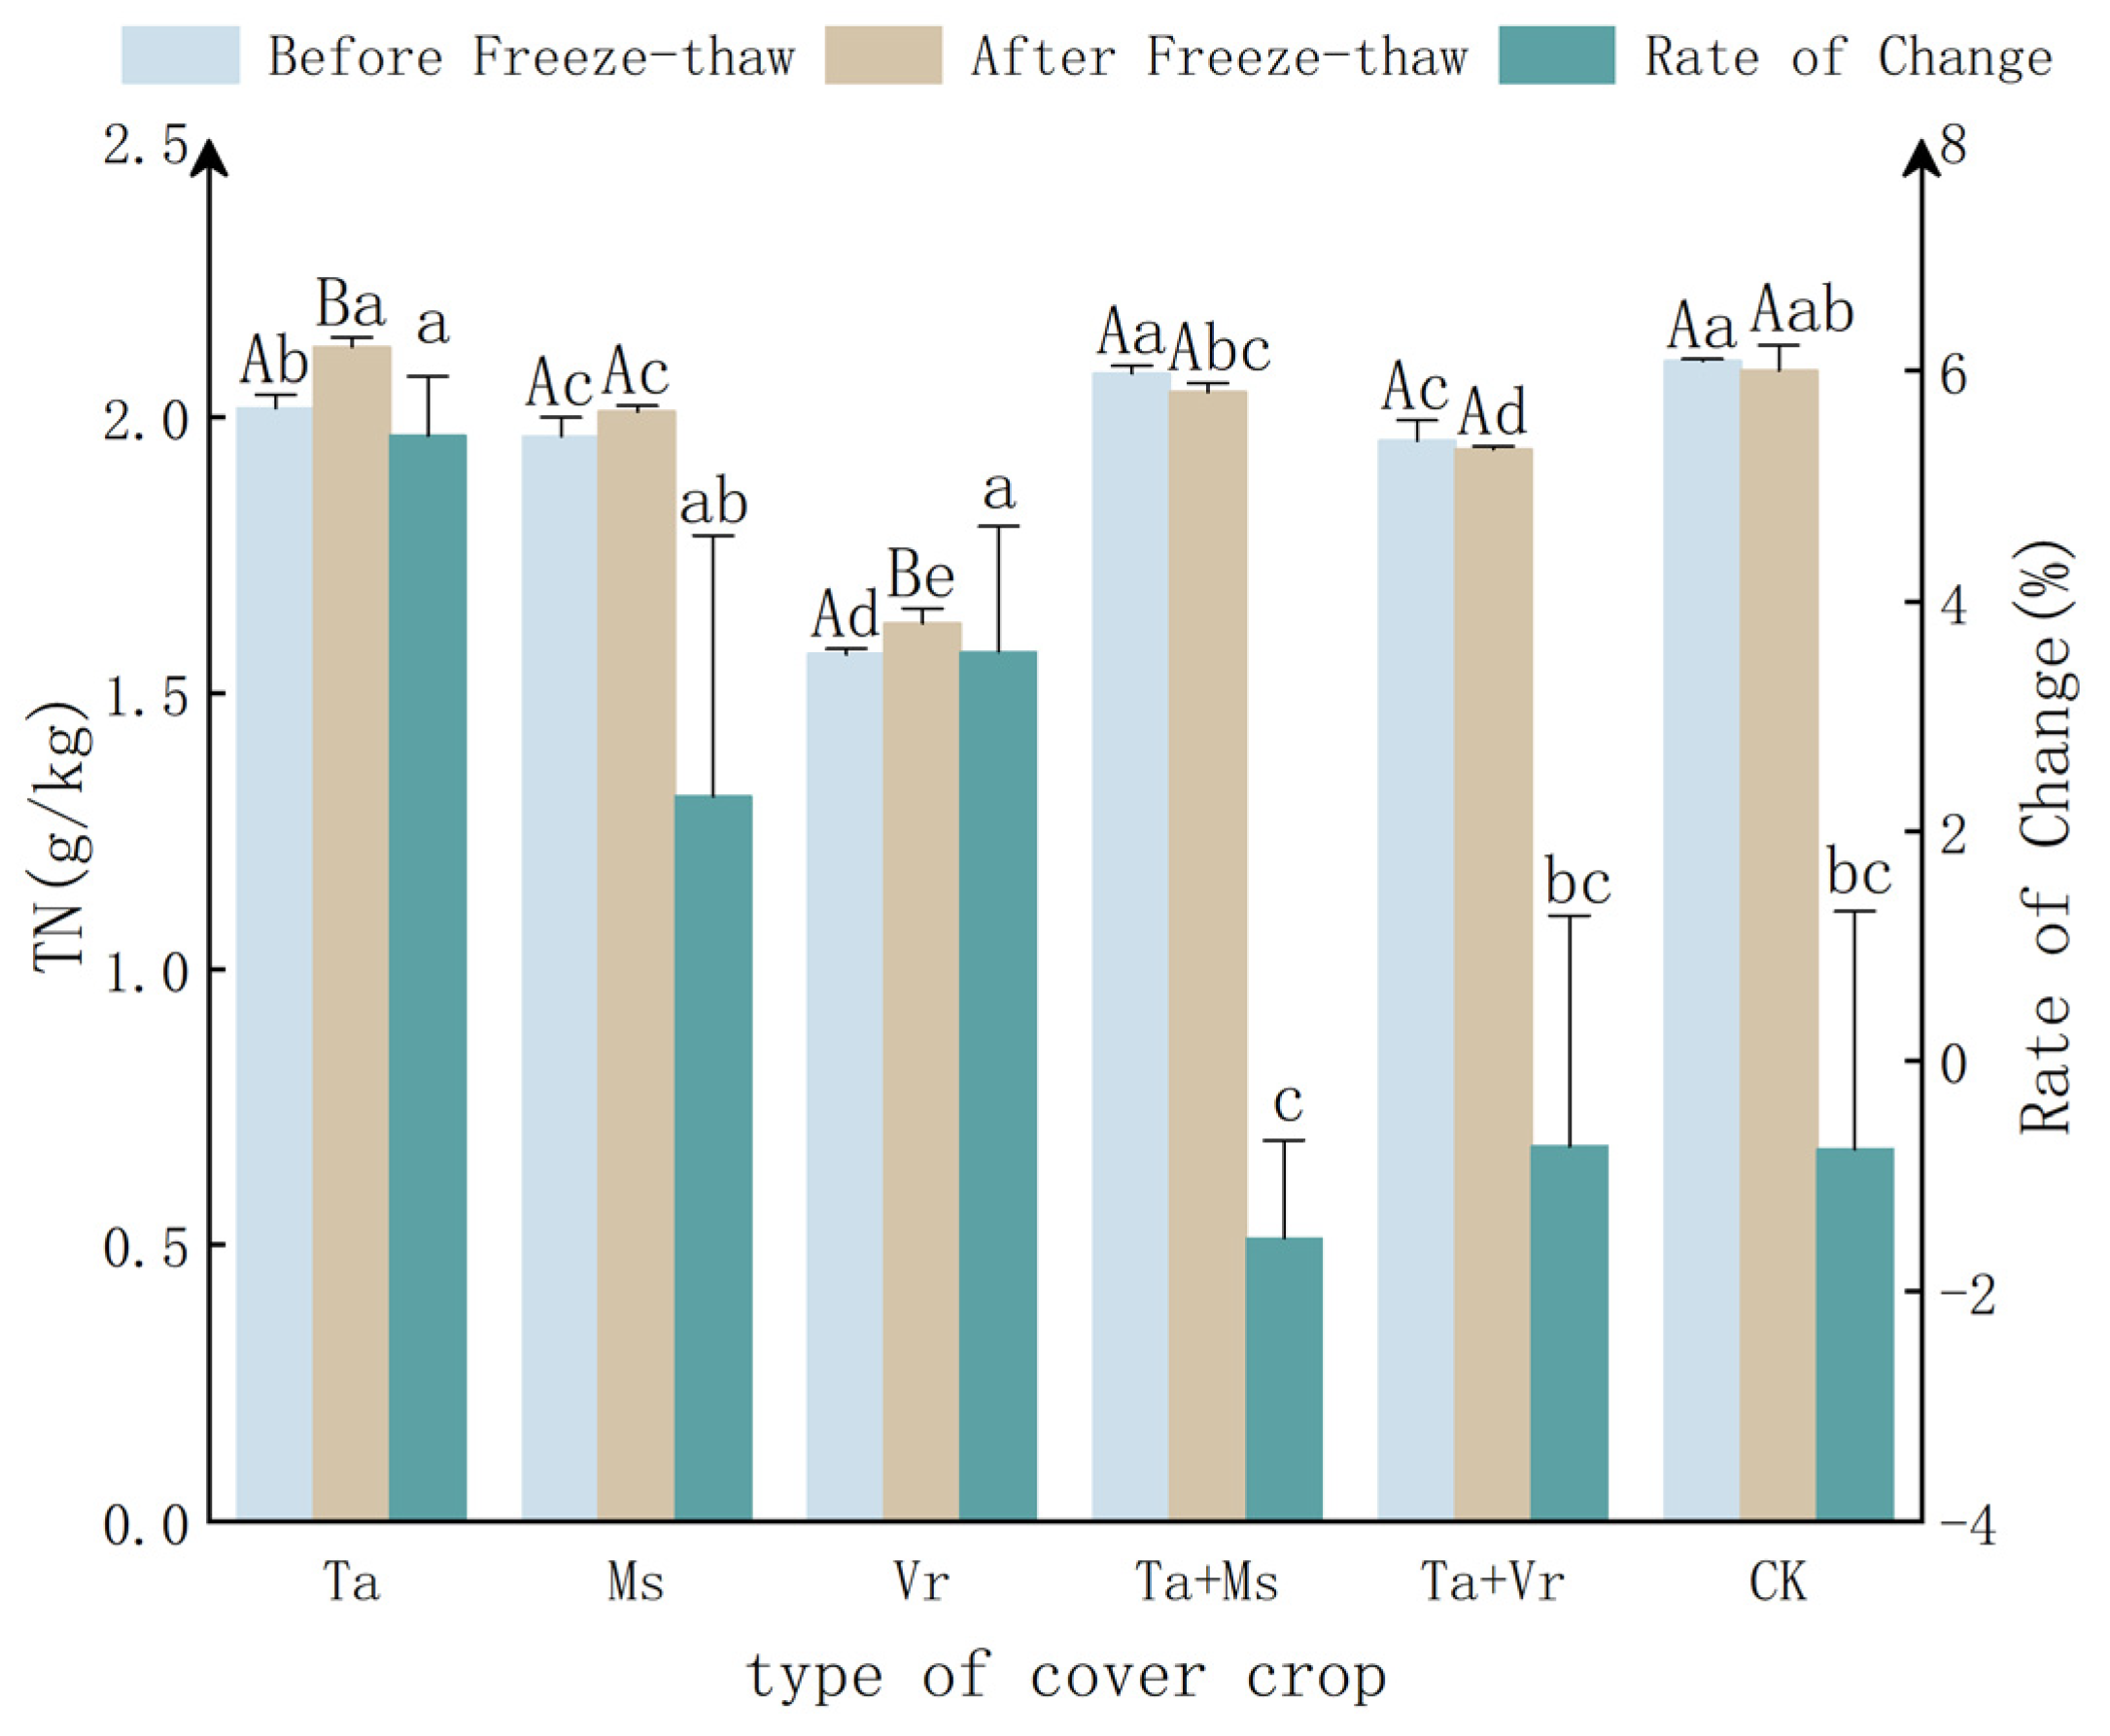
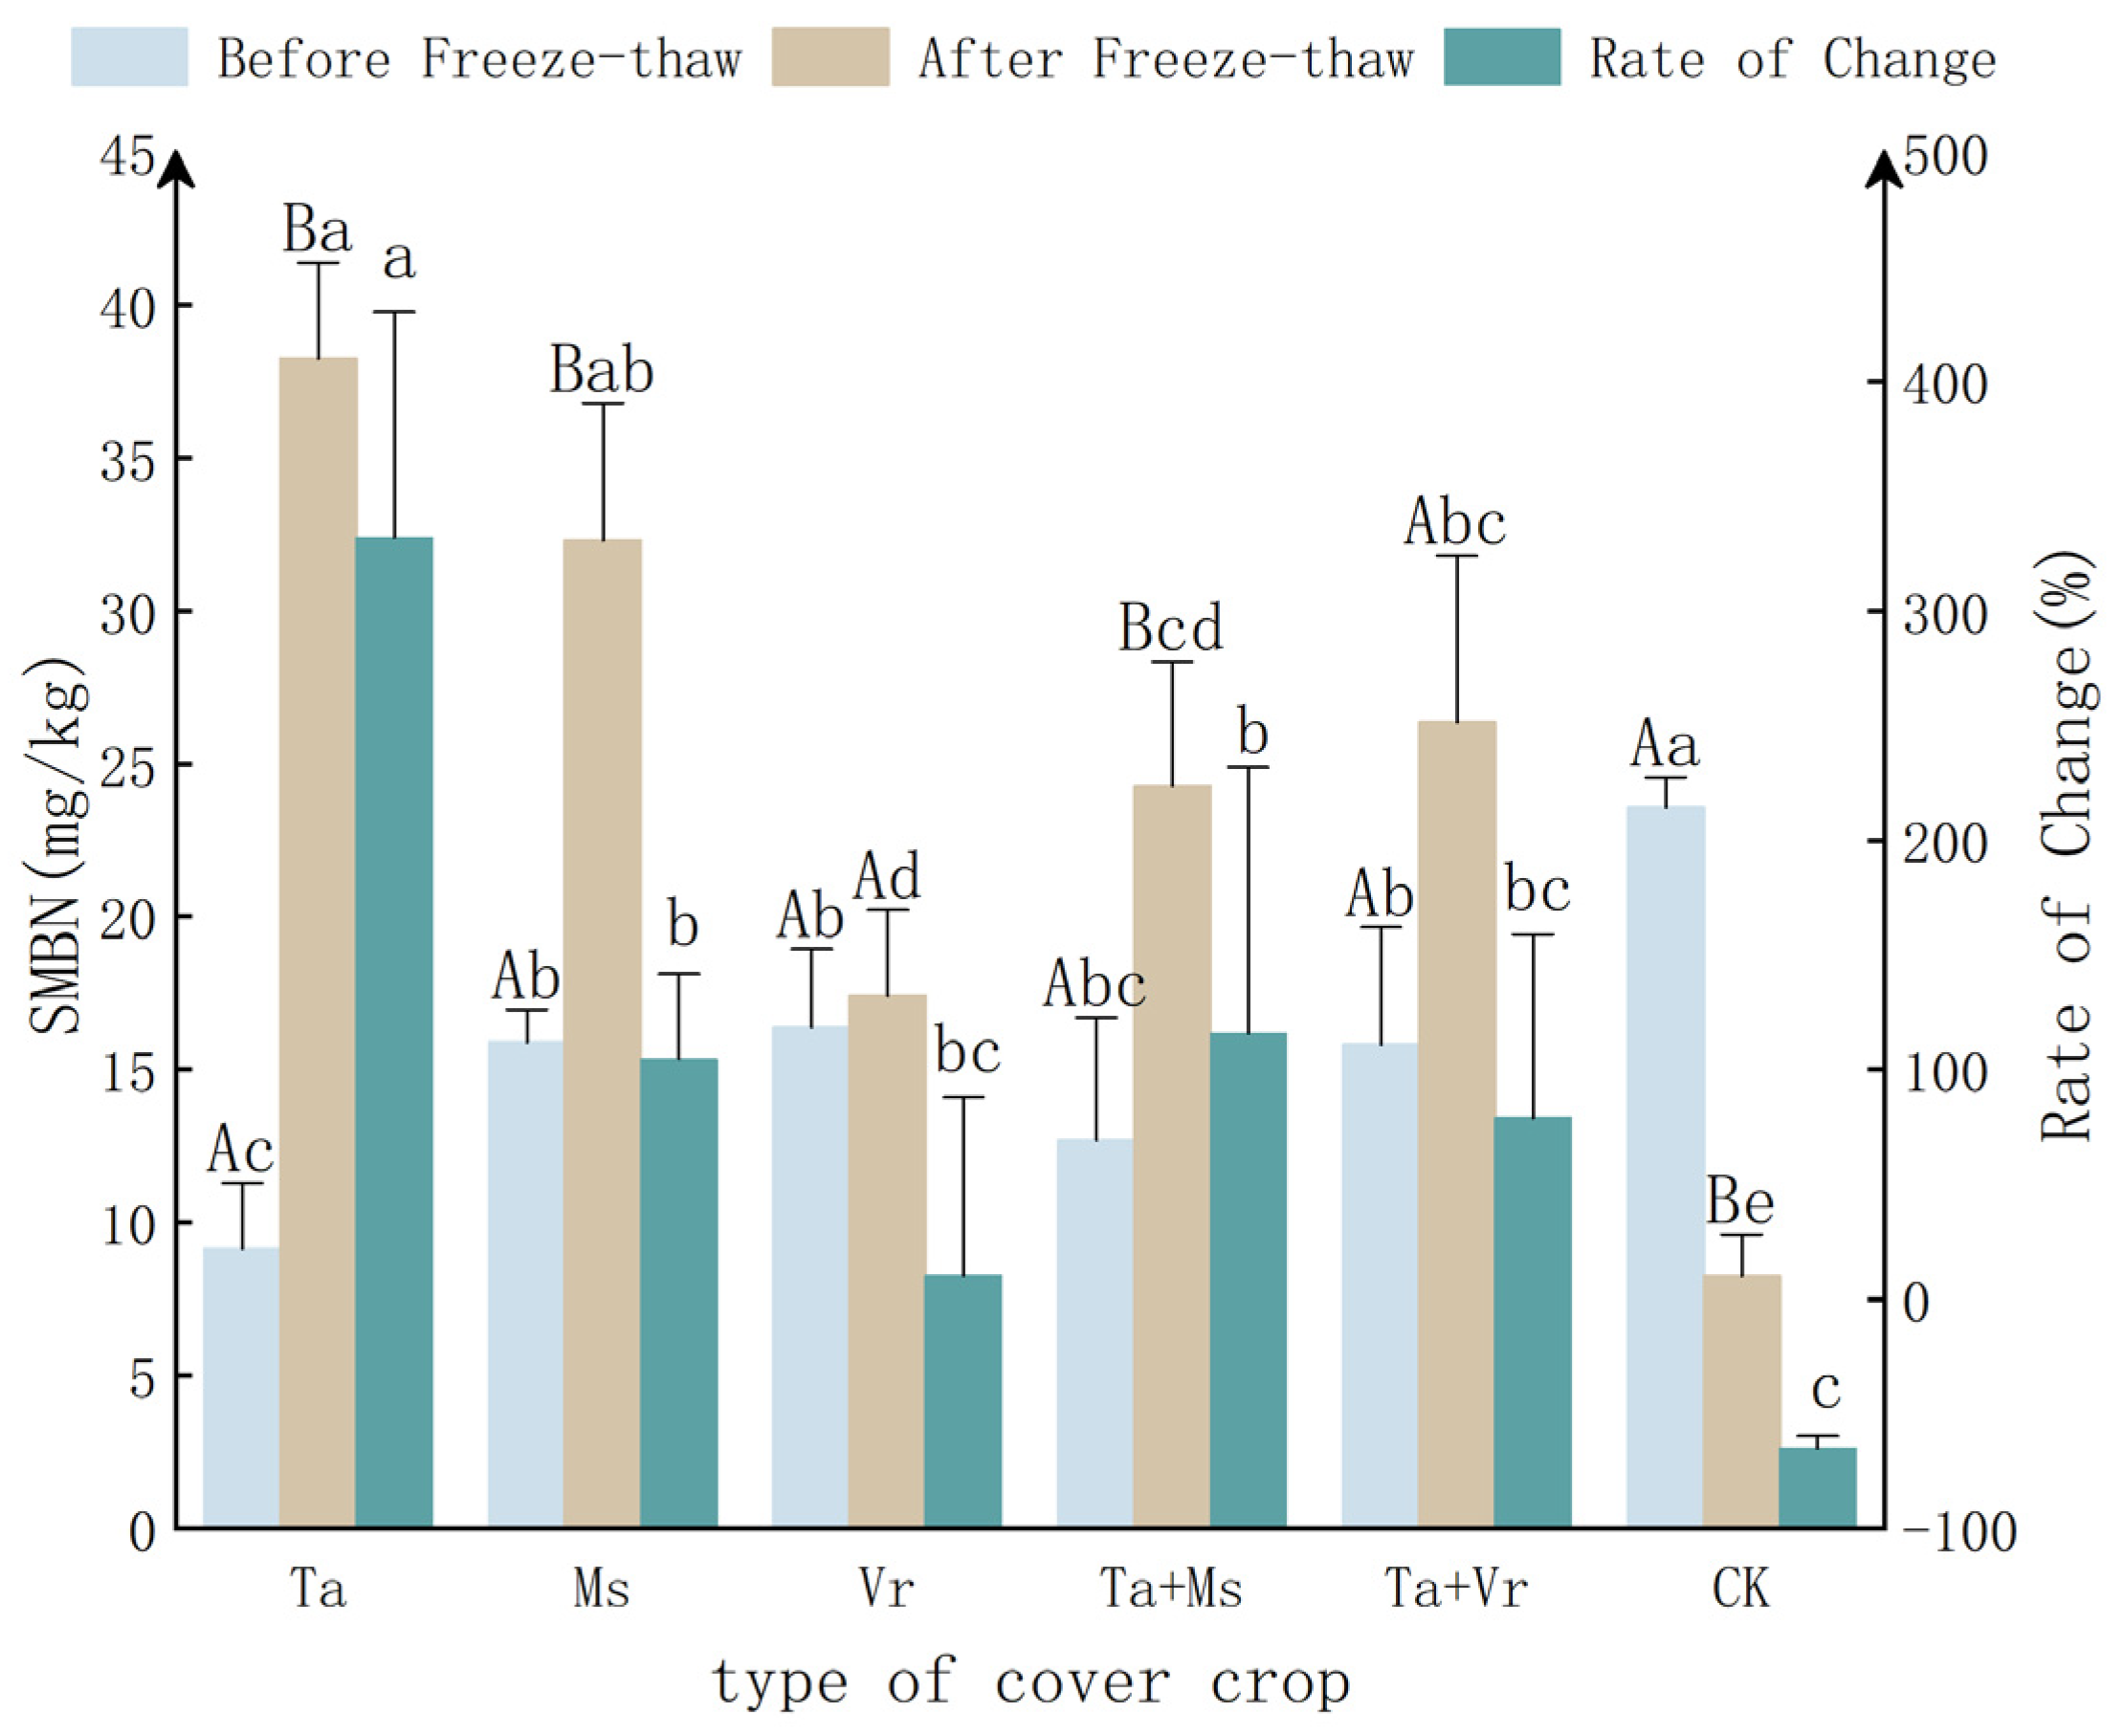
3.2. The Impact of Cover Crops on TN and SMBN

As seen in Figure 3, before seasonal freeze-thaw, the TN content of all plots was CK (2.10 g/kg) > Ta + Ms (2.08 g/kg) > Ta (2.02 g/kg) > Ms (1.97 g/kg) > Ta + Vr (1.96 g/kg) > Vr (1.57 g/kg). TN content of all cover crops plots lower than that of CK. All cover crops plots showed significant differences from CK (p < 0.05), except for Ta + Ms. After seasonal freeze-thaw, the TN content of all plots was Ta (2.13 g/kg) > CK (2.08 g/kg) > Ta + Ms (2.05 g/kg) > Ms (2.01 g/kg) > Ta + Vr (1.94 g/kg) > Vr (1.63 g/kg). Compared with CK, the TN content of Ms, Ta + Vr and Vr showed a significant decrease compared to CK (p < 0.05). Compared with before seasonal freeze-thaw, the TN content of Ta and Vr significantly increased after seasonal freeze-thaw (p < 0.05). Meanwhile, the TN content of CK decreased after experiencing freeze-thaw, but not significant (p > 0.05).
The freeze-thaw change rate of TN in each plot was Ta (5.44%) > Vr (3.56%) > Ms (2.31%) > Ta + Vr (−0.74%) > CK (−0.76%) > Ta + Ms (−1.54%). The freeze-thaw change rates of TN in Poaceae Barnhart plots and the Fabaceae Lindl. plots were higher than that in Poaceae Barnhart and Fabaceae Lindl. mixed plots and CK. The freeze-thaw change rate of TN in all cover crops were higher than that in CK, except for Ta + Ms.
As seen in Figure 4, before seasonal freeze-thaw, the SMBN content of all plots was CK (23.56 mg/kg) > Vr (16.37 mg/kg) > Ms (15.89 mg/kg) > Ta + Vr (15.83 mg/kg) > Ta + Ms (12.68 mg/kg) > Ta (9.15 mg/kg). Compared with the CK, the SMBN content of all cover crops plots significantly decreased (p < 0.05). After seasonal freeze-thaw, the SMBN content of all plots was Ta (38.26 mg/kg) > Ms (32.31 mg/kg) > Ta + Vr (26.34 mg/kg) > Ta + Ms (24.29 mg/kg) > Vr (17.44 mg/kg) > CK (8.26 mg/kg). Compared with the CK, the SMBN content of all cover crops plots significantly increased (p < 0.05). Compared to before seasonal freeze-thaw, the SMBN content of Ta, Ms, and Ta + Ms significantly increased after seasonal freeze-thaw (p < 0.05). The SMBN content of Vr and Ta + Vr increased after experiencing freeze-thaw, but not significantly (p > 0.05). However, the SMBN content of the CK significantly decreased after seasonal freeze-thaw (p < 0.05).
The freeze-thaw change rate of the SMBN in each plot was Ta (332.22%) > Ta + Ms (115.71%) > Ms (104.66%) > Ta + Vr (78.94%) > Vr (10.08%) > CK (−65.03%). In Ta it was significantly higher than in other plots (p < 0.05). The freeze-thaw change rate of the SMBN in all cover crops plots was higher than in the CK.

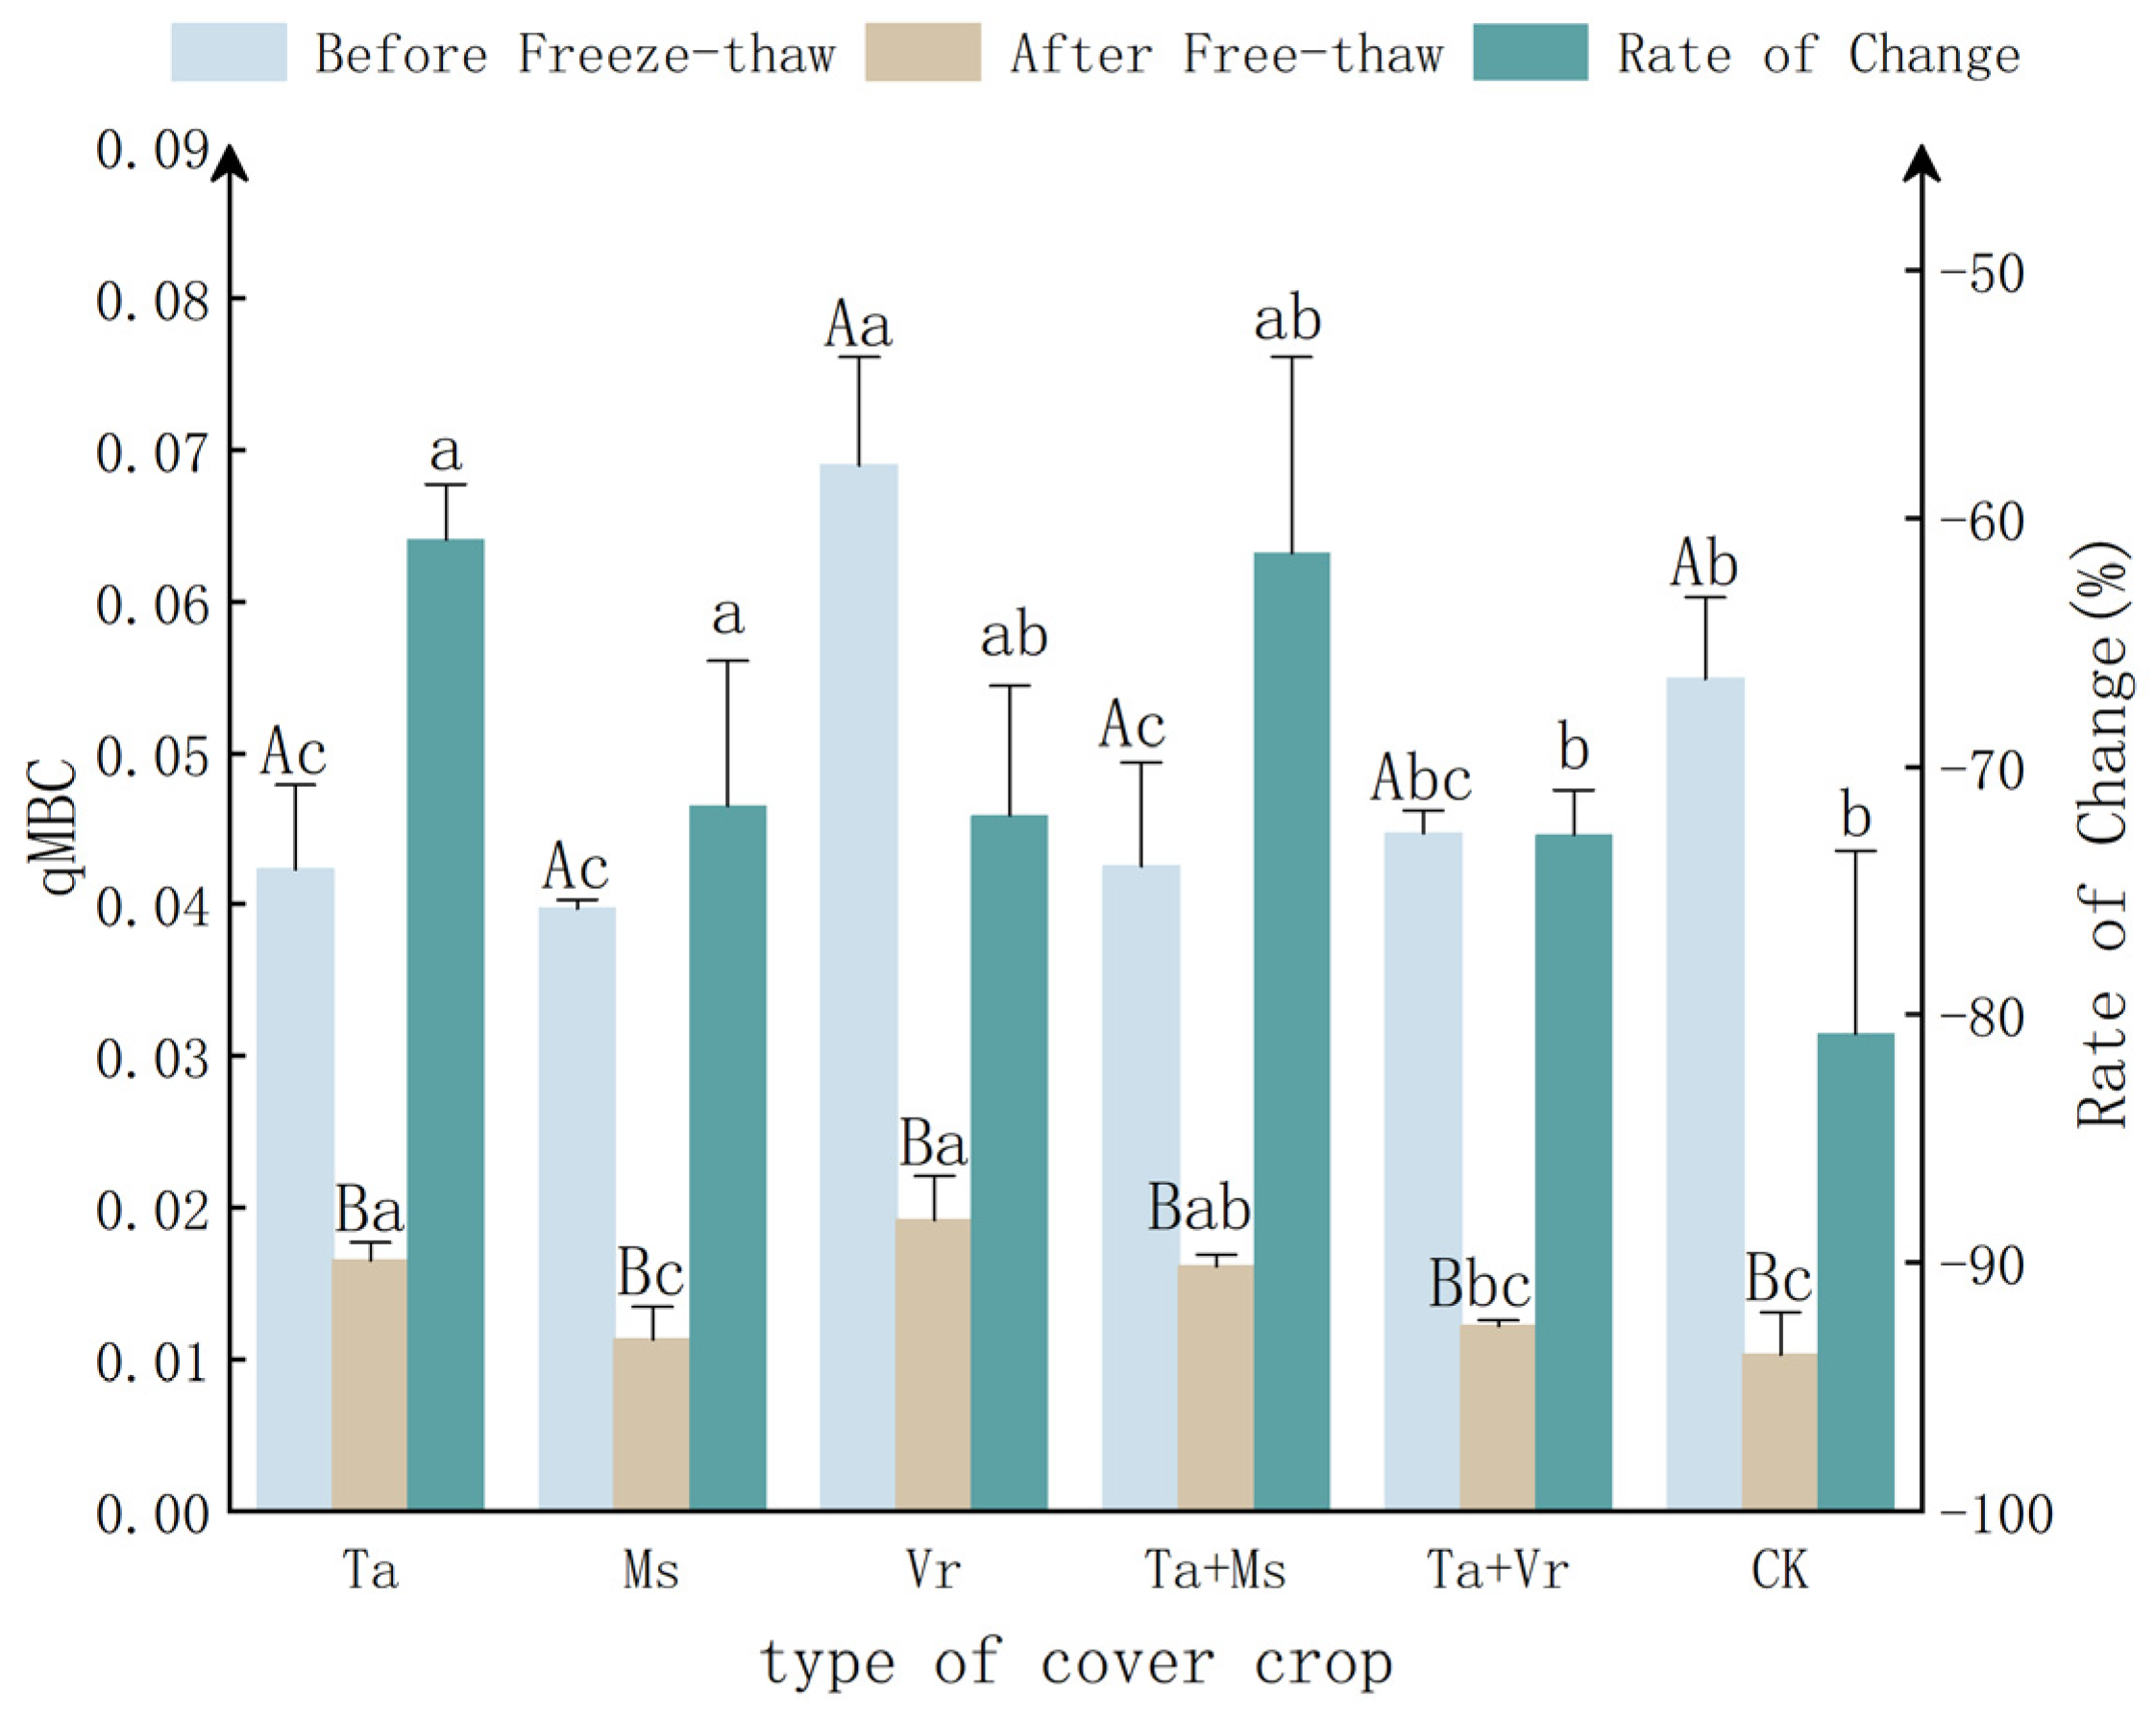
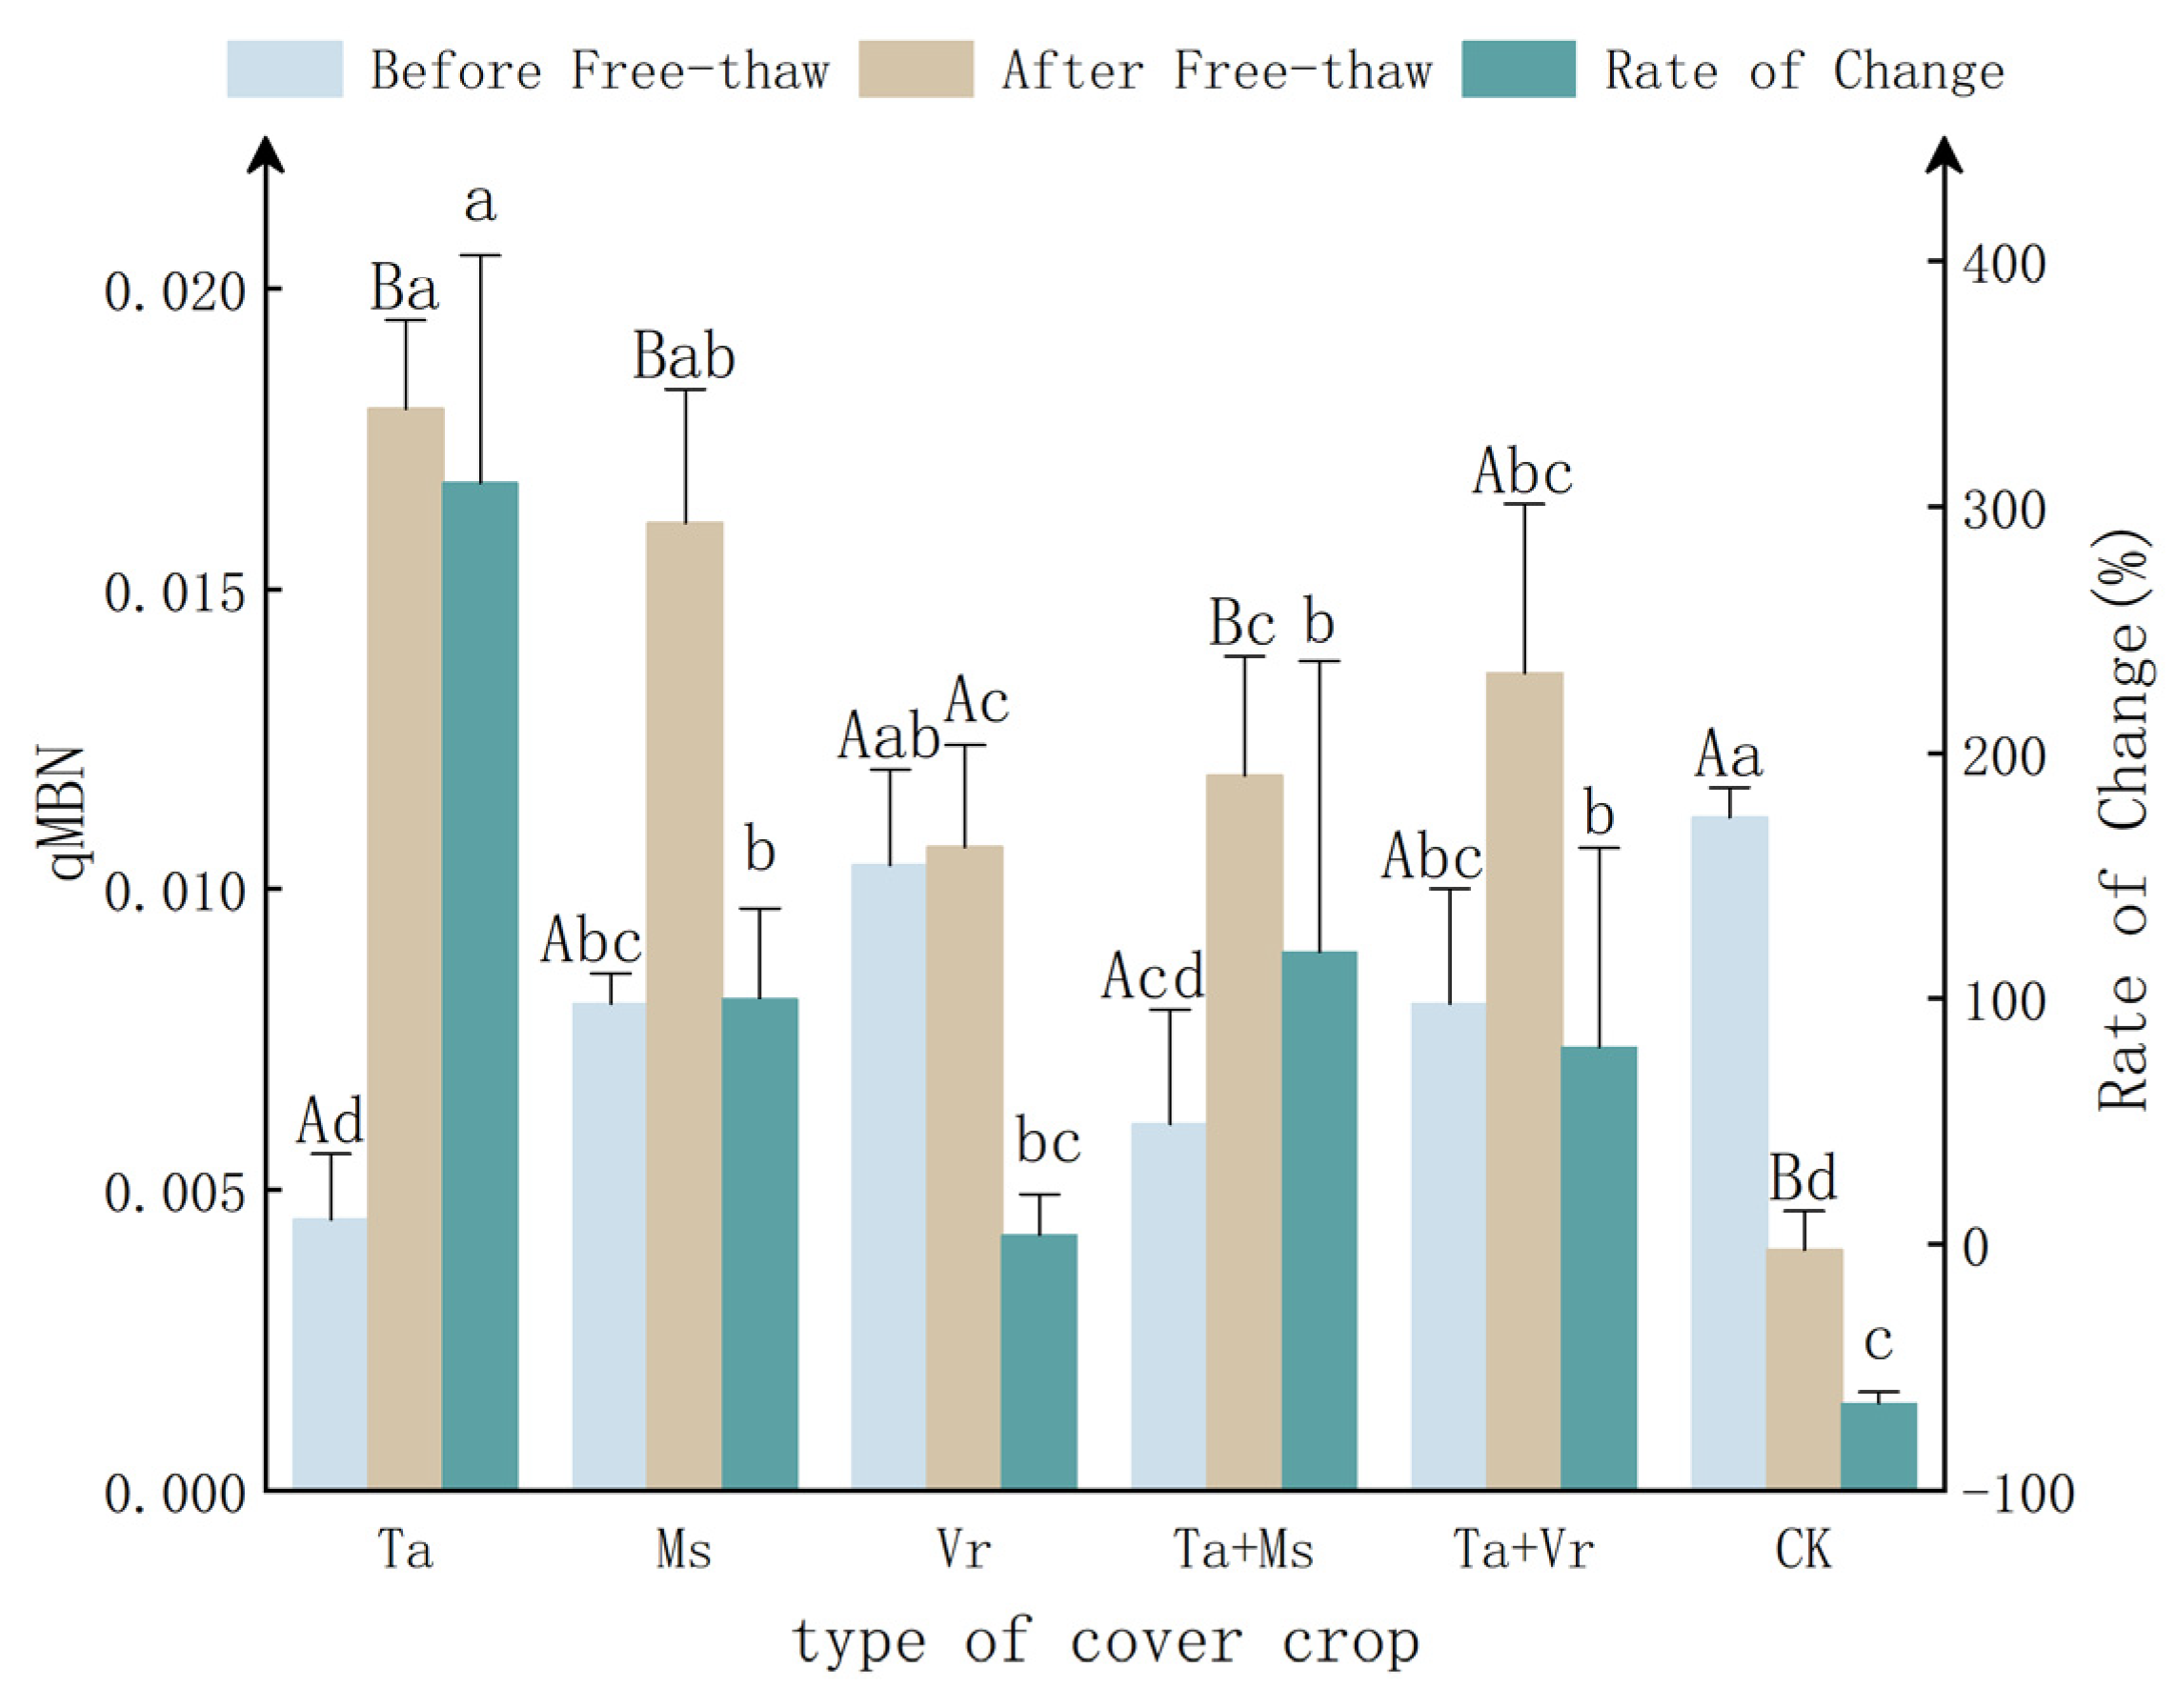
3.3. The Impact of Cover Crops on qMBC and qMBN

As seen in Figure 5, before seasonal freeze-thaw, the qMBC content of all plots was Vr (0.0690) > CK (0.0549) > Ta + Vr (0.0447) > Ta + Ms (0.0425) > Ta (0.0423) > Ms (0.0397). Compared with the CK, the qMBC of Vr significantly increased (p < 0.05), and the qMBC of Ta + Ms, Ta, and Ms significantly decreased (p < 0.05). After seasonal freeze-thaw, the qMBC content of all plots was Vr (0.0192) > Ta (0.0165) > Ta + Ms (0.0161) > Ta + Vr (0.0122) > Ms (0.0113) > CK (0.0103). Compared with the CK, the qMBC of Vr, Ta, and Ta + Ms significantly increased (p < 0.05). The qMBC of all cover crops significantly decreased after they experienced freeze-thaw (p < 0.05).
The freeze-thaw change rate of the qMBC in each plot was Ta (−60.87%) > Ta + Ms (−61.42%) > Ms (−71.57%) > Vr (−71.96%) > Ta + Vr (−72.75%) > CK (−80.78%). The freeze-thaw change rate of the qMBC was consistent with that of the SMBC. The freeze-thaw change rate of the qMBC in all cover crops plots was higher than that in the CK.
As seen in Figure 6, before seasonal freeze-thaw, the qMBN of all plots was CK (0.0112) > Vr (0.0104) > Ta + Vr (0.0081) > Ms (0.0081) > Ta + Ms (0.0061) > Ta (0.0045). All cover crops showed significant differences from the CK (p < 0.05), except for Vr. After seasonal freeze-thaw, the qMBN of all plots was Ta (0.0180) > Ms (0.0161) > Ta + Vr (0.0136) > Ta + Ms (0.0119) > Vr (0.0107) > CK (0.0040). Compared with the CK, the qMBN of all cover crops significantly increased (p < 0.05). Compared with before the seasonal freeze-thaw, the qMBN of Ta, Ms, and Ta + Ms significantly increased after seasonal freeze-thaw (p < 0.05). The qMBN of the CK significantly decreased after it experienced freeze-thaw (p < 0.05).
The freeze-thaw change rate of the qMBN in each plot was Ta (309.92%) > Ta + Ms (119.08%) > Ms (100.09%) > Ta + Vr (80.31%) > Vr (3.75%) > CK (−64.76%). The freeze-thaw change rate of the qMBN was consistent with that of the SMBN. The freeze-thaw change rate of the qMBN in Ta was significantly higher than that in other plots (p < 0.05). Other cover crops plots did not show significant differences in their qMBN before and after freeze-thaw (p > 0.05). In addition, they were all higher than the CK.

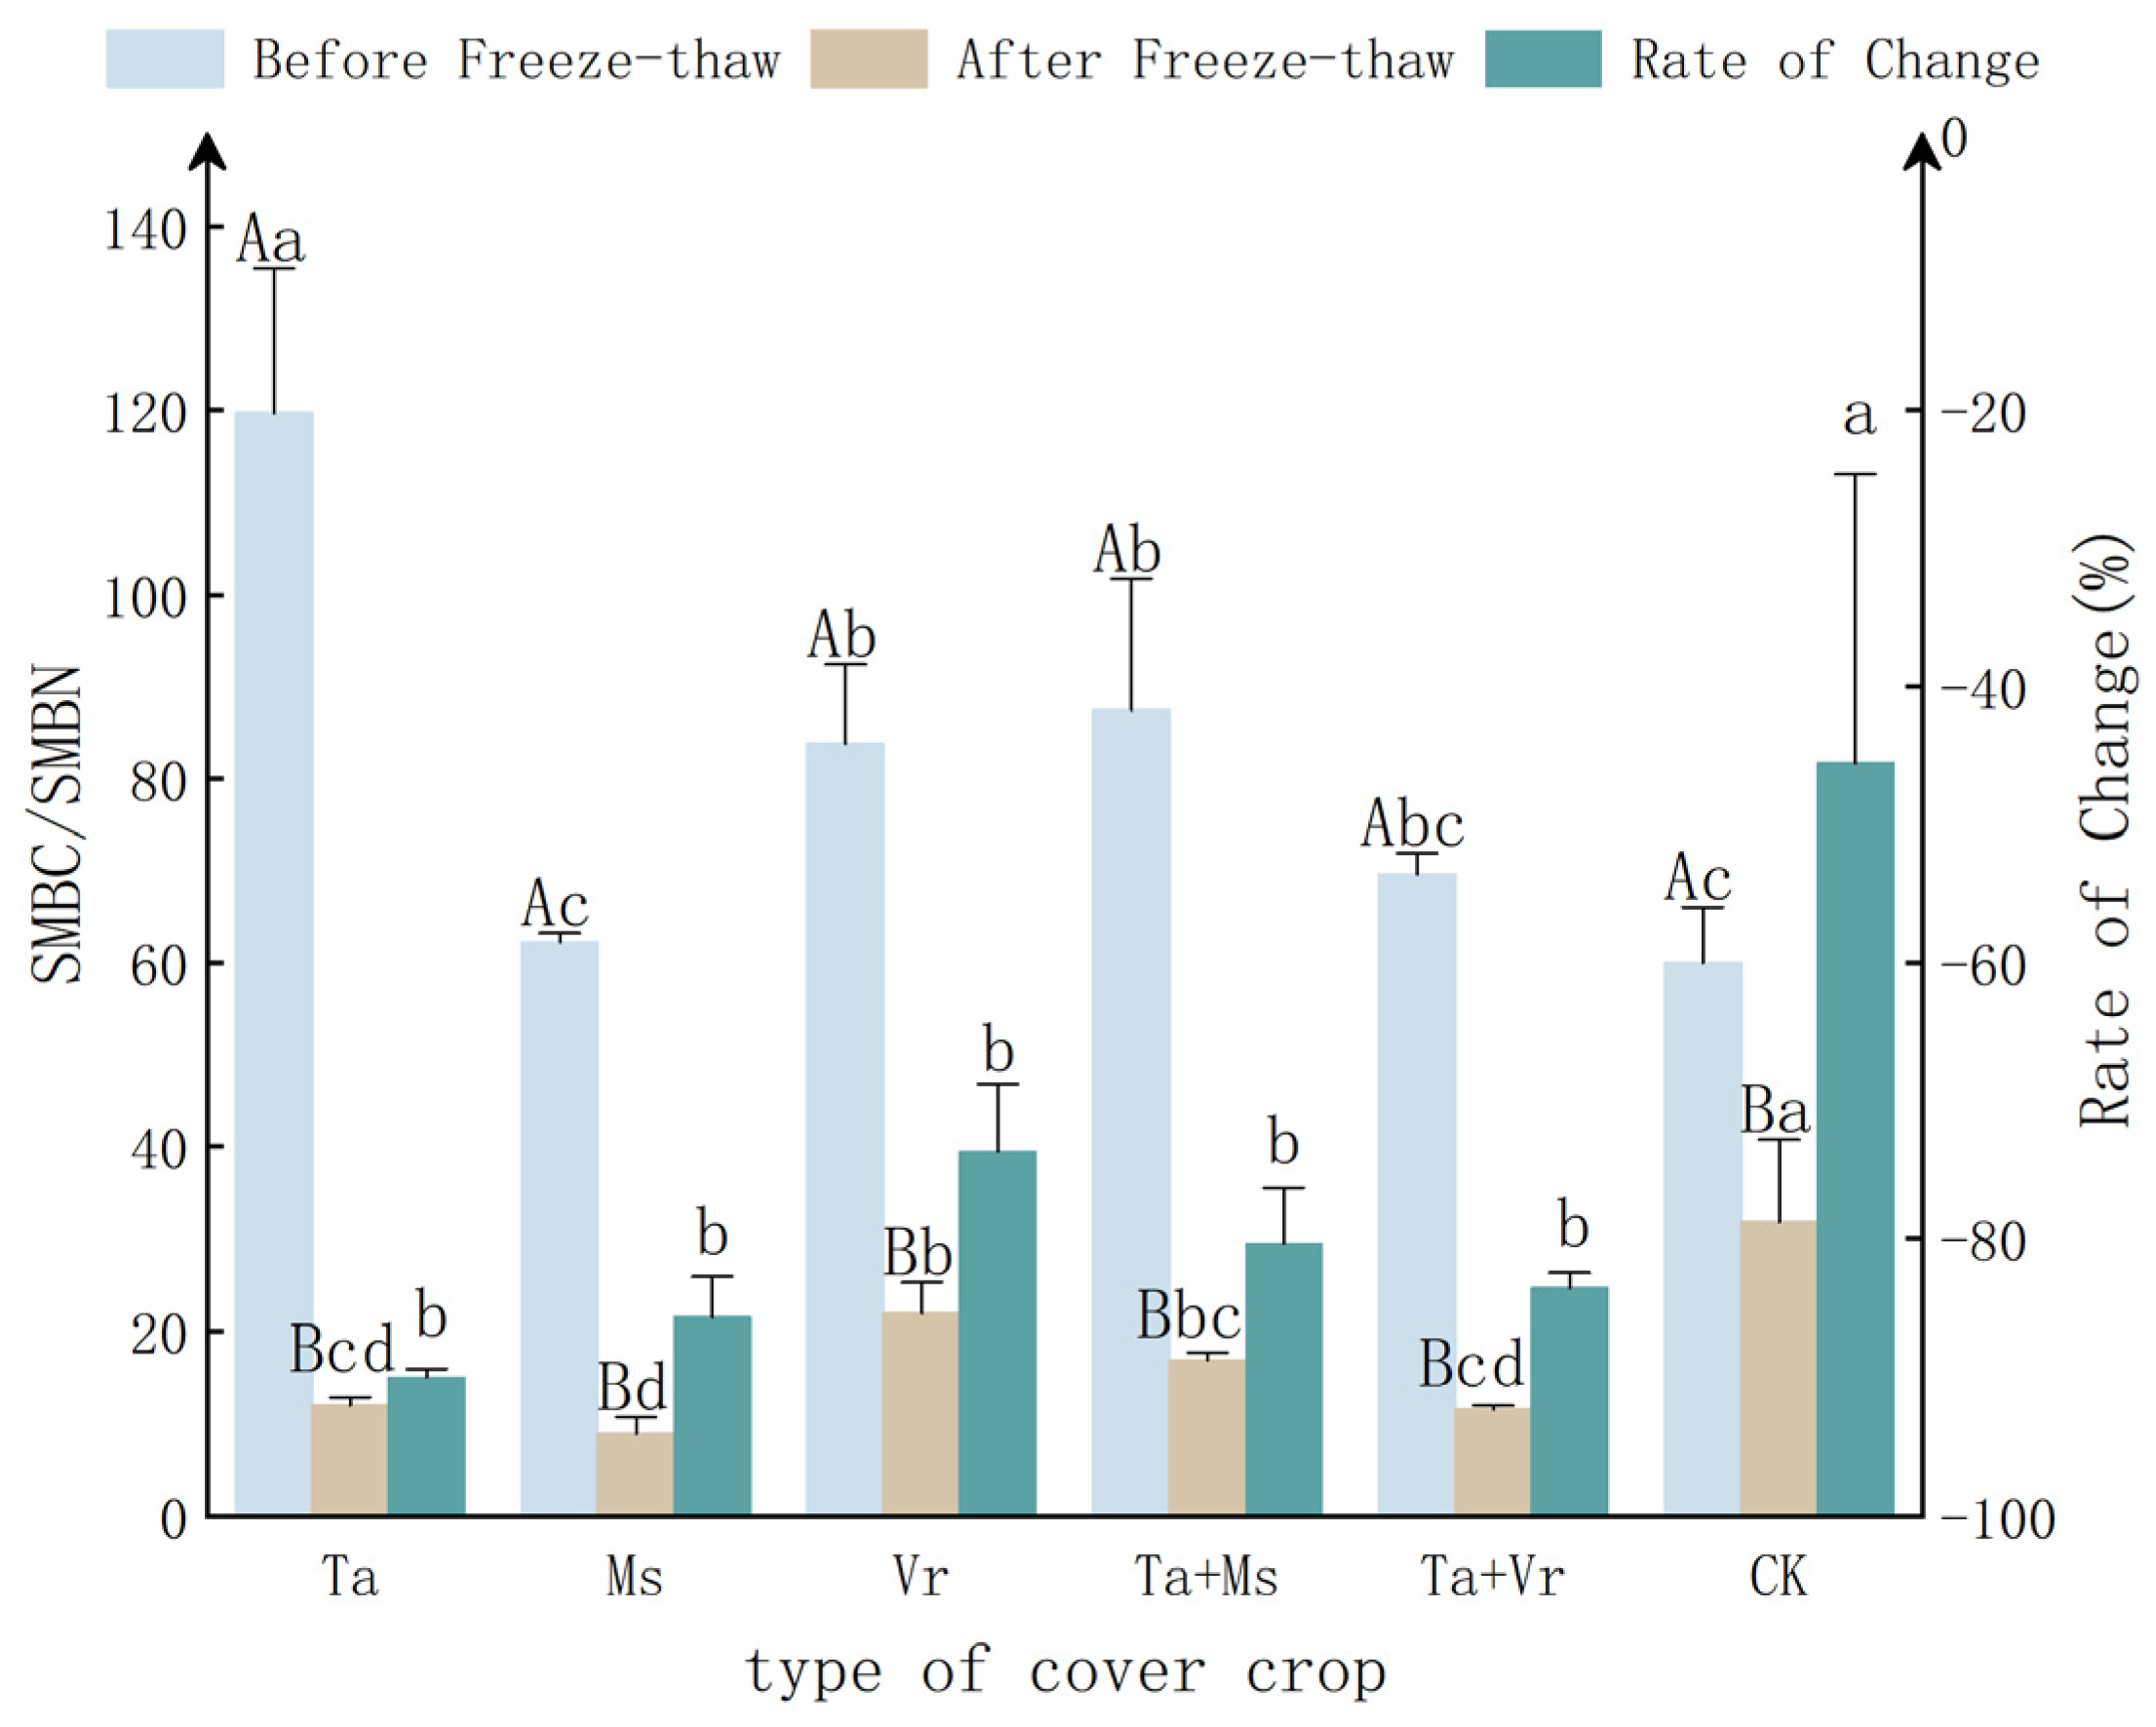
3.4. The Impact of Cover Crops on SOC/TN and SMBC/SMBN

As seen in Figure 7, before seasonal freeze-thaw, the SOC/TN of all plots was Ta (12.83) > Ms (12.66) > Vr (12.66) > Ta + Vr (12.60) > Ta + Ms (12.54) > CK (12.28). All cover crops plots showed significant differences from the CK (p < 0.05), except for Ta + Ms. After seasonal freeze-thaw, the SOC/TN of all plots was Ta (12.96) > Ta + Vr (12.74) > Ms (12.66) > Vr (12.51) > Ta + Ms (12.42) > CK (12.29). Ta, Ta + Vr, and Ms showed significant differences from the CK (p < 0.05). Compared to before seasonal freeze-thaw, the SOC/TN of all plots did not show significant differences after seasonal freeze-thaw (p > 0.05).
The freeze-thaw change rate of the SOC/TN in each plot was Ta + Vr (1.16%) >Ta (1.01%) > CK (0.11%) > Ms (0.03%) > Ta + Ms (−0.97%) > Vr (−1.18%). None of the plots showed significant differences before and after freeze-thaw (p > 0.05).
As seen in Figure 8, before seasonal freeze-thaw, the SMBC/SMBN of all plots was Ta (119.72) > Ta + Ms (87.43) > Vr (83.78) > Ta + Vr (69.63) > Ms (62.21) > CK (60.04). Ta, Ta + Ms, and Vr showed significant differences from the CK (p < 0.05). After seasonal freeze-thaw, the SMBC/SMBN of all plots was CK (31.90) > Vr (21.91) > Ta + Ms (16.81) > Ta (11.87) > Ta + Vr (11.43) > Ms (8.89). All cover crops plots showed significant differences from the CK (p < 0.05). Compared to before seasonal freeze-thaw, the SMBC/SMBN of all plots significantly decreased after seasonal freeze-thaw (p < 0.05).
The freeze-thaw change rate of the SMBC/SMBN in each plot was CK (−45.52%) > Vr (−73.68%) > Ta + Ms (−80.36%) > Ta + Vr (−83.56%) > Ms (−85.69%) > Ta (−90.03%). The CK’s change rate was significantly higher than that of all cover crop plots (p < 0.05). The SMBC/SMBN of Ta was the smallest compared to the other plots.

3.5. Correlation Analysis of Carbon and Nitrogen Related Indicators

As seen in Figure 9, analysing the Pearson correlation between SOC, TN, SMBC, SMBN, qMBC, qMBN, SOC/TN, and SMBC/SMBN, it can be concluded that the correlations between SMBC and SMBN, SMBC and qMBN, and SMBN and qMBC were significantly negative (p < 0.05). The correlations between SOC and TN, SMBC and qMBC, SMBC and SMBC/SMBN, SMBN and qMBN, and qMBC and SMBC/SMBN were extremely significantly positive (p < 0.01). The correlations between SMBN and SMBC/SMBN and qMBN and SMBC/SMBN were extremely significantly negative (p < 0.01).

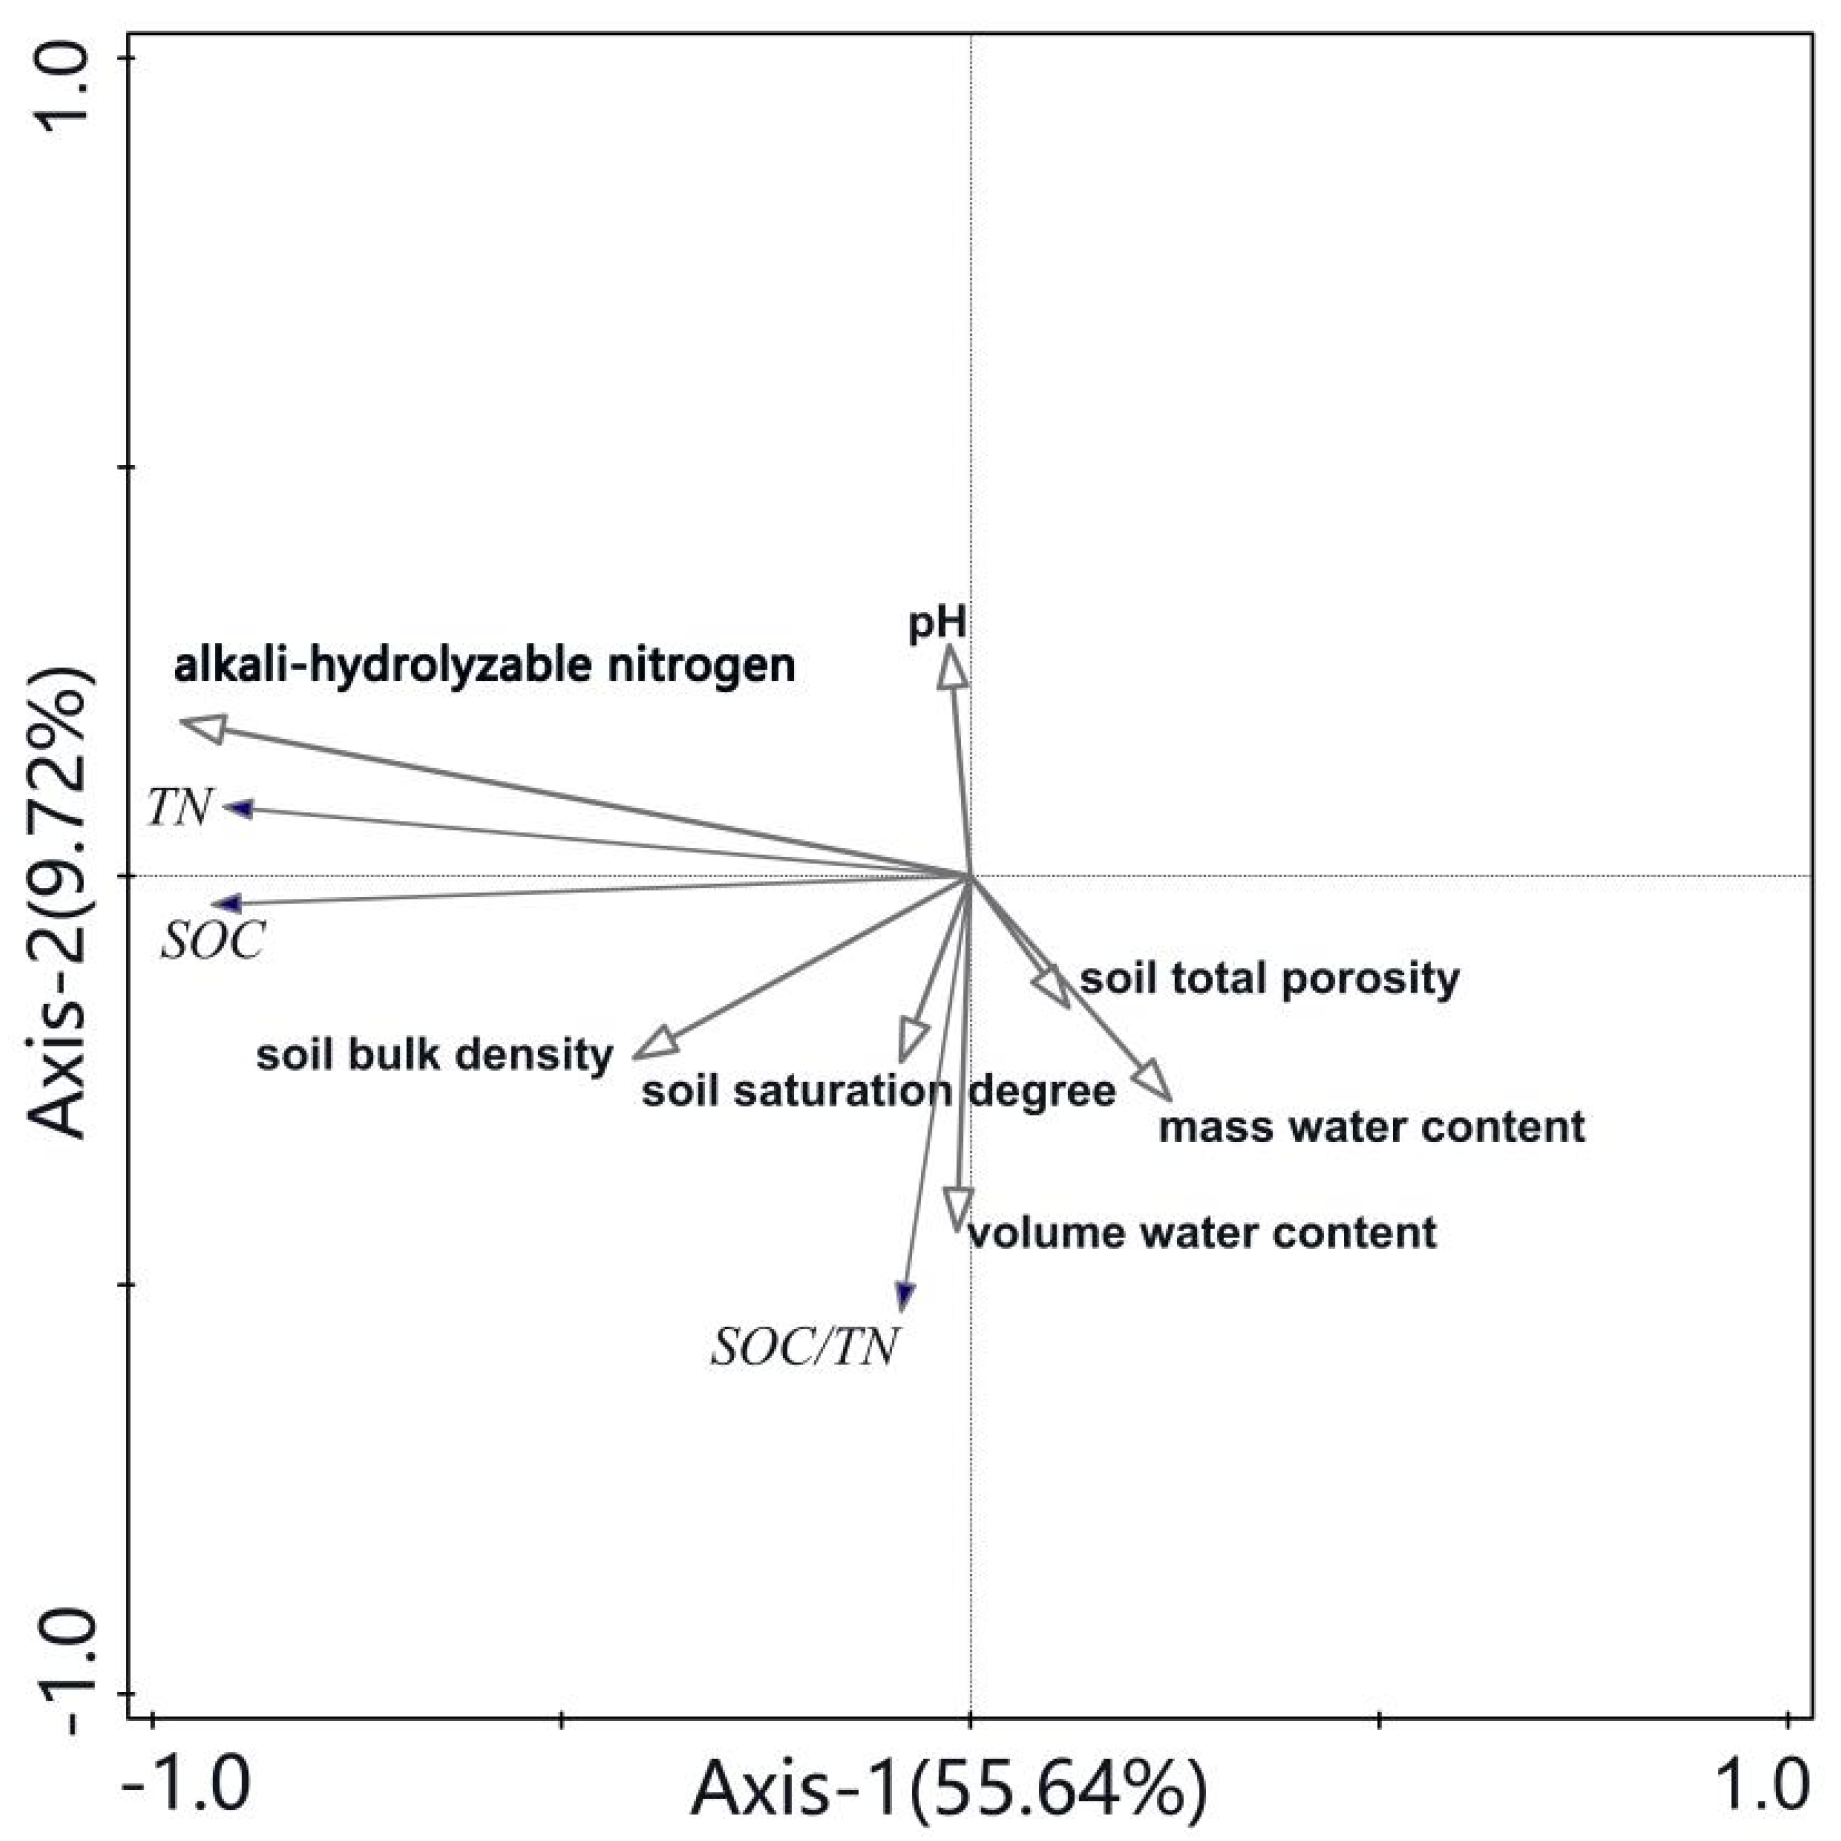
3.6. RDA between Carbon, Nitrogen, and Influence Factors

As seen in Figure 10, the RDA results of the SOC, TN, and C/N ratio to environmental factors indicated that axis 1 and 2 explained 56.64% and 9.72% of the variation seen, respectively. Alkali-hydrolysable nitrogen, the soil saturation degree, soil bulk density, volume water content, soil total porosity, mass water content, and pH explained 53.0%, 5.1%, 3.7%, 3.0%, 0.7%, 0.6%, and 0.2% of the soil organic carbon, total nitrogen, and C/N ratio, respectively. Alkali-hydrolysable nitrogen and the soil saturation degree were significant factors affecting the SOC, TN, and C/N ratio (p < 0.05).
As seen in Figure 11, the RDA results of the SMBC, SMBN, and SMBC/SMBN ratio as environmental factors indicated that axis 1 and 2 explained 55.86% and 8.27% of the variation seen, respectively. The soil saturation degree, mass water content, volume water content, alkali-hydrolysable nitrogen, pH, soil total porosity, and soil bulk density explained 41.7%, 7.9%, 6.6%, 6.1%, 1.7%, 1.5%, and 0.3% of the soil microbial biomass carbon and nitrogen and SMBN/SMBC ratio, respectively. The soil saturation degree, volume water content, mass water content, and alkali-hydrolysable nitrogen were significant factors affecting the SMBC, SMBN, and SMBC/SMBN ratio (p < 0.05).

4. Discussion

4.1. Responses of Soil Microbial Biomass C and N Content of Winter Cover Crops to Seasonal Freeze-thaw Was Greater Than Total Soil C and N

The soil carbon and nitrogen contents were the key factors affecting the bacterial growth in soil, while soil microorganisms also affect soil carbon and nitrogen [34]. A study by Fang et al. [35] found that the mineralization and decomposition of nitrifying bacteria resulted in a decrease in SOC content. Furthermore, the growth and multiplication of nitrifying bacteria affected the process of the conversion of ammonium nitrogen to nitrate nitrogen, thus altering the soil nitrogen fraction [36]. In our study, the regulation of change in SOC, TN and SMBC, SMBN was not consistent. Overall, the SOC and TN content of the soil surface were slightly elevated after seasonal freeze-thaw due to winter cover crops, while their rate of change was smaller compared to the SMBC and SMBN. Novara, A. [37] et al.’s research findings indicated that the effect of cover cropping on total soil organic carbon is not pronounced, which is consistent with the conclusions drawn in our study. It is commonly believed that the SMBC and SMBN in soil only account for a minor portion of the SOC and TN, ranging from 1% to 5% and 2% to 6%, respectively [38,39]. The results obtained in this study were close to this. In addition to microbial biomass carbon, soil organic carbon components also include dissolved organic carbon, easily oxidizable organic carbon, recalcitrant organic carbon, etc. A large percentage of the organic carbon fraction is recalcitrant organic carbon. The proportion of recalcitrant organic carbon in Chinese paddy soils reaches 65% to 68% [40]. Xie et al. [41] demonstrated that recalcitrant organic carbon accounted for about 1/4 of the soil carbon in tropical forests. In addition to microbial nitrogen, soil nitrogen components also include dissolved organic nitrogen, nitrate nitrogen, ammonium nitrogen, etc. The total nitrogen content is a composite of the contents of each nitrogen component. Therefore, even if the rate of change of the SMBC and SMBN before and after freeze-thaw was large, they did not have a major impact on the SOC and TN due to them being a small percentage of the SOC and TN. The turnover time of soil organic carbon is 5 to 10 years [42]. SOC and TN are closely related, and both are affected by soil type, erosion conditions, etc. In this study, the rate of change of SOC and TN before and after freeze-thaw were smaller than those of the SMBC and SMBN. The reason for this may be that, on the one hand, the SMBC and SMBN accounted for a small percentage of the SOC and TN; additionally, they had a weak effect on recalcitrant organic carbon. On the other hand, the turnover time of soil organic matter is generally greater than 5 years, so it did not respond substantively to the cover crops after so short a time as one winter. The turnover time of soil microbial biomass is 1 to 3 years, or even less than 1 year, which enables it to respond rapidly to environmental changes in the soil over a short time [9,10,43,44]. This can be attributed to the fact that the activities of microorganisms are directly affected by environmental factors, such as temperature, humidity, and oxygen content; at the same time, microorganisms have a short life cycle and a rapid rate of reproduction, as well as a rapid response to environmental changes in short periods.
Before seasonal freeze-thaw, the SMBC and SMBN contents of each plot were all less than that in the CK. This may be due to the fact that the cover crops need to take up a lot of nutrients from the soil when growing, and as the soil’s physicochemical properties will change with the planting of cover crops. The SMBC and SMBN are affected by a combination of environmental factors, and further research needs to be carried out. The SMBC and SMBN contents in the CK after freeze-thaw were smaller than those of the different cover crop planting plots. The reason for this is that the cover effect formed by the crops on the surface can effectively reduce water evaporation, and the root system of the cover crops can also improve the soil structure and enhance its water storage capacity [45,46]. Root secretions and litter from cover crops provided fresh organic matter for microorganisms’ growth [47]. These factors provided a favourable condition for the growth and reproduction of microorganisms compared to bare plots. The rate of change of the SMBC in each cover crop plot before and after freeze-thaw was negative, while that of the SMBN was positive. The regulation of change in the SMBC and SMBN was inconsistent. The research findings of Manral, V. [48] et al. indicated that the trends in microbial biomass carbon and nitrogen are generally consistent, which is inconsistent with the results of our study. This may be due to the inconsistent carbon-to-nitrogen ratio released by different microbial communities after being killed by low temperatures. Generally, the carbon-to-nitrogen ratio of bacteria is around 5:1, that of fungi is around 10:1, and that of actinomycetes is around 6:1 [49]. Further research needs to be performed to analyse the composition of soil microbial colonies.
The rate of change of the SOC and TN before and after freeze-thaw was not large, while the rate of change of the SMBC and SMBN was large, and the regulation of change in the qMBC and qMBN were basically the same as those of the SMBC and SMBN, respectively. Although the rate of change of the SMBC and qMBC before and after freeze-thaw was negative for each cover crops’ plot, the degree of decrease was small relative to the CK, suggesting that the cover crops’ planting had a protective effect on the SMBC in the soil surface layer. Covering crops can reduce the decrease in the SMBC content and qMBC. Interestingly, the change rates of the SMBN and qMBN before and after freeze-thaw were both positive, indicating that the planting of covering crops had a positive effect on the SMBC, SMBN, qMBC, and qMBN of the surface soil, which can help to maintain soil ecological balance, promote nutrient cycling, and organic matter decomposition. The change rate of the C/N ratio before and after freeze-thaw was small, and all cover crops’ plots before and after freeze-thaw were slightly higher than the CK. This shows that winter cover crops have a certain effect that increases the soil C/N ratio. The increase in the C/N ratio was beneficial for increasing nitrogen fixation, reducing nitrogen loss, improving soil quality and fertility, and promoting plant growth [50]. Compared to the CK, cover crops reduced the SMBC/SMBN ratio of the soil surface, which may be a result of an increase in the bacterial communities in the soil microbial community [51].

4.2. The Primary Factors Driving Soil Total and Microbial C and N Change Were Inconsistent

The RDA results indicated that alkali-hydrolysable nitrogen and soil saturation degree were significant factors affecting the SOC, TN, and C/N ratio (p < 0.05). The alkali-hydrolysable nitrogen had the highest degree of explanation. The soil saturation degree, although at a significant level, was relatively poorly explained compared to the alkali-hydrolysable nitrogen. Alkali-hydrolysable nitrogen, also known as quick-acting nitrogen, is the nitrogen that is quickly available for plant growth. It corresponds to the plants, ability to supply soil nitrogen. On the one hand, alkali-hydrolysable nitrogen plays an instrumental role in plant growth and enhances soil fertility [52]. On the other hand, the promotion of plant root growth by alkaline nitrogen decomposition affects microorganisms and the decomposition of organic matter, in which microorganisms are involved [53,54].
The soil saturation degree, volume water content, mass water content, and alkali-hydrolysable nitrogen were significant factors affecting the SMBC, SMBN, and SMBC/SMBN ratio (p < 0.05). The soil saturation degree had the highest degree of explanation. The soil saturation degree is the ratio of the volume of pore water in the soil to the total volume of pores. The soil saturation degree describes the degree to which pores in the soil are filled with water. A higher saturation degree can lead to insufficient oxygen supply in the soil, slow down the metabolic activity of microorganisms, and decrease the decomposition rate of organic matter. Previous results [55] have shown that an excessive soil saturation degree can limit the life activities of soil microorganisms, thereby affecting the soil content of microbial biomass carbon and nitrogen. Meanwhile, a higher soil saturation degree can limit the nitrification and reduction reactions of nitrogen, directly affecting the ability of soil microorganisms to utilize nitrogen and influencing the amount of microbial biomass nitrogen. Although the volume water content, mass water content, and alkali-hydrolysable nitrogen had reached a significant level, their explanatory power was relatively small compared with the soil saturation degree. Winter cover crops can reduce water evaporation. The electrostatic effect of the water film increases adhesion between soil particles, effectively minimizing the negative effects of wind and water erosion, reducing the loss of organic matter and preserving nutrients for soil microorganisms [56]. This has a positive impact on microbial biomass. Meanwhile, the coordinated relationship between water content and voids is relaxed, facilitating the growth of microorganisms.
The results of the RDA showed that the total organic carbon, total nitrogen, microbial biomass carbon, and microbial biomass nitrogen had common influence factors (soil saturation degree, alkali-hydrolysable nitrogen). Alkali-hydrolysable nitrogen, which had a greater impact on soil organic carbon and total nitrogen, also had an impact on microbial biomass carbon and nitrogen, but this impact was relatively smaller. The soil saturation degree, which had a greater impact on microbial biomass carbon and nitrogen, also had an impact on total carbon and nitrogen, but this impact was relatively smaller.

4.3. Triticum aestivum L. Showed the Best Performance

In this study, the positive effect of the Triticum aestivum L. monoculture on the SOC, TN, and SMBC and SMBN content was the best, possibly because of its long growing period, which allowed its root system to remain in the soil for a longer period of time during winter freezing and thawing compared to other cover crops. This persistent root system helped to protect the soil structure, promoted the activity of soil microorganisms, and it was also conducive to the input of organic matter, providing carbon sources and nutrients for microorganisms. Studies by Abdalla, M et al. [57] and Meisinger JJ et al. [58] have concluded that, whether a monoculture of leguminous plants, non-leguminous plants, or both, cover crops can effectively inhibit the loss of soil nitrogen, which was consistent with the conclusion of our study.

5. Conclusions

In the black soil area of Northeastern China, winter cover crops are conducive to mitigating the adverse effects of drought and low temperatures. They also provide nutrients for soil microorganisms during seasonal freeze-thaw cycles. Winter cover crops can mitigate the reduction of soil microbial biomass carbon caused by freeze-thaw in winter and also increase the soil microbial nitrogen content. The freeze-thaw change rate of total soil organic carbon was smaller compared to that of microbial biomass carbon, as well as the freeze-thaw change rate of total nitrogen compared to that of microbial biomass nitrogen. Alkali-hydrolysable nitrogen had the greatest impact on the SOC, TN, and C/N ratio. The soil saturation degree had the greatest impact on soil microbial biomass carbon and nitrogen, as well as on the SMBC/SMBN ratio. The monoculture of Triticum aestivum L. showed the best improvement effect on the soil total organic carbon, total nitrogen, microbial biomass carbon, and nitrogen. This can serve as a reference when choosing winter cover crops for the black soil of Northeast China.

Author Contributions

Conceptualization, Y.L. and E.W.; methodology, software, and formal analysis, Y.L.; validation, Y.L., E.W., Q.Z. and Y.L.; investigation, Y.L., Y.Z., Q.Z., S.L. and X.W.; writing—original draft preparation, Y.L.; writing—review and editing, Y.L., E.W. and Q.Z.; funding acquisition, E.W. All authors have read and agreed to the published version of the manuscript.

Funding

This research was funded by the National Key Research and Development Program of China (2021YFD1500600) and the Fundamental Research Funds for the Central Universities (No. 2572021BA06).

Data Availability Statement

The data are not publicly available, though the data may be made available on request from the corresponding author.

Conflicts of Interest

The authors declare no conflicts of interest.

Abbreviations

Soil total organic carbon (SOC), total nitrogen (TN), soil microbial biomass carbon (SMBC), soil microbial biomass nitrogen (SMBN), quotient of microbial biomass carbon (qMBC), quotient of microbial biomass nitrogen (qMBN), carbon-to-nitrogen ratio (SOC/TN), microbial biomass carbon-to-nitrogen ratio (SMBC/SMBN), Triticum aestivum L. (Ta), Medicago sativa L. (Ms), Vicia villosa Roth. (Vr), Triticum aestivum L. and Medicago sativa L. (Ta + Ms), Triticum aestivum L. and Vicia villosa Roth. (Ta + Vr), winter fallow fields (CK).

References

  1. Li, R.; Xie, R.; Luo, Y.; Sui, P.; Zheng, H.; Ming, B.; Wang, H.; Liu, W.; Zheng, J.; Li, S. The effects of different conservation tillage methods on maize growth and yield in the typical black soil region. Chin. J. Eco. Agric. 2024, 32, 71–82. [Google Scholar] [CrossRef]
  2. Zhang, Z.; Yin, Z.; Yu, P.; Qi, Z.; Wei, Y.; Li, A. Effects of Soil and Water Conservation Measures on Soil Physical and Chemical Properties in Slope Farmland in Black Soil Region. Trans. Chin. Soc. Agric. Mach. 2023, 55, 282–293. (in Chinese) [Google Scholar] [CrossRef]
  3. Ye, Y.; Fang, X.Q.; Ren, Y.Y.; Zhang, X.Z.; Chen, L. Cropland cover change in Northeast China during the past 300 years. Sci. China Ser. D Earth Sci. 2009, 52, 1172–1182. [Google Scholar] [CrossRef]
  4. Zhao, Z.H.; Zhang, C.Z.; Wang, H.Y.; Li, F.; Pan, H.; Yang, Q.; Li, J.P.; Zhang, J.B. The Effects of Natural Humus Material Amendment on Soil Organic Matter and Integrated Fertility in the Black Soil of Northeast China: Preliminary Results. Agronomy 2023, 13, 794. [Google Scholar] [CrossRef]
  5. Wang, S.; Zhao, Y.; Wang, J.; Gao, J.; Zhu, P.; Cui, X.A.; Xu, M.; Zhou, B.; Lu, C. Estimation of soil organic carbon losses and counter approaches from organic materials in black soils of northeastern China. J. Soils Sediments 2020, 20, 1241–1252. [Google Scholar] [CrossRef]
  6. Ding, F.; Hu, Y.L.; Li, L.J.; Li, A.; Shi, S.W.; Lian, P.Y.; Zeng, D.H. Changes in soil organic carbon and total nitrogen stocks after conversion of meadow to cropland in Northeast China. Plant Soil 2013, 373, 659–672. [Google Scholar] [CrossRef]
  7. Hu, Q.Y.; Liu, T.Q.; Ding, H.N.; Li, C.F.; Tan, W.F.; Yu, M.; Liu, J.; Cao, C.G. Effects of nitrogen fertilizer on soil microbial residues and their contribution to soil organic carbon and total nitrogen in a rice-wheat system. Appl. Soil Ecol. 2023, 181, 104648. [Google Scholar] [CrossRef]
  8. Liu, H.; Wu, M.L.; Gao, H.; Gao, J.H.; Wang, S.J. Application of 15N tracing and bioinformatics for estimating microbial-mediated nitrogen cycle processes in oil-contaminated soils. Environ. Res. 2023, 217, 114799. [Google Scholar] [CrossRef]
  9. Nair, A.; Ngouajio, M. Soil microbial biomass, functional microbial diversity, and nematode community structure as affected by cover crops and compost in an organic vegetable production system. Appl. Soil Ecol. 2012, 58, 45–55. [Google Scholar] [CrossRef]
  10. Gutiérrez-Girón, A.; Rubio, A.; Gavilán, R. Temporal variation in microbial and plant biomass during summer in a Mediterranean high-mountain dry grassland. Plant Soil 2014, 374, 803–813. [Google Scholar] [CrossRef]
  11. Jiang, L.Z.; Ushio, M.; Kitayama, K. Changes of soil chemical properties, microbial biomass and enzymatic activities along a gradient of forest degradation in logged over tropical rain forests, Borneo. Plant Soil 2023, 485, 525–536. [Google Scholar] [CrossRef]
  12. Hua, B.; Li, Z.W.; Gao, W.K.; Feng, H.L.; Chen, N.; Li, J.Y.; Ji, X.M.; Zhang, L.; Wu, Z.Y.; Yan, S.; et al. Soil amendment in plastic greenhouse using modified biochar: Soil bacterial diversity responses and microbial biomass carbon and nitrogen. Biotechnol. Lett. 2021, 43, 655–666. [Google Scholar] [CrossRef] [PubMed]
  13. Yu, Z.-Y.; Chen, F.-S.; Zeng, D.-H.; Zhao, Q.; Chen, G.-S. Soil Inorganic Nitrogen and Microbial Biomass Carbon and Nitrogen Under Pine Plantations in Zhanggutai Sandy Soil *1 *1 Project supported by the National Key Basic Research Program (973 Program) of China (No. 2007CB106803), the Knowledge Innovation Program of the Chinese Academy of Sciences (No. KZCX1-YW-08-02), and the Key Laboratory of Terrestrial Ecological Process and Regional Ecological Safety in Liaoning Province, China (No. 06ZDS212SS). Pedosphere 2008, 18, 775–784. [Google Scholar] [CrossRef]
  14. Ji, H.N.; Yuan, G.S.; Liu, Y.; Yu, J.Z.; Li, S.H.; Wu, Q.F.; Qin, H.; Chen, J.H. Short-Term Effects of Bamboo Biochar and Oyster Shell Powder on Soil Organic Carbon Fraction, Microbial Respiration, and Enzymatic Stoichiometry in a Lei Bamboo Plantation. Forests 2023, 14, 853. [Google Scholar] [CrossRef]
  15. Gajda, A.M.; Czyz, E.A.; Klimkowicz-Pawlas, A. Effects of Different Tillage Intensities on Physicochemical and Microbial Properties of a Eutric Fluvisol Soil. Agronomy 2021, 11, 1497. [Google Scholar] [CrossRef]
  16. Cao, R.; Yang, W.Q.; Chang, C.H.; Wang, Z.; Wang, Q.; Jiang, Y.R.; Li, H.; Tan, B. Soil Microbial Biomass Carbon and Freeze-Thaw Cycles Drive Seasonal Changes in Soil Microbial Quotient Along a Steep Altitudinal Gradient. J. Geophys. Res. Biogeosci. 2021, 126, e2021JG006325. [Google Scholar] [CrossRef]
  17. Melero, S.; López-Garrido, R.; Murillo, J.M.; Moreno, F. Conservation tillage: Short- and long-term effects on soil carbon fractions and enzymatic activities under Mediterranean conditions. Soil Tillage Res. 2009, 104, 292–298. [Google Scholar] [CrossRef]
  18. Gao, D.C.; Bai, E.; Wang, S.Y.; Zong, S.W.; Liu, Z.P.; Fan, X.L.; Zhao, C.H.; Hagedorn, F. Three-dimensional mapping of carbon, nitrogen, and phosphorus in soil microbial biomass and their stoichiometry at the global scale. Glob. Change Biol. 2022, 28, 6728–6740. [Google Scholar] [CrossRef]
  19. Chen, L.; Zhang, J.B.; Zhao, B.Z.; Yan, P.; Zhou, G.X.; Xin, X.L. Effects of straw amendment and moisture on microbial communities in Chinese fluvo-aquic soil. J. Soils Sediments 2014, 14, 1829–1840. [Google Scholar] [CrossRef]
  20. Van Eerd, L.L.; Chahal, I.; Peng, Y.J.; Awrey, J.C. Influence of cover crops at the four spheres: A review of ecosystem services, potential barriers, and future directions for North America. Sci. Total Environ. 2023, 858, 159990. [Google Scholar] [CrossRef]
  21. Ghimire, R.; Ghimire, B.; Mesbah, A.O.; Sainju, U.M.; Idowu, O.J. Soil Health Response of Cover Crops in Winter Wheat-Fallow System. Agron. J. 2019, 111, 2108–2115. [Google Scholar] [CrossRef]
  22. Fan, Y.; Xin, X.; Zhong, X.; Yang, J.; Zhu, A.; Zou, H. Effects of Intercropping of Maize and Legume Cover Crops on Enzyme Activities and Fungal Community Characteristics in Fluvo-Aquic Soil. Soils 2021, 53, 1236–1243. (in Chinese) [Google Scholar] [CrossRef]
  23. O’Farrell, C.; Forge, T.; Hart, M.M. Using Brassica Cover Crops as Living Mulch in a Vineyard, Changes over One Growing Season. J. Int. J. Plant Biol. 2023, 14, 1105–1116. [Google Scholar] [CrossRef]
  24. Muhammad, I.; Wang, J.; Sainju, U.M.; Zhang, S.H.; Zhao, F.Z.; Khan, A. Cover cropping enhances soil microbial biomass and affects microbial community structure: A meta-analysis. Geoderma 2021, 381, 114696. [Google Scholar] [CrossRef]
  25. Sui, X.; Huo, H.-N.; Bao, X.-L.; He, H.-B.; Zhang, X.-D.; Liang, C.; Xie, H.-T. Research advances on cover crop plantation and its effects on subsequent crop and soil environment. J. Appl. Ecol. 2021, 32, 2666–2674. (in Chinese) [Google Scholar] [CrossRef]
  26. Jian, S.; Li, S.; Liu, S.; Li, X. Research advances of cover crops and their important roles. Acta Agron. Sin. 2022, 48, 1–14. (in Chinese) [Google Scholar] [CrossRef]
  27. Zhang, J.; Zhang, Y.; Hou, S.; Li, H.; Zhang, R.; Wang, H.; Wang, X. Research progress on benefits and rational selection of cover crops. Trans. Chin. Soc. Agric. Eng. 2023, 39, 23–34. (in Chinese) [Google Scholar] [CrossRef]
  28. Hong, Y.H.; Zhao, D.; Zhang, F.Z.; Shen, G.N.; Yuan, Y.; Gao, Y.M.; Yan, L.; Wei, D.; Wang, W.D. Soil water-stable aggregates and microbial community under long-term tillage in black soil of Northern China. Ecotoxicology 2021, 30, 1754–1768. [Google Scholar] [CrossRef]
  29. Wang, Q.; Ren, Y.; Meng, L. Simultaneous determination of total nitrogen and organic carbon in soil with an elemental analyzer. Chin. J. Anal. Lab. 2013, 32, 41–45. (in Chinese) [Google Scholar] [CrossRef]
  30. Sun, K.; Liu, J.; Ling, W. A review on Determination of Soil Microbial Biomass. Chin. J. Soil Sci. 2013, 44, 1010–1016. (in Chinese) [Google Scholar] [CrossRef]
  31. Liang, Y.; Ni, C.; Li, Y.; Xiao, L.; Jian, M. Research of Paddy Soil Dissolved Organic Matter Composition and Its Binding Process with Cd2+. Acta Pedol. Sin. 2024. (in Chinese) [Google Scholar] [CrossRef]
  32. Cao, M. Effects of Different Sand-Compacting Crops on Soil Quality in the Central Dry Zone of Ningxia. Master’s Thesis, Ningxia University, Xining, China, 2023. [Google Scholar]
  33. Huo, H.; Yang, J.; Yao, R.; Xie, W.; Wang, X.; Zhang, L. Effect of Composite Interlayer on Soil Water-Salt Transport in Hetao Irrigation District. Soils 2024, 56. (in Chinese) [Google Scholar] [CrossRef]
  34. Demoling, F.; Figueroa, D.; Bååth, E. Comparison of factors limiting bacterial growth in different soils. Soil Biol. Biochem. 2007, 39, 2485–2495. [Google Scholar] [CrossRef]
  35. Fang, H.; Yang, X.; Zhang, X.; Liang, A.; Shen, Y. Simulation on Dynamics of Soil Organic Carbon Under the Effect of Tillage and Water Erosion. Acta Pedol. Sin. 2006, 43, 730–735. (in Chinese). [Google Scholar]
  36. Li, P.; Lang, M.; Xu, X.-H.; Li, Y.-S.; Zhu, S.-X. Study on regularity of greenhouse gas emissions from black soil with different reclamation years. Environ. Sci. 2014, 35, 4321–4328. (in Chinese) [Google Scholar] [CrossRef]
  37. Novara, A.; Catania, V.; Tolone, M.; Gristina, L.; Laudicina, V.A.; Quatrini, P. Cover Crop Impact on Soil Organic Carbon, Nitrogen Dynamics and Microbial Diversity in a Mediterranean Semiarid Vineyard. Sustainability 2020, 12, 3256. [Google Scholar] [CrossRef]
  38. Zhang, C.; Nan, Z. Research progress of soil microbial biomass in China. Pratacultural Sci. 2010, 27, 50–57. (in Chinese). [Google Scholar]
  39. Li, W.T.; Xie, L.L.; Zhao, C.Z.; Hu, X.F.; Yin, C.Y. Nitrogen Fertilization Increases Soil Microbial Biomass and Alters Microbial Composition Especially Under Low Soil Water Availability. Microb. Ecol. 2023, 86, 536–548. [Google Scholar] [CrossRef]
  40. Chang, L.; Liang, X.; Wang, L.; Li, Z.; Zhan, F.; He, Y. Characteristics and Influencing Factors of Soil Organic Carbon Sink in Paddy Fields in China: A Review. Soils 2023, 55, 487–493. (in Chinese) [Google Scholar] [CrossRef]
  41. Xie, L.; Wang, S.; Xiao, B.; Wang, Z.; Guo, Z.; Zhang, K.; Zhang, L.; Fan, Y.; Guo, X.; Luo, S.; et al. Responses of soil carbon component accumulation and allocation to tropical forest restoration. Acta Ecol. Sin. 2023, 43, 9877–9890. (in Chinese) [Google Scholar] [CrossRef]
  42. Xiao, J.J.; Wang, X.; Zhao, Y.F.; Li, J.; Tang, J.K.; Wang, K.C.; Hao, Z.G.; Jiang, S.L.; Zhou, X.H.; Liu, H.Y. Soil organic carbon stability of vegetation restoration during 11-year-old grassland succession. J. Soils Sediments 2023, 23, 2344–2355. [Google Scholar] [CrossRef]
  43. Bhople, P.; Djukic, I.; Keiblinger, K.; Zehetnere, F.; Liu, D.; Bierbaumer, M.; Zechmeister-Boltenstern, S.; Joergensen, R.G.; Murugan, R. Variations in soil and microbial biomass C, N and fungal biomass ergosterol along elevation and depth gradients in Alpine ecosystems. Geoderma 2019, 345, 93–103. [Google Scholar] [CrossRef]
  44. Ali, S.; Liu, K.L.; Ahmed, W.; Jing, H.; Qaswar, M.; Anthonio, C.K.; Maitlo, A.A.; Lu, Z.; Liu, L.S.; Zhang, H.M. Nitrogen Mineralization, Soil Microbial Biomass and Extracellular Enzyme Activities Regulated by Long-Term N Fertilizer Inputs: A Comparison Study from Upland and Paddy Soils in a Red Soil Region of China. Agronomy 2021, 11, 2057. [Google Scholar] [CrossRef]
  45. Jian, J.S.; Du, X.; Reiter, M.S.; Stewart, R.D. A meta-analysis of global cropland soil carbon changes due to cover cropping. Soil Biol. Biochem. 2020, 143, 107735. [Google Scholar] [CrossRef]
  46. Tosi, M.; Ogilvie, C.M.; Spagnoletti, F.N.; Fournier, S.; Martin, R.C.; Dunfield, K.E. Cover Crops Modulate the Response of Arbuscular Mycorrhizal Fungi to Water Supply: A Field Study in Corn. Plants 2023, 12, 1015. [Google Scholar] [CrossRef] [PubMed]
  47. Jiménez-González, M.A.; López-Romano, H.; Carral, P.; Alvarez-Gonzalez, A.M.; Herranz-Luque, J.E.; Sastre-Rodríguez, B.E.; García-Díaz, A.; Muñoz-Organero, G.; Marques, M.J. Ten-Year Impact of Cover Crops on Soil Organic Matter Quantity and Quality in Semi-Arid Vineyards. Land 2023, 12, 2143. [Google Scholar] [CrossRef]
  48. Manral, V.; Bargali, K.; Bargali, S.S.; Karki, H.; Chaturvedi, R.K. Seasonal Dynamics of Soil Microbial Biomass C, N and P along an Altitudinal Gradient in Central Himalaya, India. Sustainability 2023, 15, 1651. [Google Scholar] [CrossRef]
  49. Ming, Z.; Zhen, B.A.I.; Wei, Z.; Xueli, D.; Douyan, S.; Junfeng, Z.H.U.; Ping, Z.H.U. Seasonal change of the long-term fertilization on microbial biomass C and N of arable Mollisol. Ecol. Environ. 2007, 16, 1498–1503. (in Chinese) [Google Scholar] [CrossRef]
  50. Purwanto, B.H.; Alam, S. Impact of intensive agricultural management on carbon and nitrogen dynamics in the humid tropics. Soil Sci. Plant Nutr. 2020, 66, 50–59. [Google Scholar] [CrossRef]
  51. Bai, J.; Deng, W.; Zhu, Y.; Zhai, J.; Zhang, Y. Comparative study on the distribution characteristics of soil organic matter and total nitrogen in wetlands: A case study of Xianghai and Horqin Nature Reserve. Sci. Geogr. Sin. 2002, 22, 233–237. (in Chinese). [Google Scholar]
  52. Cheng, X.K.; Zhou, T.; Liu, S.H.; Sun, X.B.; Zhou, Y.F.; Xu, L.; Xie, B.L.; Ying, J.P.; Shi, Y.J. Effects of Climate on Variation of Soil Organic Carbon and Alkali-Hydrolyzed Nitrogen in Subtropical Forests: A Case Study of Zhejiang Province, China. Forests 2023, 14, 914. [Google Scholar] [CrossRef]
  53. Wang, Y.; Guo, M.S.; Li, Y.F.; Yin, X.L.; Guo, J.Y.; Wang, J. Responses of Soil Bacterial Communities and Chemical Properties to Grazing Regulation in Desert Steppe. Agronomy 2023, 13, 2817. [Google Scholar] [CrossRef]
  54. Ao, L.; Zhao, M.C.; Li, X.; Sun, G.Y. Different Urban Forest Tree Species Affect the Assembly of the Soil Bacterial and Fungal Community. Microb. Ecol. 2022, 83, 447–458. [Google Scholar] [CrossRef] [PubMed]
  55. Feng, S.; Leung, A.K.; Ng, C.W.W.; Liu, H.W. Theoretical analysis of coupled effects of microbe and root architecture on methane oxidation in vegetated landfill covers. Sci. Total Environ. 2017, 599, 1954–1964. [Google Scholar] [CrossRef]
  56. Du, X.; Jian, J.S.; Du, C.; Stewart, R.D. Conservation management decreases surface runoff and soil erosion. Int. Soil Water Conserv. Res. 2022, 10, 188–196. [Google Scholar] [CrossRef]
  57. Abdalla, M.; Hastings, A.; Cheng, K.; Yue, Q.; Chadwick, D.; Espenberg, M.; Truu, J.; Rees, R.M.; Smith, P. A critical review of the impacts of cover crops on nitrogen leaching, net greenhouse gas balance and crop productivity. Glob. Change Biol. 2019, 25, 2530–2543. [Google Scholar] [CrossRef]
  58. Meisinger, J.J.; Ricigliano, K.A. Nitrate Leaching from Winter Cereal Cover Crops Using Undisturbed Soil-Column Lysimetersle. J. Environ. Qual. 2017, 46, 576–584. [Google Scholar] [CrossRef]
Figure 1. SOC content before and after seasonal freeze-thaw. Different capital letters indicate significant differences of SOC content between before and after seasonal freeze-thaw in the same plots (p < 0.05). Different lowercase letters indicate significant differences of SOC content before and after seasonal freeze-thaw in different plots (p < 0.05) and indicate significant differences of SOC content’s freeze-thaw change rate in different plots (p < 0.05). Abbreviations: Triticum aestivum L. (Ta), Medicago sativa L. (Ms), Vicia villosa Roth. (Vr), Triticum aestivum L. and Medicago sativa L. mixed planting (Ta + Ms), Triticum aestivum L. and Vicia villosa Roth. mixed planting (Ta + Vr), winter fallow fields (CK).
Agronomy 14 00603 g001
Figure 2. SMBC content before and after seasonal freeze-thaw. Different capital letters indicate significant differences of SMBC content between before and after seasonal freeze-thaw in the same plots (p < 0.05). Different lowercase letters indicate significant differences of SMBC content before and after seasonal freeze-thaw in different plots (p < 0.05) and indicate significant differences of SMBC content’s freeze-thaw change rate in different plots (p < 0.05). Abbreviations: Triticum aestivum L. (Ta), Medicago sativa L. (Ms), Vicia villosa Roth. (Vr), Triticum aestivum L. and Medicago sativa L. mixed planting (Ta + Ms), Triticum aestivum L. and Vicia villosa Roth. mixed planting (Ta + Vr), winter fallow fields (CK).
Agronomy 14 00603 g002
Figure 3. TN content before and after seasonal freeze-thaw. Different capital letters indicate significant differences in TN content between before and after seasonal freeze-thaw in the same plots (p < 0.05). Different lowercase letters indicate significant differences in TN content before and after seasonal freeze-thaw in different plots (p < 0.05) and indicate significant differences in TN content’s freeze-thaw change rate in different plots (p < 0.05). Abbreviations: Triticum aestivum L. (Ta), Medicago sativa L. (Ms), Vicia villosa Roth. (Vr), Triticum aestivum L. and Medicago sativa L. mixed planting (Ta + Ms), Triticum aestivum L. and Vicia villosa Roth. mixed planting (Ta + Vr), winter fallow fields (CK).
Agronomy 14 00603 g003
Figure 4. SMBN content before and after seasonal freeze-thaw. Different capital letters indicate significant differences in SMBN content between before and after seasonal freeze-thaw in the same plots (p < 0.05). Different lowercase letters indicate significant differences in SMBN content before and after seasonal freeze-thaw in different plots (p < 0.05) and indicate significant differences in SMBN content’s freeze-thaw change rate in different plots (p < 0.05). Abbreviations: Triticum aestivum L. (Ta), Medicago sativa L. (Ms), Vicia villosa Roth. (Vr), Triticum aestivum L. and Medicago sativa L. mixed planting (Ta + Ms), Triticum aestivum L. and Vicia villosa Roth. mixed planting (Ta + Vr), winter fallow fields (CK).
Agronomy 14 00603 g004
Figure 5. qMBC before and after seasonal freeze-thaw. Different capital letters indicate significant differences in qMBC between before and after seasonal freeze-thaw in the same plots (p < 0.05). Different lowercase letters indicate significant differences in qMBC before and after seasonal freeze-thaw in different plots (p < 0.05) and indicate significant differences in qMBC’s freeze-thaw change rate in different plots (p < 0.05). Abbreviations: Triticum aestivum L. (Ta), Medicago sativa L. (Ms), Vicia villosa Roth. (Vr), Triticum aestivum L. and Medicago sativa L. mixed planting (Ta + Ms), Triticum aestivum L. and Vicia villosa Roth. mixed planting (Ta + Vr), winter fallow fields (CK).
Agronomy 14 00603 g005
Figure 6. qMBN before and after seasonal freeze-thaw. Different capital letters indicate significant differences in qMBN between before and after seasonal freeze-thaw in the same plots (p < 0.05). Different lowercase letters indicate significant differences in qMBN before and after seasonal freeze-thaw in different plots (p < 0.05) and indicate significant differences in qMBN ’s freeze-thaw change rate in different plots (p < 0.05). Abbreviations: Triticum aestivum L. (Ta), Medicago sativa L. (Ms), Vicia villosa Roth. (Vr), Triticum aestivum L. and Medicago sativa L. mixed planting (Ta + Ms), Triticum aestivum L. and Vicia villosa Roth. mixed planting (Ta + Vr), winter fallow fields (CK).
Agronomy 14 00603 g006
Figure 7. SOC/TN before and after seasonal freeze-thaw. Different capital letters indicate significant differences in SOC/TN between before and after seasonal freeze-thaw in the same plots (p < 0.05). Different lowercase letters indicate significant differences in SOC/TN before and after seasonal freeze-thaw in different plots (p < 0.05) and indicate significant differences in SOC/TN’s freeze-thaw change rate in different plots (p < 0.05). Abbreviations: Triticum aestivum L. (Ta), Medicago sativa L. (Ms), Vicia villosa Roth. (Vr), Triticum aestivum L. and Medicago sativa L. mixed planting (Ta + Ms), Triticum aestivum L. and Vicia villosa Roth. mixed planting (Ta + Vr), winter fallow fields (CK).
Agronomy 14 00603 g007
Figure 8. SMBC/SMBN before and after seasonal freeze-thaw. Different capital letters indicate significant differences in SMBC/SMBN between before and after seasonal freeze-thaw in the same plots (p < 0.05). Different lowercase letters indicate significant differences in SMBC/SMBN before and after seasonal freeze-thaw in different plots (p < 0.05) and indicate significant differences in SMBC/SMBN’s freeze-thaw change rate in different plots (p < 0.05). Abbreviations: Triticum aestivum L. (Ta), Medicago sativa L. (Ms), Vicia villosa Roth. (Vr), Triticum aestivum L. and Medicago sativa L. mixed planting (Ta + Ms), Triticum aestivum L. and Vicia villosa Roth. mixed planting (Ta + Vr), winter fallow fields (CK).
Agronomy 14 00603 g008
Figure 9. Correlation heatmap between carbon- and nitrogen-related indicators.
Agronomy 14 00603 g009
Figure 10. RDA of SOC, TN, and C/N ratio as influence factors.
Agronomy 14 00603 g010
Figure 11. RDA of SMBC, SMBN, and SMBC/SMBN ratio as influence factors.
Agronomy 14 00603 g011
Table 1. Basic physicochemical properties of soil (average value of before and after freeze-thaw cycles).
TreatmentsMass Water Content (%)Volume Water Content (%) Soil Total Porosity (%)Soil Saturation Degree (%)Soil Bulk Density (g/cm3)Alkali-Hydrolysable Nitrogen (mg/kg)pH
Ta24.9828.3856.0151.231.13 178.50 5.97
Ms26.3627.4957.8448.101.04 170.92 5.90
Vr25.7625.6457.8044.331.01 139.33 6.00
Ta + Ms20.4923.8154.2944.141.16 186.67 5.94
Ta + Vr21.7623.9457.3241.911.10 177.92 6.12
CK24.5625.0956.6645.061.02 178.50 6.10
Abbreviations in Table 1: Triticum aestivum L. (Ta), Medicago sativa L. (Ms), Vicia villosa Roth. (Vr), Triticum aestivum L. and Medicago sativa L. mixed planting (Ta + Ms), Triticum aestivum L. and Vicia villosa Roth. mixed planting (Ta + Vr), winter fallow fields (CK).
Disclaimer/Publisher’s Note: The statements, opinions and data contained in all publications are solely those of the individual author(s) and contributor(s) and not of MDPI and/or the editor(s). MDPI and/or the editor(s) disclaim responsibility for any injury to people or property resulting from any ideas, methods, instructions or products referred to in the content.

