Communication

Small Farm Holder Cropping Systems Influence Microbial Profiles in an Equatorial Rainforest Agroecosystem

by
Christine Matindu
1,
Nimalka M. Weerasuriya
2,
Francis N. Muyekho
3,
Irena F. Creed
2,4,*,
R. Greg Thorn
2 and
Anthony W. Sifuna
5
1
Department of Biological Sciences, Masinde Muliro University of Science and Technology, Kakamega 50100, Kenya
2
Department of Biology, Western University, London, ON N6A 5B7, Canada
3
Department of Agriculture and Land Use Management, School of Agriculture, Veterinary Science and Technology, Masinde Muliro University of Science and Technology, Kakamega 50100, Kenya
4
Department of Physical and Environmental Sciences, University of Toronto, Toronto, ON M5S 1A1, Canada
5
Department of Medical Biochemistry, Masinde Muliro University of Science and Technology, Kakamega 50100, Kenya
*
Author to whom correspondence should be addressed.
Agronomy 2024, 14(4), 646; https://doi.org/10.3390/agronomy14040646
Submission received: 26 February 2024 / Revised: 15 March 2024 / Accepted: 19 March 2024 / Published: 23 March 2024
(This article belongs to the Section Plant-Crop Biology and Biochemistry)

Abstract

:
The metabarcoding of prokaryotic and fungal (Ascomycota only) ribosomal DNA was used to describe the microbial communities in soils of a remnant equatorial rainforest, maize–bean intercrop, and sugarcane in western Kenya. Cropping systems influenced the microbial community composition and functional traits (energy source and nutrient cycling) of bulk soil in each crop. Microbial richness and diversity tended to increase with cultivation intensity. The soil of the maize–bean intercrop had lower percentages and sugarcane had higher percentages of unique amplicon sequence variants of both bacteria and fungi compared to the remnant forest. Functional traits were altered by cultivation intensity. Compared to remnant forest soils, maize–bean intercrop soil had lower percentages of aerobic chemoheterotrophic bacteria and higher percentages of N-cycling bacteria, while sugarcane had higher percentages of aerobic chemoheterotrophic bacteria and lower percentages of N-cycling bacteria. In the face of increasing forest loss and pressures for agricultural productivity, this landscape provides a rich site for studying the impacts of cropping systems on soil health.

1. Introduction

In the equatorial rainforest region, the permanent and continuous cultivation of extractive crops has the potential to fundamentally alter soil properties (e.g., reduction in soil organic matter content, changes in soil structure, losses in nutrient retention and erosion resistance) and soil microbial communities [1], which in turn may lower crop yield [2,3]. Shortened fallow periods and year-round cultivation practices are implemented in smallholder farms [4] for the production of food crops (e.g., sole maize or maize–bean intercropping) [5] or cash crops (e.g., sugarcane) [6]. Soil microbial community health is linked to crop productivity and sustainability [7], so it is invaluable to understand how continuous cropping practices in low-input systems change the structure of these microbial communities.
Within the equatorial rainforest region of the Isiukhu River watershed of Kakamega County in western Kenya centered at 0.27° N 34.80° E, we compared soil properties and soil microbial communities in two cropping systems commonly used by farmers in this region—maize–bean intercrops and pure sugarcane fields—and in pristine remnant forest soils.

2. Materials and Methods

The Isiukhu River watershed is a humid forest agroecological zone with poorly drained clay ferralsols in the south and well-drained sandy clay acrisols in the north [8,9]. The average annual rainfall in 2016 was 1512 mm with average daytime temperatures around 26 °C [10]. On 8 and 22 November and 6 December 2016, we sampled (1) undisturbed soils (F) in the Kakamega Forest Reserve near Maghaka (Ma) and (2) soils in croplands in Bukhaywa (Bu), Ikolomani (Ik), and Township (Tw), where maize–bean intercrop (MB) or sugarcane crops (Sc) had been planted continuously for at least five years. Cropping at the sample locations was in small-scale farms where MB is typically cultivated in two annual cycles during both long rain (April to June) and short rain (October to December) periods—MB and Sc crops were in season during sampling.
Five replicates of approximately 400 g from the top 20 cm of soil were collected and then pooled from each location (Ma, Bu, Ik, Tw) for each cropping system (F, n = 3; MB, n = 9; Sc, n = 9) and analyzed for the following variables: soil texture (% Sand, % Silt, % Clay) [11], bulk density (BD; g cm−3) [12], pH [13], % organic carbon (% OC) [14], and % nitrogen (% N) [12]. Total N (TN) and soil organic carbon (SOC) in mg ha−1 were estimated from % dry weight [15].
One 50 g soil sample was pooled for each cropping system within each location and analyzed for microbial community profiles. Each sample underwent DNA extraction using 0.25 g of soil followed by PCR amplification using the following: (1) 16S rDNA V4 region prokaryote primers, U518F/806R [16,17]; and (2) 28S rDNA Ascomycota (fungi) primers, LSU200A-F/LSU476A-R [18]. Libraries were sequenced using an Illumina MiSeq at the London Regional Genomics Centre (Robarts Research Institute, London, Canada). Amplicon sequence variants (ASVs; clusters of 100% identical sequence reads) were created and classified using DADA2 v1.10.1 [19] and the SILVA 132 [20] reference dataset.
The Kruskal–Wallis one-way analysis of variance on ranks and Dunn’s pairwise (p < 0.05) comparisons were used to compare soil properties among locations (Ma, Bu, Ik, Tw) and among cropping systems (F, MB, Sc) using rstatix [21] in R v.4.1.1. Microbial data were analyzed and visualized using microeco v0.5.2 [22], with functions assigned to taxa identified using FAPROTAX [23] and FUNGuild [24].
All available data including R code for the DADA2 ASV workflow, R code for figures and statistical analyses, raw ASV tables, and raw soil chemistry tables can be found in FigShare at https://doi.org/10.6084/m9.figshare.25152740.v1.

3. Results

3.1. Soil Properties

The remnant forest system occurred in a relatively restricted range of soil properties—sandier, more acidic, and lower organic carbon, both OC (%) and SOC (Mg ha−1)—compared to the two cropping systems. In contrast, the two cropping systems occurred in a broad range of soil conditions—sandy to clay/silt-rich, low to high acidity, low to high organic carbon and nitrogen (both N (%) and TN (Mg ha−1)) (Table 1 and Table S1).

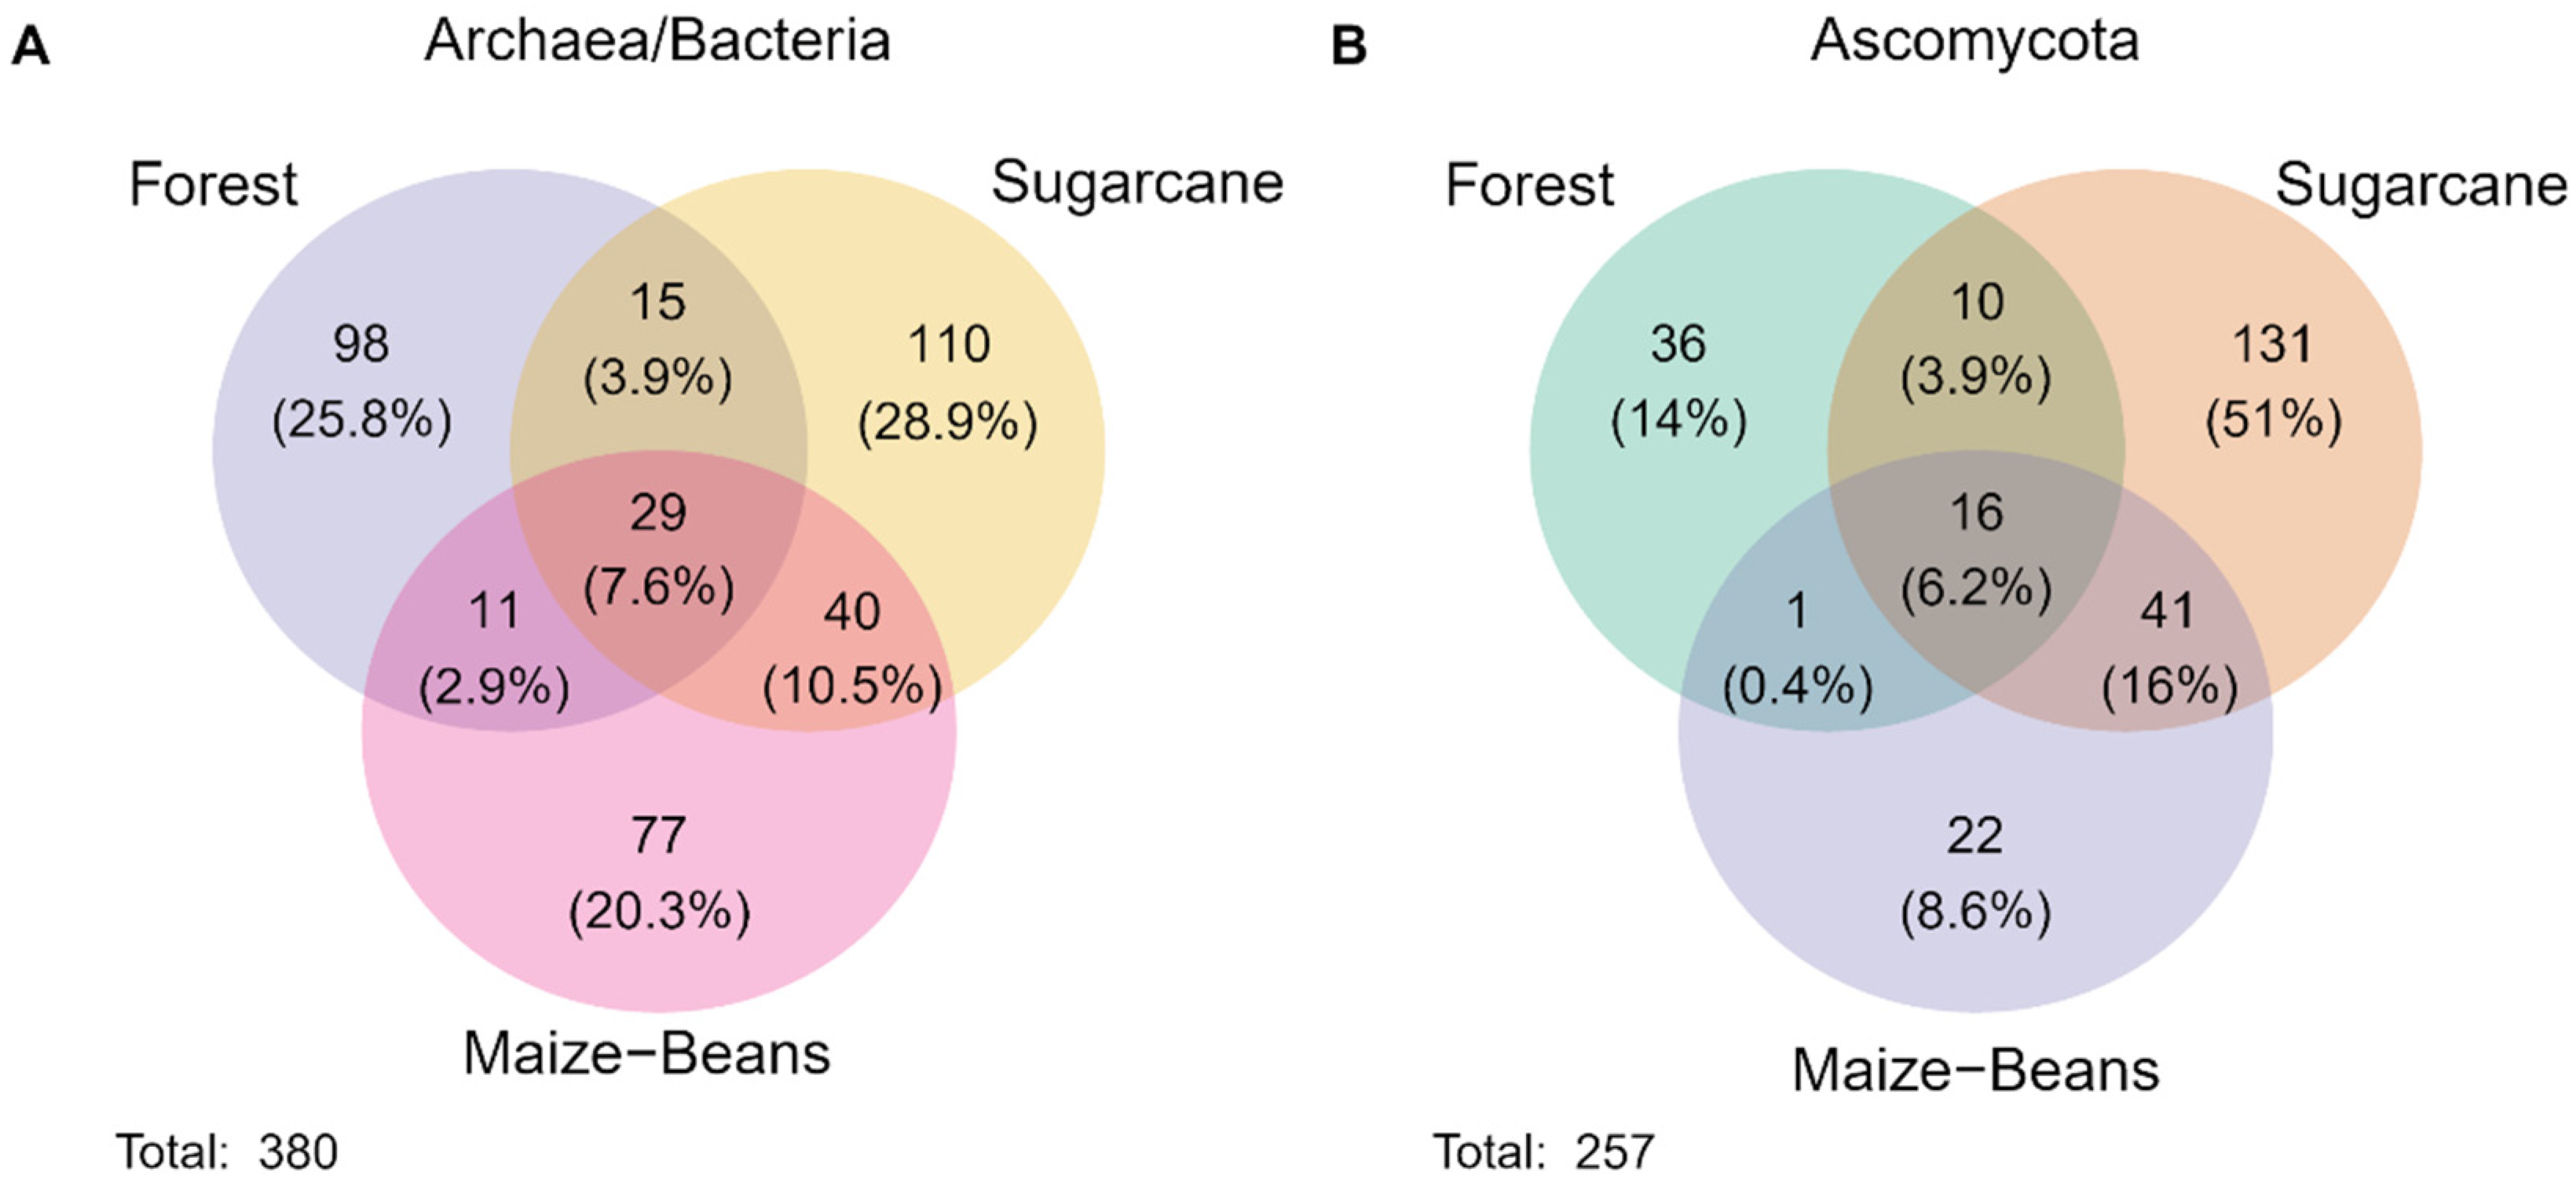
3.2. Microbial Diversity

The relative abundance of prokaryotes (bacterial and archaeal classes) and Ascomycota differed among the intact forest and the two cropping systems. Among prokaryotes, the largest differences were among classes Bacilli and Gammaproteobacteria (highest in F), including Blastocatellia, Alphaproteobacteria (all Eubacteria), and Nitrososphaeria (Archaea) (highest in MB), and the Eubacteria Actinobacteria, Chitinophagia, and Verrucomicrobia (highest in Sc) (Figure S1A). Among orders of Ascomycota, Hypocreales had the highest relative abundance in all three systems (greatest in F, moderate in MB, and lowest in Sc), followed by Pleosporales, Capnodiales, Onygenales, Sordariales, and Helotiales (Figure S1B). Soils of Sc had by far the highest microbial richness and diversity, followed MB and F (Table 2), and had the largest number of unique prokaryote and Ascomycotan ASVs, followed by F and MB (Figure 1). Of the top 40 Ascomycota and prokaryote ASVs, 29 Ascomycota and 20 bacteria were confidently identified to the genus level (Figure S2).

3.3. Microbial Functional Traits

Of the 151 Ascomycota ASVs queried through FUNGuild, 59 taxa (39.1%) were assigned a functional trait, with most unassigned ASVs missing family, genus, and species classification. It is likely that the naming conventions from the SILVA database (e.g., Cladosporium complex) were not directly matched within FUNGuild, and some others may be missing from the dataset (e.g., Furcaspora). Within the prokaryote dataset, there were 379 ASVs queried through FAPROTAX, and 59 were assigned to a functional group, with most classified to at least family. Unassigned taxa were those that were missing lower rank names, missing from the database, or remained unmatched due to SILVA naming (e.g., Candidatus Korobacter, genus RB41, and others). There was a larger proportion of named prokaryotes (down to family or genus) that were not found in the FAPROTAX database (100 ASVs, 26.4%) than Ascomycota not found in FUNGuild (9 ASVs, 6.0%).
Forest soils and the two cropping systems, particularly Sc, all had prokaryotes with energy source functional traits dominated by aerobic chemoheterotrophy. More prokaryotes capable of fermentation (C-cycling) were found in F soil, followed by Sc and then MB with the least. Forest soils had among the highest diversity of microbes, representing the largest diversity of N-cycling functional traits (nitrification, nitrate reduction, ammonia oxidation, and nitrate oxidation). In comparison to F, MB soils had similar percentages of N-cycling microbes, but these were concentrated in a smaller number of N-cycling functional traits (nitrogen fixation, nitrification, and ammonia oxidation), and Sc soils had fewer still, concentrated in the smallest number of N-cycling functional traits (nitrification and ammonia oxidation) (Figure 2A). All soils had primarily saprotrophic Ascomycota, with a smaller proportion of symbiotrophs and pathotrophs, but few or no ectomycorrhizal or ericoid mycorrhizal fungi were detected. Again, F soils had the greatest diversity of fungal functional groups, followed by Sc and MB (Figure 2B), a pattern that was not seen in taxonomic diversity, and MB and Sc fungal guilds and trophic modes were proportionally similar in comparison to F.

4. Discussion and Conclusions

This communication presents a snapshot of relatively rare data on the soil properties and microbial communities in arable lands with more than five years of continuous maize–bean or sugarcane cultivation in the Isiukhu River watershed of western Kenya. There were a limited number of replicates of soil community samples, but we found that cropping systems may influence the composition and functions of microbial communities relative to that of the remnant original forest. Intercropped maize–bean cultivation had higher SOC and % OC than sugarcane and undisturbed forest soils, with a larger proportion of N-cycling bacteria. However, sugarcane had higher bacterial diversity and richness than maize–bean and forest soils. As this was a descriptive study based on a limited number of samples, future work will benefit from increased replication and the inclusion of other cropping systems that are common in the region. Extractive cropping practices have been shown to have the potential to reduce original SOC by 60 to 80% [3] and fundamentally alter soil chemistry and microbial communities and their energy and nutrient cycling processes in complex ways.

Supplementary Materials

The following supporting information can be downloaded at: https://www.mdpi.com/article/10.3390/agronomy14040646/s1, Table S1. Soil chemistry averages ± standard deviations by cropping system and sampling locations. Figure S1: Relative abundance of amplified sequence variants grouped by (A) prokaryote class (16S RNA) and (B) Ascomycota order (28S RNA) for each cropping system; Figure S2: Log relative abundance heatmap of the top 40 ASVs within (A) prokaryote and (B) Ascomycota samples.

Author Contributions

Conceptualization, F.N.M., I.F.C., R.G.T. and A.W.S.; methodology, C.M. and N.M.W.; validation, N.M.W. and R.G.T.; formal analysis, N.M.W.; investigation, C.M.; resources, F.N.M., I.F.C. and A.W.S.; data curation, N.M.W.; writing—original draft preparation, C.M.; writing—review and editing, N.M.W., F.N.M., I.F.C., R.G.T. and A.W.S.; visualization, N.M.W.; supervision, F.N.M., I.F.C., R.G.T. and A.W.S.; project administration, F.N.M., I.F.C., R.G.T. and A.W.S.; funding acquisition, F.N.M., I.F.C. and A.W.S. All authors have read and agreed to the published version of the manuscript.

Funding

The research in this study was supported by Natural Sciences and Engineering Research Council (NSERC) of Canada Discovery Grants 05265-2019 to IFC and 04635-2022 to RGT. Support from a Queen Elizabeth II scholarship to Christine Matindu enabled molecular work at Western University, Canada.

Data Availability Statement

Raw Illumina MiSeq data were uploaded to ENA under project accession PRJEB44367 and are openly available at https://www.ebi.ac.uk/ena/browser/view/PRJEB44367. Other metadata, R code, and intermediate files are openly available in FigShare at https://doi.org/10.6084/m9.figshare.25152740.v1.

Acknowledgments

We thank members of the Department of Soil Science, University of Nairobi, especially Ferdinant Anyika, who helped with soil analyses.

Conflicts of Interest

The authors declare no conflicts of interest.

References

  1. Khatoon, H.; Solanki, P.; Narayan, M.; Tewari, L.; Rai, J.; Hina Khatoon, C. Role of microbes in organic carbon decomposition and maintenance of soil ecosystem. Int. J. Chem. Stud. 2017, 5, 1648–1656. [Google Scholar]
  2. Amolo, R.A.; Sigunga, D.O.; Owuor, P.O. Evaluation of soil properties of sugarcane zones and cropping systems for improved productivity in Western Kenya. Int. J. Agron. Agric. Res. 2017, 11, 1–16. [Google Scholar]
  3. Lal, R. Enhancing crop yields in the developing countries through restoration of the soil organic carbon pool in agricultural lands. Land. Degrad. Dev. 2006, 17, 197–209. [Google Scholar] [CrossRef]
  4. Tian, G.; Kang, B.T.; Kolawole, G.O.; Idinoba, P.; Salako, F.K. Long-term effects of fallow systems and lengths on crop production and soil fertility maintenance in West Africa. Nutr. Cycl. Agroecosyst. 2005, 71, 139–150. [Google Scholar] [CrossRef]
  5. Nassary, E.K.; Baijukya, F.; Ndakidemi, P.A. Intensification of common bean and maize production through rotations to improve food security for smallholder farmers. J. Agric. Food Res. 2020, 2, 100040. [Google Scholar] [CrossRef] [PubMed]
  6. Krause, H.; Fasse, A.; Grote, U. Nutrient-dense crops for rural and peri-urban smallholders in Kenya—A regional social accounting approach. Sustainability 2019, 11, 3017. [Google Scholar] [CrossRef]
  7. Jacoby, R.; Peukert, M.; Succurro, A.; Koprivova, A.; Kopriva, S. The role of soil microorganisms in plant mineral nutrition—Current knowledge and future directions. Front. Plant Sci. 2017, 8, 1617. [Google Scholar] [CrossRef] [PubMed]
  8. Sombroek, W.G.; Braun, H.M.H.; van der Pouw, B.J.A. Exploratory Soil Map and Agroclimatic Zone Map of Kenya, 1980. Scale 1:1,000,000; Kenya Soil Survey: Nairobi, Kenya, 1982; pp. 1–56. ISBN 9032701622. [Google Scholar]
  9. IUSS Working Group WRB. World Reference Base for Soil Resources. International Soil Classification System for Naming Soils and Creating Legends for Soil Maps, 4th ed.; International Union of Soil Sciences (IUSS): Vienna, Austria, 2022; Available online: https://obrl-soil.github.io/wrbsoil2022/index.html (accessed on 9 March 2024).
  10. Kenya Meteorological Department. KMD Map Room. Climate. Available online: http://kmddl.meteo.go.ke:8081/maproom/Climatology/index.html (accessed on 8 March 2024).
  11. Bouyoucos, G.J. Hydrometer method improved for making particle size analysis of soil. Agron. J. 1962, 54, 464–465. [Google Scholar] [CrossRef]
  12. Anderson, J.M.; Ingram, J.S.I. Tropical Soil Biology and Fertility: A Handbook of Methods, 2nd ed.; Cambridge University Press: Wallingford, UK, 1993; pp. 70–74. ISBN 0-85198-821-0. [Google Scholar] [CrossRef]
  13. McLean, E.O. Soil pH and lime requirement. In Methods of Soil Analysis, Part 2: Chemical and Microbiological Properties, 2nd ed.; Page, A.L., Ed.; American Society of Agronomy: Madison, WI, USA, 1982; pp. 192–224. [Google Scholar] [CrossRef]
  14. Walkley, A.; Black, I.A. An examination of the Degtjareff method for determining soil organic, and a proposed modification of the chromic acid titration method. Soil Sci. 1934, 37, 29–38. [Google Scholar] [CrossRef]
  15. Omoro, L.; Starr, M.; Pellikka, P.K.E. Tree biomass and soil carbon stocks in indigenous forests in comparison to plantations of exotic species in the Taita Hills of Kenya. Silva Fenn. 2013, 47, 935. [Google Scholar] [CrossRef]
  16. Muyzer, G.; De Waal, E.C.; Uitterlinden, A.G. Profiling of complex microbial populations by denaturing gradient gel electrophoresis analysis of polymerase chain reaction-amplified genes coding for 16S rRNA. Appl. Environ. Microbiol. 1993, 59, 695–700. [Google Scholar] [CrossRef] [PubMed]
  17. Caporaso, J.G.; Lauber, C.L.; Walters, W.A.; Berg-Lyons, D.; Lozupone, C.A.; Turnbaugh, P.J.; Fierer, N.; Knight, R. Global patterns of 16S rRNA diversity at a depth of millions of sequences per sample. Proc. Natl. Acad. Sci. USA 2011, 108 (Suppl. S1), 4516–4522. [Google Scholar] [CrossRef] [PubMed]
  18. Asemaninejad, A.; Weerasuriya, N.; Gloor, G.B.; Lindo, Z.; Thorn, G. New primers for discovering fungal diversity using nuclear large ribosomal DNA. PLoS ONE 2016, 11, e0159043. [Google Scholar] [CrossRef] [PubMed]
  19. Callahan, B.J.; McMurdie, P.J.; Rosen, M.J.; Han, A.W.; Johnson, A.J.A.; Holmes, S.P. DADA2: High-resolution sample inference from Illumina amplicon data. Nat. Methods 2016, 13, 581–583. [Google Scholar] [CrossRef] [PubMed]
  20. Benjamin, C. Silva Taxonomic Training Data Formatted for DADA2 (Silva Version 132). Available online: https://zenodo.org/records/1172783 (accessed on 8 November 2021).
  21. Kassambara, A. Rstatix: Pipe-Friendly Framework for Basic Statistical Tests. R Package Version 0.7.0. 2021. Available online: https://cran.r-project.org/package=rstatix (accessed on 8 November 2021).
  22. Liu, C.; Cui, Y.; Li, X.; Yao, M. microeco: An R package for data mining in microbial community ecology. FEMS Microbiol. Ecol. 2021, 97, fiaa255. [Google Scholar] [CrossRef] [PubMed]
  23. Louca, S.; Parfrey, L.W.; Doebeli, M. Decoupling function and taxonomy in the global ocean microbiome. Science 2016, 353, 1272–1277. [Google Scholar] [CrossRef] [PubMed]
  24. Nguyen, N.H.; Song, Z.; Bates, S.T.; Branco, S.; Tedersoo, L.; Menke, J.; Schilling, J.S.; Kennedy, P.G. FUNGuild: An open annotation tool for parsing fungal community datasets by ecological guild. Fungal Ecol. 2016, 20, 241–248. [Google Scholar] [CrossRef]
Figure 1. Venn diagram of shared and unique amplified sequence variants (clustered at 100% identity) between (A) prokaryote and (B) Ascomycota primers for different cropping regimes.
Agronomy 14 00646 g001
Figure 2. Select functional traits of (A) prokaryotes (FAPROTAX), and (B) Ascomycotan fungi (FUNGuild) as a percent of unique amplified sequence variants in each cropping system: F—forest (prokaryotes n = 25; fungi n = 19), MB—maize–bean (prokaryotes n = 20; fungi n = 26), Sc—sugarcane (prokaryotes n = 34; fungi n = 43).
Agronomy 14 00646 g002
Table 1. A one-way ANOVA on ranks (Kruskal–Wallis) by cropping system and location (n = 5). Dunn’s pairwise (p < 0.05) comparisons were adjusted for multiple comparisons using the Holm adjustment, where * = p < 0.05, ** = p < 0.01, *** = p < 0.001, **** = p < 0.0001, ns = not significant (p ≥ 0.05). Sampling locations include Ma—Magakha, Bu—Bukhaywa, Ik—Ikolomani, and Tw—Township. Cropping systems include F—forest, MB—maize–bean, and Sc—sugarcane.
Soil ChemistrypH% NTN% OCSOCBD% Sand% Silt% Clay
Cropping System
Kruskal–Wallis p-value0.0160.2930.3240.0340.0330.2820.030.0880.081
Dunn’s Pairwise
Comparisons
F–MB*nsnsnsnsns*nsns
F–Sc*nsnsnsnsns*nsns
MB–Scnsnsns*nsnsnsnsns
Location
Kruskal–Wallis p-value0.0020.1250.2330.0240.0380.059<0.001<0.001<0.001
Dunn’s Pairwise
Comparisons
Ma–Bu**nsnsnsnsnsnsnsns
Ma–Iknsnsnsnsnsns*******
Ma–Tw*nsnsnsnsnsnsnsns
Bu–Iknsnsns*nsns***********
Bu–Twnsnsnsnsnsnsnsnsns
Ik–Twnsnsnsnsnsns****
Table 2. Observed microbial richness (Richness) and diversity (Fisher’s alpha, Shannon, Inverse Simpson) indices under forest (F), maize–bean (MB), and sugarcane (Sc) soils.
Richness
(S)
Fisher’s α
(S)
Shannon
(H′)
InvSimpson
−1)
Archaea/
Bacteria
F15317.14.773.0
MB15717.74.764.7
Sc19433.04.875.3
Fungi (Ascomycota)F636.92.98.1
MB809.83.39.5
Sc13215.54.128.2
Disclaimer/Publisher’s Note: The statements, opinions and data contained in all publications are solely those of the individual author(s) and contributor(s) and not of MDPI and/or the editor(s). MDPI and/or the editor(s) disclaim responsibility for any injury to people or property resulting from any ideas, methods, instructions or products referred to in the content.

