Article

Transcriptomics and Metabolomics Analysis Revealed the Ability of Microbacterium ginsengiterrae S4 to Enhance the Saline-Alkali Tolerance of Rice (Oryza sativa L.) Seedlings

Ningxia Key Laboratory for the Development and Application of Microbial Resources in Extreme Environments, College of Biological Science and Engineering, North Minzu University, Yinchuan 750021, China
*
Author to whom correspondence should be addressed.
These authors contributed equally to this work.
Agronomy 2024, 14(4), 649; https://doi.org/10.3390/agronomy14040649
Submission received: 19 February 2024 / Revised: 20 March 2024 / Accepted: 21 March 2024 / Published: 23 March 2024

Abstract

:
Soil salinization is a major factor that reduces crop yields. There are some plant growth-promoting rhizobacteria (PGPR) that can stimulate and enhance the salt tolerance of plants near their roots in saline–alkali environments. Currently, there is relatively little research on PGPR in rice saline–alkali tolerance. In the early stages of this study, a strain of Microbacterium ginsengiterrae S4 was screened that could enhance the growth of rice in a laboratory-simulated saline–alkali environment (100 mM NaCl, pH 8.5). The experiment investigated the effects of S4 bacteria on the growth, antioxidant capacity, and osmotic regulation of rice seedlings under saline–alkali stress. RNA-Seq technology was used for transcriptome sequencing and UPLC-MS/MS for metabolite detection. Research has shown that S4 bacteria affect the growth of rice seedlings under saline–alkali stress through the following aspects. First, S4 bacteria increase the antioxidant enzyme activity (SOD, POD, and CAT) of rice seedlings under saline–alkali stress, reduce the content of MDA, and balance the content of osmotic regulatory substances (soluble sugar, soluble protein, and proline). Second, under saline–alkali stress, treatment with S4 bacteria caused changes in differentially expressed genes (DEGs) (7 upregulated, 15 downregulated) and differentially metabolized metabolites (101 upregulated; 26 downregulated) in rice seedlings. The DEGs are mainly involved in UDP-glucose transmembrane transporter activity, while the differentially metabolized metabolites are mainly involved in the ABC transporters pathway. Finally, key genes and metabolites were identified through correlation analysis of transcriptomes and metabolomes, among which OsSTAR2 negatively regulates L-histidine, leading to an increase in L-histidine content. Furthermore, through gene correlation and metabolite correlation analysis, it was found that OsWRKY76 regulates the expression of OsSTAR2 and that L-histidine also causes an increase in 2-methyl-4-pentenoic acid content. Based on the above analysis, the addition of S4 bacteria can significantly improve the tolerance of rice in saline–alkali environments, which has a great application value for planting rice in these environments.

1. Introduction

Soil salinization, as one of the major obstacles to achieving sustainable development worldwide, is a key factor that prevents many arid and semi-arid regions in the world from effectively utilizing land resources [1,2]. After the phenomenon of soil salinization, the physical and chemical properties of the soil deteriorate, fertility decreases, and the nitrogen, phosphorus, and other elements necessary for plant growth are lacking, resulting in the inability of most plants to grow normally [3]. The main inhibitory factors for plant growth in saline soil are Na+ and Cl. A large amount of Na+ and Cl are transferred from the soil to the plant body and stored in the cytoplasm, which can damage the chloroplast structure and cell membrane structure, weaken photosynthesis, affect normal metabolic activities of plants, and have adverse effects on plant seed germination, seedling growth, and organic matter accumulation. It can also inhibit the absorption of beneficial ions such as K+ and Ca2+ by plants [4,5]. Under saline–alkali stress, plant cells produce reactive oxygen species (ROS) in the form of free radicals. Excessive ROS production can lead to oxidative damage to cellular proteins, lipids, nucleic acids, and plasma membranes [6].
Generally, the improvement of saline–alkali soil includes physical improvement, chemical improvement, and biological improvement. Although physical and chemical methods are effective in improving saline–alkali land, their utilization rate is low due to high costs [7]. The method of improving saline–alkali soil by microorganisms has shown great potential in the process of improving low-fertility saline–alkali soil due to its advantages of high efficiency, energy conservation, and stable effects. Microorganisms that have a positive effect on plant growth are named plant growth-promoting rhizobacteria (PGPR) [8]. Based on the localization of rhizosphere microorganisms, they can be divided into intracellular PGPR (iPGPR) and extracellular PGPR (ePGPR) [9].
Research has shown that the mechanisms by which PGPR promotes plant growth mainly include nitrogen transformation, phosphorus solubilization, potassium release, production of iron carriers, and secretion of plant hormones [10] PGPR can transform organic nitrogen that is difficult for plants to directly utilize into absorbable nitrate and ammonium nitrogen through mineralization and nitrification. The common nitrifying bacteria include Nitrosomonas, Nitrosococcus, and Nitrococcus [10]. Furthermore, some PGPR can convert nitrogen in the environment into ammonium nitrogen, mainly through three ways: symbiotic nitrogen fixation, associative nitrogen fixation, and autotrophic nitrogen fixation. The types of nitrogen-fixing bacteria include Rhizobiumsp, Pseudomonas, Azospirillum, Bacillus, and others [11]. In addition, the phosphorus−solubilizing microorganisms in PGPR can convert insoluble phosphorus into soluble phosphorus through acidification, chelation, and exchange reactions, releasing it into the soil for plant absorption and utilization [12]. The microbial species in PGPR that possess phosphorus solubilizing functions are extremely diverse. Common phosphorus-dissolving microorganisms in soil include Bacillus, Pseudomonas, Enterobacter, Burkholderia, and so on [12]. Furthermore, some PGPR also possess the ability to solubilize potassium, converting insoluble potassium salts into soluble potassium, thereby facilitating better potassium absorption and utilization by plants [13]. Bacillus aryabhattai SK1–7 can effectively dissolve insoluble potassium ions in soil and increase the soluble potassium content in the rhizosphere environment of Populus alba [14]. Recent studies have shown that PGPR can enhance plant stress resistance by promoting the production of iron and auxin IAA [15]. In a low-iron stress environment, PGPR can sequester insoluble Fe3+ in the soil by producing siderophores, reducing it to Fe2+ that can be absorbed by plants, thereby improving the iron deficiency of plants [15]. PGPR can also promote plant growth by directly secreting plant hormones or affecting the synthesis process of plant hormones [16]. Research has shown that most soil PGPR, such as Acetobacter, Acinetobacter, and Alcaligenes, have the ability to produce IAA [17].
Rice (Oryza sativa L.) is a vital staple food for half of the global population and, also, serves as an essential industrial resource. With the increasing use of natural factors and chemical fertilizers, the phenomenon of soil salinization is becoming more and more serious around the world. Rice is not very resistant to salt and alkali, and the aggravation of soil salinization will inevitably become a major obstacle to rice growth [18].
Research has found that PGPR has a good effect on improving crop resistance to stress. Grapes inoculated with Burkholderia PsJN showed earlier and faster increases in gene transcription and metabolite levels under low-temperature stress [19]. PGPR can convert the highly oxidizing Cr6+ in the environment into the relatively less toxic Cr3+, thereby reducing the harm of chromium to plants [20]. PGPR also has a certain role in promoting crop growth under saline–alkali stress. Plants under salt stress can increase their chlorophyll and proline content by inoculating PGPR, which promotes plant growth and effectively alleviates the effects of stress on plants [21]. In addition, the application of PGPR in saline–alkali soil can effectively improve the soil salinity environment and enhance soil fertility, and the effect is more significant in heavy saline–alkali soil [22]. In recent years, the development of transcriptomics and metabolomics has become a key tool for revealing plant responses to stress and identifying differentially expressed genes and metabolites. Transcriptomics and metabolomics have been widely used to study the stress resistance of crops such as maize, wheat, rice, and soybeans [23,24].
In the early stage of this experiment, a strain of Microbacterium ginsengiterrae S4 with growth-promoting effects was screened from saline–alkali environments. In this study, to explore the functions and effects of differential genes and metabolites induced by S4 bacteria in rice, seedlings were subjected to saline–alkali stress and analyzed by transcriptomic and metabolomic techniques. This approach is meant to provide a relevant theoretical basis for the application of S4 bacteria in saline–alkali soil and the planting of rice in saline–alkali soil.

2. Materials and Methods

2.1. Plant Materials and Treatments

Details about the soils sampled are shown in Table 1. A total of 5 g of soil from the rhizosphere of each plant was added to 25 mL of sterile water, and the mixture was stirred thoroughly with a magnetic stirrer for 20 min. It was then left to stand for 30 min. The supernatant was used as the stock solution and diluted to a suitable concentration using a gradient dilution method. The diluted solution in the amount of 100 μL was applied to a TSN plate culture medium. The plate, once coated, was inverted and cultured at 28 °C for 7 days in a constant temperature incubator. Individual bacterial colonies were selected and purified by streaking on the TSN plate culture medium. They were then cultured for 2 days at 28 °C in an inverted position. The single bacterial colony was preserved in a 1.8 mL cryopreservation tube containing 1 mL of 20% glycerol and stored at −80 °C for future use. After initial screening, a strain of growth-promoting bacteria was discovered to have a growth-promoting effect on rice under saline–alkali stress. Molecular identification was conducted on this strain using 16S rRNA sequences, revealing that it belongs to the Microbacterium ginsengiterrae species. This strain exhibits phosphorus and potassium solubilizing abilities, as well as the ability to secrete iron-transporting proteins and IAA, and was named S4 (Tables S1 and S2; Figure S1).
The rice (Oryza sativa L.) variety Ningjing 51 was chosen as the plant material for the experiment. The rice seeds were soaked in a water bath at 55 °C for 15 min. The seeds were disinfected with 0.1% mercuric chloride for 30 s. After disinfection, the seeds were subjected to various treatments. Seeds of different treatments were placed in agar for dark treatment. After germination, they were transferred to a sterilized 480 mL plastic bottle containing 300 g of sterile vermiculite and 60 mL of Hoagland nutrient solution with different treatments. The plant was then placed in a lighting incubator (relative humidity 35%, 10,000 Lx, 25 °C, 4 h; 5000 Lx, 20 °C, 3 h; 0 Lx, 18 °C, 8 h; 5000 Lx, 20 °C, 2 h; 9000 Lx, 25 °C, 3 h; 13,000 Lx, 28 °C, 4 h). Each treatment was as follows: CK0 (control); T0 (M. ginsengiterrae); CK1 (saline–alkali stress (100 mM NaCl, pH 8.5)); T1 (saline–alkali stress, M. ginsengiterrae). The concentration of the S4 bacterial suspension was 1 × 10⁸ cfu/mL. Only one dose of S4 bacterial suspension was administered within 14 days. The whole plant that was treated for 14 days was used as material for subsequent experiments. Each treatment was set up with three biological replicates.

2.2. Determination of Physicochemical Indicators

The superoxide dismutase activity (SOD), peroxidase activity (POD), catalase activity (CAT), malondialdehyde content (MDA), proline content, soluble protein content, and soluble sugar content of rice seedlings were all measured using reagent kits from Suzhou Ke Ming Biotechnology Co., Ltd. (Suzhou, China). Each treatment was set up with three biological replicates.

2.3. RNA Extraction, cDNA Library Preparation, and Sequencing

The total RNA of plant tissues was extracted using Plant RNA Purification Reagent (Invitrogen, Carlsbad, CA, USA), with three biological replicates for each treatment. The concentration and purity of the extracted RNA were determined using Nanodrop2000 (Thermofisher Scientific, Waltham, MA, USA), and the integrity of the RNA was assessed by agarose gel electrophoresis. The RIN value was measured using an Agilent 5300 fragment analyzer (Agilent, Santa Clara, CA, USA). The results showed that the OD260/280 and OD260/230 of the total RNA were both greater than 2.0, the RIN values were both greater than 7.5, and the 28/23S brightness was greater than 18/16S. Moreover, the concentration and quality of RNA also met the requirements for transcriptome sequencing [25] (Table S3; Figure S2). One microgram of total RNA was used to prepare the library using the TruseqTM RNA sample prep kit (Invitrogen, USA). Messenger RNA was isolated using polyA selection with oligo(dT) beads, followed by fragmentation using fragmentation buffer. Double-stranded cDNA was synthesized using a SuperScript double-stranded cDNA synthesis kit (Invitrogen, USA) with random hexamer primers (Illumina, San Diego, CA, USA). The double-stranded cDNA structure has a sticky end. After adding the End Repair Mix to make it a blunt end, a single A base was added to the 3′ end to connect the Y-shaped adaptor. The products after connecting the adapter were purified and fragmented, and the selected products were subjected to PCR amplification, resulting in the final library after purification. After quantification using a Qubit 4.0 fluorometer (Thermofisher Scientific, Waltham, MA, USA), the paired-end RNA-seq sequencing library was sequenced using the Illumina NovaSeq 6000 sequencer (Illumina, USA)with 2 × 150 bp read length.

2.4. Metabolite Extraction and UPLC-MS/MS Analysis

A 50 mg frozen plant tissue sample was placed in a 2 mL centrifuge tube, and a 6 mm diameter grinding bead was added. Each treatment was set up with three biological replicates. The 400 μL extraction solution (methanol:water = 4:1 (v:v)) containing 0.02 mg/mL of an internal standard (L-2-chlorophenylalanine) was used for the extraction of metabolites. The sample solution was ground for 6 min using a frozen tissue grinder (−10 °C, 50 Hz), followed by low-temperature ultrasonic extraction for 30 min (5 °C, 40 kHz). The sample was left to stand at −20 °C for 30 min, centrifuged for 15 min (4 °C, 13,000× g), and the supernatant was transferred to a sample vial with an insert tube for UHPLC-Q Exactive (Thermofisher Scientific, Waltham, MA, USA) analysis. A 3 μL sample was separated using the HSS T3 column (100 Å, 1.8 µm, 2.1 mm × 100 mm, 1/pk, Waters, Milford, MA, USA) and then introduced into the mass spectrometer for detection. The mobile phase A (95% water + 5% acetonitrile (acetonitrile contained 0.1% formic acid)) and mobile phase B (47.5% acetonitrile + 47.5% isopropanol + 5% water (water contained 0.1% formic acid)) were set. The method of Zou et al. [26] was used for the positive ion mode separation gradient and the negative ion mode gradient. The mass spectrometry signal acquisition used a positive and negative ion scan mode, with a mass scan range of m/z: 70–1050. The ion spray voltage was set at 3500 V for positive ions and 2800 V for negative ions. The sheath gas was set at 40 psi, the auxiliary heating gas at 10 psi, the ion source heating temperature at 400 °C, and the cycle collision energy at 20–40–60 V. The MS1 resolution was 70,000, and the MS2 resolution was 17,500.

2.5. Bioinformatics Analysis of the Transcriptome and Metabolome
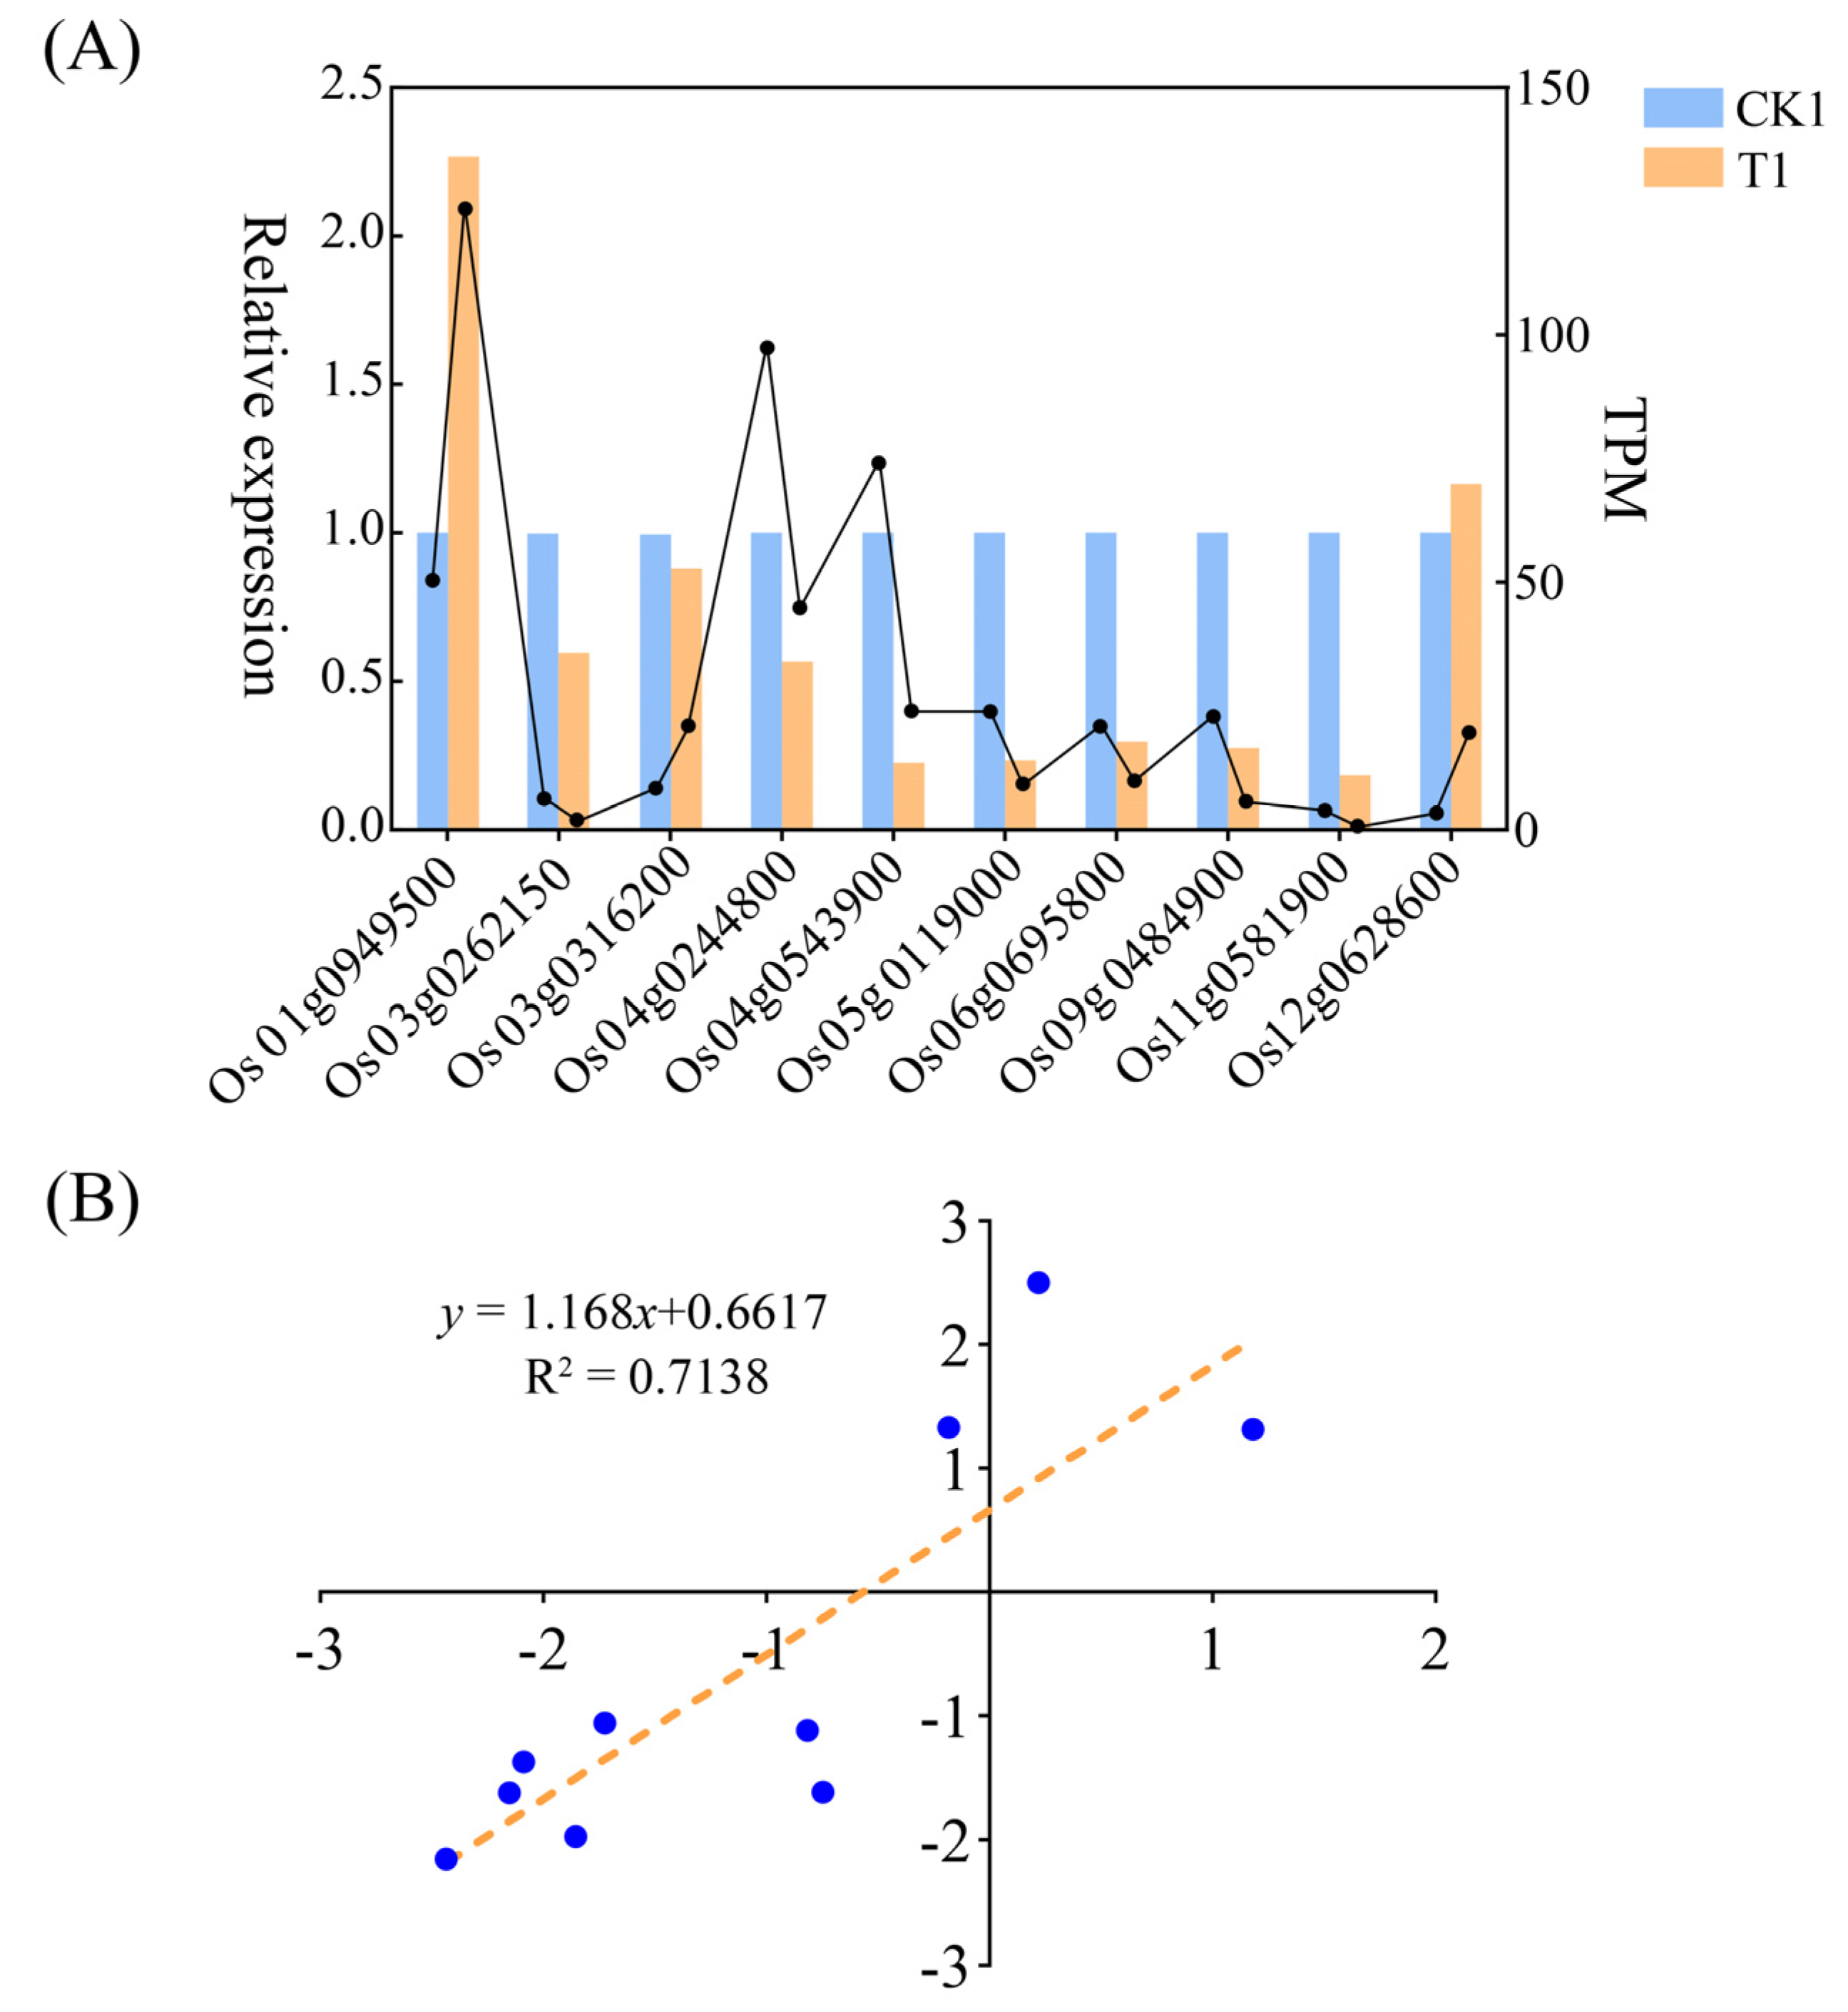
The transcriptomic analysis was based on the genome of Oryza sativa (IRGSP-1.0). The acquired paired-end reads were trimmed and quality controlled by SeqPrep and Sickle. The clean data were aligned to the reference genome using HISAT2 [27]. The mapped reads of each sample were assembled by StringTie [28] in a reference-based approach. The expression of differential genes between CK1 and T1 was obtained by using DESeq2 [29], with the expression level represented by the transcripts per million reads (TPM). Genes with |log2fold change| ≥ 1 and p-adjust < 0.05 were considered to be significantly different. The LC/MS raw data were processed using Progenesis QI software (v 2.4, Waters, Milford, MA, USA). The access date of the rice database was 12 December 2022. Metabolites were identified using HMDB databases. Variance analysis and OPLS-DA were performed using the “ropls” package [30]. Metabolites with VIP > 1 and p-value < 0.05 were considered significant. For functional enrichment analysis, significantly up- and downregulated genes and metabolites were selected for GO and KEGG metabolic pathways analysis using the Goatools and KOBAS [31]. The remaining figure outputs were generated by the GraphPad Prism (v 9.5) and the significant differences were evaluated by the IBM SPSS Statistics (v 25).

2.6. RT-qPCR Assays

RT-qPCR was performed to validate the transcriptome data of rice seedlings under different treatments. Nine differential genes were selected from the differentially expressed genes of rice seedlings. The internal reference gene, Os09g0515800, was used [32]. Primers were synthesized by the Shanghai Majorbio Bio-Pharm Technology Co., Ltd. (Shanghai, China). The expression level of relative genes was calculated using the 2−ΔΔCt method. The primer sequence of genes is shown in Table S4.

3. Results

3.1. The S4 Bacteria Promotes the Growth of Rice Seedlings under Saline–Alkali Stress Conditions

In order to determine the application effect of Microbacterium ginsengiterrae S4 and further expand its application scope, we analyzed the plant height and root length of rice seedlings after applying S4 bacteria. The results (Table 2) showed that under no saline–alkali stress, there were no significant changes in plant height and root length of rice seedlings after the application of S4 bacteria. Under saline–alkali stress, S4 bacteria significantly increased the plant height and root length of rice seedlings, which were 3.14 cm and 2.4 cm higher than CK1, respectively. This indicates that under saline–alkali stress, S4 bacteria can promote the growth of rice seedlings.

3.2. The Impact of S4 Bacteria on the Physicochemical Indicators of Rice Seedlings under Saline–Alkali Conditions

Antioxidant enzymes play a crucial role in the study of plant salt and alkaline tolerance and are often used as indicators for evaluating a plant’s resistance to these environmental challenges. The results indicate that under normal conditions, treatment with S4 bacteria did not lead to changes in various physiological indicators. However, under saline–alkali stress, significant changes in various indicators were observed after treatment with S4 bacteria. Under saline–alkali stress, the treatment with S4 bacteria significantly increased the activities of SOD, POD, and CAT by 36.22%, 14.23%, and 10.64% (Figure 1A; Figure 1B; Figure 1C), respectively, and significantly reduced the content of MDA by 41.89% (Figure 1D). Proline, soluble sugar, and soluble protein play a role in stabilizing plant cell osmotic pressure and can reflect the degree of saline–alkali stress to which the plant is subjected. The results indicate that under saline–alkali stress, the treatment with S4 significantly increased the proline content of rice seedlings (Figure 1E) and significantly decreased the soluble protein and soluble sugar content (Figure 1F,G).

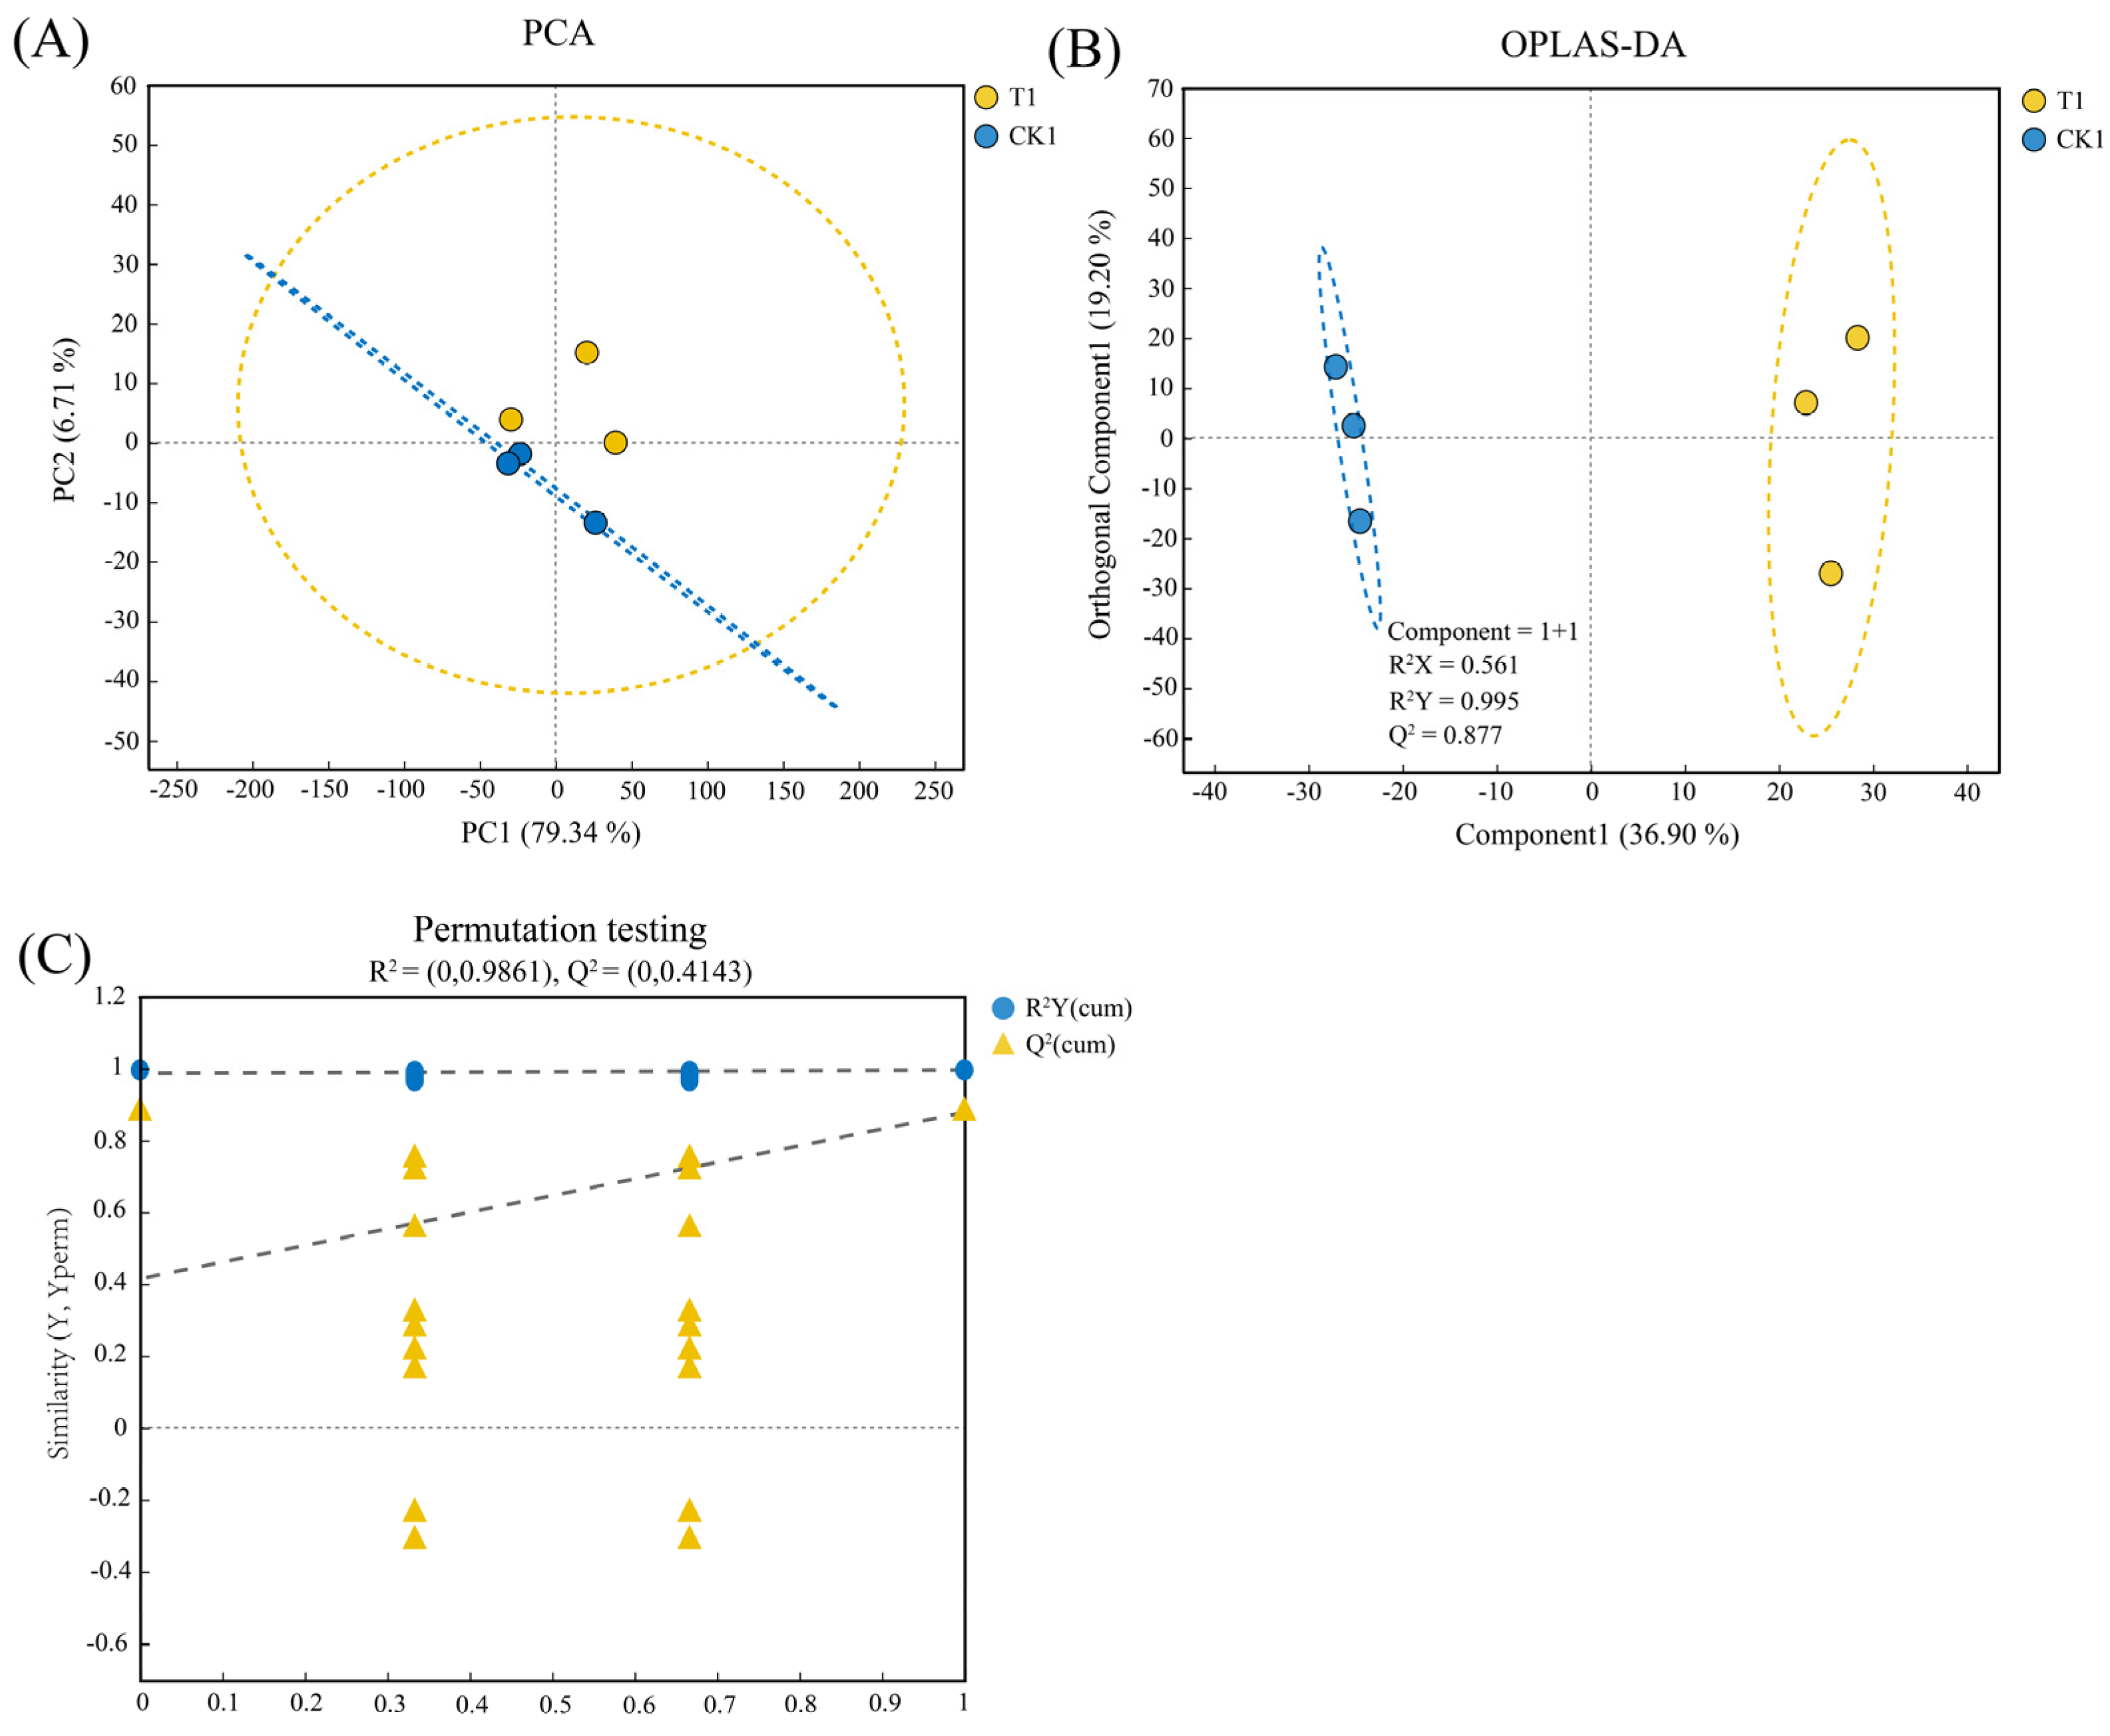
3.3. Comparative Analysis of Transcriptome and Metabolome Samples

We performed transcriptome sequencing on rice seedling tissue samples treated with saline–alkali stress and S4 bacteria under saline–alkali stress, with three biological replicates for each treatment. From the Illumina sequencing platform, a total of 300,181,848 raw paired-end reads were obtained. After quality control, 296,158,218 clean paired-end reads with a GC content ranging from 53.4% to 55.11% were utilized for transcriptomics analysis (Table S5). Approximately 95.9–96.79% of the reads were mapped to the rice genome, and 91.71–93.69% of the reads were uniquely mapped to the reference sequence (Table S6). The MS/MS detection of CK1 and T1, both in positive and negative ion modes, extracted 7330 and 6109 positive and negative ion mass peaks, respectively. The detection was carried out using a mass spectrometry instrument, analyzing both positive and negative ion modes of the substance. The numbers of positive and negative ion mass peaks extracted by the software were 7330 and 6109, respectively. The numbers of metabolites annotated in public databases, such as HMDB and Lipidmaps, for positive and negative ions are 386 and 256, respectively. The number of metabolites annotated to the KEGG database is 182 for positive ions and 89 for negative ions. PCA analysis showed that there was no significant difference between T1 and CK1 in PC1 (79.34%), but they could be clearly divided into two groups on PC2 (6.71%). The three samples of CK1 were concentrated in the first and second quadrants, while the three samples of T1 were concentrated in the third and fourth quadrants (Figure 2A). This indicates that the transcriptome sample sequencing results between the two treatments are relatively reliable. OPLAS-DA can more accurately analyze the differences between the two groups. OPLAS-DA model showed that CK1 and T1 (R2X = 0.489, R2Y = 0.992, Q2 = 0.563, Figure 2B) were obviously separated, and there was no linear fitting between the two groups, indicating that the sample results were reliable (Figure 2C).

3.4. Functional Prediction and Classification of DEGs and Differential Metabolites

Figure 3A shows the 7 upregulated and 15 downregulated genes that were identified in T1 vs. CK1, which is consistent with the trend of the differential gene expression heatmap (Figure 3B). Specific details of DEGs are shown in Table S7. We further used the GO database to conduct preliminary functional annotation of DEGs. Figure 3E shows that the most annotated DEGs in T1 vs. CK1 belong to the molecular function of “Binding”, with 11 DEGs annotated, followed by the biological process of “Response to stimulus”, with 8 DEGs annotated. The most annotated DEGs in the cellular process are “Cell part” and “Membrane”, each with 7 DEGs annotated. VIP > 1 and p < 0.05 were defined as differential metabolites. Generally, FC > 1 or FC < 1 is the up- or downregulated metabolite. In T1 vs. CK1, 127 differential metabolites were screened, 101 metabolites were upregulated, and 26 metabolites were downregulated (Figure 3C). This is also consistent with the trend in the differential metabolites heatmap (Figure 3D). Detailed information on differential metabolites is shown in Table S8. The HMDB database can provide a preliminary classification of differential metabolites. As shown in Figure 3F, the 127 differential metabolites in T1 vs. CK1 are roughly annotated into 8 categories in the HMDB database, including 41 metabolites belonging to lipids and lipid-like molecules, followed by organoheterocyclic compounds (15 differential metabolites) and organic acids and derivatives (12 differential metabolites) (Table S9). Ten DEGs from the transcriptome sequencing results were selected for qPCR verification. The results showed that the relative expression levels of the DEGs were consistent with the trends obtained from RNA-Seq (Figure 4A), and there was a linear correlation between the two (Figure 4B). This indicates that the transcriptome results are relatively reliable.

3.5. Functional Enrichment Analysis of DEGs and Differential Metabolites

To further investigate the functions of DEGs and differential metabolites possibly involved in salt and alkali resistance in rice seedlings, we performed enrichment analysis of DEGs and differential metabolites using the GO database and KEGG database, respectively. The GO enrichment analysis of DEGs showed that when the significance threshold was set at p-value < 0.05, a total of 14 DEGs were significantly enriched in 88 GO pathways in T1 vs. CK1 (Table S10). According to the ranking of p-values from small to large, the top 10 GO pathways in terms of enrichment degree belong to the biological process and molecular function (Figure 5A), among which “UDP-glucose transmembrane transport (GO:0015786)”, “Anion transmembrane transport (GO:0098656)”, “Response to metal ion (GO:0010038)”, “Response to aluminum ion (GO:0010044)”, “Pyrimidine nucleotide-sugar transmembrane transport (GO:0090481)”, “Nucleotide-sugar transmembrane transport (GO:0015780)”, and “Response to chemical (GO:0042221)” belong to biological processes. “UDP-glucose transmembrane transporter activity (GO:0005460), “Pyrimidine nucleotide-sugar transmembrane transporter activity (GO:0015165)”, and “Nucleotide-sugar transmembrane transporter activity (GO:0005338)” belong to molecular functions. As shown in Figure 5A, “UDP-glucose transmembrane transporter activity” has the highest enrichment level, including two DEGs (OsSTAR1, OsSTAR2). Among the differential metabolites between T1 and CK1, 5 significantly enriched KEGG pathways were screened using a threshold of p-value < 0.05, including nine differential metabolites (Table S11). Figure 5B shows that “ABC transporters (map02010)” involved in membrane transport have the highest degree of significant enrichment and contain the largest number of differential metabolites, including four differential metabolites (sucrose, L-histidine, (−)-riboflavin, inosine).
Based on the criteria of |corr| > 0.8 and p-value< 0.05, 14 DEGs in the GO enrichment and 9 differential metabolites in the KEGG enrichment were screened and analyzed for correlation. In T1 vs. CK1, three DEGs and three differential metabolites were found to be correlated, including Os11g0581900, OsGDH2, and OsSTAR2, which were all downregulated genes, (−)-riboflavin and sucrose, which were downregulated metabolites, and L-histidine, which was an upregulated metabolite. The Os11g0581900 was mainly involved in the response to chemicals, and OsGDH2 was mainly involved in the response to metal ions and the response to chemicals. Meanwhile, OsSTAR2 was involved in the top 10 pathways enriched by GO (Figure 5A; Table S10). This indicates that OsSTAR2 plays a leading role in the process of regulating rice tolerance to saline–alkali soil. The regulation of (−)-riboflavin and sucrose by Os11g0581900 was positively correlated, and OsSTAR2 positively regulated sucrose. L-histidine was positively regulated by OsGDH2 and negatively regulated by OsSTAR2 (Figure 5C). The comprehensive analysis indicates that under saline–alkali stress, the S4 bacteria suppresses the expression of OsSTAR2 in rice seedlings while enhancing the content of L-histidine. Both OsSTAR2 and L-histidine may serve as key genes and metabolites for improving rice’s salt and alkaline tolerance.

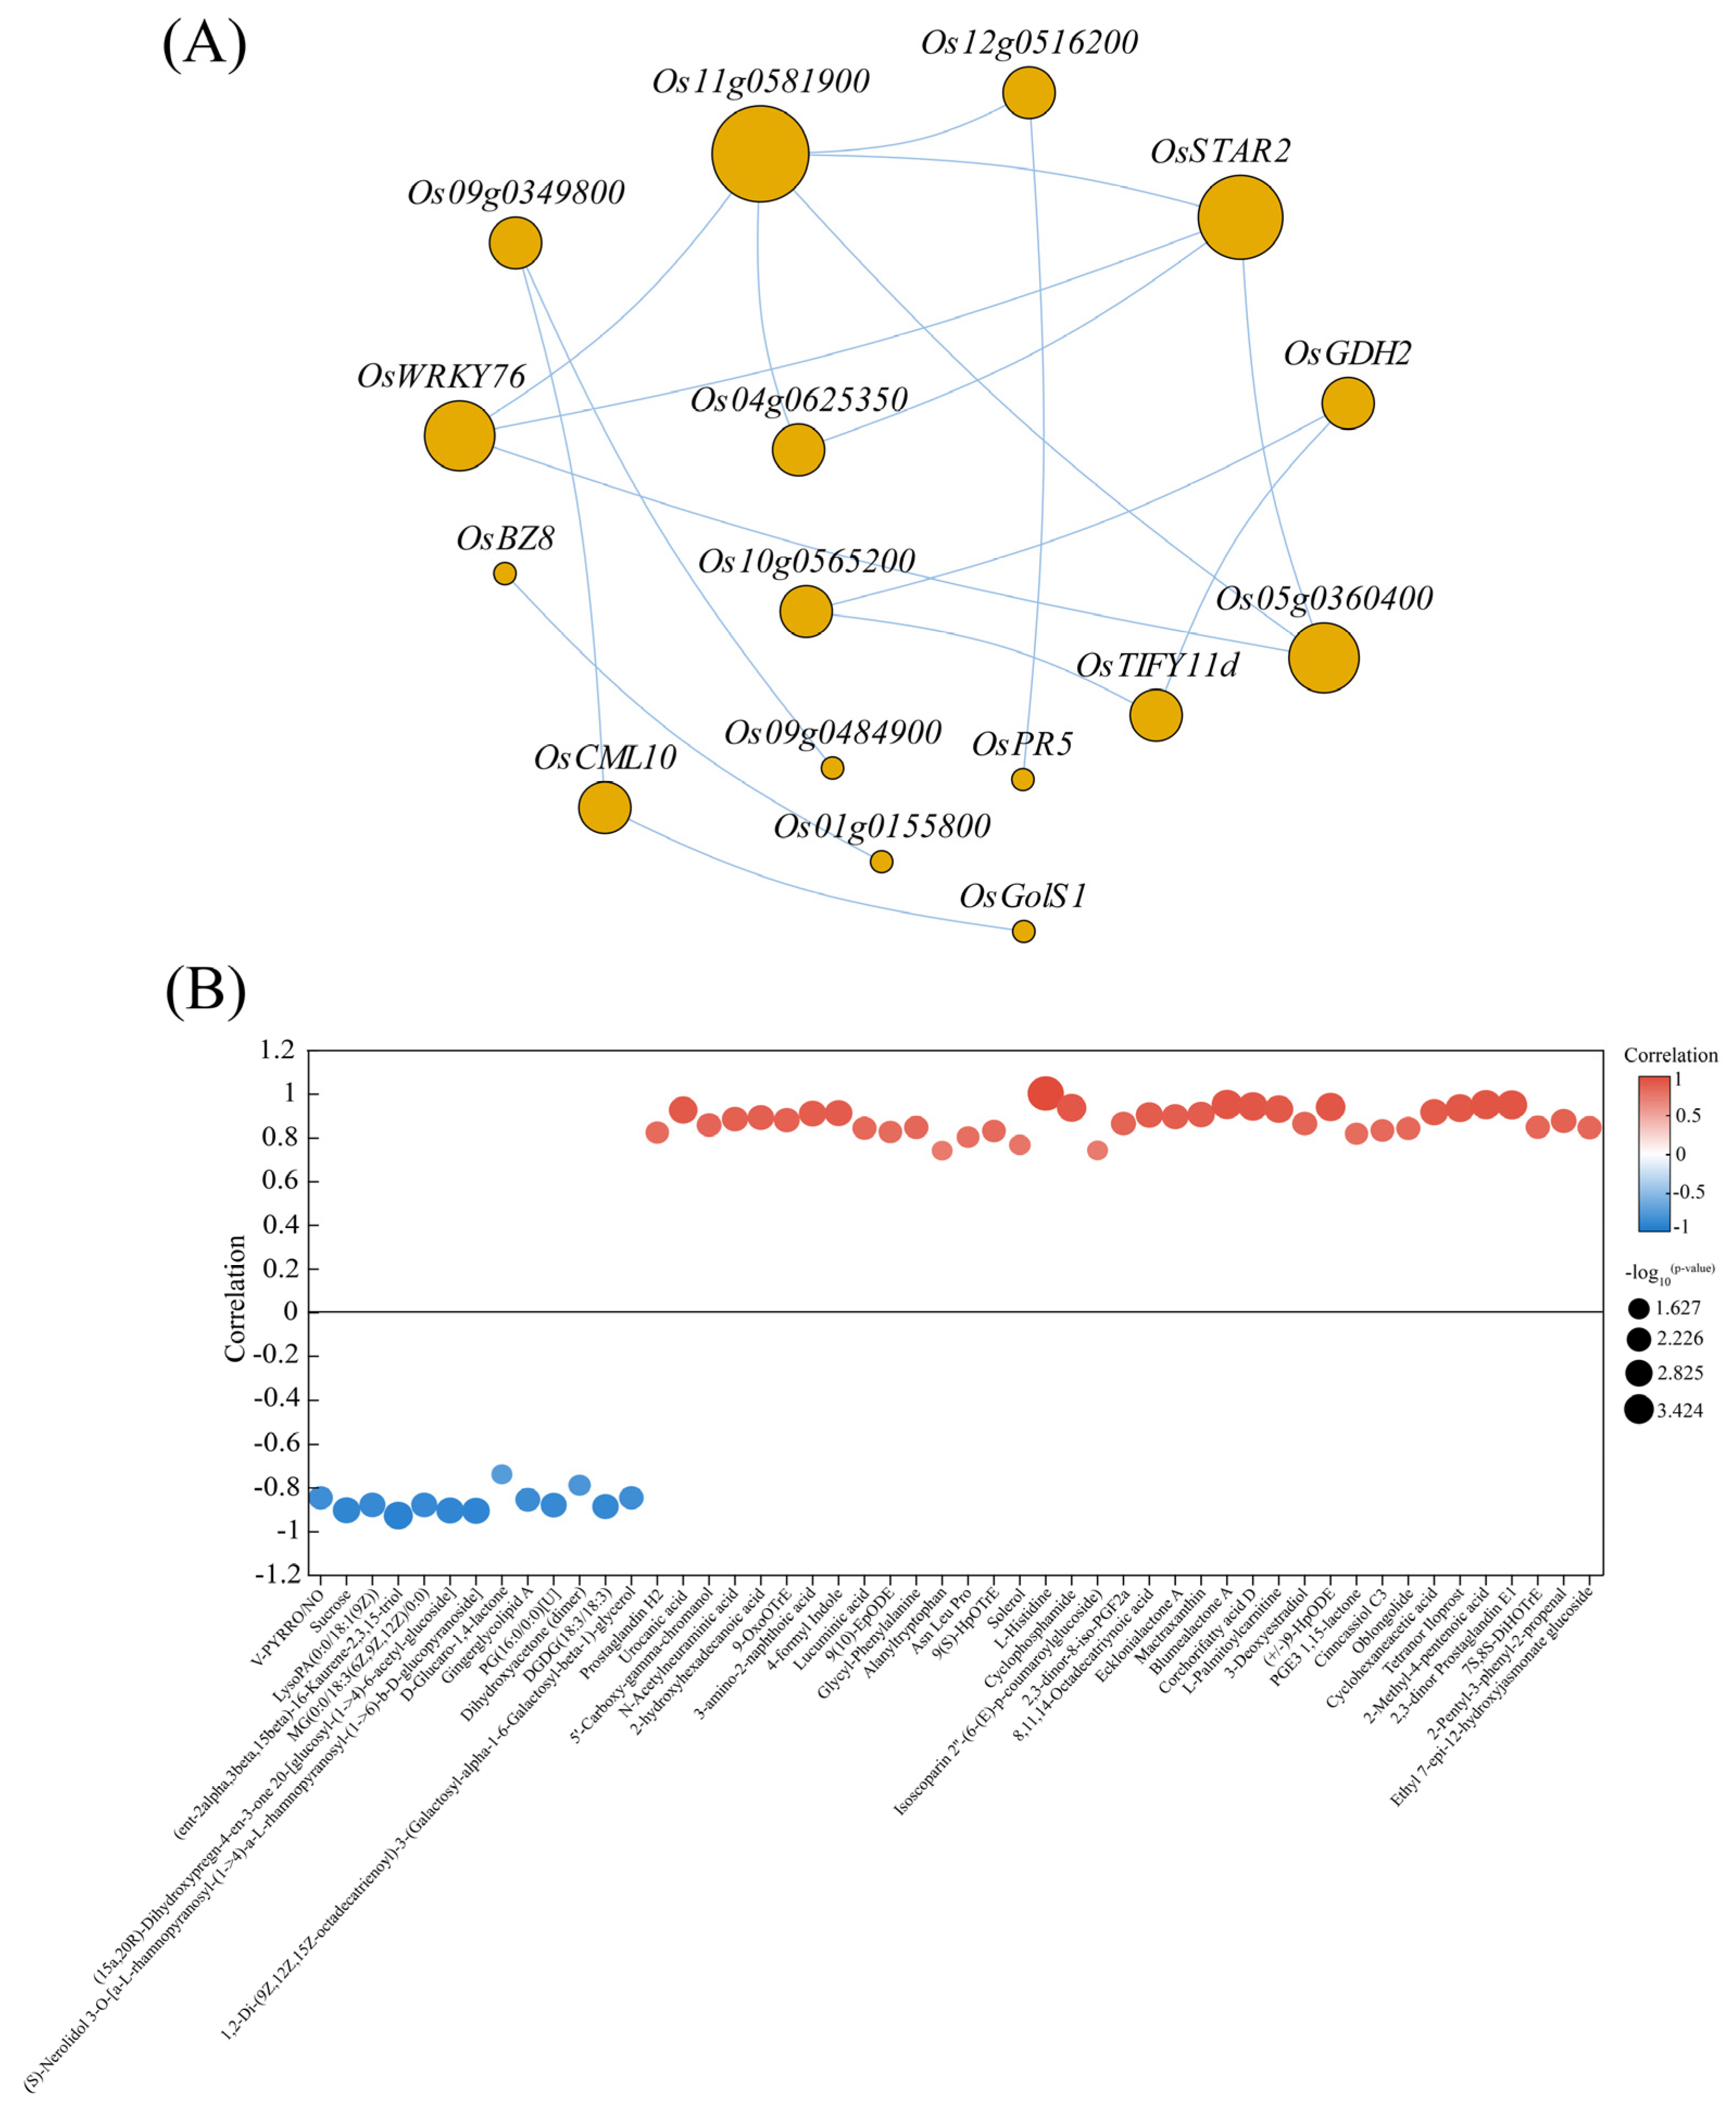
3.6. DEGs and Differential Metabolite Correlation Analysis

Genetic interaction network analysis showed that under saline–alkali stress, there was a correlation between 16 DEGs after treatment with S4 bacteria. Os11g0581900, OsGDH2, and OsSTAR2 all had strong correlations with other genes (Figure 6A). Significant correlations were observed between OsGDH2 and Os10g0565200 and OsTIFY11d. The correlation with Os11g0581900 was the strongest, and it showed significant correlations with Os12g0516200, OsWRKY76, Os04g0625350, Os05g0360400, and OsSTAR2. The correlation with OsSTAR2 was similar to that with Os11g0581900, but there was no significant correlation between them except for Os12g0516200 (Figure 6A). Both Os04g0625350 and Os05g0360400 were downregulated genes, while OsWRKY76, as an upregulated transcription factor, mainly participated in the response to chemicals (Tables S7 and S10). Additionally, the promoter region (−2000, 0) of OsSTAR2 had a W-box (TTGACT) cis-acting element. OsWRKY76 might be the upstream gene of OsSTAR2, negatively regulating the expression of OsSTAR2.
Selecting the top 50 differential metabolites based on their abundance, a correlation analysis was conducted between the key metabolite L-histidine and other metabolites. The results revealed that L-histidine was positively correlated with the majority of differential metabolites, while only negatively correlated with 13 differential metabolites, among which sucrose (r = −90563) was included (Figure 6B). However, no correlation exists between L-histidine and (−)-riboflavin. L-histidine had the highest significant negative correlation with (ent-2alpha,3beta,15beta)-16-kaurene-2,3,15-trio (r = −0.92987). The highest significant positive correlation was observed between L-histidine and 2-methyl-4-pentenoic acid (r = 0.94866) (Figure 6B). This indicates that L-histidine may induce the positive expression of the majority of differential metabolites.

4. Discussion

Saline–alkali stress can cause the accumulation of reactive oxygen species and MDA in plants. In order to reduce this damage, plants will produce defensive mechanisms, increase the activity of SOD, CAT, and POD to scavenge excess ROS, and accumulate soluble sugar, soluble protein, proline, and other substances related to regulating osmotic pressure to maintain normal cell water potential [33]. The results of the experiment showed that the activities of SOD, POD, CAT enzymes and the content of proline in the seedlings of rice inoculated with strain S4 under saline–alkali stress significantly increased compared with those of rice not inoculated under saline–alkali stress, while the content of MDA significantly decreased, and the contents of soluble sugar and soluble protein approached the level of non-saline–alkali stress. A large number of studies have found that inoculating PGPR under saline–alkali stress can reduce the harm of salt stress to plants. The combination of exogenous brassinolide and AM fungi (Funneliformis mosseae) improved the antioxidant enzyme activity of Leymus chinensis under saline–alkali stress, alleviating the toxic effects of saline–alkali stress on plants [34]. Treatment of maize seedlings with Pseudomonas monteilii PN1 significantly promoted the growth of maize seedlings, significantly decreased antioxidant enzyme activity, MDA, and Pro content, and increased the tolerance of maize seedlings to saline–alkali stress [35]. The inoculation of PGPR and AMF increased the activities of antioxidant enzymes such as SOD, CAT, and POD in oats and decreased the contents of MDA and free proline [36]. The above results suggest that S4 bacteria may be similar to other growth-promoting bacteria in regulating the antioxidant enzyme activity and osmoregulation substances content of plants under saline–alkali stress, thereby improving the ability of plants to resist saline–alkali stress.
Under saline–alkali stress, the 22 DEGs produced by S4 bacteria treatment in rice seedlings were not enriched in pathways in the KEGG database but were significantly enriched in pathways in the GO database. UDP-glucose transmembrane transporter activity was significantly enriched in T1. In general, sugar transporters play a role in controlling plant growth and defense, facilitating long-distance transport of sugars from source (leaf) to sink (such as seed and flower) organs and playing an important role in aging, nectar secretion, hormone signaling, disease pathogenesis, and abiotic stress response [37]. The genetic plasticity of plants in changing growth conditions and challenging environments in saline–alkali conditions enables them to produce metabolite pools necessary for survival under physiological perturbations, which vary depending on species, genotype, and level of saline–alkali stress [38,39]. A large number of secondary metabolites, including terpenoids, steroids, phenols, flavonoids, and alkaloids, are reported to participate in or activate cellular stress and defense responses in plants under saline–alkali stress [40,41]. For example, the production of higher levels of aromatic compounds (such as alkaloids, isoprenoids, and phenols) and phenylpropanoid derivatives (such as tannins, flavonoids, and hydroxycinnamic acid esters) is believed to be mediated by salinity stress, which allows plants to adapt to saline–alkali stress [42]. Through transcriptomic analysis of the samples, it was found that the highest enrichment of 127 differential metabolites in KEGG involved ABC transporters. ABC transporters are driven by ATP hydrolysis and can act as exporters as well as importers. ABC transporters are involved in regulating various biological processes in plants, such as growth, development, nutrient absorption, tolerance to biotic and abiotic stresses, tolerance to metal toxicity, stomatal closure, grain shape and size, pollen protection, and the transport of plant hormones [43].
To further investigate the relationship between DEGs and differential metabolites and clarify whether genes and metabolites play a synergistic role in the process of salt and alkali resistance in rice, we conducted an association analysis between DEGs enriched in GO and differential metabolites enriched in KEGG. It was found that there was a correlation between Os11g0581900, OsGDH2, OsSTAR2, and sucrose, L-histidine, (−)-riboflavin. Among them, sucrose was positively regulated by Os11g0581900. There is evidence that sucrose, as a compatible osmotic pressure for osmoregulation and detoxification, may be a major strategy for plants to protect themselves from ROS damage and adapt to osmotic stress under saline–alkali stress [44,45]. The treatment of S4 bacteria significantly decreased the content of sucrose, which may be due to the antioxidant enzymes in plants removing the accumulated ROS, allowing the plants to adapt to the environment of saline–alkali stress. This is also consistent with the trend of soluble sugar content determined previously. In addition, sucrose also acts as a signaling molecule that regulates biological and abiotic stress responses and is the primary messenger that controls signal transduction by regulating the expression of different proteins and genes [46,47]. In this experiment, riboflavin was also positively regulated by Os11g0581900. Under saline–alkali stress, treatment with S4 bacteria decreased the content of riboflavin. Some studies have shown that riboflavin induces the accumulation of antioxidant compounds in plant cells [48]. In addition, riboflavin is a well-known photosensitizer that can lead to the production of reactive oxygen species, such as singlet oxygen and superoxide anion [49]. The reason for the decrease in riboflavin may be that low levels of riboflavin (resulting in low levels of ROS production) activate the antioxidant defense system (initiating effect), while high levels of riboflavin (producing high levels of ROS) damage the antioxidant defense system (toxic effect) [50]. In the joint analysis of T1 vs. CK1, only the content of L-histidine increased, and L-histidine was positively regulated by OsGDH2 and negatively regulated by OsSTAR2. OsGDH2 encodes glutamate dehydrogenase activity and is involved in nitrogen metabolism in rice [51]. However, the expression trends of OsGDH2 and L-histidine were inconsistent, with OsGDH2 being a downregulated gene. The reason for this may be that there is a problem of high expression of genes under stress, with upregulation of expression in a short period of time, but most genes will decrease after stress, although the protein may maintain a relatively long-term upregulation. OsSTAR2, as an ABC transporter, is involved in plant tolerance to aluminum stress. It has been reported that OsSTAR1 and OsSTAR2 are regulated by transcription factors to form a complex that transports UDP-glucose into the cell wall to alleviate the damage caused by aluminum to plants [52]. Research has shown that overexpression of Fagopyrum esculentum’s FeSTAR1 in Arabidopsis thaliana mutant atstar1 rescues its tolerance to aluminum [53]. OsSTAR2 was downregulated in rice but negatively regulated the high expression of L-histidine. Amino acids have the functions of regulating crop growth and development, increasing crop yield, and improving crop quality and can be directly absorbed and utilized by plants, providing carbon and nitrogen sources, scavenging reactive oxygen species in plants, and improving plant tolerance to saline–alkali stress [54]. Research has found that L-histidine has a role in metal ion chelation and transport [55]. Recent studies have shown that L-histidine at certain concentrations can improve the salt tolerance of maize seedling roots [56]. Therefore, L-histidine may be a key metabolite that causes saline–alkali resistance in rice.
Subsequently, further analysis of the gene interaction network of OsSTAR2 revealed that there was a correlation between an upregulated transcription factor OsWRKY76 and OsSTAR2 and that there is a W-box cis-acting element on the promoter of OsSTAR2. The research has found that OsWRKY76 is widely involved in abiotic stress processes in rice. OsWRKY76 interacts with OsbHLH148 to trans-activate the expression of OsDREB1B, enhancing the cold tolerance of rice [57]; in addition, OsWRKY76 can also mediate the positive regulation of drought stress in rice jasmonic acid signaling transduction [58]. OsWRKY76, as an important transcription factor involved in abiotic stress in rice, may regulate the involvement of OsSTAR2 in salt and alkali stress resistance in rice. In the analysis of L-histidine-related metabolites, it was found that L-histidine had the highest positive correlation with 2-methyl-4-pentenoic acid. A study found that under nitrogen stress, peppers increase the content of 2-methyl-4-pentenoic acid to resist abiotic stress [59], which also suggests that 2-methyl-4-pentenoic acid may have a relationship with saline–alkali stress in rice. Therefore, in addition to OsSTAR2 and L-histidine, there are other genes and metabolites related to it that regulate the saline–alkali resistance of rice.

5. Conclusions

On this basis, we conclude that under saline–alkali stress, treatment of rice seedlings with S4 significantly increased the activity of SOD, CAT, and POD, reduced the accumulation of MDA, increased the content of proline, reduced the content of soluble protein and soluble sugar, enhanced the antioxidant system of rice, improved its clearance efficiency of ROS, and balanced the content of osmoregulatory substances. In addition, S4 bacteria caused differential expression of genes and metabolites in rice seedlings under saline–alkali stress. DEGs and differential metabolites were involved in UDP-glucose transmembrane transporter activity and ABC transporters in GO enrichment and KEGG enrichment, respectively. Further correlation analysis revealed that S4 bacteria induced the upregulation of OsWRKY76 in rice seedlings under saline–alkali stress, leading to the downregulation of the key gene OsSTAR2. OsSTAR2 negatively regulated L-histidine, causing an increase in its content. L-histidine led to a rise in the content of 2-methyl-4-pentenoic acid, which was positively correlated with it. Therefore, rhizobacteria S4 not only enhances the saline–alkali resistance of rice by increasing the activity of antioxidant enzymes but also regulates the saline–alkali stress resistance of rice through multiple pathways. This indicates that the S4 bacteria has the potential to improve saline–alkali soil and can be used as a biological stimulant to enhance the saline–alkali stress resistance of crops. The results of this study provide a scientific basis for the application of S4 bacteria in rice saline–alkali stress resistance.

Supplementary Materials

The following supporting information can be downloaded at: https://www.mdpi.com/article/10.3390/agronomy14040649/s1, Figure S1: The phylogenetic tree of S4 bacteria; Figure S2: The gel electrophoresis diagram of RNA and the detection results of Agilent 5300; Table S1: The gene sequence of S4 bacteria; Table S2: The physiological and biochemical characteristics of S4 bacteria; Table S3 Sample detection results; Table S4: Primer sequence of RT-qPCR genes; Table S5: Sequencing data statistics; Table S6: Sequencing result alignment; Table S7: Detailed list of differentially expressed genes; Table S8: Detailed table of differential metabolites; Table S9: Annotation of differential metabolites in HMDB; Table S10: GO enrichment analysis pathway; Table S11: KEGG enrichment analysis pathway.

Author Contributions

Conceptualization, H.J. and Y.Q.; methodology, H.J.; validation, Y.Q.; formal analysis, H.J.; resources, X.Z. and G.Y.; writing—original draft preparation, H.J. and Y.Q.; writing—review and editing, X.Z. and G.Y.; visualization, H.J.; funding acquisition, X.Z. and G.Y. All authors have read and agreed to the published version of the manuscript.

Funding

This research was funded by the Ningxia Key Research and Development Plan (2023BCF01014), the National Natural Science Foundation of China (32060424), and Science and Technology Leading Talents of Ningxia Hui Autonomous Region (2022GKLRLX06).

Institutional Review Board Statement

Not applicable.

Data Availability Statement

Data are contained within the article.

Conflicts of Interest

The authors declare no conflicts of interest.

References

  1. Nouri, H.; Chavoshi Borujeni, S.; Nirola, R.; Hassanli, A.; Beecham, S.; Alaghmand, S.; Saint, C.; Mulcahy, D. Application of Green Remediation on Soil Salinity Treatment: A Review on Halophytoremediation. Process Saf. Environ. Prot. 2017, 107, 94–107. [Google Scholar] [CrossRef]
  2. Qadir, M.; Qureshi, A.S.; Cheraghi, S.A. Extent and Characterisation of Salt-affected Soils in Iran and Strategies for Their Amelioration and Management. Land Degrad. Develop. 2008, 19, 214–227. [Google Scholar] [CrossRef]
  3. Zhao, Q.; Zhang, H.; Wang, T.; Chen, S.; Dai, S. Proteomics-based Investigation of Salt-responsive Mechanisms in Plant Roots. J. Proteom. 2013, 82, 230–253. [Google Scholar] [CrossRef]
  4. Li, R.; Shi, F.; Fukuda, K. Interactive Effects of Salt and Alkali Stresses on Seed Germination, Germination Recovery, and Seedling Growth of a Halophyte Spartina alterniflora (Poaceae). S. Afr. J. Bot. 2010, 76, 380–387. [Google Scholar] [CrossRef]
  5. Xu, B.; Cao, L.; Zhang, Z.; Li, X.; Zhao, X.; Wang, X.; Wang, Y.; Wu, B.; Zhou, W.; Lin, C.; et al. Physiological Effects of Combined NaCl and NaHCO3 Stress on the Seedlings of Two Maple Species. Front. Plant Sci. 2023, 14, 1209999. [Google Scholar] [CrossRef] [PubMed]
  6. Khan, A.; Khan, A.L.; Muneer, S.; Kim, Y.; Al-Rawahi, A.; Al-Harrasi, A. Silicon and Salinity: Crosstalk in Crop-Mediated Stress Tolerance Mechanisms. Front. Plant Sci. 2019, 10, 1429. [Google Scholar] [CrossRef]
  7. Vaishnav, A.; Shukla, A.K.; Sharma, A.; Kumar, R.; Choudhary, D.K. Endophytic Bacteria in Plant Salt Stress Tolerance: Current and Future Prospects. J. Plant Growth Regul. 2018, 38, 650–668. [Google Scholar] [CrossRef]
  8. Tabassum, B.; Khan, A.; Tariq, M.; Ramzan, M.; Khan, M.I.; Shahid, N.; Aaliya, K. Bottlenecks in Commercialisation and Future Prospects of PGPR. Appl. Soil Ecol. 2017, 121, 102–117. [Google Scholar] [CrossRef]
  9. Gray, E.J.; Smith, D.L. Intracellular and Extracellular PGPR: Commonalities and Distinctions in the Plant–bacterium Signaling Processes. Soil Biol. Biochem. 2005, 37, 395–412. [Google Scholar] [CrossRef]
  10. Oleńska, E.; Małek, W.; Wójcik, M.; Święcicka, I.; Thijs, S.; Vangronsveld, J. Beneficial Features of Plant Growth-promoting Rhizobacteria for Improving Plant Growth and Health in Challenging Conditions: A Methodical Review. Sci. Total Environ. 2020, 743, 140682. [Google Scholar] [CrossRef]
  11. Igiehon, N.O.; Babalola, O. Rhizosphere Microbiome Modulators: Contributions of Nitrogen Fixing Bacteria towards Sustainable Agriculture. Int. J. Environ. Res. Public Health 2018, 15, 574. [Google Scholar] [CrossRef]
  12. Qin, Y.; Druzhinina, I.S.; Pan, X.; Yuan, Z. Microbially Mediated Plant Salt Tolerance and Microbiome-based Solutions for Saline Agriculture. Biotechnol. Adv. 2016, 34, 1245–1259. [Google Scholar] [CrossRef]
  13. Olaniyan, F.T.; Alori, E.T.; Adekiya, A.O.; Ayorinde, B.B.; Daramola, F.Y.; Osemwegie, O.O.; Babalola, O.O. The Use of Soil Microbial Potassium Solubilizers in Potassium Nutrient Availability in Soil and Its Dynamics. Ann. Microbiol. 2022, 72, 45. [Google Scholar] [CrossRef]
  14. Chen, Y.; Ye, J.; Kong, Q. Potassium-Solubilizing Activity of Bacillus aryabhattai SK1-7 and Its Growth-Promoting Effect on Populus alba L. Forests 2020, 11, 1348. [Google Scholar] [CrossRef]
  15. Prittesh, P.; Avnika, P.; Kinjal, P.; Jinal, H.N.; Sakthivel, K.; Amaresan, N. Amelioration Effect of Salt-tolerant Plant Growth-promoting Bacteria on Growth and Physiological Properties of Rice (Oryza sativa) under Salt-stressed Conditions. Arch. Microbiol. 2020, 202, 2419–2428. [Google Scholar] [CrossRef]
  16. Kumar, A.; Patel, J.S.; Meena, V.S.; Srivastava, R. Recent Advances of PGPR Based Approaches for Stress Tolerance in Plants for Sustainable Agriculture. Biocatal. Agric. Biotechnol. 2019, 20, 101271. [Google Scholar] [CrossRef]
  17. Yuan, C.; Mou, C.; Wu, W.; Guo, Y. Effect of Different Fertilization Treatments on Indole-3-acetic Acid Producing Bacteria in Soil. J. Soil. Sediment. 2011, 11, 322–329. [Google Scholar] [CrossRef]
  18. Ganapati, R.K.; Naveed, S.A.; Zafar, S.; Wang, W.; Xu, J. Saline-Alkali Tolerance in Rice: Physiological Response, Molecular Mechanism, and QTL Identification and Application to Breeding. Rice Sci. 2022, 29, 412–434. [Google Scholar] [CrossRef]
  19. Theocharis, A.; Bordiec, S.; Fernandez, O.; Paquis, S.; Dhondt-Cordelier, S.; Baillieul, F.; Clément, C.; Barka, E.A. Burkholderia phytofirmans PsJN primes Vitis vinifera L. and Confers a Better Tolerance to Low Nonfreezing Temperatures. Mol. Plant Microbe Interact. 2012, 25, 241–249. [Google Scholar] [CrossRef] [PubMed]
  20. Mushtaq, Z.; Liaquat, M.; Nazir, A.; Liaqat, R.; Iftikhar, H.; Anwar, W.; Itrat, N. Potential of Plant Growth Promoting Rhizobacteria to Mitigate Chromium Contamination. Environ. Technol. Inno. 2022, 28, 102826. [Google Scholar] [CrossRef]
  21. Diagne, N.; Ndour, M.; Djighaly, P.I.; Ngom, D.; Ngom, M.C.; Ndong, G.; Svistoonoff, S.; Cherif-Silini, H. Effect of Plant Growth Promoting Rhizobacteria (PGPR) and Arbuscular Mycorrhizal Fungi (AMF) on Salt Stress Tolerance of Casuarina obesa (Miq.). Front. Sustain. Food Syst. 2020, 4, 601004. [Google Scholar] [CrossRef]
  22. Gupta, A.; Mishra, R.; Rai, S.; Bano, A.; Pathak, N.; Fujita, M.; Kumar, M.; Hasanuzzaman, M. Mechanistic Insights of Plant Growth Promoting Bacteria Mediated Drought and Salt Stress Tolerance in Plants for Sustainable Agriculture. Int. J. Mol. Sci. 2022, 23, 3741. [Google Scholar] [CrossRef]
  23. Anderson, J.; Mitchell-Olds, T. Ecological Genetics and Genomics of Plant Defenses: Evidence and Approaches. Funct. Ecol. 2011, 25, 312–324. [Google Scholar] [CrossRef]
  24. Yan, S.; Bhawal, R.; Yin, Z.; Thannhauser, T.; Zhang, S. Recent Advances in Proteomics and Metabolomics in Plants. Mol. Hortic. 2022, 2, 17. [Google Scholar] [CrossRef]
  25. Pandey, A.; Khan, M.K.; Hamurcu, M.; Brestic, M.; Topal, A.; Gezgin, S. Insight into the Root Transcriptome of a Boron-Tolerant Triticum zhukovskyi Genotype Grown under Boron Toxicity. Agronomy 2022, 12, 2421. [Google Scholar] [CrossRef]
  26. Zou, Y.; Shi, Y.; Liu, F.; Li, E.; Yang, Q.; Chen, R.; Li, Q. The Synergistic Lipogenesis Inhibition and Molecular Mechanism of Polyphenols and Polysaccharides from Mulberry Leaf. Food Biosci. 2023, 57, 103522. [Google Scholar] [CrossRef]
  27. Kim, D.; Langmead, B.; Salzberg, S.L. HISAT: A Fast Spliced Aligner with Low Memory Requirements. Nat. Methods 2015, 12, 357–360. [Google Scholar] [CrossRef]
  28. Pertea, M.; Pertea, G.M.; Antonescu, C.M.; Chang, T.C.; Mendell, J.T.; Salzberg, S.L. StringTie Enables Improved Reconstruction of A Transcriptome from RNA-seq Reads. Nat. Biotechnol. 2015, 33, 290–295. [Google Scholar] [CrossRef] [PubMed]
  29. Love, M.I.; Huber, W.; Anders, S. Moderated Estimation of Fold Change and Dispersion for RNA-seq Data with DESeq2. Genome Biol. 2014, 15, 550. [Google Scholar] [CrossRef] [PubMed]
  30. Ren, Y.; Yu, G.; Shi, C.; Liu, L.; Guo, Q.; Han, C.; Zhang, D.; Zhang, L.; Liu, B.; Gao, H.; et al. Majorbio Cloud: A One-stop, Comprehensive Bioinformatic Platform for Multiomics Analyses. iMeta 2022, 1, 12. [Google Scholar] [CrossRef]
  31. Xie, C.; Mao, X.Z.; Huang, J.J.; Ding, Y.; Wu, J.M.; Dong, S.; Kong, L.; Gao, G.; Li, C.; Wei, L. KOBAS 2.0: A Web Server for Annotation and Identification of Enriched Pathways and Diseases. Nucleic Acids Res. 2011, 39, 316–322. [Google Scholar] [CrossRef] [PubMed]
  32. Maksup, S.; Supaibulwatana, K.; Selvaraj, G. High-Quality Reference Genes for Quantifying the Transcriptional Responses of Oryza sativa L. (ssp. indica and japonica) to Abiotic Stress Conditions. Chin. Sci. Bull. 2013, 58, 1919–1930. [Google Scholar] [CrossRef]
  33. Wang, P.; Xu, Z.; Zhang, Y.; Ma, Y.; Yang, J.; Zhou, F.; Gao, Y.; Li, G.; Hu, X. Over-expression of Spermidine Synthase 2 (SlSPDS2) in Tomato Plants Improves Saline-alkali Stress Tolerance by Increasing Endogenous Polyamines Content to Regulate Antioxidant Enzyme System and Ionic Homeostasis. Plant Physiol. Biochem. 2022, 192, 172–185. [Google Scholar] [CrossRef] [PubMed]
  34. Gao, Z.; Liu, J.; Li, Q.; Liu, J.; Bai, M.; Li, X.; Zhu, Q.; Cui, Y.; Rasheed, A. Effects of Exogenous Brassinolide and AM Fungi on Growth, Photosynthetic Characteristics and Antioxidant Enzyme System of Leymus chinensis under Salt and Alkali Stress. Not. Bot. Horti. Agrobo. 2023, 51, 13378. [Google Scholar] [CrossRef]
  35. Zhang, Y.; Yang, F.Q.; Ren, H.; Liu, J.; Mu, W.; Wang, Y. Pseudomonas Monteilii PN1: A Great Potential P-nitrophenol Degrader with Plant Growth Promoting Traits under Drought and Saline–alkali Stresses. Biotechnol. Lett. 2019, 41, 801–811. [Google Scholar] [CrossRef]
  36. Xun, F.; Xie, B.; Liu, S.; Guo, C. Effect of Plant Growth-promoting Bacteria (PGPR) and Arbuscular Mycorrhizal Fungi (AMF) Inoculation on Oats in Saline-alkali Soil Contaminated by Petroleum to Enhance Phytoremediation. Environ. Sci. Pollut. Res. Int. 2014, 22, 598–608. [Google Scholar] [CrossRef]
  37. Singh, J.; Das, S.; Kapuganti, J.G.; Ranjan, A.; Foyer, C.H.; Thakur, J.K. Physiological Implications of SWEETs in Plants and Their Potential Applications in Improving Source-sink Relationships for Enhanced Yield. Plant Biotechnol. J. 2022, 21, 1528–1541. [Google Scholar] [CrossRef] [PubMed]
  38. Parihar, P.; Singh, S.; Singh, R.; Singh, V.P.; Prasad, S.M. Effect of Salinity Stress on Plants and Its Tolerance Strategies: A Review. Environ. Sci. Poll. Res. 2015, 22, 4056–4075. [Google Scholar] [CrossRef]
  39. Xu, C.; Tang, X.; Shao, H.; Wang, H. Salinity Tolerance Mechanism of Economic Halophytes from Physiological to Molecular Hierarchy for Improving Food 1uality. Curr. Genom. 2016, 17, 207–214. [Google Scholar] [CrossRef]
  40. Sytar, O.; Barki, S.; Zivcak, M.; Brestic, M. The Involvement of Different Secondary Metabolites in Salinity Tolerance of Crops. In Salinity Responses and Tolerance in Plants; Kumat, V., Ed.; Springer: Cham, Switzerland, 2018; Volume 2, pp. 21–48. [Google Scholar] [CrossRef]
  41. Harborne, J.B. Classes and Functions of Secondary Products from Plants. Chem. Plants 1999, 1, 1–25. [Google Scholar] [CrossRef]
  42. Yan, G.; Shi, Y.; Mu, C.; Wang, J. Differences in Organic Solute and Metabolites of Leymus chinensis in Response to Different Intensities of Salt and Alkali Stress. Plants 2023, 12, 1916. [Google Scholar] [CrossRef]
  43. Dahuja, A.; Kumar, R.R.; Sakhare, A.S.; Watts, A.; Singh, B.P.; Goswami, S.; Sachdev, A.; Praveen, S. Role of ABC Transporters in Maintaining Plant Homeostasis under Abiotic and Biotic Stresses. Physiol. Plantarum 2020, 171, 785–801. [Google Scholar] [CrossRef]
  44. Yang, Y.; Guo, Y. Elucidating the Molecular Mechanisms Mediating Plant Salt-stress Responses. New Phytol. 2018, 217, 523–539. [Google Scholar] [CrossRef] [PubMed]
  45. Singh, M.; Kumar, J.; Singh, S.; Singh, V.P.; Prasad, S.M. Roles of Osmoprotectants in Improving Salinity and Drought Tolerance in Plants: A Review. Rev. Environ. Sci. Bio-Technol. 2015, 14, 407–426. [Google Scholar] [CrossRef]
  46. Dasgupta, K.; Khadilkar, A.S.; Sulpice, R.; Pant, B.; Scheible, W.R.; Fisahn, J.; Stitt, M.; Ayre, B.G. Expression of Sucrose Transporter cDNAs Specifically in Companion Cells Enhances Phloem Loading and Long-distance Transport of Sucrose but Leads to An Inhibition of Growth and The Perception of A Phosphate Limitation. Plant Physiol. 2014, 165, 715–731. [Google Scholar] [CrossRef] [PubMed]
  47. Park, H.J.; Kim, W.Y.; Yun, D.J. A New Insight of Salt Stress Signaling in Plant. Mol. Cell. 2016, 39, 447–459. [Google Scholar] [CrossRef]
  48. Taheri, P.; Tarighi, S. Riboflavin Induces Resistance in Rice Against Rhizoctonia Solani via Jasmonate-mediated Priming of Phenylpropanoid Pathway. J. Plant Physiol. 2010, 167, 201–208. [Google Scholar] [CrossRef] [PubMed]
  49. Eichler, M.; Lavi, R.; Shainberg, A.; Lubart, R. Flavins are Source of Visible-light-induced Free Radical Formation in Cells. Las. Surg. Med. 2005, 37, 314–319. [Google Scholar] [CrossRef] [PubMed]
  50. Deng, B.; Jin, X.; Yang, Y.; Lin, Z.; Zhang, Y. The Regulatory Role of Riboflavin in The Drought Tolerance of Tobacco Plants Depends on ROS Production. Plant Growth Regul. 2015, 72, 269–277. [Google Scholar] [CrossRef]
  51. Abiko, T.; Obara, M.; Ushioda, A.; Hayakawa, T.; Hodges, M.; Yamaya, T. Localization of NAD-isocitrate Dehydrogenase and Glutamate Dehydrogenase in Rice Roots: Candidates for Providing Carbon Skeletons to NADH-glutamate Synthase. Plant Cell Physiol. 2005, 46, 1724–1734. [Google Scholar] [CrossRef]
  52. Huang, C.F.; Yamaji, N.; Mitani, N.; Yano, M.; Nagamura, Y.; Ma, J.F. A Bacterial-type ABC Transporter is Involved in Aluminum Tolerance in Rice. Plant Cell 2009, 21, 655–667. [Google Scholar] [CrossRef]
  53. Xu, J.M.; Lou, H.Q.; Jin, J.F.; Chen, W.W.; Wan, J.X.; Fan, W.; Yang, J.L. A Half-type ABC Transporter FeSTAR1 Regulates Al Resistance Possibly via UDP-glucose-based Hemicellulose Metabolism and Al Binding. Plant Soil 2018, 432, 303–314. [Google Scholar] [CrossRef]
  54. Colla, G.; Rouphael, Y.; Canaguier, R.; Svecova, E.; Cardarelli, M. Biostimulant Action of A Plant-derived Protein Hydrolysate Produced through Enzymatic Hydrolysis. Front. Plant Sci. 2014, 5, 448. [Google Scholar] [CrossRef]
  55. Krämer, U.; Cotter-Howells, J.D.; Charnock, J.M.; Baker, A.J.; Smith, J.A. Free Histidine as A Metal Chelator in Plants that Accumulate Nickel. Nature 1996, 379, 635–638. [Google Scholar] [CrossRef]
  56. Ji, H.; Yang, G.; Zhang, X.; Zhong, Q.; Qi, Y.; Wu, K.; Shen, T. Regulation of Salt Tolerance in The Roots of Zea mays by L-histidine through Transcriptome Analysis. Front. Plant Sci. 2022, 13, 1049954. [Google Scholar] [CrossRef] [PubMed]
  57. Zhang, M.; Zhao, R.; Huang, K.; Huang, S.; Wang, H.; Wei, Z.; Li, Z.; Bian, M.; Jiang, W.; Wu, T.; et al. The OsWRKY63-OsWRKY76-OsDREB1B Module Regulates Chilling Tolerance in Rice. Plant J. 2022, 112, 383–398. [Google Scholar] [CrossRef] [PubMed]
  58. Zhang, M.; Zhao, R.; Huang, K.; Wei, Z.; Guo, B.; Huang, S.; Li, Z.; Jiang, W.; Wu, T.; Du, X. OsWRKY76 Positively Regulates Drought Stress via OsbHLH148-mediated Jasmonate Signaling in Rice. Front. Plant Sci. 2023, 14, 1168723. [Google Scholar] [CrossRef] [PubMed]
  59. David, Y.C.; Ylagan, J.B.; Gonzales, H.A.; Chan, J.P.; Mondragon, J.S.; Tavera, M.; Redillas, M.C. Volatile Organic Compound Profiling of Capsicum annuum var. Longum Grown under Different Concentrations of Nitrogen. Hell. Plant Prot. J. 2021, 14, 77–88. [Google Scholar] [CrossRef]
Figure 1. Antioxidant enzyme activity and content of osmotic regulators: (A) superoxide dismutase activity; (B) peroxidase activity; (C) catalase activity; (D) malondialdehyde content; (E) proline content; (F) soluble protein content; (G) soluble sugar content. Data are presented as the mean ± SEM for three biological replicate samples. Bars labeled with different letters for significant differences between treatments were assigned based on the Duncan method.
Agronomy 14 00649 g001
Figure 2. PCA analysis between transcriptome samples (A) and OPLAS-DA analysis between metabolome samples (B), as well as permutation testing (C).
Agronomy 14 00649 g002
Figure 3. Volcano plot (A) and heatmap (B) of DEGs, volcano plot (C) and heatmap (D) of differential metabolites, GO functional annotation (E) of DEGs, and HMDB functional annotation (F) of differential metabolites.
Agronomy 14 00649 g003
Figure 4. Quantitative real-time PCR (RT-qPCR) validation of DEGs selected from RNA-seq analysis (A), as well as the correlation between the qPCR and RNA-Seq results (B). The data obtained through RNA-seq are represented by lines, while the relative expression levels obtained through RT-PCR are shown in the histogram.
Agronomy 14 00649 g004
Figure 5. GO enrichment analysis (A), KEGG enrichment analysis (B), and correlation analysis (C) of DEGs. p-Value < 0.05 is considered significant.
Agronomy 14 00649 g005
Figure 6. Correlation analysis between DEGs (A) and correlation between L-histidine and the top 50 differential metabolites by abundance (B).
Agronomy 14 00649 g006
Table 1. Basic information about sampling sites.
SiteLatitudeLongitudePlantsMass Fraction of Salt
(%, g/g)
pH
Shapotou, Zhongwei, Ningxia37°28′105°26′Oryza sativa0.328.3
Suaeda glauca0.458.4
Zea mays0.418.5
Pingluo County, Ningxia39°14′106°45′Helianthus annuus0.438.4
Oryza sativa0.428.2
Triticum aestivum0.458.3
Yinchuan City, Ningxia38°20′106°16′Triticum aestivum0.348.3
Ipomoea aquatica0.308.2
Sorghum dochna0.358.3
Table 2. Differences in the height of rice seedlings and root length under various treatments. Data are presented as the mean ± SEM of three biological replicate samples. Different letters for significant differences between treatments were assigned based on the Duncan method.
TreatmentsPlant Height (cm)Root Length (cm)
CK017.77 ± 0.67 a8.67 ± 0.44 a
T018 ± 0.55 a8.43 ± 0.74 a
CK16.73 ± 0.62 c1.3 ± 0.15 c
T19.87 ± 0.38 b3.7 ± 0.15 b
Disclaimer/Publisher’s Note: The statements, opinions and data contained in all publications are solely those of the individual author(s) and contributor(s) and not of MDPI and/or the editor(s). MDPI and/or the editor(s) disclaim responsibility for any injury to people or property resulting from any ideas, methods, instructions or products referred to in the content.

