Article

Quantifying High-Temperature-Induced Injury in Nanfeng Tangerine Plants: Insights from Photosynthetic and Biochemical Mechanisms

1
Jiangxi Key Laboratory of Horticultural Crops (Fruit, Vegetable & Tea) Breeding, Jiangxi Academy of Agricultural Sciences, Nanchang 330200, China
2
Nanchang Key Laboratory of Germplasm Innovation and Utilization of Fruit and Tea, Jiangxi Academy of Agricultural Sciences, Nanchang 330200, China
3
Institute of Environment and Sustainable Development in Agriculture, Chinese Academy of Agricultural Sciences, Beijing 100081, China
*
Author to whom correspondence should be addressed.
Agronomy 2024, 14(4), 648; https://doi.org/10.3390/agronomy14040648
Submission received: 5 March 2024 / Revised: 19 March 2024 / Accepted: 19 March 2024 / Published: 23 March 2024
(This article belongs to the Section Horticultural and Floricultural Crops)

Abstract

:
High temperatures significantly injure the flowering, pollination, fruit growth, and quality of plants. Photosynthesis, the fundamental process supporting plant life, is crucial. Nevertheless, the quantitative evaluation of the physiological activity of the photosynthetic system of Nanfeng tangerine (NT) plants under high-temperature conditions remains a challenge. This research utilized NT plants, a distinctive citrus variety in Jiangxi Province, as the experimental subject. The study investigated the effects of varying degrees of high-temperature stress and duration on 16 photosynthetic physiological parameters of NT plants. The study examined the impact of four varying high-temperature treatment levels (32/22 °C, 35/25 °C, 38/28 °C, and 41/31 °C) for durations of 2, 4, 6, and 8 days, respectively. Principal component analysis was utilized to identify the key indicators of photosynthetic physiological activity in NT plants, with Fv/Fm, Pmax, LCP, H2O2, MDA, and POD being selected as key parameters. The high-temperature stress index model previously constructed was used to calculate the high-temperature stress index value of the NT plants exposed to varying degrees and durations of high temperature, in order to provide a comprehensive assessment of the photosynthetic system of NT plants under high-temperature stress. Subsequently, the high-temperature stress levels were categorized into five levels based on the calculated values: Level 0 for 0 < HSI ≤ 2, Level 1 for 2 < HSI ≤ 4, Level 2 for 4 < HSI ≤ 6, Level 3 for 6 < HSI ≤ 8, and Level 4 for HSI > 8. The research results provide valuable data for agricultural meteorological departments to carry out disaster risk zoning and risk assessment in the future.

1. Introduction

The Nanfeng tangerine (NT, Citrus reticulata Blanco cv. Kinokuni), which belongs to the family Rosacea, is a unique local citrus cultivar of Nanfeng County, located in Jiangxi Province, China, with a cultivation history of more than 1300 years [1]. It is known as “the king of oranges” because its fruit has a thin skin and few kernels, a small amount of juice residue, a golden color, a sweet and sour taste, and high content of nutrients [2]. NT plants are very sensitive to temperature, and their optimal temperature for growth and development is between 23 °C and 32 °C, with an upper limit temperature of 38 °C. However, in the context of global warming, extreme high-temperature disasters have occurred frequently. According to the observation data of the National Ground Meteorological Station in Nanfeng County, there were 32 days in 2022 that exceeded 40 °C, severely restricting the normal growth and development of NT plants. Under hot conditions, NT plants are subjected to severe stress: their leaves curl and turn yellow, their fruits burn severely and become small and hard, and some branches at the top even wither and die [3]. Hence, a thorough investigation of the photosynthetic and biochemical alterations in NT plants in response to high-temperature stress and the precise warning indicators of heat stress is crucial in formulating efficient strategies for disaster prevention and mitigation.
In recent years, the concentration of CO2 in the atmosphere has continued to increase due to human activities, exacerbating the global rise in temperature [4]. The stress of high temperatures caused by enhanced global warming is expected to increase in intensity, frequency and duration, posing severe challenges to modern agriculture [5]. In the 10 years from 2011 to 2020, the global surface temperature was 1.09 °C higher than that between 1850 and 1900, and the past 5 years were also the hottest since temperature records began in 1850 [6]. While human activities during the COVID-19 epidemic in 2020 led to a significant reduction in carbon emissions, this reduction was short-lived, and global temperatures have continued to rise [7,8]. Therefore, the frequency of future high-temperature events will be higher. Heat stress has adverse effects on various plant development processes, including seed germination, vegetative growth, and reproductive processes [9]. Furthermore, elevated temperatures have detrimental effects on the important physiological processes of plants, including photosynthesis, stomatal conductance, leaf water chlorophyll homeostasis, and enzyme activity [10]. Chlorophyll fluorescence is closely related to the process of photosynthesis and is used as an effective probe for studying the relationship between stress conditions and photosynthesis. Chlorophyll fluorescence, as a probe for studying the relationship between stress conditions and photosynthesis, not only reflects the primary reaction processes of photosynthesis such as light energy absorption, excitation energy transfer, and photochemical reactions, but also is related to processes such as electron transfer, proton gradient establishment, ATP synthesis, and CO2 fixation [11]. Almost all changes in the process of photosynthesis can be reflected through chlorophyll fluorescence, so studying changes in photosynthesis through chlorophyll fluorescence is a simple, fast, and reliable method.
Plants demonstrate short-term avoidance or domestication mechanisms in reaction to elevated temperature stress, including alterations in their leaf orientation, transpiration cooling, and modifications in their membrane lipid composition [12,13]. Concurrently, the closure of stomata and decreased water loss in leaves, augmented stomatal density, and enlarged xylem vessels are prevalent thermal response traits in plants [14]. Furthermore, plants can also make minor adjustments to their tolerance to high temperatures through physiological adaptations, primarily manifested as physiological and biochemical alterations. In order to mitigate the detrimental effects of elevated temperatures, plants undergo alterations in their antioxidant enzyme activity to minimize the occurrence of membrane lipid peroxidation. The primary enzymes involved in the elimination of reactive oxygen species in plants are superoxide dismutase (SOD), peroxidase (POD), and catalase (CAT) [15]. Typically, SOD and CAT activities exhibit an initial increase followed by a subsequent decrease in response to high-temperature stress. This pattern has been observed in the context of high-temperature stress experienced by grapes and tomatoes [16,17]. It is widely accepted that while SOD can effectively eliminate O2 and mitigate membrane lipid peroxidation-induced harm to various cellular components, its protective efficacy is constrained. During the advanced stages of stress, when heat stress exceeds the limit that the plant can withstand, elevated temperatures can impair the enzyme’s active center, resulting in diminished enzyme activity through structural alterations or the inhibition of enzyme expression [3]. Nevertheless, it has been observed that SOD activity in rice leaves diminishes under conditions of high-temperature stress [18]. CAT and POD, being crucial enzymes for the decomposition of H2O2, exhibit potential specialization in terms of temperature and time intervals. Under conditions of high-temperature stress, plants display three predominant patterns in terms of POD activity alterations. Primarily, the activity of POD exhibits an initial increase, followed by a subsequent decrease. Yang et al. [19] suggest that the rapid production of O2 during high-temperature stress at 40 °C substantially augments POD activity in the leaves of tomato plants, reaching its maximum level after approximately 4 h of stress; this is subsequently followed by a rapid decline. Additionally, it is posited by [20] that extended exposure to elevated temperatures could potentially have detrimental effects on the structural integrity of POD, consequently leading to a decline in its enzymatic activity. This supposition finds indirect corroboration in the observed augmentation of malondialdehyde (MDA) levels. Furthermore, the POD activity in certain plant specimens exhibited an initial decrease followed by subsequent augmentation [21]. Lastly, high-temperature stress was found to induce a reduction in POD activity in certain plant species [22]. Therefore, the physiological and biochemical reactions in plants are different for different species, for different intensities of the high-temperature regime, and different durations of exposure.
The cell membrane system plays a crucial role in thermal damage and resistance [23]. According to Zhang et al. [24], the detrimental effects of high-temperature stress on plants, such as increased lipid permeability, are fundamental aspects of high-temperature-induced damage. The disruption of the equilibrium between the generation and elimination of reactive oxygen species (ROS) within cells due to high temperatures results in the accumulation of O2, hydroxyl radicals (·OH), MDA, and other oxides [25]. Consequently, alterations occur in the membrane proteins and intramembrane lipids, leading to heightened membrane permeability and the leakage of intracellular electrolytes, which are evident manifestations of high-temperature-induced damage [26]. The more serious the damage to the cell membrane, the weaker the thermal stability of the cell membrane. The robustness of cell membranes allows for the utilization of the conductivity method in assessing their thermal stability. In instances of elevated temperature stress, the relative electrical conductivity of plant leaves typically exhibits an upward trend, which corresponds to the duration and intensity of the stress. This observation suggests that plants possess a certain level of tolerance towards high temperatures; however, this heat resistance is not absolute, as heightened temperatures exacerbate membrane lipid peroxidation [27]. A consequential byproduct of this process is MDA, which is frequently employed as a significant marker of membrane lipid peroxidation. The MDA content of the majority of plants exhibited an upward trajectory in response to high-temperature stress. Soluble sugar, a crucial osmotic adjustment substance in plants, confers advantageous properties to plants, including resistance [28]. Typically, plants accumulate soluble sugars when confronted with high-temperature stress. The research conducted by [29] demonstrated that temperature stress leads to an accelerated degradation of macromolecules, particularly starch, in rice flag leaves. Kami et al. [30] conducted studies indicating that the soluble sugar content in winter squash mesocarp increases at high temperatures but subsequently decreases upon return to a normal temperature.
Based on prior research, we hypothesized that the application of non-lethal and diverse dynamic high-temperature exposures could result in varying levels of detrimental impacts on the photosynthetic physiological and biochemical attributes of NT leaves. Through a comprehensive assessment of the response exhibited by each parameter to elevated temperatures, we were able to quantitatively evaluate the extent of damage caused by distinct high-temperature conditions to NT plants. It is worth noting that no previous investigations have been conducted in this specific domain. Hence, the objective of this study was to investigate the impacts and disparities arising from exposure to elevated temperatures on the photosynthetic fluorescence parameters, as well as physiological and biochemical parameters, of NT leaves. Additionally, this study aimed to develop a graded index to holistically assess the extent of high-temperature-induced harm posed to NT plants.

2. Materials and Methods

2.1. Experimental Materials and Treatments

The experimental material utilized in this study consisted of 3-year-old NT potted seedlings, which were purchased from the National Southeast Mountain Germplasm Resource Garden. The pots used in the experiment had a height of 70 cm, with upper and lower diameters measuring 50 cm. The soil in the pots comprised loam soil, weighing approximately 8–10 kg. The soil exhibited a pH value of 6.63, an organic matter content of 17.75 g kg−1, a total nitrogen content of 0.97 g kg−1, a total phosphorus content of 1.82 g kg−1, and a total potassium content of 10.33 g kg−1. Throughout the whole experiment, the soil moisture content was maintained at 60% to 70% by timely and sufficient manual watering.
Healthy potted seedlings of uniform size and growth were chosen for the purpose of subjecting them to high-temperature stress treatment. Prior to this treatment, the seedlings were pre-cultured at a temperature of 28/18 °C for a duration of 10 d. Subsequently, the seedlings were transferred to an artificial climate chamber where they underwent varying degrees of high-temperature treatment. The temperature in the artificial climate chamber was set to dynamically vary depending on the daily fluctuation patterns observed in the data from the National Ground Meteorological Station in the Nanfeng Tangerine Production Area. The daily maximum and minimum temperature settings for the experiment were as follows: 32/22 °C, 35/25 °C, 38/28 °C, and 41/31 °C, with a temperature difference of 10 °C. The processing time for each treatment was 2, 4, 6, and 8 d, respectively. Throughout the experiment, the relative humidity of the artificial climate was maintained in a range of 65~70%. The photoperiod was set to 12 h of light, and the light intensity was set to 800 μmol m−2 s−1, followed by 12 h of darkness. The control treatment used a temperature setting of 28/18 °C, while all other conditions remained consistent with the high-temperature treatments. During the course of the experiment, a total of three repetitions were conducted for each treatment, with four plants being selected from each repetition. The leaves that were measured and analyzed were, specifically, the 8th to 12th healthy and mature functional leaves, starting from the top and moving downwards.

2.2. Determination of Photosynthetic Parameters

From 9:00 to 11:00 a.m., the light response curves of the NT leaves were measured using a portable photosynthesis system (LI-6400, Li-Cor Inc., Lincoln, NE, USA). The instrument flow rate was set to 500 μmol s−1, the relative humidity of the leaf chamber was set at 65%, and the concentration of CO2 was set at 390 μmol mol−1. The photosynthetically active radiation (PAR) was set to 1400, 1200, 1000, 800, 400, 200, 100, 80, 50, 30, and 0 μmol m−2 s−1, respectively. The Ye model was utilized to fit the light response curves to obtain the characteristic parameters, including the light compensation point (LCP), light saturation point (LSP), maximum net photosynthetic rate (Pmax), and apparent quantum efficiency (AQE) [31].

2.3. Determination of Chlorophyll Fluorescence Parameters

The chlorophyll fluorescence parameters were measured by using the PAM-2500 chlorophyll fluorometer (Heinz Walz GmbH, Effeltrich, Germany). The leaves used for measurement were the same as those used for the measured light response curve. The mesophyll part of the NT leaves was clamped using a leaf clamp and then adapted to darkness for 25 min before being exposed to a light intensity of 3500 μmol m−2 s−1. The instrument automatically recorded the non-photochemical quenching (NPQ), the actual photochemical efficiency of PSII in the light (ΦPSII), the electron transfer rate (ETR), and the PSII maximum photochemical efficiency (Fv/Fm) [32].

2.4. Determination of and Malondialdehyde Contents

Then, 0.2 g of healthy and mature NT leaves was weighed and subsequently ground evenly with 2 mL of 0.2 mol L−1 HCLO4. The resulting mixture was then centrifuged at a speed of 3000 g for 10 min at a temperature of 4 °C. The supernatant was neutralized to a pH of 7.5 by adding 4 mol L−1 KOH, and the OD values of the supernatant were measured at wavelengths of 530 nm and 515 nm using a ultraviolet spectrophotometer. These measurements were utilized to calculate the H2O2 content. Additionally, 0.5 g of healthy and mature NT leaves was weighed and ground evenly with 2 mL of 100 g L−1 TCA solution. The resulting mixture was then centrifuged at a speed of 4000 r min−1 for a duration of 20 min at a temperature of 4 °C. The supernatant obtained from this process was employed for the determination of the MDA content using the thiobarbituric acid (TBA) colorimetric method [33].

2.5. Determination of Osmoregulation Substances

The amounts of soluble sugar and soluble protein were determined according to the methods of Wang et al. [34], with minor modifications.
For the determination of soluble sugars, the youngest fully expanded leaf stored in liquid nitrogen was ground to a powder and stored at −80 °C until use. An equal weight of leaf powder (0.4 g) was homogenized in 50:50 ethanol/distilled water (ddH2O) (v/v), incubated at 80 °C for 45 min, and then centrifuged at 27,500 g for 20 min. One milliliter of the supernatant was evaporated to dryness in a stream of nitrogen. The residues were reconstituted in 30 g kg−1 mannitol solution (used as sampling and injection standards) and analyzed in an Alltech 10A-1000 column (Alltech Associates, Inc., Chicago, IL, USA) using high-pressure liquid chromatography (HPLC).
For the determination of soluble proteins, frozen leaves were ground in liquid nitrogen to a fine powder and suspended in a buffer containing 100 Mm of NaH2PO4/Na2HPO4 (pH 7.0), 1 mM of phenylmethylsulphonylfluoride, 1% (w/v) insoluble polyvinyl polypyrrolidone, and 1% (v/v) β-mercaptoethanol, and then centrifuged for 5 min at 9800 g. The soluble sugar concentration was determined using BSA as a standard.

2.6. Data Statistical Analysis Methods

The statistical analysis in this experiment was performed using IBM SPSS ® version 25 (IBM Corp., Chicago, IL, USA) to conduct Tukey multiple comparison tests (p < 0.05) and principal component analysis (PCA). The observed parameters were reported as mean ± standard deviation, and all figures in the article were generated using OriginPro 9.0 Software (Origin Lab, Northampton, MA, USA).
PCA is a dimensionality reduction algorithm that can convert multiple indicators into a few principal components. These principal components are linear combinations of the original variables and are not related to each other, reflecting most of the information in the original data [35,36]. The specific calculation process of principal components is as follows:
Given n samples (x1, x2,..., xn) of X, each with an m-dimensional variable, the matrix can be represented by Equation (1).
X = [ x 11 x 12 x 1 n x 11 x 11 x 2 n x m 1 x m 2 x m n ]
The covariance matrix of Equation (1) was computed and utilized to derive the corresponding correlation coefficient matrix. Subsequently, the eigenvalues of the correlation coefficient matrix were determined, with the condition that λ1λ2 ≥ … ≥ λm ≥ 0. The contribution rate of the i-th principal component can be expressed using Equation (2).
P i = λ i i = 1 m λ i
The cumulative contribution rate of the first q principal components is shown in Equation (3).
L q = i = 1 q P i
The expression of the principal component is shown in Equation (4). Fq represents the principal component; aq1aqm represents the score coefficient; and S1Sm represents the key indicator.
F q = a q 1 S 1 + a q 2 S 2 + + a q m S m

3. Results

3.1. Effect of Dynamic High Temperature on Photosynthetic Parameters in NT Leaves

Figure 1 illustrates the impact of different high temperatures and treatment durations on the photosynthetic parameters of NT leaves. After 2 d of high-temperature treatments, there was no difference observed between the Pmax at 32/22 °C and 35/25 °C and the control group; meanwhile, the Pmax at 38/28 °C and 41/31 °C was significantly lower than that of the control group. After 4 d of high-temperature treatment, with the exception of 32/22 °C, it was observed that the Pmax was significantly lower under other high temperatures compared to the control group. After 6 and 8 d of high-temperature treatment, the Pmax of each treatment group was found to be significantly lower than that of the control group. The variation patterns of LSP and AQE were consistent with that of Pmax, whereas the variation pattern of LCP was completely opposite.

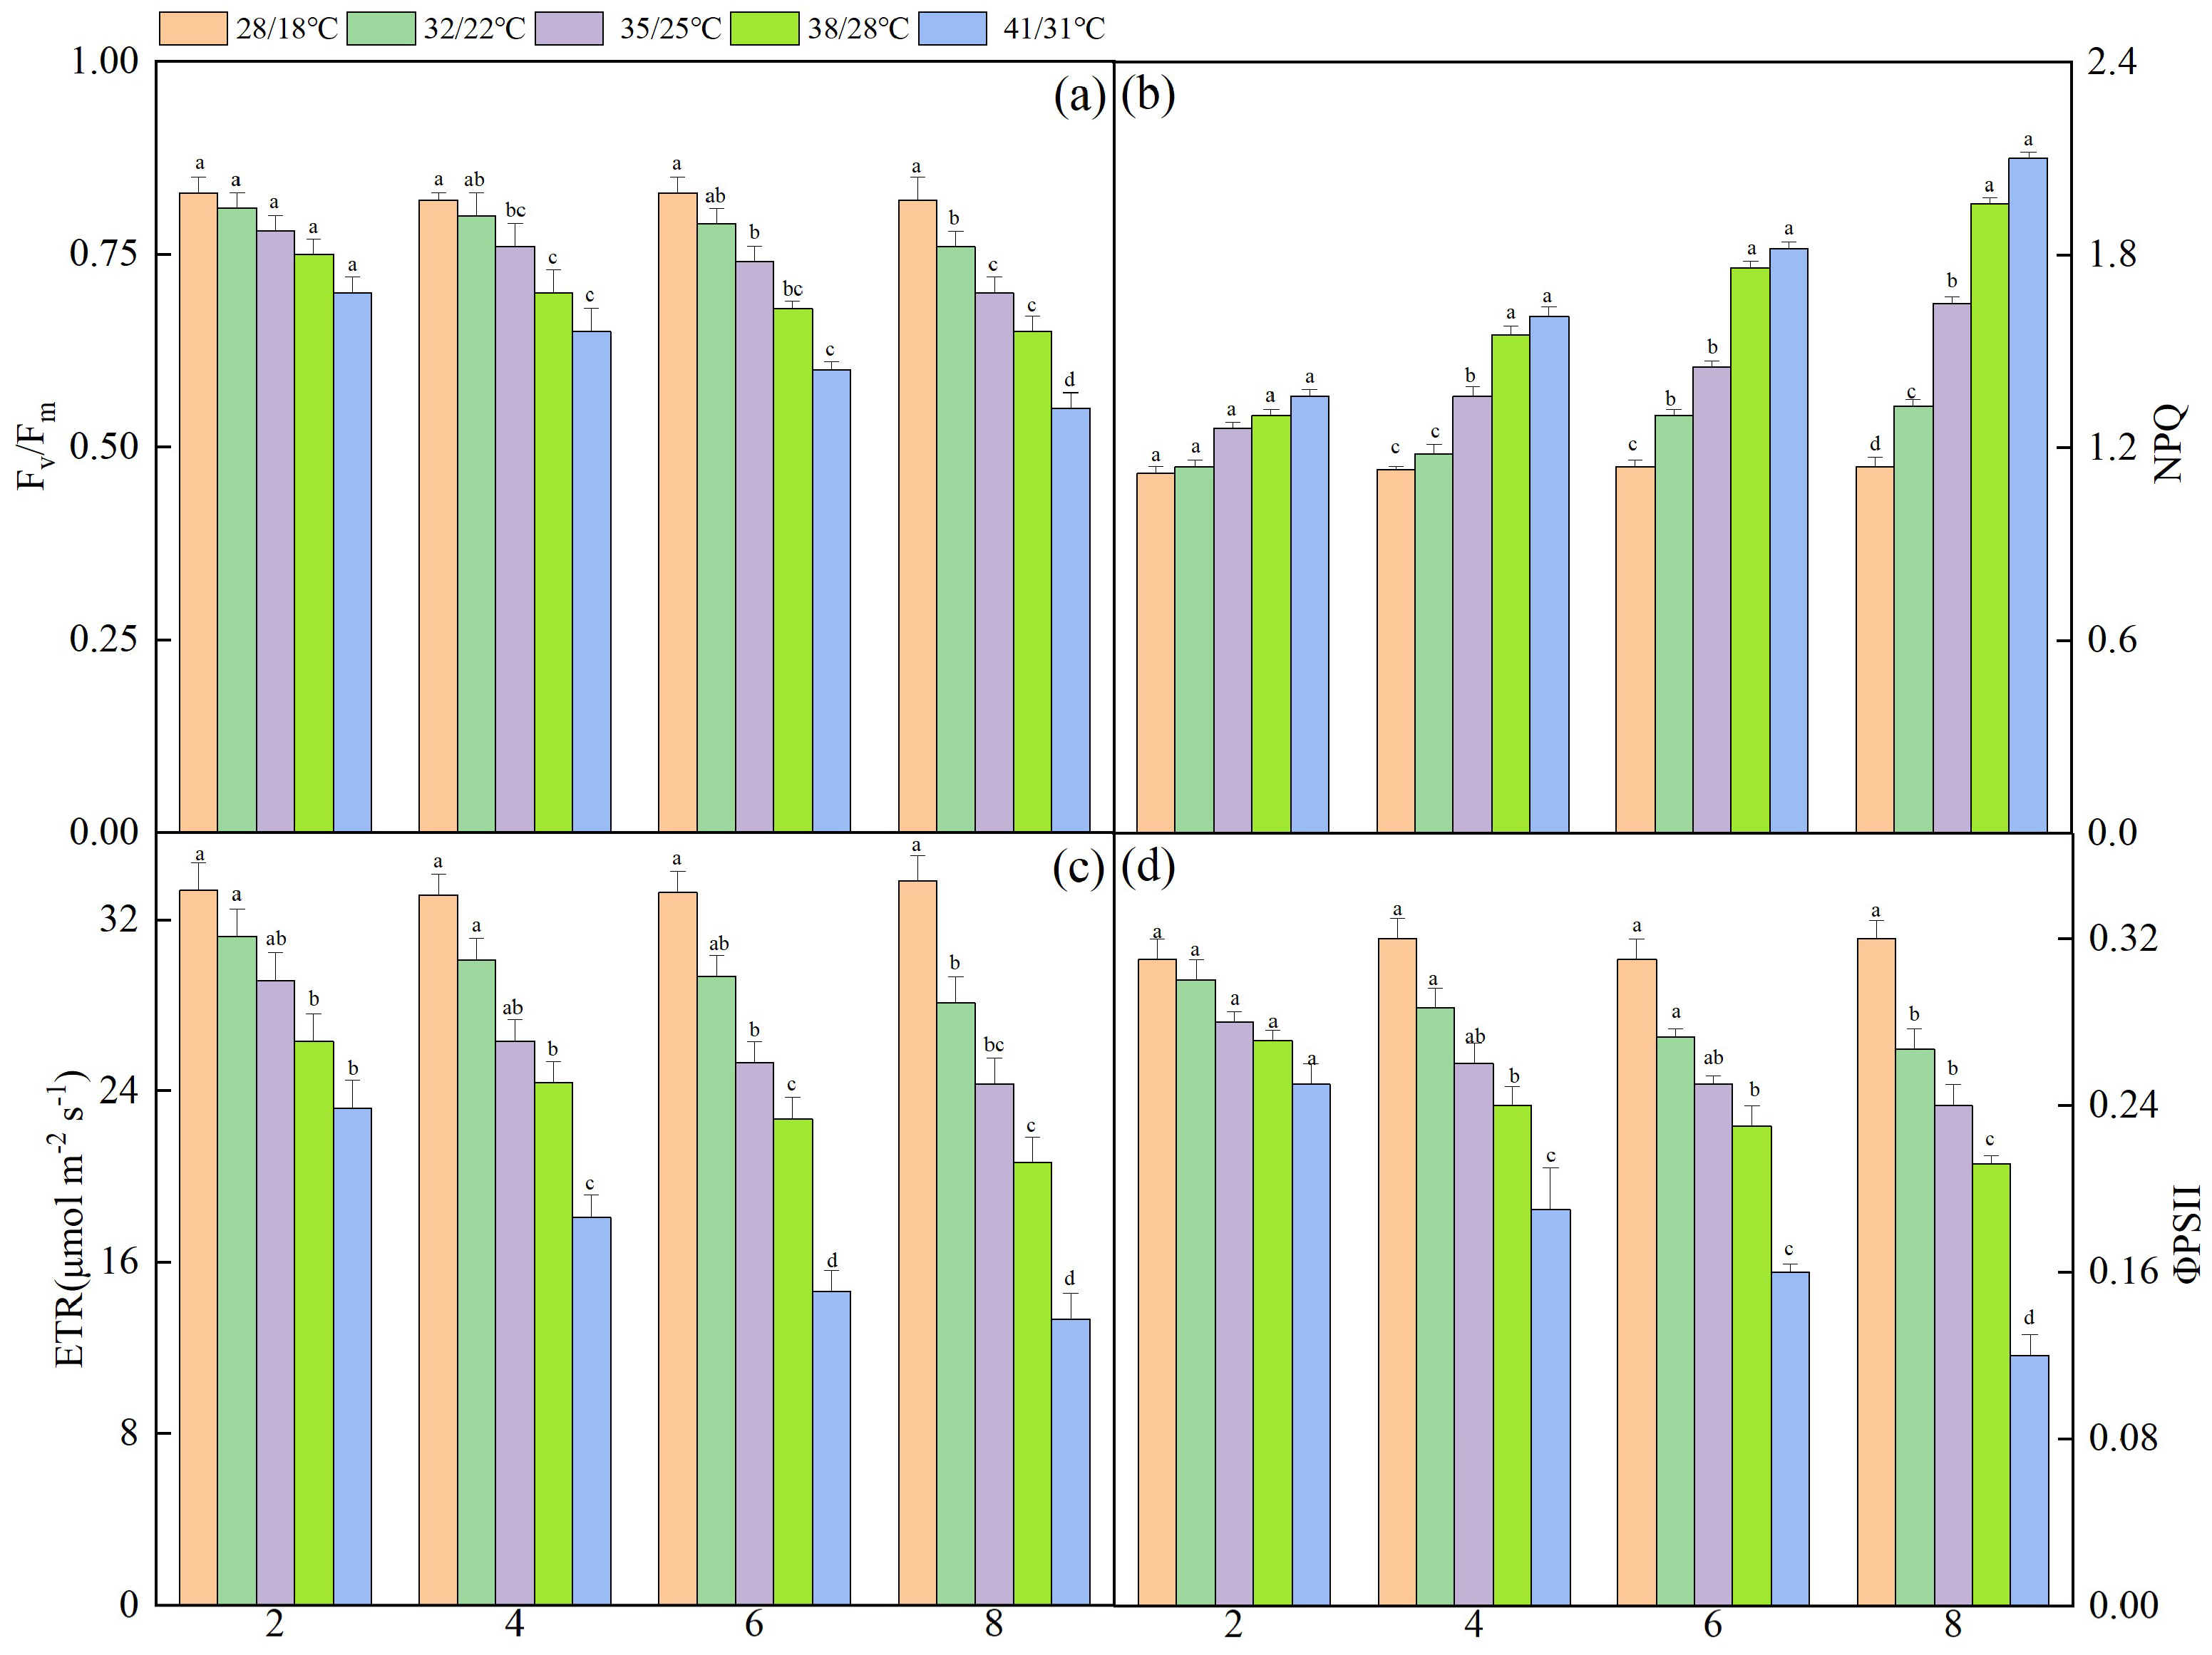
3.2. Effect of Dynamic High Temperatures on the Chlorophyll Fluorescence Parameters of NT Leaves

The changes in the chlorophyll parameters of NT leaves under various high temperatures and treatment durations are shown in Figure 2. After 2 d of high-temperature treatment, the Fv/Fm values exhibited a slight decrease at each temperature; however, the difference was not statistically significant when compared to the control. The Fv/Fm values at 32/22 °C, 35/25 °C, 38/28 °C, and 41/31 °C were significantly lower than the control group after treatment for 5 d and 8 d; meanwhile, the Fv/Fm values at 32 °C showed no significant difference from the control group. After 8 d of treatment, the Fv/Fm values at high temperatures reached their minimum and were significantly lower than the control group. Similarly, the variation patterns of ETR and ΦPSII were consistent with Fv/Fm, indicating that both the ETR and ΦPSII values decreased over time at the same high temperature, but also decreased as the temperature increased at the same treatment time. However, the variation pattern of NPQ was exactly opposite to Fv/Fm. Specifically, at the same high temperature, the NPQ value increased with the extension of the treatment time, while at a given treatment time, it increased with an increase in the temperature.

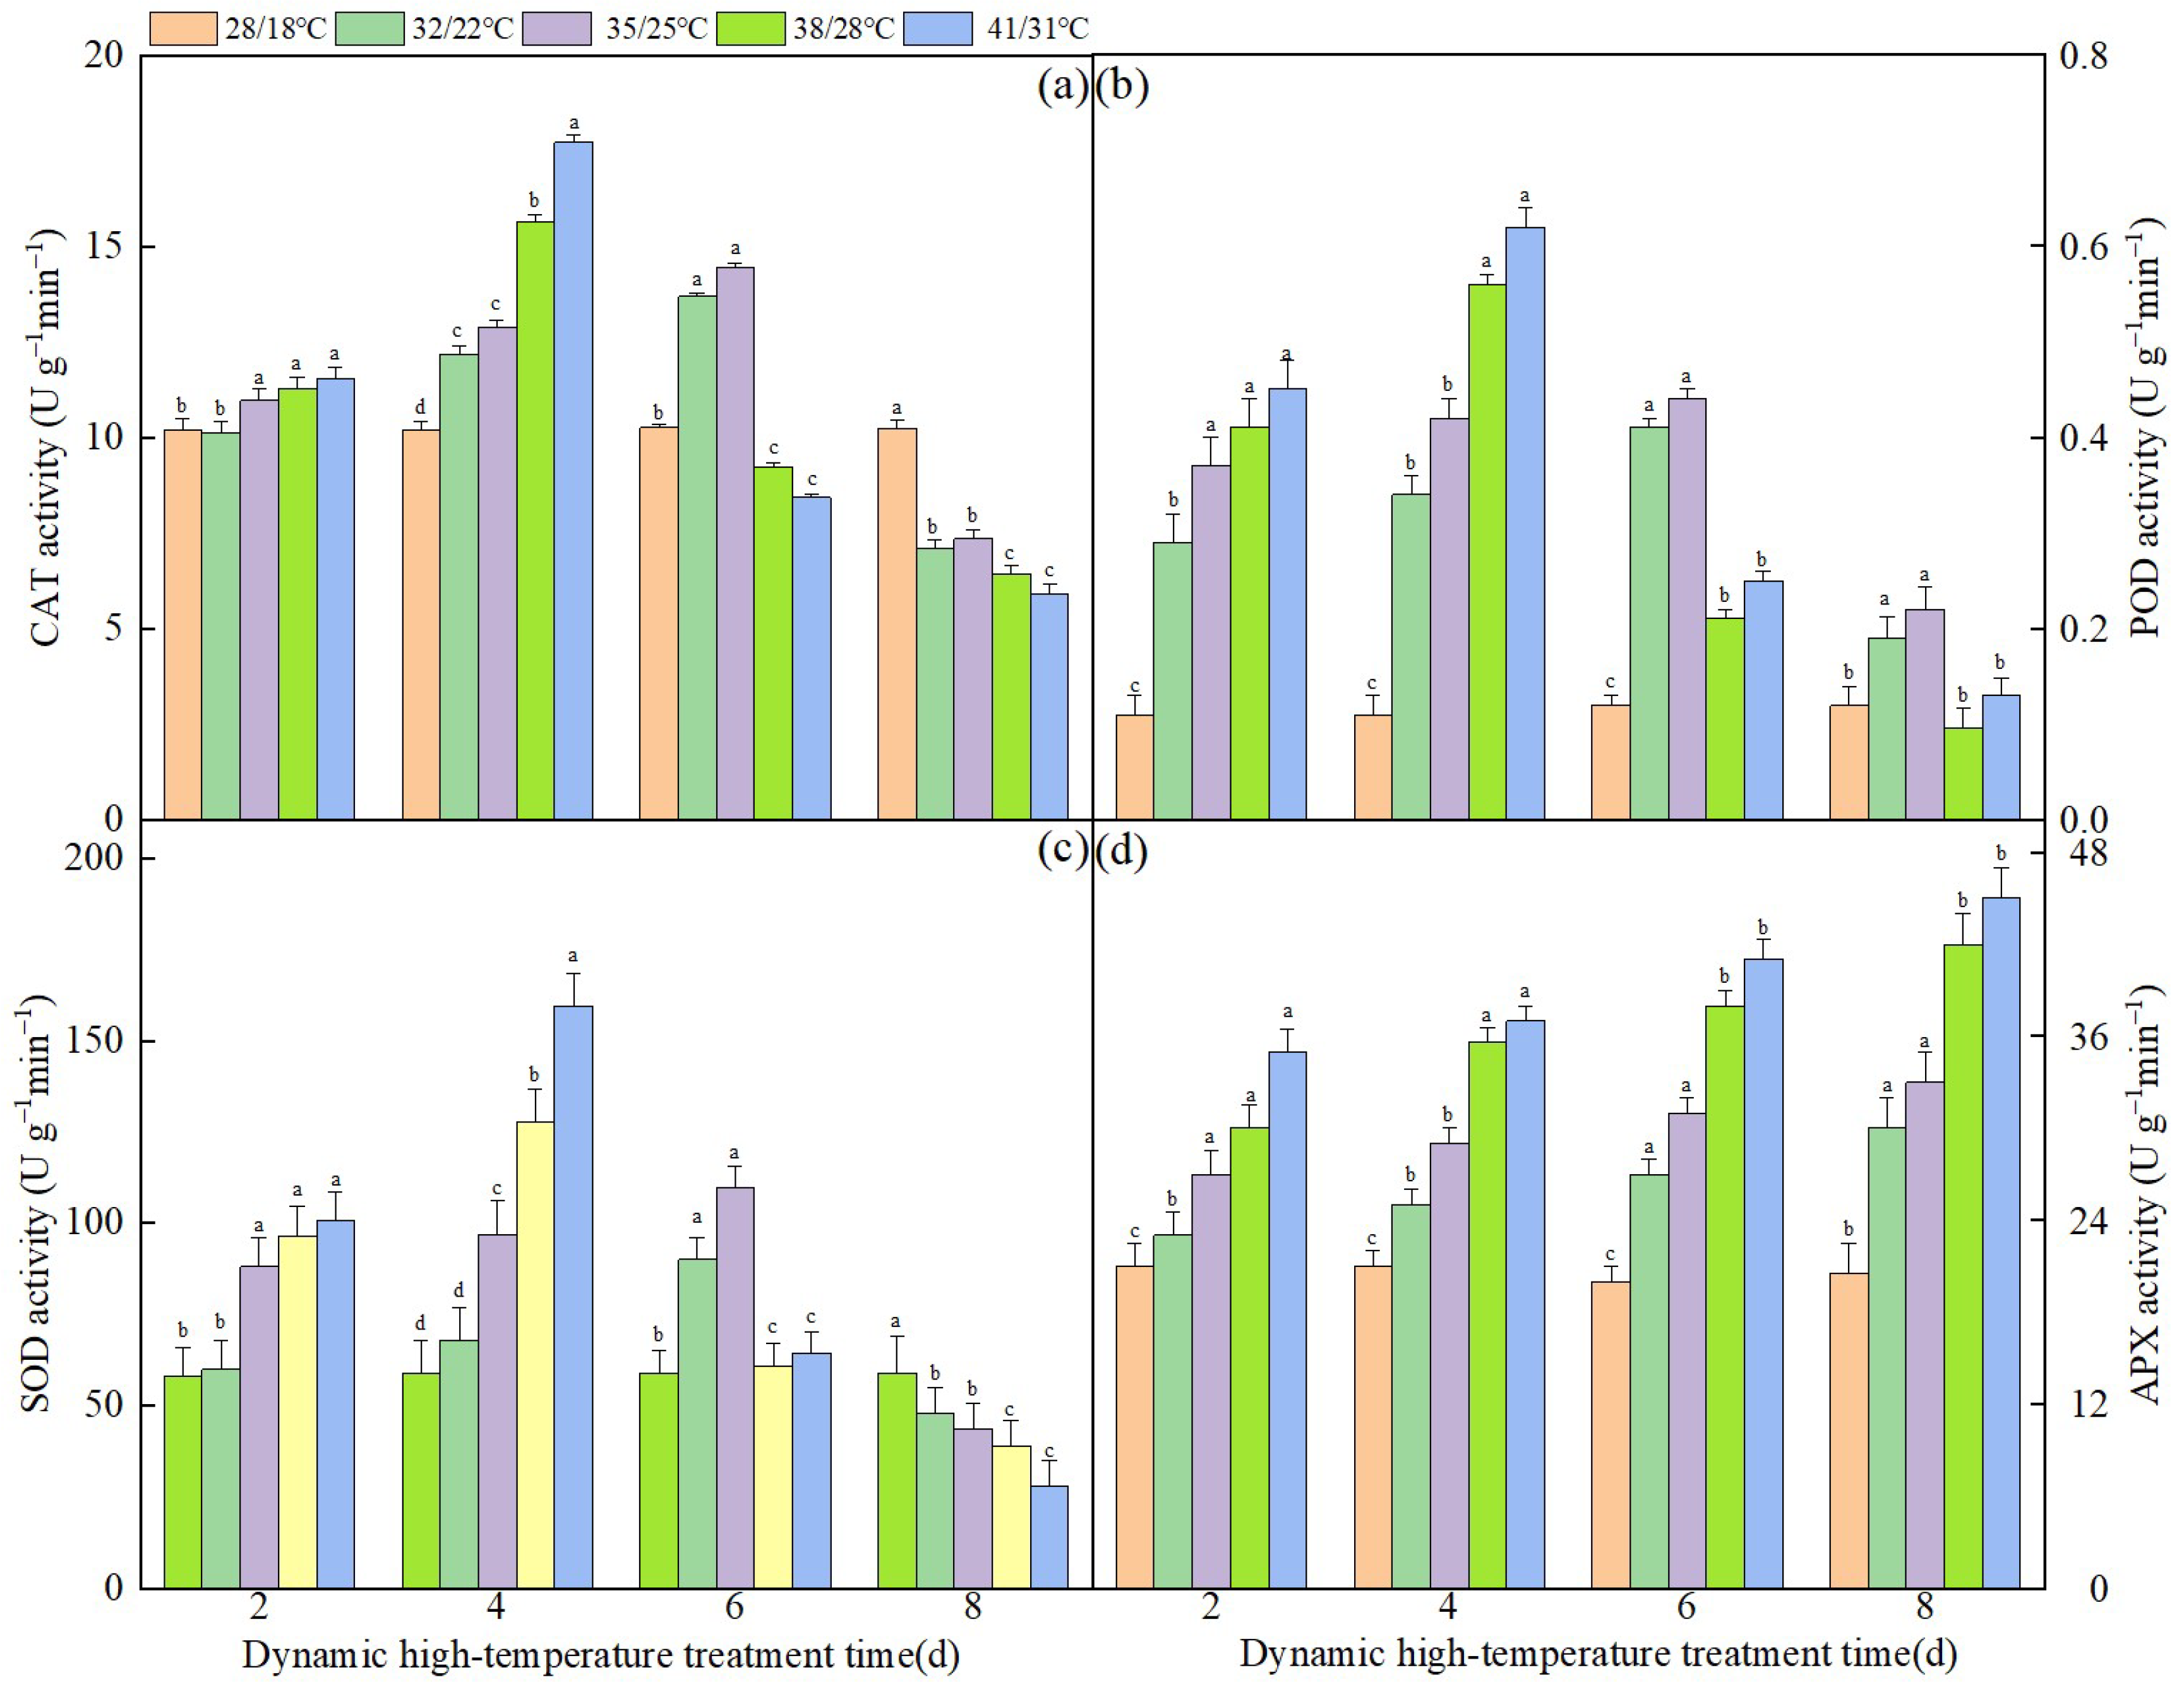
3.3. Effect of Dynamic High Temperature on the Activity of Antioxidant Enzymes in NT Leaves

The alterations in the activity levels of antioxidant enzymes in NT leaves under varying high temperatures and treatment durations are depicted in Figure 3. On the second day of exposure to high temperatures, a notable increase in CAT activity was observed in each high-temperature treatment group when compared to the control group. Notably, there was no significant disparity in the CAT activity between temperatures of 32 °C and 35 °C, as well as between temperatures of 38 °C and 41 °C. On the fifth day of exposure to elevated temperatures, the CAT activity in the treatment groups subjected to 38 °C and 41 °C reached its peak, exhibiting increases of 53% and 74% compared to the control group, respectively. By the eighth day of exposure to high temperatures, the CAT activity in the 38 °C and 41 °C treatment groups significantly declined in comparison to the control group. At this juncture, the CAT activity reached its maximum level in the treatment groups exposed to 32 °C and 35 °C, demonstrating increases of 33% and 41% relative to the control group, respectively. On the 8th day, the CAT activity of each high-temperature treatment group was significantly lower than that of the control. The variation patterns of SOD and POD were consistent with CAT. The observed pattern of APX variation can be described as follows: under identical high-temperature conditions, the APX levels increased in proportion to the duration of treatment, and under identical treatment durations, the APX levels increased in proportion to the rise in temperature.

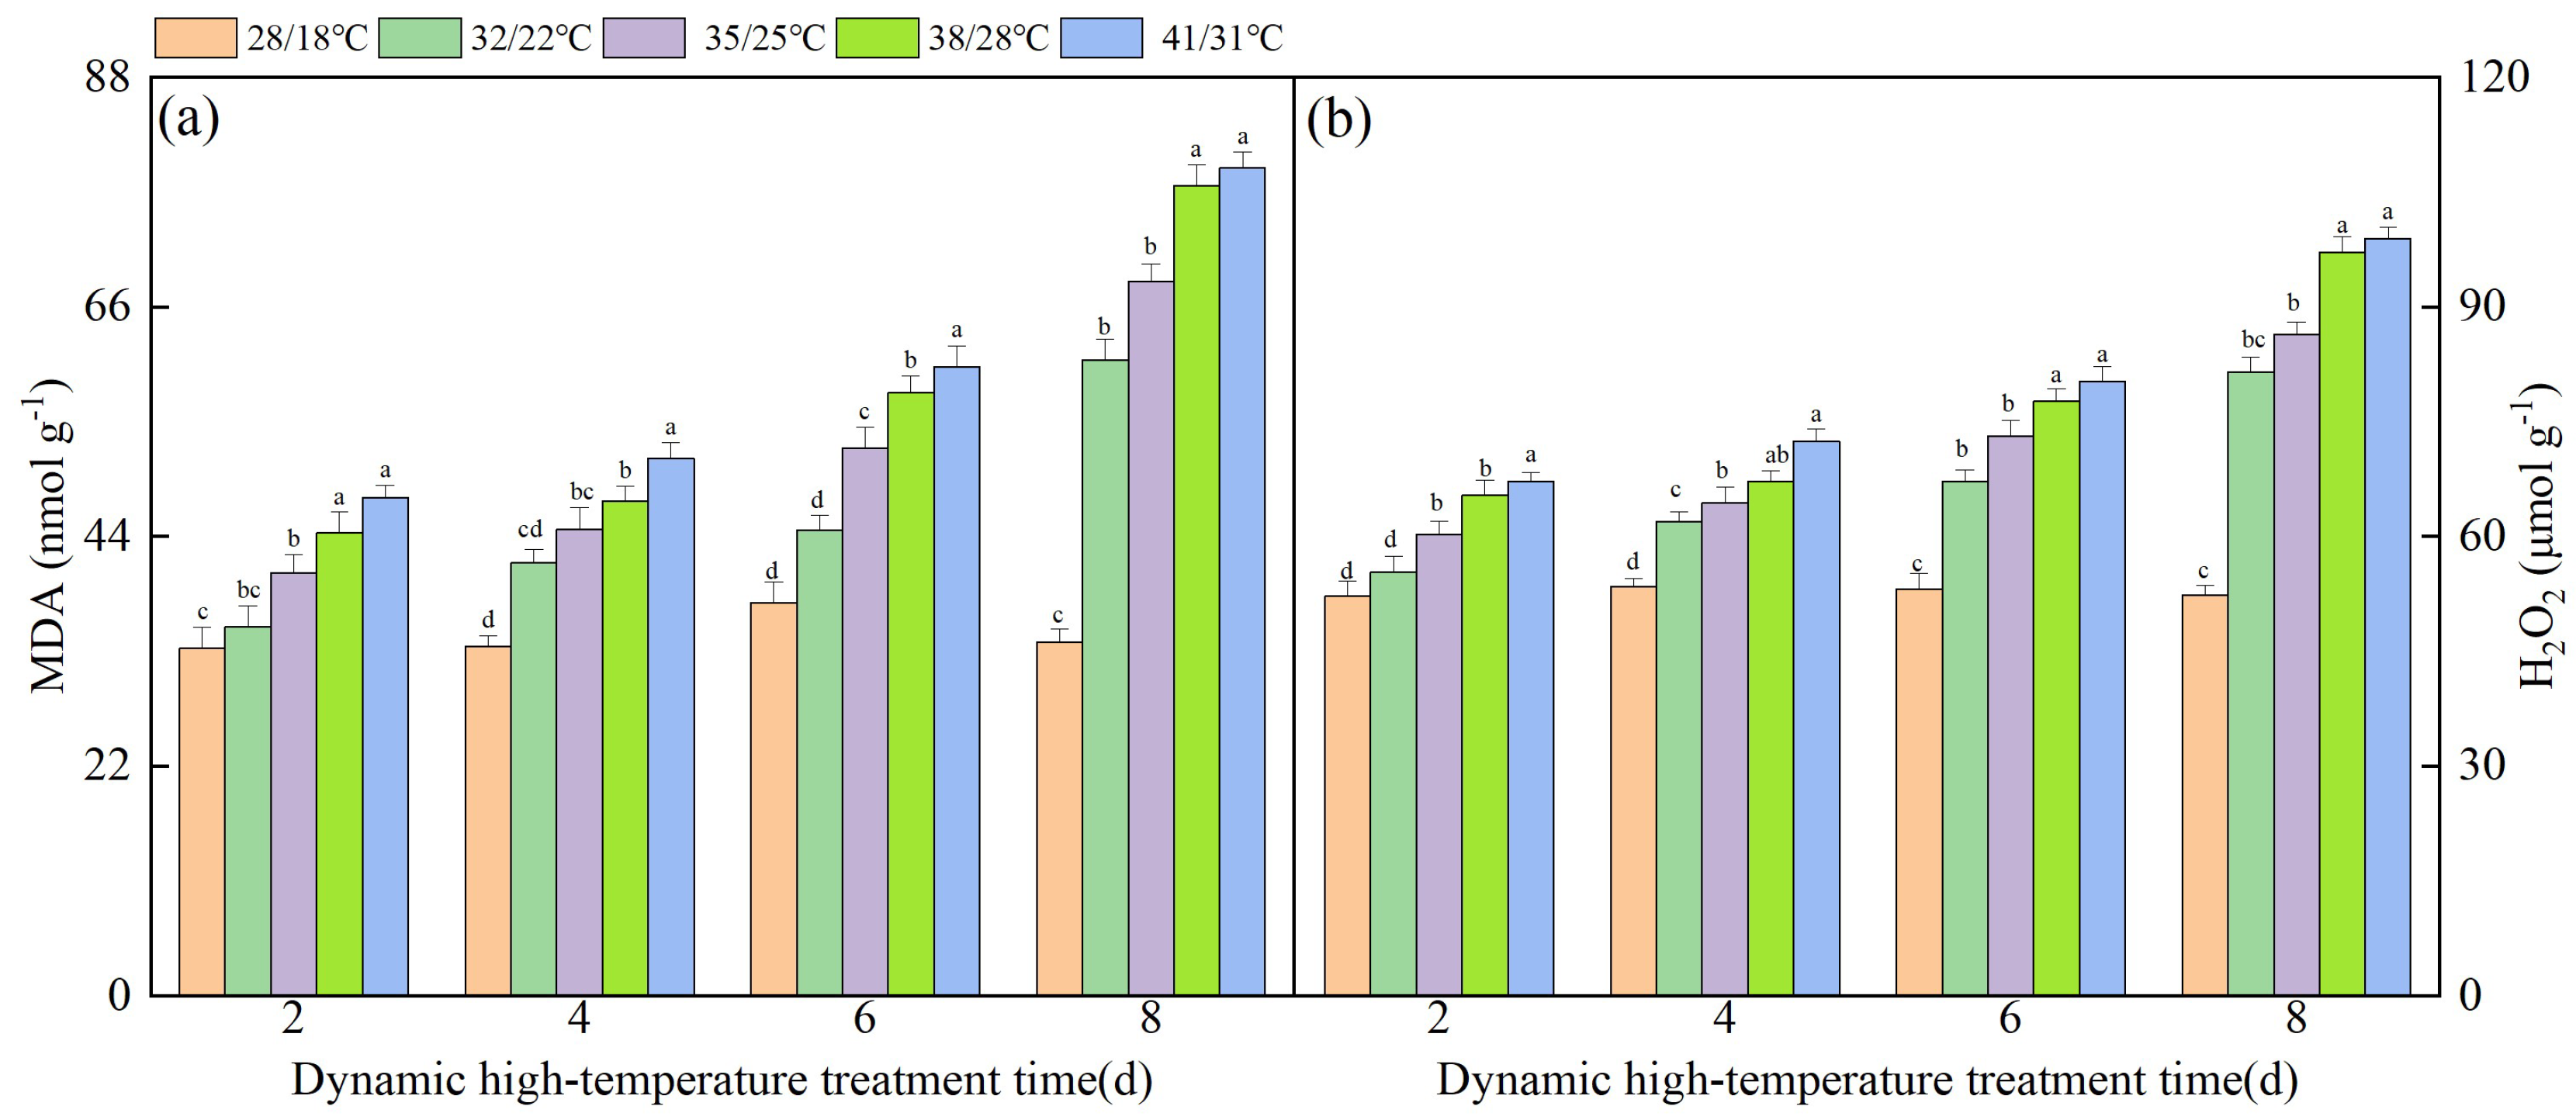
3.4. Effect of Dynamic High Temperature on Membrane Damage in NT Leaves

Figure 4 shows the alterations in the MDA and H2O2 content in NT leaves subjected to various high temperatures and treatment durations. Under the same high temperature, the MDA content exhibited an increasing trend as the treatment days extended. Compared to the control group, the MDA level significantly increased by 39.84% after 6 d of treatment at 32/22 °C. However, a difference was observed when the samples were subjected to 35/25 °C, 38/28 °C, and 41/41 °C for 4 d, where the MDA content increased by 33%, 43%, and 55%, respectively, in comparison to the control group. The trend in H2O2 content changes was similar to that of MDA. As the treatment time extended, the H2O2 content increased at the same high temperature. After 8 d of treatment, the H2O2 content increased by 29%, 36%, 51%, and 89% at temperatures of 32/22 °C, 35/25 °C, 38/28 °C, and 41/31 °C, respectively, compared to the control group. In summary, the impact of high temperatures on the content of MDA and H2O2 varies based on its degree. The higher the temperature, the longer the duration, and the more significant the increase in content.

3.5. Effect of Dynamic High Temperature on Osmotic Regulating Substances in NT Leaves

Figure 5a shows the alterations in the soluble sugars levels in NT leaves subjected to various temperatures and treatment durations. Due to the influence of high temperatures, the soluble sugar content in NT leaves first increased, but with a longer treatment time, the soluble sugar content decreased. After 6 days of high-temperature treatment, the soluble sugar content in the control group was about 17 mg g−1, while the soluble sugar content reached maximum values of 32, 36 and 41 mg g−1 at 35/25 °C, 38/28 °C and 41/31 °C, respectively, which were significantly higher than those of the control group. After 8 days of high-temperature treatment, the soluble sugar content at 32/22 °C, 35/25 °C, 38/28 °C and 41/31 °C decreased; these values were 28%, 24%, 24% and 23% lower than those at 6 days of treatment, respectively, but still significantly higher than those of the control group.
For soluble proteins, the changes in the soluble protein content and soluble sugar content in NT leaf cells at high temperatures were basically consistent, with an initial increase followed by a decrease (Figure 5b). After 6 days of high-temperature treatment, the soluble protein content reached a maximum, and the soluble protein content at 32/22 °C, 35/25 °C, 38/28 °C, and 41/31 °C increased by 31%, 27%, 27%, and 21%, respectively, compared to the control. After 8 days of high-temperature treatment, the soluble protein content was lower than that of day 6, but still higher than the control.

3.6. Determination of High Temperature Warning Indicators for Nanfeng Tangerine Plants

3.6.1. Extraction of Photosynthetic Physiological Characteristic Indices

To comprehensively assess the effects of elevated temperatures on NT plants, a PCA was conducted on 16 physiological and biochemical parameters (Pmax, LCP, LSP, AQE, NPQ, ΦPSII, ETR, Fv/Fm, SOD, CAT, POD, APX, H2O2, MDA, soluble sugar, soluble protein). This analysis aimed to minimize data redundancy and identify key indicators that reflect the photosynthetic physiological performance of the plants. Figure 6 shows the scores and loadings resulting from the PCA of the photosynthetic physiological parameters of NT plants exposed to high temperatures.
The cumulative contribution of PC1 and PC2 to the changes in photosynthetic parameters was as high as 98%, suggesting that they encompassed the majority of the original data’s variability. In comparison to the high-temperature treatment group, the overlap of the 95% confidence intervals for the photosynthetic parameters under control conditions (CK) was higher, indicating distinct levels of response among the photosynthetic parameters to varying high temperatures and durations. Notably, AQE, LSP, Pmax, ΦPSII, Fv/Fm, and ETR had significant positive contributions to PC1, with the highest loading values of Fv/Fm and Pmax, which were 0.38 and 0.38, respectively. On the other hand, LCP and NPQ had negative contributions to PC1. For PC2, LCP showed a significant loading of 0.57, which was significantly higher than the other photosynthetic parameters.
The combined influence of PC1 and PC2 on the alterations in biochemical parameters reached a substantial level of 97%. Notably, within this set of parameters, H2O2 and MDA exhibited the most pronounced loading values for PC1, specifically 0.47 and 0.48, respectively. Conversely, POD displayed the highest load value for PC2, amounting to 0.58, which significantly surpassed the load values of the other biochemical parameters.
Based on the above comprehensive analysis, we have identified the parameters that contribute the most to each PC1 and PC2, namely Fv/Fm, Pmax, LCP, H2O2, MDA and POD. These parameters were selected as the primary characteristic indices out of the total 18 variables. We then proceeded to analyze the feature parameters we had selected, with the aim of creating a comprehensive evaluation score for cold damage in the photosynthetic system of NT plants.

3.6.2. Calculation of High-Temperature Stress Index

The physiological and biochemical indicators (Fv/Fm, Pmax, LCP, H2O2, MDA, and POD) that were screened out were input into Equation (5) of the high-temperature stress index we established earlier. The stress index under different high temperatures and treatment times was calculated as shown in Table 1. The higher the value of HIS, the more severely the NT was affected under high-temperature stress.
H S I = ( Z A | A C K A | | A C K | + Z B | B C K B | | B C K | + Z C | C C K C | | C C K | + Z D | D C K D | | D C K | + Z E | E C K E | | E C K | + Z F | F C K F | | F C K | )
where HSI represents the high-temperature stress index, and ZA, ZB, ZC, ZD, ZE and ZF correspond to weights. ACK, BCK, CCK, DCK, ECK and FCK denote the values of Fv/Fm, Pmax, LCP, H2O2, MDA and POD in the control group, respectively. A, B, C, D, E, and F represent the values of Fv/Fm, Pmax, LCP, H2O2, MDA and POD under different high temperatures and treatment times, respectively.

3.6.3. Classification of High-Temperature Stress Level

In the practical application process of agricultural meteorological departments, a clear classification of disaster levels is the key to disaster assessment and risk prediction. Therefore, in this study, we analyzed the HSI of NT plants under different high temperatures and durations. We found that using “2” as a level threshold could significantly indicate the changes in the photosynthetic physiology of NT plants under different levels of high-temperature stress. Therefore, starting from an his score of 0, we divided the score into five levels, ranging from 0 to 4, with each level threshold set to 2, as shown in Table 2; this clearly delineated the level of high-temperature heat damage caused to NT plants.

4. Discussion

This study conducted an innovative analysis of the photosynthetic physiological activities of NT plants during their growth stage, examining the effects of varying high temperatures and durations of treatment on factors such as the photosynthetic capacity, photochemical reaction efficiency, antioxidant capacity, and osmotic condition ability of NT leaves. Through a thorough analysis of the data, a novel evaluation model grounded in the principles of photosynthetic physiology was developed to quantify the level of photosynthetic physiological stress experienced by NT plants due to high-temperature heat damage. This model has enabled the high-temperature hazard levels for NT plants to be classified, allowing the extent of damage inflicted by high levels of heat to be determined through the utilization of temperature data. These findings offer a scientific foundation for the NF planting department to implement preventative measures and assess the consequences of high-temperature disasters.
The photosynthetic parameters (Pmax, AQE, LCP, LSP) obtained by fitting the light response curve are important parameters that reflect the photosynthetic utilization capacity and photochemical efficiency of plants; they can also reflect the growth status and stress resistance strength of plants [37]. Different high temperatures and durations have a significant impact on the photosynthetic characteristics of plants. Pmax can reflect the ability of plants to utilize the CO2 concentration [38]. The findings of this study indicate a positive correlation between temperature and Pmax, with a gradual increase observed as the temperature rose, albeit with a decrease in the ability to utilize CO2 at higher temperatures. Additionally, an increase in duration at a constant temperature was found to weaken utilization ability. This phenomenon may be attributed to the adverse effects of elevated temperatures on the enzymatic reactions of photosynthetic-related enzymes in leaves, leading to constraints on carboxylation and the regeneration of Rubisco, ultimately inhibiting leaf photosynthesis [39,40]. The efficient utilization of light energy is crucial for the growth and development of plants. Photosynthetic parameters serve as indicators of plants’ light energy utilization rate and photosynthetic potential. Specifically, the parameters of LSP and LCP reflect plants’ ability to utilize light intensity [41]. The findings of this study demonstrate a decrease in LSP with prolonged exposure to high temperatures in each treatment, while conversely, LCP exhibited an increase. This observed trend may be attributed to the detrimental effects of high temperatures on plants’ photosynthetic organs, as well as the disruption of the structure and function of their photosynthetic systems [42,43], ultimately resulting in diminished light energy utilization and photosynthetic potential.
Chlorophyll fluorescence is closely related to the process of photosynthesis, and can economically, sensitively, quickly, and reliably analyze the impact of external environmental factors on the accumulation of plant photosynthetic products without causing damage to the leaves [44]. Chlorophyll fluorescence parameters reflect the distribution and dissipation of light energy in plants under stress conditions, as well as the damage caused to photosynthetic mechanisms, which have been widely used in heat resistance research [45]. Fv/Fm is the maximum photochemical efficiency of PSII, and can be used to measure the primary light energy conversion efficiency of leaves. Its value is relatively stable under non-stress conditions, ranging from 0.80 to 0.84, but significantly decreases under stress conditions [46]. Previous studies have shown that under high-temperature stress, the Fv/Fm value significantly decreases compared to the control, causing the inhibition of leaf photosynthesis and a decrease in dry matter accumulation [47]. This study found that the Fv/Fm value under high-temperature treatment was significantly lower than the control, indicating that sustained high temperatures can cause damage to the PSII reaction center; ΦPSII represents the quantum yield used for photosynthetic electron transfer, while ETR reflects the efficiency of electron transfer [48]. The Φ PSII and ETR significantly decreased under high-temperature conditions, indicating that high-temperature treatment also hindered the transfer of photosynthetic electrons. Under high-temperature stress, the PSII reaction center is damaged, electron transfer is hindered, and the energy entering the photochemical reaction is reduced, resulting in an excess of accumulated energy in PSII. Therefore, this part of the light energy needs to be cleared through the NPQ pathway to maintain normal cell function. Numerous studies have shown that under stress conditions such as high temperatures, low temperatures, and drought, NPQ significantly increases [49,50]. NPQ can be used to measure the degree to which plants are resistant to damage to the photosystem. The higher the NPQ value, the stronger the resistance to adverse photosystem damage from the outside world [51]. This study also implied that NPQ significantly increased under high-temperature treatment, and that the amplitude increased with the increase in treatment time. Under high-temperature treatment, the PSII of the photochemical reaction center in the NF leaves was damaged, and the capacity for light harvesting and conversion was weakened. Although the protective mechanism was improved and heat dissipation was enhanced, the actual photochemical efficiency was reduced. At this point, the amount of light absorbed by plants far exceeds the needs of photosynthesis, and the function of PSII decreases, leading to photoinhibition [46].
The antioxidant system in plants is an important barrier for resistance against stress, mainly including SOD, POD, and CAT, which play an important role in reducing membrane peroxidation and delaying plant aging [52]. In stressful environments, the antioxidant system in plants can clear reactive oxygen species (ROS) and reduce membrane peroxidation. When the antioxidant system cannot remove excess ROS, it can cause membrane peroxidation, leading to a large accumulation of ROS [53], which can affect the normal growth and development of plants and even cause plant death. This study showed that under high-temperature treatment, the activities of the SOD, POD, and CAT enzymes in NT leaves showed an initial increase followed by a decrease, and that the decrease in the antioxidant enzyme activity in leaves increased with the prolongation of the high-temperature treatment time. Hong et al. [33] found that high-temperature stress significantly reduces the activates of SOD, POD and CAT. There are also studies indicating that the antioxidant protection system (APX, SOD, CAT) and other enzyme activities in plant leaves show an upward trend under high-temperature stress [54]. Previous studies on the changes in antioxidant protection enzyme activity in leaves under high-temperature stress are inconsistent, possibly due to the different degrees and durations of high-temperature stress; this leads to inconsistent trends in the activity of antioxidant protection enzymes in leaves. In this study, the increase in antioxidant enzyme activity in the early stage of high-temperature stress may have been due to the stress response of the organism, which cleared the excess ROS in the plant body, reduced the degree of cell membrane peroxidation, and alleviated high-temperature stress. However, with the increase in the duration of the high-temperature treatment, the activity of the antioxidant enzymes was lost, and the dynamic balance function of the antioxidant system was disrupted, leading to a large accumulation of ROS. MDA is one of the membrane lipid peroxidation products, and its content reflects the degree of membrane lipid peroxidation, which is an important indicator for measuring crop stress resistance [55]. The results of this study showed that under high-temperature treatment, the MDA content showed an upward trend, and the upward trend accelerated with the extension of the treatment time. High-temperature treatment intensified the degree of membrane peroxidation in NT leaves, which was consistent with previous research results under high-temperature [56], drought [57] and other conditions. From the analysis of the chlorophyll fluorescence parameters, it can be seen that high temperatures inhibit electron transfer, causing a large accumulation of reactive oxygen species. However, high-temperature treatment reduced the activity of the antioxidant enzymes in leaves, and the ability to clear reactive oxygen species was insufficient. This led to a significant increase in the MDA content in leaves after high-temperature treatment. A large amount of accumulated MDA binds to protein molecules in cells, causing changes in the structure of protein molecules in cells; as a result, it affects the normal physiological function of cells and causes them to enter an aging state earlier [58], which further confirms the reason for the decrease in photosynthesis in NT leaves.
In challenging environmental conditions, both soluble sugars and soluble proteins play essential roles as energy reserves and osmotic regulators, mitigating the detrimental effects of stress on plant physiology [28]. The experimental results revealed a biphasic pattern in soluble sugar levels, potentially attributed to their early involvement in cellular osmotic regulation during high temperatures, thereby preserving the integrity and functionality of the cell membranes. However, as the duration of high-temperature stress increases, leaf photosynthesis weakens and respiration consumes more sugars, leading to a reduction in the soluble sugar content. Additionally, the soluble protein levels in this study exhibited a pattern of initial increase followed by decrease, potentially attributed to the heightened expression of Rubisco carboxylase and other enzymes, resulting in an elevated soluble protein content. However, as high temperatures intensify, the activity of Rubisco carboxylase diminishes, causing a decline in the net photosynthetic rate and soluble protein content.

5. Conclusions

Fv/Fm, Pmax, LCP, H2O2, MDA, and POD were identified as the key parameters for the evaluation of the impact of high-temperature stress on the photosynthetic physiological characteristics of NT plants. The high-temperature stress index was determined by six key parameters, and the high-temperature stress level of NT plants was categorized into five levels based on this index. Specifically, stress levels were assigned as follows: level 0 for 0 < HSI ≤ 2, level 1 for 2 < HSI ≤ 4, level 2 for 4 < HSI ≤ 6, level 3 for 6 < HSI ≤ 8, and level 4 for HSI > 8.

Author Contributions

Conceptualization, B.L., X.H. and Z.H.; Software, Y.T.; Formal analysis, Y.W.; Investigation, X.L.; Data curation, H.Y.; Writing—original draft, C.X.; Writing—review and editing, C.X.; Supervision, Z.H.; Project administration, Z.H.; Funding acquisition, C.X. All authors have read and agreed to the published version of the manuscript.

Funding

This work was supported by the project supported by Jiangxi Provincial Natural Science Foundation (20224BAB205051), the Earmarked Fund for the China Agriculture Research System (CARS-26), and the Earmarked Fund for Jiangxi Agriculture Research System (JXARS-07), the Breed Improvement Project of Nanfeng Tangrine (FZ-2022-8).

Data Availability Statement

The raw data supporting the conclusions of this article will be made available by the authors upon request.

Conflicts of Interest

The authors declare no conflicts of interest.

References

  1. Zheng, C.-S.; Lan, X.; Tan, Q.-L.; Zhang, Y.; Gui, H.-P.; Hu, C.-X. Soil application of calcium and magnesium fertilizer influences the fruit pulp mastication characteristics of Nanfeng tangerine (Citrus reticulata Blanco cv. Kinokuni). Sci. Hortic. 2015, 191, 121–126. [Google Scholar] [CrossRef]
  2. Qiu, X.; Yu, L.; Wang, W.; Yan, R.; Zhang, Z.; Yang, H.; Zhu, D.; Zhu, B. Comparative evaluation of microbiota dynamics and metabolites correlation between spontaneous and inoculated fermentations of Nanfeng tangerine Wine. Front. Microbiol. 2021, 12, 649978. [Google Scholar] [CrossRef]
  3. Chao, X.; Yuqing, T.; Xincheng, L.; Huidong, Y.; Yuting, W.; Zhongdong, H.; Xinlong, H.; Buchun, L.; Jing, S. Exogenous spermidine enhances the photosynthetic and antioxidant capacity of citrus seedlings under high temperature. Plant Signal. Behav. 2022, 17, 2086372. [Google Scholar] [CrossRef]
  4. Perkins-Kirkpatrick, S.E.; Lewis, S.C. Increasing trends in regional heatwaves. Nat. Commun. 2020, 11, 3357. [Google Scholar] [CrossRef]
  5. Tarvainen, L.; Wittemann, M.; Mujawamariya, M.; Manishimwe, A.; Zibera, E.; Ntirugulirwa, B.; Ract, C.; Manzi, O.J.L.; Andersson, M.X.; Spetea, C.; et al. Handling the heat—Photosynthetic thermal stress in tropical trees. New Phytol. 2022, 233, 236–250. [Google Scholar] [CrossRef]
  6. Masson-Delmotte, V.; Zhai, P.; Pirani, A.; Connors, S.L.; Péan, C.; Berger, S.; Caud, N.; Chen, Y.; Goldfarb, L.; Gomis, M.I.; et al. Contribution of working group I to the sixth assessment report of the intergovernmental panel on climate change. Clim. Chang. 2021, 3, 31. [Google Scholar]
  7. Le Quéré, C.; Jackson, R.B.; Jones, M.W.; Smith, A.J.P.; Abernethy, S.; Andrew, R.M.; De-Gol, A.J.; Willis, D.R.; Shan, Y.; Canadell, J.G.; et al. Temporary reduction in daily global CO2 emissions during the COVID-19 forced confinement. Nat. Clim. Chang. 2020, 10, 647–653. [Google Scholar] [CrossRef]
  8. Tollefson, J. IPCC climate report: Earth is warmer than it’s been in 125,000 years. Nature 2021, 596, 171–172. [Google Scholar] [CrossRef] [PubMed]
  9. Goraya, G.K.; Kaur, B.; Asthir, B.; Bala, S.; Kaur, G.; Farooq, M. Rapid injuries of high temperature in plants. J. Plant Biol. 2017, 60, 298–305. [Google Scholar] [CrossRef]
  10. Sharma, S. Heat stress effects in fruit crops: A review. Agric. Rev. 2020, 41, 73–78. [Google Scholar] [CrossRef]
  11. Maxwell, K.; Johnson, G.N. Chlorophyll fluorescence—A practical guide. J. Exp. Bot. 2000, 51, 659–668. [Google Scholar] [CrossRef]
  12. Ahmad, M.; Waraich, E.A.; Skalicky, M.; Hussain, S.; Zulfiqar, U.; Anjum, M.Z.; Rahman, M.H.U.; Brestic, M.; Ratnasekera, D.; Lamilla-Tamayo, L.; et al. Adaptation strategies to improve the resistance of oilseed crops to heat stress under a changing climate: An overview. Front. Plant Sci. 2021, 12, 767150. [Google Scholar] [CrossRef]
  13. Nievola, C.C.; Carvalho, C.P.; Carvalho, V.; Rodrigues, E. Rapid responses of plants to temperature changes. Temperature 2017, 4, 371–405. [Google Scholar] [CrossRef]
  14. Hassan, M.U.; Rasool, T.; Iqbal, C.; Arshad, A.; Abrar, M.M.; Habib-Ur-Rahman, M.; Noor, M.A.; Sher, A.; Fahad, S. Linking plants functioning to adaptive responses under heat stress conditions: A mechanistic review. J. Plant Growth Regul. 2021, 41, 2596–2613. [Google Scholar] [CrossRef]
  15. Mansoor, S.; Wani, O.A.; Lone, J.K.; Manhas, S.; Kour, N.; Alam, P.; Ahmad, A.; Ahmad, P. Reactive oxygen species in plants: From source to sink. Antioxidants 2022, 11, 225. [Google Scholar] [CrossRef] [PubMed]
  16. Goswami, A.K.; Maurya, N.K.; Goswami, S.; Bardhan, K.; Singh, S.K.; Prakash, J.; Pradhan, S.; Kumar, A.; Chinnusamy, V.; Kumar, P.; et al. Physio-biochemical and molecular stress regulators and their crosstalk for low-temperature stress responses in fruit crops: A review. Front. Plant Sci. 2022, 13, 1022167. [Google Scholar] [CrossRef] [PubMed]
  17. Awasthi, R.; Bhandari, K.; Nayyar, H. Temperature stress and redox homeostasis in agricultural crops. Front. Environ. Sci. 2015, 3, 11. [Google Scholar] [CrossRef]
  18. Zafar, S.A.; Hameed, A.; Ashraf, M.; Khan, A.S.; Qamar, Z.-U.; Li, X.; Siddique, K.H.M. Agronomic, physiological and molecular characterisation of rice mutants revealed the key role of reactive oxygen species and catalase in high-temperature stress tolerance. Funct. Plant Biol. 2020, 47, 440–453. [Google Scholar] [CrossRef] [PubMed]
  19. Yang, Z.; Xu, C.; Wang, M.; Zhao, H.; Zheng, Y.; Huang, H.; Vuguziga, F.; Umutoni, M. Enhancing the thermotolerance of tomato seedlings by heat shock treatment. Photosynthetica 2019, 57, 1184–1192. [Google Scholar] [CrossRef]
  20. Zhao, X.; Huang, L.-J.; Sun, X.-F.; Zhao, L.-L.; Wang, P.-C. Differential physiological, transcriptomic, and metabolomic responses of Paspalum wettsteinii under high-temperature stress. Front. Plant Sci. 2022, 13, 865608. [Google Scholar] [CrossRef] [PubMed]
  21. Kim, T.Y.; Ku, H.; Lee, S.-Y. Crop enhancement of cucumber plants under heat stress by shungite carbon. Int. J. Mol. Sci. 2020, 21, 4858. [Google Scholar] [CrossRef] [PubMed]
  22. Zhanassova, K.; Kurmanbayeva, A.; Gadilgereyeva, B.; Yermukhambetova, R.; Iksat, N.; Amanbayeva, U.; Bekturova, A.; Tleukulova, Z.; Omarov, R.; Masalimov, Z. ROS status and antioxidant enzyme activities in response to combined temperature and drought stresses in barley. Acta Physiol. Plant. 2021, 43, 114. [Google Scholar] [CrossRef]
  23. Medina, E.; Kim, S.-H.; Yun, M.; Choi, W.-G. Recapitulation of the function and role of ROS generated in response to heat stress in plants. Plants 2021, 10, 371. [Google Scholar] [CrossRef] [PubMed]
  24. Zhang, Y.; Yang, Z.; Wang, P.; Xu, C. Long-term high temperature stress decreases the photosynthetic capacity and induces irreversible damage in chrysanthemum seedlings. Hortic. Sci. 2023, 50, 159–173. [Google Scholar] [CrossRef]
  25. Swanson, S.; Gilroy, S. ROS in plant development. Physiol. Plant. 2010, 138, 384–392. [Google Scholar] [CrossRef]
  26. Pospíšil, P. Production of reactive oxygen species by photosystem II as a response to light and temperature stress. Front. Plant Sci. 2016, 7, 1950. [Google Scholar] [CrossRef] [PubMed]
  27. Djanaguiraman, M.; Boyle, D.L.; Welti, R.; Jagadish, S.V.K.; Prasad, P.V.V. Decreased photosynthetic rate under high temperature in wheat is due to lipid desaturation, oxidation, acylation, and damage of organelles. BMC Plant Biol. 2018, 18, 55. [Google Scholar] [CrossRef]
  28. Afzal, S.; Chaudhary, N.; Singh, N.K. Role of soluble sugars in metabolism and sensing under abiotic stress. In Plant Growth Regulators: Signalling under Stress Conditions; Springer: Berlin/Heidelberg, Germany, 2021; pp. 305–334. [Google Scholar]
  29. Chen, J.; Tang, L.; Shi, P.; Yang, B.; Sun, T.; Cao, W.; Zhu, Y. Effects of short-term high temperature on grain quality and starch granules of rice (Oryza sativa L.) at post-anthesis stage. Protoplasma 2017, 254, 935–943. [Google Scholar] [CrossRef]
  30. Kami, D.; Muro, T.; Sugiyama, K. Changes in starch and soluble sugar concentrations in winter squash mesocarp during storage at different temperatures. Sci. Hortic. 2011, 127, 444–446. [Google Scholar] [CrossRef]
  31. Ye, Z.P.; Suggett, D.J.; Robakowski, P.; Kang, H.J. A mechanistic model for the photosynthesis–light response based on the photosynthetic electron transport of photosystem II in C3 and C4 species. New Phytol. 2013, 199, 110–120. [Google Scholar] [CrossRef]
  32. Baruah, U.; Das, S.; Kalita, P.; Saikia, M.; Bhougal, S.; Pal, S.; Das, R. High-Night Temperature-Induced Changes in Chlorophyll Fluorescence, Gas Exchange, and Leaf Anatomy Determine Grain Yield in Rice Varieties. J. Plant Growth Regul. 2023, 42, 5538–5557. [Google Scholar] [CrossRef]
  33. Hong, E.; Xia, X.; Ji, W.; Li, T.; Xu, X.; Chen, J.; Chen, X.; Zhu, X. Effects of High Temperature Stress on the Physiological and Biochemical Characteristics of Paeonia ostii. Int. J. Mol. Sci. 2023, 24, 11180. [Google Scholar] [CrossRef] [PubMed]
  34. Wang, B.; Chen, J.; Chen, L.; Wang, X.; Wang, R.; Ma, L.; Peng, S.; Luo, J.; Chen, Y. Combined drought and heat stress in Camellia oleifera cultivars: Leaf characteristics, soluble sugar and protein contents, and Rubisco gene expression. Trees 2015, 29, 1483–1492. [Google Scholar] [CrossRef]
  35. Hasan, B.M.S.; Abdulazeez, A.M. A review of principal component analysis algorithm for dimensionality reduction. J. Soft Comput. Data Min. 2021, 2, 20–30. [Google Scholar] [CrossRef]
  36. Kherif, F.; Latypova, A. Principal Component Analysis, in Machine Learning; Elsevier: Amsterdam, The Netherlands, 2020; pp. 209–225. [Google Scholar]
  37. Ma, X.; Liu, Q.; Zhang, Z.; Zhang, Z.; Zhou, Z.; Jiang, Y.; Huang, X. Effects of photosynthetic models on the calculation results of photosynthetic response parameters in young Larix principis-rupprechtii Mayr. plantation. PLoS ONE 2021, 16, e0261683. [Google Scholar] [CrossRef]
  38. Albert, K.R.; Mikkelsen, T.N.; Michelsen, A.; Ro-Poulsen, H.; van der Linden, L. Interactive effects of drought, elevated CO2 and warming on photosynthetic capacity and photosystem performance in temperate heath plants. J. Plant Physiol. 2011, 168, 1550–1561. [Google Scholar] [CrossRef]
  39. Jahan, M.S.; Guo, S.; Sun, J.; Shu, S.; Wang, Y.; El-Yazied, A.A.; Alabdallah, N.M.; Hikal, M.; Mohamed, M.H.; Ibrahim, M.F.; et al. Melatonin-mediated photosynthetic performance of tomato seedlings under high-temperature stress. Plant Physiol. Biochem. 2021, 167, 309–320. [Google Scholar] [CrossRef]
  40. Yuan, L.; Yuan, Y.; Liu, S.; Wang, J.; Zhu, S.; Chen, G.; Hou, J.; Wang, C. Influence of high temperature on photosynthesis, antioxidative capacity of chloroplast, and carbon assimilation among heat-tolerant and heat-susceptible genotypes of nonheading Chinese cabbage. HortScience 2017, 52, 1464–1470. [Google Scholar] [CrossRef]
  41. Zhou, J.; Li, P.; Wang, J. Effects of light intensity and temperature on the photosynthesis characteristics and yield of lettuce. Horticulturae 2022, 8, 178. [Google Scholar] [CrossRef]
  42. Sharma, A.; Kumar, V.; Shahzad, B.; Ramakrishnan, M.; Sidhu, G.P.S.; Bali, A.S.; Handa, N.; Kapoor, D.; Yadav, P.; Khanna, K.; et al. Photosynthetic response of plants under different abiotic stresses: A review. J. Plant Growth Regul. 2020, 39, 509–531. [Google Scholar] [CrossRef]
  43. Anjana Jajoo, A.J.; Allakhverdiev, S.I. High-temperature stress in plants: Consequences and strategies for protecting photosynthetic machinery. In Plant Stress Physiology; CABI: Wallingford, UK, 2017; pp. 138–154. [Google Scholar]
  44. Murchie, E.H.; Lawson, T. Chlorophyll fluorescence analysis: A guide to good practice and understanding some new applications. J. Exp. Bot. 2013, 64, 3983–3998. [Google Scholar] [CrossRef]
  45. Sherstneva, O.; Khlopkov, A.; Gromova, E.; Yudina, L.; Vetrova, Y.; Pecherina, A.; Kuznetsova, D.; Krutova, E.; Sukhov, V.; Vodeneev, V.; et al. Analysis of chlorophyll fluorescence parameters as predictors of biomass accumulation and tolerance to heat and drought stress of wheat (Triticum aestivum) plants. Funct. Plant Biol. 2021, 49, 155–169. [Google Scholar] [CrossRef] [PubMed]
  46. Lu, T.; Meng, Z.; Zhang, G.; Qi, M.; Sun, Z.; Liu, Y.; Li, T. Sub-high temperature and high light intensity induced irreversible inhibition on photosynthesis system of tomato plant (Solanum lycopersicum L.). Front. Plant Sci. 2017, 8, 365. [Google Scholar] [CrossRef]
  47. Poudyal, D.; Rosenqvist, E.; Ottosen, C.-O. Phenotyping from lab to field—Tomato lines screened for heat stress using Fv/Fm maintain high fruit yield during thermal stress in the field. Funct. Plant Biol. 2019, 46, 44–55. [Google Scholar] [CrossRef]
  48. Liu, K.; Jing, T.; Wang, Y.; Ai, X.; Bi, H. Melatonin delays leaf senescence and improves cucumber yield by modulating chlorophyll degradation and photoinhibition of PSII and PSI. Environ. Exp. Bot. 2022, 200, 104915. [Google Scholar] [CrossRef]
  49. Velitchkova, M.; Popova, A.V.; Faik, A.; Gerganova, M.; Ivanov, A.G. Low temperature and high light dependent dynamic photoprotective strategies in Arabidopsis thaliana. Physiol. Plant. 2020, 170, 93–108. [Google Scholar] [CrossRef] [PubMed]
  50. Jin, H.; Zou, J.; Li, L.; Bai, X.; Zhu, T.; Li, J.; Xu, B.; Wang, Z. Physiological responses of yellow-horn seedlings to high temperatures under drought condition. Plant Biotechnol. Rep. 2019, 14, 111–120. [Google Scholar] [CrossRef]
  51. Janka, E.; Körner, O.; Rosenqvist, E.; Ottosen, C.-O. Using the quantum yields of photosystem II and the rate of net photosynthesis to monitor high irradiance and temperature stress in chrysanthemum (Dendranthema grandiflora). Plant Physiol. Biochem. 2015, 90, 14–22. [Google Scholar] [CrossRef]
  52. Sachdev, S.; Ansari, S.A.; Ansari, M.I.; Fujita, M.; Hasanuzzaman, M. Abiotic stress and reactive oxygen species: Generation, signaling, and defense mechanisms. Antioxidants 2021, 10, 277. [Google Scholar] [CrossRef]
  53. Dumanović, J.; Nepovimova, E.; Natić, M.; Kuča, K.; Jaćević, V. The significance of reactive oxygen species and antioxidant defense system in plants: A concise overview. Front. Plant Sci. 2021, 11, 552969. [Google Scholar] [CrossRef]
  54. Ali, M.B.; Hahn, E.-J.; Paek, K.-Y. Effects of temperature on oxidative stress defense systems, lipid peroxidation and lipoxygenase activity in Phalaenopsis. Plant Physiol. Biochem. 2005, 43, 213–223. [Google Scholar] [CrossRef] [PubMed]
  55. Savicka, M.; Škute, N. Effects of high temperature on malondialdehyde content, superoxide production and growth changes in wheat seedlings (Triticum aestivum L.). Ekologija 2010, 56, 26–33. [Google Scholar] [CrossRef]
  56. Yin, H.; Chen, Q.; Yi, M. Effects of short-term heat stress on oxidative damage and responses of antioxidant system in Lilium longiflorum. Plant Growth Regul. 2008, 54, 45–54. [Google Scholar] [CrossRef]
  57. Soleimanzadeh; Soleimanzadeh, H.; Habibi, D.; Ardakani, M.; Paknejad, F.; Rejali, F. Effect of potassium levels on antioxidant enzymes and malondialdehyde content under drought stress in sunflower (Helianthus annuus L.). Am. J. Agric. Biol. Sci. 2010, 5, 56–61. [Google Scholar] [CrossRef]
  58. Li, Y.; Xu, W.; Ren, B.; Zhao, B.; Zhang, J.; Liu, P.; Zhang, Z. High temperature reduces photosynthesis in maize leaves by damaging chloroplast ultrastructure and photosystem II. J. Agron. Crop Sci. 2020, 206, 548–564. [Google Scholar] [CrossRef]
Figure 1. The effect of different high temperatures and treatment durations on the photosynthetic parameters of NT leaves: Panel (ad) represent the maximum photosynthetic rate (Pmax), light compensation point (LSP), light saturation point (LCP), and apparent quantum efficiency (AQE) of NT plants under different high temperatures and treatment durations, respectively. The data in the figure are the average value of three replicated samples. Under the same high-temperature treatment time, different lowercase letters indicate significant differences at p < 0.05.
Agronomy 14 00648 g001
Figure 2. The effect of different high temperatures and treatment durations on the chlorophyll fluorescence parameters of NT leaves: Panel (ad) represent the PSII maximum photochemical efficiency (Fv/Fm), non-photochemical quenching (NPQ), electron transfer rate (LCP), and apparent quantum efficiency (ETR) and actual photochemical efficiency of PSII (ΦPSII) of NT plants under different high temperatures and treatment durations, respectively. The data in the figure are the average value of three replicated samples. Under the same high-temperature treatment time, different lowercase letters indicate significant differences at p < 0.05.
Agronomy 14 00648 g002
Figure 3. The effect of different high temperatures and treatment durations on the activity of antioxidant enzymes in NT leaves: Panel (ad) represent the catalase (CAT), peroxidase (POD), superoxide dismutase (SOD), and ascorbate peroxidase (APX) of NT plants under different high temperatures and treatment durations, respectively. Under the same high-temperature treatment time, different lowercase letters indicate significant differences at p < 0.05.
Agronomy 14 00648 g003
Figure 4. The effect of different high temperatures and treatment durations on the content of malondialdehyde and hydrogen peroxide in NT leaves: Panel (a,b) represent the content in Malonaldehyde (MDA) and hydrogen peroxide (H2O2) of NT plants under different high temperatures and treatment durations, respectively. Note. The data in the figure are the average value of three replicated samples. Under the same high-temperature treatment time, different lowercase letters indicate significant differences at p < 0.05.
Agronomy 14 00648 g004
Figure 5. The effect of different high temperatures and treatment durations on the content of soluble sugars and soluble protein in NT leaves: Panel (a,b) represent the content in soluble sugar and soluble protein of NT plants under different high temperatures and treatment durations, respectively. Note. The data in the figure are the average value of three replicated samples. Different letters indicate significant differences among different treatments at p < 0.05.
Agronomy 14 00648 g005
Figure 6. The results of the principal component analysis of the photosynthetic and biochemical parameters are presented in Panel (a,b), depicting the effects of various high temperatures and treatment durations. The PCA scores of each temperature treatment group are represented by the same color as the corresponding 95% confidence ellipse.
Agronomy 14 00648 g006
Table 1. The values of HIS under different high temperatures and durations.
TreatmentHigh-Temperature Stress Index
Daily Maximum Temperature/
Daily Minimum Temperature
2d4d6d8d
28/18 °C 0000
32/22 °C1.091.873.214.51
35/25 °C1.972.864.775.98
38/28 °C4.695.416.988.11
41/31 °C6.588.1210.9911.34
Table 2. Classification of degree of high-temperature-induced injury.
High-Temperature Stress IndexThe Level of High-Temperature Stress
0 < HSI ≤ 2Level 0
2 < HSI ≤ 4Level 1
4 < HSI ≤ 6Level 2
6 < HSI ≤ 8Level 3
8 < HSILevel 4
Disclaimer/Publisher’s Note: The statements, opinions and data contained in all publications are solely those of the individual author(s) and contributor(s) and not of MDPI and/or the editor(s). MDPI and/or the editor(s) disclaim responsibility for any injury to people or property resulting from any ideas, methods, instructions or products referred to in the content.

