Abstract
Extreme weather events, including drought, have occurred worldwide with increasing frequency and severity in recent years. Drought stress is the main limiting factor for agricultural development in many regions, including tobacco—an important economic crop and a model plant for scientific research. As it is adapted to the tropics, tobacco is highly susceptible to drought stress, with resultant decreases in yield and quality. Glycine betaine (GB) is an osmoregulatory substance that can enhance plant resistance to various abiotic stresses. Here, we investigate the protective mechanism of genetically engineered glycine betaine (GB) on tobacco photosynthesis under drought stress induced by 30% PEG-6000. This study used transgenic tobacco (T) accumulating GB and wild-type tobacco (WT) to investigate the protective effects conferred by the genetic engineering of GB synthesis on tobacco photosynthesis under drought stress (induced by 30% PEG-6000). The results showed that the net photosynthetic rate of the tobacco plants significantly decreased under drought stress, and the degree of decrease was significantly lower in the T line than in the WT line. GB accumulation improved the resistance of photosynthesis to drought stress. Furthermore, under drought stress, the photosynthesis improvement in the T line was related to the accumulation of GB, leading to maintenance of the water status, the promotion of osmotic regulation, and an enhancement in antioxidant enzyme activities, which reduced membrane peroxidation and thereby increased the thylakoid membrane’s protein content and function, especially the photosystem II (PSII) function. The results provide a theoretical basis for further research on genetic engineering related to GB synthesis and the field application of exogenous GB.
1. Introduction
Tobacco (Nicotiana tabacum) originated in the tropics and is an important economic and commercial crop from which the leaves are the harvest materials. It is widely cultivated in over 120 countries worldwide [,,,]. Tobacco is also a model plant for biological research [] and an important plant bioreactor [,,]. The entire growth period of tobacco requires a large amount of water, and its growth and development are easily affected by drought stress [,], which leads to a decrease in yield and quality [,,]. It is necessary and practical to study the drought resistance and drought resistance mechanism of tobacco.
With global warming and the accompanying increase in the frequency of abnormal weather, drought stress has become increasingly severe in recent years [,]. Drought affects plants’ growth, development, and physiological and biochemical metabolic processes at various stages and is an important limiting factor for plant survival and growth []. Drought stress can disrupt plants’ physiological and biochemical processes, including their cell membrane structure, key enzyme activities, the accumulation and synthesis of reactive oxygen species (ROS), stomatal regulation, and other gas exchange characteristics [,,]. Southwestern China is the primary tobacco-producing region in China. Its terrain and land forms are complex and diverse, and the distribution of precipitation is extremely uneven. This region frequently experiences spring drought disasters, and seasonal drought has become the main problem limiting tobacco production in the region []. Therefore, seeking methods to improve tobacco drought resistance and studying tobacco drought resistance and its mechanisms are of great significance to China’s tobacco industry.
During drought stress, plants form a series of defense mechanisms to resist its adverse effects, of which the accumulation of osmotic regulatory substances is one important mechanism [,]. Glycine betaine (N, N′, N″-trimethyl glycine; GB) is an important osmotic regulator. It is a quaternary ammonium compound that accumulates in various organisms adapted to arid or high-salt environments, and can enhance plant tolerance to various abiotic stresses [,,]. However, tobacco cannot synthesize GB by itself and GB can be accumulated in the tobacco by the genetic engineering of the GB synthase gene, so the stress resistance of tobacco can thus be effectively improved [,,]. This study used a transgenic tobacco line carrying the spinach betaine aldehyde dehydrogenase (BADH) gene to explore the maintenance and protective mechanism of GB on crop photosynthesis under drought stress. The results help to reveal the role of GB in crop drought resistance, elucidate GB’s osmotic and non-osmotic functions, deepen our understanding of GB, provide ideas for further research on promoting the development of the tobacco industry by improving its stress resistance, and provide a theoretical basis for the field application of GB.
2. Materials and Methods
2.1. Plant Materials and Stress Treatments
The experiments were conducted with two K326 tobacco lines: a transgenic line (T) that overexpressed the BADH gene and a wild-type line (WT) that did not synthesize GB. The T line was generated by introducing a vector plasmid encoding the BADH gene cloned from spinach. The plasmid also contained the promoter for the 35S ribosomal RNA gene of the cauliflower mosaic virus (CaMV35S), the sequence encoding the transit peptide of the small subunit of Rubisco in tobacco, and the terminator of the gene for nopaline synthase (NOS), as described previously [].
The seeds of both the T and WT lines were disinfected with HgCl2 and cultured in a plastic tray containing a special seedling medium. At the four-leaf stage, the plants were planted into individual plastic pots (height = 8 cm, diameter = 10 cm) containing quartzite. The plants were cultivated in a controlled growth chamber at a temperature of 25 °C ± 1 °C and relative humidity of 70–75%, with a 14 h photoperiod and an irradiance of 300 μmol m−2 s−1. A 50% Hoagland nutrient solution was irrigated to the seedlings daily. When the seventh leaf was fully expanded, the plants were divided into two groups: one group was treated with 30% (w/v) PEG-6000 (osmotic potential = −1.88 MPa, best pre-test) for 4 days, with the 30% PEG-6000 solution (equivalent to moderate soil drought; <30% PEG-6000, the impact is not significant, >30 PEG-6000, severe wilting for WT and T plants) applied twice a day at 6 a.m. and 6 p.m. until the relative water content (RWC) of the sixth leaf decreased to between 83.0% and 86.0% (4 days, too short, the impact is not significant, and too long, severe wilting for WT plants), whereas the other group of plants continued to be cultured with the 50% Hoagland nutrient solution for 4 days (0% PEG-6000). After the treatments, 9 plants with uniform and consistent growth were selected from each group for experimental measurement and sampling (3 technical replicates with 9 biological replicates).
2.2. GB Extraction and Quantification
The GB content was determined by high-performance liquid chromatography (HPLC) (LC-6A; Shimadzu Corp., Kyoto, Japan) according to a previously described procedure by Gorham et al. [], with some modifications. A total of 0.5 g of the frozen samples was ground in a 2 mL mixture of methanol: chloroform: 0.2 mM KHCO3 (12:5:1), after which, the mortar was washed twice with the same mixture. The homogenates were shaken at 60 °C for 20 min and centrifuged for 10 min at 10,000× g and 4 °C. The pellet was extracted with the same mixture, and then with a methanol/water mixture (1:1). The supernatant was collected and mixed with 2 mL of chloroform and 4 mL of distilled water. The mixture was shaken and then centrifuged for 10 min at 10,000× g and 4 °C. The upper aqueous phase was then passed through the columns of Amberlite CG250 cation (1 mL) and Dowex1-X2 anion (2 mL) exchange resins. The exchange resins were eluted with 3 mL of distilled water and 4 mL of 4 mM NH4OH. The dried eluate was dissolved in 2 mL of methanol and filtered through a 0.25 μm membrane filter before introduction into the HPLC system. A Hypersil SCX 10 μm column (4.6 × 250 mm) was used, and the mobile phase was 0.2 mM NH4H2PO4 in 50% methanol. The GB concentration was detected with a UV detector at 195 nm, and quantification was performed by comparing the peak surface areas with those obtained with pure GB (Sigma, St. Louis, MO, USA) standards.
2.3. Chlorophyll and Carotenoid Contents
The chlorophyll (Chl) and carotenoid (Car) contents were quantified according to the methods described by Arnon [], with some modifications. First, an equal amount of fresh tobacco leaves (0.1 g) was put into 10 mL of 80% acetone and placed in the dark for 48 h, which was accompanied with shaking several times during this period. Then, the absorbance (A) of the extraction solution was measured at 663, 646, and 470 nm with a UV/visible spectrophotometer (UV-2550, Shimadzu, Kyoto, Japan). The concentrations of Chl a, Chl b, and Car in the extraction solution were calculated according to Formulas (1)–(3). In these formulas, Ca, Cb, and Cx·c represent the concentrations of Chl a, Chl b, and Car in mg/L, respectively.
Ca = 12.21A663 − 2.81A646
Cb = 20.13A646 − 5.03A663
Cx·c = (1000A470 − 3.27Ca − 104Cb)/229
After obtaining the concentration of each pigment, its content in mg/g was calculated according to Formula (4).
Chloroplast pigment content (mg/g) = concentration of pigment (mg/L) × extract volume (mL) × dilution
times/1000/sample fresh weight(g)
times/1000/sample fresh weight(g)
2.4. Analysis of Photosynthetic Parameters
Measurements of the net photosynthetic rate (Pn), stomatal conductance (Gs), transpiration rate (Tr), intercellular CO2 concentration (Ci), apparent quantum yield (AQY), and carboxylation efficiency of photosynthesis (CE) were carried out with the sixth fully expanded attached leaves using a portable infrared gas analyzer (Ciras-2; PP Systems, Norfolk, UK) according to the methods described by Farquhar and Shakey []. The Pn was recorded at a CO2 concentration of 360 μL L−1, a temperature of 25 °C, a relative humidity of 80%, and a saturating light of 800 μmol m−2 s−1.
To determine the apparent quantum yield (AQY), we first measured the Pn-PPFD (photosynthetic photon flux density) response curve. The Pn-PPFD was also measured by using a portable infrared gas analyzer Ciras-2. The CO2 and air temperature in the leaf chamber were maintained at 360 μmol mol−1 and 25 °C, respectively. The PPFD started at 1400 μmol m−2 s−1 and decreased stepwise to 50 μmol m−2 s−1. The apparent quantum yield (AQY) was calculated from the initial slopes by linear regression using PPFD values below 200 μmol m−2 s−1.
The Pn response to CO2 was measured at saturating PPFD by step changes in CO2 concentrations. Different CO2 concentrations were generated inside the leaf chamber by using a CO2 regulator (Ciras-2, PP Systems, Norfolk, UK). The CE was the initial slope obtained via the linear regression of the data below 250 ppm CO2 in the Pn-CO2 reaction curve.
2.5. Chlorophyll a Fluorescence Analysis
Photosystem II (PSII) Chlorophyll (Chl) fluorescence measurements were performed using an FMS-2 portable pulse-modulated fluorometer (Hansatech, UK). The minimum fluorescence level (Fo) with all PSII reaction centers open was measured by modulating the light to be sufficiently low (<0.1 μmol m−2 s −1), so as to not induce any significant variable fluorescence; the maximum fluorescence level (Fm) with all PSII reaction centers closed was determined with a 0.8 s saturating pulse at 4000 μmol m−2 s −1 in leaves that had been dark-adapted for 20 min; and Fv/Fm = (Fm − Fo)/Fm []. Next, the actinic radiation (300 μmol·m−2·s−1 PPFD, which was equivalent to the growth PPFD of tobacco seedling plants in the growth chamber) was turned on after the fluorescence signal leveled off. The steady-state fluorescence (Fs) was thereafter recorded, and a second saturating pulse at 4000 μmol·m−2·s−1 was imposed to determine the light-adapted maximum fluorescence (Fm′). Then, the actinic radiation was removed and the minimum fluorescence in the light-adapted state (Fo′) was determined by irradiating the leaf segment for 2 s with infrared radiation. Finally, the excitation energy capture efficiency (Fv′/Fm′), the actual PSII efficiency under irradiance (ΦPSII), and the degree of reaction center opening (qP) were calculated according to the following formulas: Fv′/Fm′ = (Fm′ − Fo′)/Fm′; ΦPSII = (Fm′ − Fs)/Fm′; and qP = (Fm′ − Fs)/(Fm′ − Fo′) [].
2.6. Analysis of OJIP Chlorophyll (Chl) a Fluorescence Induction Transients Using the JIP Test
Polyphasic fluorescence transients (OJIP) were measured using a plant efficiency analyzer (Hansatech Ltd., Norfolk, UK) with an excitation light intensity of 3000 μmol m−2 s−1, according to the method described by Strasser [,]. All samples were adapted to the dark for 20 min. Fluorescence transients were recorded during a 60 s light pulse provided by an array of six light-emitting diodes. Fluorescence was detected using a PIN photodiode after passing through a long-pass filter. All fluorescence transients were recorded within a time span ranging from 10 μs to 1 s with a data acquisition speed of 105 points per s for the first 2 ms and a speed of 1000 points per s after 2 ms. The fluorescence signal at 50 μs was considered as the true Fo, since the fluorescence yield at this time was shown to be independent of the light intensity.
Chlorophyll fluorescence transients (OJIP) were analyzed according to the JIP test by the method described in the references [,,], using the following original data: (1) the fluorescence intensity at 50 μs considered as Fo; (2) the maximum fluorescence intensity Fm, where Fp can be satisfactorily described by Fm; and (3) the fluorescence intensities at 300 μs (K step), 2 ms (J step), and 30 ms (I step). Throughout the JIP test, the following parameters were calculated: WK = (Fk − Fo)/(Fj − Fo) = Vk/Vj, indicating the injury degree of oxygen-evolving complex (OEC); Sm = (area)/(Fm − Fo), indicating electron transporters on the receptor side; N = Sm/SS, Ss = Mo (1/Vj), indicating the number of times QA is restored; ψEo = (area)/(Fm − Fo), indicating the quantum yield for electron transfer (at t = 0); RC/CSm = Fm × φPo × Vj/Mo, indicating the number of active reaction centers per unit area; and PIabs = RC/ABS × [φPo/(1 − φPo)] × [φo/(1 − φo)], indicating the comprehensive index of photosynthetic performance.
2.7. Measurement of the Water Status of Tobacco Leaves
The relative water content (RWC) of the leaves was determined by using the drying and weighing method described by Weatherley []. The RWC was calculated from (FW–DW)/(SFW–DW) × 100%, where FW is the fresh weight, SFW is the water-saturated fresh weight, and DW is the dry weight after oven-drying the samples at 80 °C for 48 h.
The leaf water potential (ψw) was measured with an HR-33 T dew point microvoltmeter (Wescor Inc., Logan, UT, USA) after equilibration in the chamber for 2.5 h. The osmotic adjustment (OA) was determined using a vapor pressure osmometer (5520; Wescor Inc., Logan, UT, USA). The leaf osmotic potential (ψs) and osmotic potential at full turgor (ψs100) were determined using a vapor pressure osmometer. To measure the osmotic potential at full turgor (ψs100, RWC = 100%), the tissues were rehydrated with deionized water for 6–8 h at 4 °C in the dark. The OA was calculated as the difference of ψs100 between the 0% PEG-6000-stressed (ψsc100) and 30%PEG-6000-stressed (ψψss100) treatments:
OA (MPa) = ψsc100 − ψss100
2.8. Determination of Soluble Protein, Free Proline, and Soluble Sugar Contents
The soluble protein content was determined using the Coomassie brilliant blue (CBB) method described by Marion and Bradford []. The free proline content was measured using the ninhydrin method described by Bates []. The soluble sugar content was determined colorimetrically using phenolsulphuric acid, as described by Tissue and Wright [].
2.9. Measurement of Ion Leakage and Malondialdehyde Levels
The ion leakage level from the cellular membrane was determined via conductivity measurements, as previously described by Fan et al. []. The malondialdehyde (MDA) level was determined according to a previously described method by Prochazkova [].
2.10. Measurement of Superoxide Radical and Hydrogen Peroxide Production
Superoxide radicals (O2−) were measured as per a previously described method by Wang and Luo []. The concentration of hydrogen peroxide (H2O2) was measured as previously described by Sairam and Srivastava []. Briefly, it was estimated by measuring the spectrum absorbance of the titanium–hydroperoxide complex and comparing it to a standard curve plotted with known H2O2 concentrations.
2.11. Measurement of Antioxidant Enzyme Activities
The determination of superoxide dismutase (SOD), catalase (CAT), peroxidase (POD), and ascorbate peroxidase (APX) was basically prepared according to the method described by Bartoli et al. []. Briefly, 0.5 g of leaves was placed in a pre-cooled mortar, and 5 mL of pre-cooled phosphate-buffered saline (PBS, pH 7.8, 0.1 mM ethylenediaminetetraacetic acid, and 1.0% polyvinylpyrrolidone) was added before grinding. Next, the homogenate was centrifuged at 12,000× g and 4 °C for 10 min. Then, the supernatants were collected and used to assay the antioxidant enzymatic activities.
SOD (EC 1.15.1.1) activity was assessed and determined according to the method described by Beauchamp et al. []. The reaction mixture contained 50 mM PBS (pH 7.8), 13 mM methionine, 75 mM NBT, 2 mM riboflavin, 0.1 mM EDTA, and 0.1 mL of the enzyme extract in a 3 mL volume. One unit of SOD activity was measured as the amount of enzyme required to cause 50% inhibition of NBT reduction and was measured spectrophotometrically at 560 nm.
CAT (EC 1.11.1.6) activity was determined by the method described by Aebi [], using H2O2 (extinction coefficient of 39.4 mM−1 cm−1) in 3 mL of the reaction mixture containing 50 mM PBS (pH 7.0), 2 mM EDTA-Na2, 10 mM H2O2, and 0.1 mL of the enzyme extract. The spectrophotometric assay was recorded at 240 nm, and the change in absorbance was calculated per unit time. One unit of CAT activity was an absorbance change of 0.1 per minute.
To determine the activity of POD (EC 1.11.1.7), the method described by Maehly and Chance was used [], where 0.1 mL of the enzyme extract was mixed with 50 mM PBS (pH 7.0), 1% (m/v) guaiacol, and 0.4% (v/v) H2O2. The absorbance was measured at 470 nm. One unit of POD activity was an absorbance change of 0.01 per minute.
APX (EC 1.11.1.11) activity was assessed using the method described by Nakano and Asada [], with a reaction mixture (3 mL) containing 100 mM phosphate (pH 7), 0.1 mM EDTA-Na2, 0.3 mM ascorbic acid, 0.06 mM H2O2, and 0.1 mL of the enzyme extract. The change in absorption was quantified at 290 nm for 40 s after adding H2O2. One unit of POD activity was an absorbance change of 0.001 per minute.
The results are expressed as enzyme activity per unit of protein.
2.12. Analysis of Thylakoid Membrane Lipids
The contents of polar lipids, including monogalactosyl diacylglycerol (MGDG), digalactosyl diacylglycerol (DGDG), and phosphatidylglycerol (PG), and fatty acids were determined using the method described by Droppa et al. []. The index of unsaturated fatty acids (IUFAs) of the area for each polar lipid was calculated as described by Deng and Wang [].
2.13. Statistical Analysis
The experiment was carried out as a bifactorial design, with 3 technical replications and 9 biological replications. The values are expressed as the mean ± standard error (SE) of the 9 biological replications. The results were plotted with Sigmaplot 10.0, and statistical analyses were conducted using the Data Processing System software (DPS2000; Data Processing System, Zhejiang University, Hangzhou, China). Differences between the means among the tobacco lines or treatments were compared using Duncan’s multiple range tests at p < 0.05 probability levels.
3. Results
3.1. Genetic Engineering of GB Synthesis Results in GB Accumulation in Tobacco Leaves
As shown in Table 1, the GB content of the WT tobacco leaves was very low (0.3–0.4 μmol g−1 fresh weight (FW), and it did not change significantly after the drought treatment (30% PEG-6000; p > 0.05). The GB content was significantly higher in the T tobacco leaves than in the WT tobacco leaves (p < 0.05) under both the normal (0% PEG-6000) and 30% PEG-6000 conditions, with values of 4.9 and 9.0 μmol g−1 FW, respectively. The GB content in the T tobacco leaves was increased to 9.0 μmol g−1 FW after four days of the 30% PEG-6000 treatment.

Table 1.
GB content in the leaves of the wild-type (WT) and transgenic (T) tobacco lines.
3.2. Effects of Accumulated GB and PEG-6000-Induced Drought Stress on Phenotype of Tobacco
Due to the introduction of the BADH gene, the T tobacco exhibited a different phenotype from the WT under normal conditions (0% PEG-6000) and drought stress (30% PEG-6000) (Figure 1). As shown in Figure 1, the leaves of the T tobacco were significantly greener than that of the WT tobacco. At the same time, the upper blades were wider and rounder, and the shape of the leaves changed (Figure 1). Under drought stress (30% PEG-6000) (Figure 1b), both the WT and T tobacco exhibited wilting symptoms, but compared to the WT plants, the T plants showed less wilting under drought stress. Under drought stress, some WT plants exhibited more severe wilting, as shown in the lower and upper left corners of Figure 1b, indicating that GB accumulation had a positive impact on the drought resistance of tobacco (Figure 1).
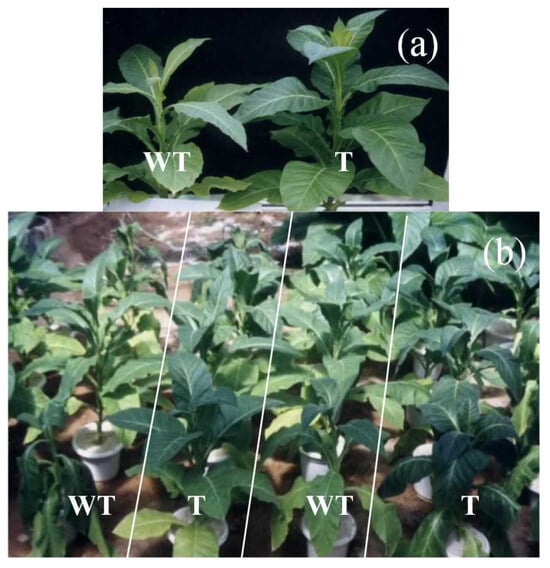
Figure 1.
The morphological difference between wild-type (WT) and transgenic (T) tobacco subjected to drought induced by 30% PEG-6000, (a): 0% PEG-6000 treatment and (b): 30% PEG-6000 treatment.
3.3. Effects of Accumulated GB and PEG-6000-Induced Drought Stress on Photosynthetic Pigments in Tobacco Leaves
The Chl and Car contents of the leaves from the T and WT tobacco plants were determined (Table 2). Treatment with 30% PEG-6000 significantly depressed the Chl and Car contents of the tobacco leaves compared to those of untreated leaves. The Chl a + b content decreased by 38.7% and the Car content decreased by 21.5% in the WT tobacco leaves. Similarly, the Chl a + b content decreased by 21.6% and the Car content decreased by 7.6% in the T tobacco leaves. GB accumulation in the T tobacco leaves attenuated the decreases in the Chl a + b and Car contents under 30% PEG-6000-induced drought stress.
Table 2.
Chlorophyll (Chl a + b) and carotenoid (Car) contents in wild-type (WT) and transgenic (T) tobacco leaves under PEG-6000-induced drought stress.
3.4. Accumulated GB Improved the Photosynthesis of Tobacco Leaves under PEG-6000-Induced Drought Stress
As shown in Figure 2, the photosynthetic function of the tobacco leaves was significantly inhibited after treatment with 30% PEG-6000. After four days of treatment with 30% PEG-6000, the Pn of the T tobacco leaves was 1.1 μmol m−2 s−1, while the Pn of the WT tobacco leaves was only 0.2 μmol m−2 s−1. The Pn of the T and WT tobacco leaves treated with 30% PEG-6000 was 81.5% and 95.9% lower than that of the control treatment (0% PEG-6000), respectively (Figure 2a). The changes in the AQY and CE were consistent with those in the Pn (Figure 2e,f). After treatment with 30% PEG-6000, the AQY and CE were higher in the T tobacco leaves than in the WT tobacco leaves. After four days of treatment with 30% PEG-6000, the Gs of the T and WT tobacco leaves was reduced significantly (Figure 2c). The Gs of the T and WT tobacco leaves treated with 30% PEG-6000 was 83.0% and 97.5% lower than those treated with 0% PEG-6000, respectively. The Ci of the T tobacco leaves was also reduced after treatment with 30%PEG-6000, while the Ci of the WT tobacco leaves significantly increased (p < 0.05; Figure 2d). Therefore, drought stress induced by 30% PEG-6000 not only caused stomatal closure, but also reduced the assimilation ability of the photosynthetic mechanisms in the WT tobacco leaves. GB accumulation improved the Pn and other gas parameters of the T tobacco leaves under drought stress, with the Gs showing the most significant impact, followed by the AQY and CE.
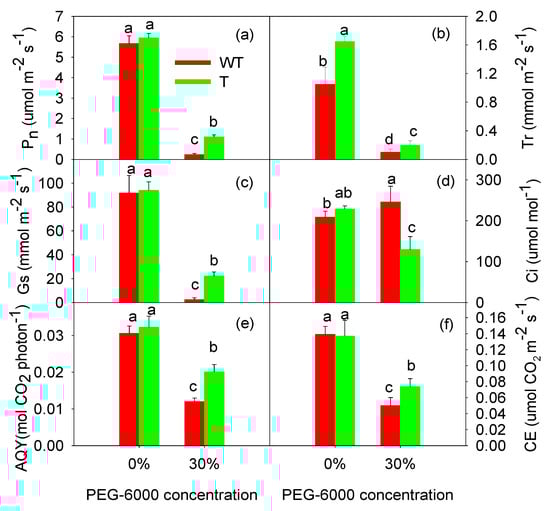
Figure 2.
Effects of 30% PEG-6000 treatment on the net photosynthetic rate (Pn, (a)), transpiration rate (Tr, (b)), stomatal conductance (Gs, (c)), intercellular CO2 concentration (Ci, (d)), apparent quantum yield (AQY, (e)), and carboxylation efficiency of photosynthesis (CE, (f)) in wild-type (WT) and transgenic (T) tobacco leaves. The values are expressed as the mean ± SE of nine parallel samples. Bars with the same letter do not differ significantly at p < 0.05.
3.5. GB Accumulation Improved the PSII Photochemical Activity of Tobacco Leaves under PEG-6000-Induced Drought Stress
Considering that the AQY and CE levels are related to the excitation energy capture and translation in photosynthesis, this study examined the characteristics of PSII photochemistry and electron transfer through the thylakoid membrane of the tobacco leaves (Figure 3 and Table 3). Under the normal condition (0% PEG-6000), the Fv/Fm values of the T and WT tobacco leaves were 0.830 and 0.827, respectively, and after treatment with 30% PEG-6000, they were 0.826 and 0.823, respectively. The 30% PEG treatment and GB had no significant effect on Fv/Fm (p > 0.05), so Fv/Fm is not shown in Figure 3.
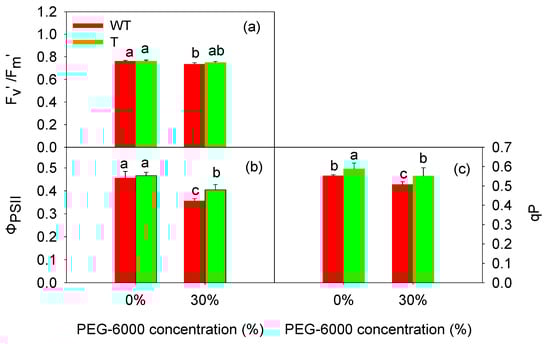
Figure 3.
Effects of PEG-6000 treatment on the Fv′/Fm′ (a), ΦPSII (b), and qP (c) of wild-type (WT) and transgenic (T) tobacco leaves. The values are expressed as the mean ± SE of nine parallel samples. The bars with the same letter do not differ significantly at p < 0.05.
Table 3.
The effect of GB accumulation on the Wk, ψo, RC/CSm, and PIABS of wild-type (WT) and transgenic (T) tobacco leaves under drought stress induced by PEG-6000.
The excitation energy capture efficiency (Fv′/Fm′) and the degree of reaction center opening (qP) of the T and WT tobacco leaves decreased under drought stress. Under the normal condition (0% PEG-6000), the Fv′/Fm′ values of the T and WT tobacco leaves were 0.760 and 0.759, respectively; after the drought stress induced by 30% PEG-6000, the Fv′/Fm′ value of the T tobacco leaves was 0.749, and that of the WT tobacco leaves was 0.734. After the 30% PEG-6000 treatment, the qP value of the T tobacco leaves decreased to 0.551, and that of the WT tobacco leaves decreased to 0.507. Compared to the control treatment, greater reductions in the Fv′/Fm′ and qP values were observed in the WT tobacco leaves (Figure 3). This finding indicated that a considerable portion of the excitation energy captured by the WT tobacco leaves had not been transferred to the PSII reaction center and had likely dissipated from the light-harvesting antenna. The reduction in Fv′/Fm′ and qP led to a decrease in the actual photochemical efficiency of the PSII reaction center (ΦPSII), this was consistent with the measurement results in the Figure 3b. After four days of treatment with 30% PEG-6000, ΦPSII decreased significantly in both the T and WT tobacco leaves, but the decrease was more pronounced in the WT tobacco leaves. From Figure 3, it can also be seen that the most evident effect of GB was on qP, then on ΦPSII, and then on Fv′/Fm′.
Furthermore, the PSII fast-phase fluorescence was measured, and the JIP test further confirmed these results (Figure 2 and Table 4). The Wk value rose while the Sm, N, ψEo, RC/CSm, and PIabs values declined after the treatment with 30% PEG-6000. After the treatment with 30% PEG-6000, the Wk value of the WT and T tobacco leaves increased by 24.3% and 10.8%, respectively; the Sm value decreased by 40.1% and 14.1%, respectively; the N level was reduced by 36.7% and 6.0%, respectively; the ψEo value was reduced by 12.5% and 4.9%, respectively; the RC/CSm value decreased by 30.2% and 19.5%, respectively; and the PIabs value decreased by 43.9% and 22.3%, respectively. Under drought stress induced by 30% PRG-6000, the increase in Wk was smaller in the T tobacco leaves than in the WT tobacco leaves, while the decreases in Sm, N, ψEo, RC/CSm, and PIabs were significantly lower in the T tobacco leaves than in the WT tobacco leaves (Table 4).
Table 4.
Soluble sugar, free proline, and soluble protein contents in wild-type (WT) and transgenic (T) tobacco leaves under PEG-6000-induced drought stress.
3.6. Effects of GB Accumulation on the Water Status of Tobacco Leaves under 30% PEG-6000-Induced Drought Stress
Figure 4 shows that the RWC and ΨW of the T and WT tobacco leaves decreased after the treatment with 30% PEG-6000. The RWC of the T tobacco leaves decreased by 12.8%, and the ΨW also decreased from −0.05 MPa to −0.12 MPa. The RWC of the WT tobacco leaves decreased by 16.8%, and the ΨW decreased from −0.65 MPa to −0.44 MPa. The RWC and ΨW were higher in the T tobacco leaves than in the WT tobacco leaves. The OA ability of the leaves under drought stress was examined to investigate the mechanism underlying the improvement in the water status in the T tobacco leaves with GB accumulation. After treatment with 30% PEG-6000, the T tobacco leaves showed a higher OA ability (Figure 4c), with the OA being approximately 2.55 times that of the WT tobacco leaves.
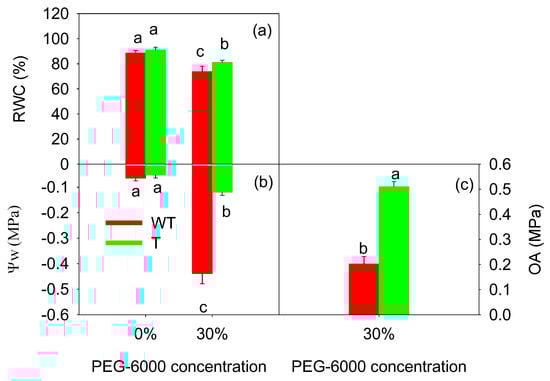
Figure 4.
Effects of PEG-6000 on the relative water content (RWC, (a)), water potential (ΨW, (b)), and osmotic adjustment (OA, (c)) in wild-type (WT) and transgenic (T) tobacco leaves. The values are the average of nine parallel samples. The bars with the same letter do not differ significantly at p < 0.05.
3.7. Effects of GB Accumulation on Soluble Sugar Content and Proline Accumulation in Tobacco Leaves under PEG-6000-Induced Drought Stress
Considering the high OA of the T tobacco leaves, the accumulation of major osmotic regulatory substances was further examined. Table 4 shows that treatment with 30% PEG-6000 resulted in a 2.38 times increase in soluble sugar content, a 15.34 times increase in proline content, and a 1.02 times increase in soluble protein content in the T tobacco leaves compared to the control treatment (0% PEG-6000); the corresponding values for the WT tobacco leaves were 1.01 times, 11.29 times, and 0.87 times, respectively. Therefore, drought stress significantly increased the contents of soluble sugars, proline, and soluble proteins in the tobacco leaves, and the increase was significantly higher in the T tobacco leaves than in the WT tobacco leaves. GB accumulation in the T tobacco leaves promoted the accumulation of free proline, soluble sugars, and soluble proteins; reduced the osmotic potential; improved the plant water conditions; and increased the leaf RWC (Figure 4).
3.8. Effects of GB Accumulation on Membrane Leakage and MDA Levels in Tobacco Leaves under PEG-6000-Induced Drought Stress
Figure 5a shows that treatment with 30% PEG-6000 significantly improved the electrolyte leakage of the tobacco leaves (p < 0.05). GB accumulation resulted in a lower ion leakage occurring in the T tobacco leaves than in the WT tobacco leaves. The MDA levels showed similar patterns (Figure 5b). After treatment with 30% PEG-6000 for four days, the MDA content rose by 76.6% in the T tobacco leaves and by 115.8% in the WT tobacco leaves (Figure 5b). The MDA content was significantly lower in the T tobacco leaves than in the WT tobacco leaves. Treatment with 30% PEG-6000 increased O2−· and H2O2 production (Figure 5c). However, the levels of both O2−· and H2O2 were lower in the T tobacco leaves than in the WT tobacco leaves. Therefore, GB accumulation eliminated ROS and alleviated membrane damage, which was beneficial for maintaining membrane function.
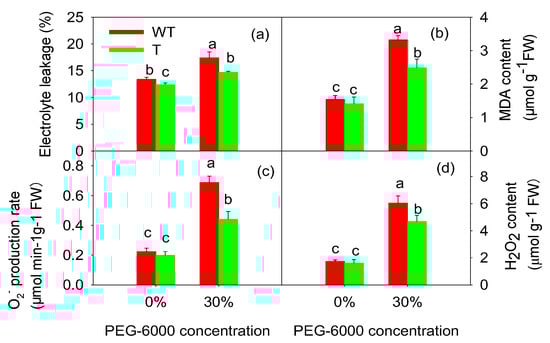
Figure 5.
Electrolyte leakage (a), MDA content (b), O2−· production (c), and H2O2 content (d) of wild-type (WT) and transgenic (T) tobacco leaves under drought stress induced by PEG-6000. Each bar is the mean ± SE of nine parallel samples. Bars with the same letter do not differ significantly at p < 0.05.
3.9. Effects of GB Accumulation on Antioxidant Enzyme Activities in Tobacco Leaves under PEG-6000-Induced Drought Stress
The ability of cells to scavenge ROS is often used as a physiological indicator of plant stress resistance. As shown in Figure 6, treatment with 30% PEG-6000 reduced the SOD and CAT activity and increased the POD and APX activity compared to the control treatment (0% PEG-6000). The SOD activity was reduced by 7.1% in the T tobacco leaves and by 13.0% in the WT tobacco leaves. Similarly, the CAT activity decreased by 40.2% in the T tobacco leaves and by 57.4% in the WT tobacco leaves. In contrast, the POD activity increased by 57.5% in the T tobacco leaves and by 41.9% in the WT tobacco leaves. Notably, the APX activity increased by 304.4% in the T tobacco leaves and by 269.4% in the WT tobacco leaves. Under drought stress, the SOD, CAT, POD, and APX activities were higher in the T tobacco leaves than in the WT tobacco leaves. Maintaining relatively high antioxidant enzyme activities under drought stress may have been beneficial for deactivating different excess ROS in the T tobacco leaves, which could underlie the higher stress resistance displayed by the T tobacco plants.
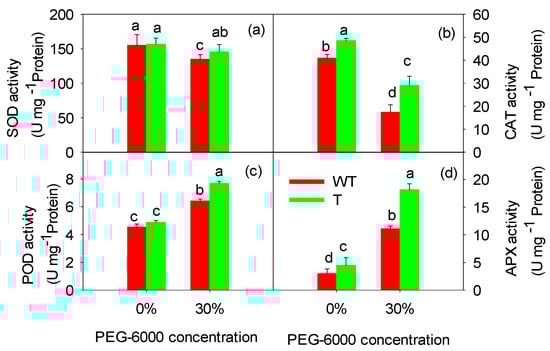
Figure 6.
Effects of PEG-6000 treatment on SOD activity (a), CAT activity (b), POD activity (c), and APX activity (d) in wild-type (WT) and transgenic (T) tobacco leaves. Each bar represents the mean ± SE of nine parallel samples. Bars with the same letter do not differ significantly at p < 0.05.
3.10. Effects of GB Accumulation on the Fatty Acid Composition of Thylakoid Membrane Lipids in Tobacco Leaves under PEG-6000-Induced Drought Stress
The contents of MGDG, DGDG, and PG lipids and IUFAs of the lipid and fatty acid composition in the thylakoid membrane of the tobacco leaves are shown in Figure 7 and Table 5. Figure 7a shows that the contents of the three types of membrane lipids decreased after the treatment with 30% PEG-6000, with DGDG being the most significantly affected, followed by PG. GB accumulation attenuated the decline in the contents of the three membrane lipid types. Furthermore, the IUFA of different lipids was estimated (Figure 7b); after the treatment with 30% PEG-6000, the MGDG-IUFA and DGDG-IUFA of the T and WT tobacco leaves did not decrease significantly. However, while the PG-IUFA did not decrease significantly in the T tobacco leaves, it did decrease significantly in the WT tobacco leaves. GB accumulation did not significantly impact the MGDG-IUFA content (p > 0.05), but it increased the DGDG-IUPA and PG-IUFA contents and attenuated their decline after the treatment with 30% PEG-6000.
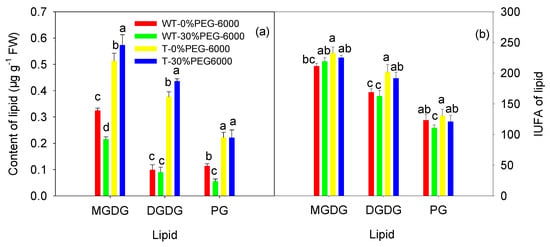
Figure 7.
The content (a) and index of unsaturated fatty acids (IUFAs) (b) of monogalactosyl diacylglycerol (MGDG), digalactosyl diacylglycerol (DGDG), and phosphatidylglycerol (PG) lipids in the thylakoid membrane of wild-type (WT) and transgenic (T) tobacco leaves. The IUFA content = 18: 1 mol % + (18: 2 mol % × 2) + (18: 3 mol % × 3). Each bar is the mean ± SE of nine parallel samples. Bars with the same letter do not differ significantly at p < 0.05.
Table 5.
The fatty acid composition (mol%) in the thylakoid membrane of wild-type (WT) and transgenic (T) tobacco leaves under PEG-6000-induced drought stress.
The results of the fatty acid determination are shown in Table 5. The thylakoid membrane of the tobacco leaves included six types of fatty acids: palmitic acid (16: 0), hexadecyltriaenoic acid (16: 1), stearic acid (18: 0), oleic acid (18: 1), linoleic acid (18: 2), and linolenic acid (18: 3). The main fatty acid components of MGDG and DGDG were 18: 3, while the main fatty acid components of SQDG, PG, and PC were 16: 0, 18: 2, and 18: 3, respectively. PG also contained a higher proportion of 16: 1 (3 t).
After treatment with 30% PEG-6000, the relative content of 18:3 in MGDG increased by 6.7% in the WT tobacco leaves but decreased by 3.7% in the T tobacco leaves. At the same time, treatment with PEG-6000 reduced the relative content of 18:3 in DGDG in both the WT and T tobacco leaves, and the relative content of 18:3 in DGDG was reduced by 8.4% in the WT tobacco leaves and by 10.1% in the T tobacco leaves. Compared to the control treatment (0% PEG-6000), the treatment with 30% PEG-6000 improved the relative content of 16:1 (3 t) in the PG of the T tobacco leaves by 29.3%, but declined the relative content of 16:1 (3 t) in the PG of the WT tobacco leaves by 15.1%. Furthermore, as shown in Table 5, the relative content of C16:1 (3 t) in PG in the T tobacco leaves was higher than that in the WT tobacco leaves not only under the normal condition (0% PEG-6000), but also under the drought condition (30% PEG-6000) (Table 5).
4. Discussion
Tobacco was able to accumulate GB in vivo after genetic engineering to enable GB synthesis (Table 1), which is consistent with previous studies [,]. However, the GB content was significantly higher than that reported in tissue-cultured seedlings and lower than that reported in the flourishing growth period of tobacco [,]. We speculate that these differences may be related to the different growth stages and treatment methods of the materials used in these studies. In addition, tobacco has no enzymes that synthesize GB [], and, theoretically, WT tobacco does not contain GB, which contradicts the detection of GB in the WT tobacco leaves shown in Table 1. We speculate that the trace amounts of GB found in the WT tobacco leaves may have been due to the detection method used and multiple types of GB. Nevertheless, the GB content in the WT tobacco leaves was negligible compared to that in the T tobacco leaves. The GB accumulation in the T tobacco leaves significantly increased under PEG-6000-induced drought stress, which is consistent with the constitutive nature of the transgenic promoter (CaMV35S). The synthesis of GB in tobacco makes it possible to increase its drought stress resistance (Figure 1).
The drought stress induced by 30% PEG-6000 appeared to damage the photosynthetic pigments—which are crucial for maintaining photosynthesis in tobacco leaves. However, it caused less damage in the T tobacco leaves (Table 2), suggesting a protective effect on photosynthesis due to the accumulation of GB in this T line. The results shown in Figure 2 confirmed this conclusion, showing that the Pn of the tobacco leaves was significantly inhibited after the treatment with 30% PEG-6000, and GB accumulation significantly improved the Pn and other gas parameters of the T tobacco leaves. Photosynthesis is the physiological basis for attaining high yields, and improving photosynthesis is crucial for increasing the yield of plants (crops). So, what is the mechanism by which GB increases the photosynthetic rate of tobacco?
The limiting factors of the photosynthetic rate under drought stress are divided into stomatal and non-stomatal factors. Due to the decrease in Gs, the diffusion of CO2 through the stomata into the inter cellular spaces of mesophyll cells slows, resulting in a decrease in Ci, which is a stomatal limitation. At this point, the assimilation ability of mesophyll cells is not significantly affected. Despite the continuous decrease in Gs, if the decrease in photosynthetic electron transfer and carbon assimilation abilities leads to an increase in Ci, the decrease in the photosynthetic rate is caused by non-stomatal factors []. Figure 2a,c show that the increase in the Pn in the T tobacco leaves was associated with the increase in the Gs induced by GB, and the effect of GB on Tr and Ci was also related to Gs. In addition, Figure 2d shows that, under PEG-6000-induced drought stress, the Pn and Gs of the WT tobacco leaves decreased while Ci increased. These results indicate that the decrease in the Pn in the WT tobacco leaves was related to both stomatal and non-stomatal factors []. GB accumulation improved the Gs and protected photosynthetic organs, which is consistent with the PSII photochemical activity measurements (Figure 3 and Table 3). Therefore, GB accumulation helps to maintain photosynthetic capacity and attenuate the damage caused by drought stress. Thus, what is the mechanism by which GB improves Gs?
Water stress can lead to a deterioration in the water status of plant cells, which is also the basis for other adverse physiological consequences. Our study indicated that accumulated GB can improve the water status of tobacco leaves under drought stress (Figure 4a,b) by improving the OA (Figure 4c). Under drought stress, the accumulation of compatible substances is one of the mechanisms for improving OA [,]. Considering that GB accumulation in T tobacco leaves is relatively low—much lower than its accumulation in Xerophyte plants such as Lycium barbarum []—and may not necessarily have an osmoregulatory effect [], we measured the contents of soluble proteins, soluble sugars, and free proline, which are compatible substances. Our results showed that the contents of these three substances were significantly higher in the T tobacco leaves than in the WT tobacco leaves, indicating that GB accumulation can induce the accumulation of other compatible substances. These results are consistent with previous studies [,], indicating that GB accumulation may increase the accumulation of these three substances to improve the OA, especially the free proline content. However, another study reached different conclusions [], which we speculate might be related to the different experimental materials and stress conditions employed. In this experiment, the stress conditions were generated by treatment with 30% PEG-6000 for 4 days, and the experimental materials could accumulate GB in vivo through the genetic engineering of GB synthesis; however, in the other study, stress conditions were generated by treatment with 30% PEG-6000 for 48 h, and the material accumulated GB through exogenous GB.
The increase in Pn in the T tobacco leaves was related to the increase in the Gs induced by GB, while the effect of GB on Tr and Ci was related to Gs and energy conversion, which was closely related to AQY and CE. The levels of AQY and CE were significantly higher in the T tobacco leaves than in the WT tobacco leaves (Figure 2), indicating that the T tobacco leaves had a higher carbon assimilation capability. The effects of GB on AQY and CE may have been related to its protective effect on the functional proteins in the thylakoid membrane of tobacco leaves. The results in Figure 3 and Table 3 prove this point.
GB accumulation has been shown to have a protective effect on photosynthetic mechanisms under adverse conditions [,]. PSII excitation energy capture efficiency (Fv′/Fm′) and actual photochemical efficiency (ΦPSII) are commonly used as sensitive indicators of plant photosynthetic performance [] and represent the functional status of PSII. After treatment with 30% PEG-6000, the Fv′/Fm′ and Φ PSII (Figure 3) were significantly higher in the T tobacco leaves than in the WT tobacco leaves, indicating that GB accumulation can protect the function of the PSII protein complex on the thylakoid membrane. The JIP test also supported this conclusion (Table 3). GB significantly increased the donor side (Wk), the reaction center activity (RC/CSm), and the receptor side activity (Sm and ψEo) of PSII (Table 3), indicating that the T tobacco could resist PSII inactivation induced by drought stress better than the WT tobacco. The thylakoid membrane is a site of the proteins related to photosynthetic energy transfer and photosynthesis (including PSII). These membrane proteins and lipids interact with lipids in the thylakoid [,]. Stress can alter the composition and efficacy of these membrane lipids, leading to the formation of non-bilayer memstructures []. MGDG has the characteristic of forming a non-bilayer structure (an anti-hexagonal phase and a non-layered structure) [], while DGDG is a bilayer-forming lipid [], and increased saturated fatty acid content in terms of MGDG and DGDG reduces the tendency to form a non-bilayer structure []. In this experiment, the MGDG/DGDG composition of the WT tobacco leaves was significantly higher than that of the T tobacco leaves (as shown in Figure 6a) under both normal conditions and drought stress. Compared to the normal conditions (0% PEG-6000), the decrease in the relative content of C18:3 fatty acids in MGDG and DGDG was significantly higher in the T tobacco leaves than in the WT tobacco leaves (Table 5) under drought stress (30% PEG-6000).
Meanwhile, the negative lipid PG in the thylakoid membrane is crucial for the structure and function of the thylakoid, especially the 16:1 (3 t) content in PG []. Stress can change the structure of light-harvesting complex II (LHCII) by reducing the content of C16:1 (3 t) in PG, thus reducing the light-harvesting efficiency and photosynthetic activity. In this experiment, under drought stress, the T tobacco leaves had a higher content of PG, and their relative content of 16:3 (3 t) in PG was significantly higher than that in the WT tobacco leaves (Figure 7 and Table 5), which is crucial for PSII function []; the results shown in Table 3 prove this point. Various lipids in tobacco tend to saturate under drought stress (Table 5 and Figure 7), which is detrimental to the structure and function of photosynthetic mechanisms in the thylakoid membrane. T tobacco leaves can maintain the relative stability of various lipid and fatty acid components in the thylakoid membrane, especially MGDG and PG, which is beneficial for maintaining the function of various protein complexes on the thylakoid membrane, reducing Chl degradation under drought conditions, and attenuating the decline in photosynthesis (Table 1 and Figure 2). These differences may have been due to the introduction of the BADH gene into the chloroplasts, resulting in 63.0%–87.0% of the total leaf GB localizing to the chloroplasts [], thereby affecting the expression of related genes []. But this hypothesis requires further research.
The photosynthetic electron transport chain is considered as a major source of ROS in plant cells []. Drought stress can reduce the conversion and utilization efficiency of light energy in plant photosynthetic organs, leading to a decrease in their assimilation ability and the production of large amounts of ROS. Excessive ROS accumulation in cells leads to membrane lipid peroxidation, which destroys the structure and function of biological macromolecules []. This destruction, in turn, leads to disturbances in photosynthetic metabolism, further reducing the photosynthetic rate [] and forming a vicious cycle. GB enhances antioxidant enzyme activities and scavenges ROS, which may be one mechanism for improving photosynthesis.
Accumulated GB in the T tobacco leaves appeared to help attenuate lipid peroxidation (Figure 5b) and maintain cell membrane stability (Figure 5a), which is consistent with previous studies [,]. Although GB acts as a potential scavenger of toxic ROS produced during abiotic stress [], it cannot directly deactivate different ROS [,], and our results indicate that the GB accumulation in the T tobacco leaves increased antioxidant enzyme activities (Figure 6), especially that of APX, followed by CAT and POD. APX and CAT both remove H2O2, which is consistent with the lower H2O2 content found in the T tobacco leaves (Figure 5d). The enhanced activity of these antioxidant enzymes (Figure 6) may be a major factor contributing to the decrease in ROS mediated by the accumulated GB (Figure 2c,d). The increases in SOD and APX activity can improve the water–water cycle, which may dissipate excess energy generated by photoreactions during photosynthesis and reduce ROS production [], thereby facilitating the smooth progression of photosynthesis. Interestingly, in our study, the activities of APX and CAT were higher in the T tobacco leaves than in the WT tobacco leaves under normal conditions (0% PEG-6000). We speculate that the accumulated GB in the T tobacco leaves was beneficial for stabilizing antioxidant enzyme proteins and may have promoted the expressions of APX- and CAT-related genes to enhance their antioxidant activities [,]. However, the specific mechanism underlying this needs further study.
5. Conclusions
In summary, transgenic tobacco carrying the BADH gene accumulated GB, which enhanced the plant’s photosynthesis resistance to drought stress induced by PEG-6000, alleviated the physiological damage caused by drought stress induced by PEG-6000, and enhanced overall drought resistance. Under drought stress, the observed improvement in photosynthesis in the T tobacco leaves was related to GB’s beneficial effects on the water conditions, antioxidant capacity, and maintenance of the membrane protein content and function by maintaining a relatively stable fatty acid content in the thylakoid membrane.
Author Contributions
G.W. and X.Y. conceived and designed the experiments; G.W. performed most of the experiments, analyzed the data, and compiled the original manuscript. X.Y. and X.X. assisted with the photosynthesis and lipid experiments. X.X. offered suggestions and contributed to the discussion. All authors have read and agreed to the published version of the manuscript.
Funding
This study was supported by the Youth Research Fund of Shandong Institute of Pomology (GSS2022ZD03) and Earmarked Fund for China Agriculture Research System (CARS-27).
Institutional Review Board Statement
Not applicable.
Informed Consent Statement
Not applicable.
Data Availability Statement
Data are contained within the article.
Conflicts of Interest
The authors declare no conflicts of interest.
References
- Grosse-Holz, F.; Kelly, S.; Blaskowski, S.; Kaschani, F.; Kaiser, M.; van der Hoorn, R.A.L. The transcriptome, extracellular proteome and active secretome of agroinfiltrated Nicotiana benthamiana uncover a large, diverse protease repertoire. Plant Biotechnol. J. 2018, 16, 1068–1084. [Google Scholar] [CrossRef] [PubMed]
- Sifola, M.I.; Carrino, L.; Cozzolino, E.; Piano, L.D.; Graziani, G.; Ritieni, A. Potential of pre-harvest wastes of tobacco (Nicotiana tabacum L.) crops, grown for smoke products, as source of bioactive compounds (Phenols and Flavonoids). Sustainability 2021, 13, 2087. [Google Scholar] [CrossRef]
- Song, Z.P.; Wang, D.B.; Gao, Y.B.; Li, C.J.; Jiang, H.L.; Zhu, X.W.; Zhang, H.Y. Changes of lignin biosynthesis in tobacco leaves during maturation. Funct. Plant Biol. 2021, 48, 624–633. [Google Scholar] [CrossRef] [PubMed]
- Liang, T.; Que, Y.H.; Yu, Q.W.; Jia, R.L.; Zhou, G.; Guo, K.Y.; Huang, Y.; Liu, R.X. Genetic Analysis and Gene Mapping of Leaf Number of Flue-cured Tobacco (Nicotiana tabacum) Variety ‘Jiucaiping 2’. J. Mt. Agric. Biol. 2023, 31, 50–60. [Google Scholar] [CrossRef]
- Xiang, X.H.; Wu, X.R.; Chao, J.T.; Yang, M.L.; Yang, F.; Chen, G.; Liu, G.S.; Wang, Y.Y. Genome-wide identification and expression analysis of the WRKY gene family in common tobacco (Nicotiana tabacum L.). Hereditas 2016, 38, 840–856. [Google Scholar] [CrossRef] [PubMed]
- Huang, T.K.; Falk, B.W.; Dandekar, A.M.; Dandekar, A.M.; Mcdonald, K.A. Enhancement of Recombinant Protein Production in Transgenic Nicotiana benthamiana Plant Cell Suspension Cultures with Co-Cultivation of Agrobacterium Containing Silencing Suppressors. Int. J. Mol. Sci. 2018, 19, 1561. [Google Scholar] [CrossRef] [PubMed]
- Fang, N.; Wang, C.K.; Liu, X.F.; Zhao, X.; Liu, Y.H.; Liu, X.M.; Du, Y.M.; Zhang, Z.F.; Zhang, H.B. Identification of Eukaryotic Enzymes Compatible with Tobacco Bioreactor for Astaxanthin Synthesis. Chin. Tob. Sci. 2019, 40, 9–16. [Google Scholar]
- Zou, Q.; Pan, W.S.; Qiu, J.; Shu, W.S.; Wu, C. Recent advances in optimization strategies and applications of plant bioreactors. China Biotechnol. 2023, 43, 71–86. [Google Scholar] [CrossRef]
- Clough, B.F.; Milthorpe, F.L. Effects of Water Deficit on Leaf Development in Tobacco. Funct. Plant Biol. 1974, 2, 291–300. [Google Scholar] [CrossRef]
- Wang, Y.H.; Xu, Z.C.; Gao, S.; Chen, Z.; Niu, G.Y.; Zhao, P.P. Research progress of tobacco drought stress. Water Sav. Irrig. 2016, 12, 103–107, 111. [Google Scholar] [CrossRef]
- Guang, J.; Shao, X.; Yang, X.; Zhang, C.; Wu, W.; Miao, Q.; Zhao, T. Research on drought resisting effect of water—Retaining agent in flue-cured tobacco production. In Proceedings of the 2018 International Conference on Advanced Chemical Engineering and Environmental Sustainability, Xiamen, China, 26 September 2018. [Google Scholar] [CrossRef]
- Zhao, L.; Zhou, Y.; Wang, H.Y.; Shi, H.Z.; Zhao, S.M.; Chang, L.K.; Yang, Q.M.; Yang, H.J. Research on the differential physiological responses in different flue-cured tobacco lines under drought stress. J. Nucl. Agri. Sci. 2019, 33, 607–615. [Google Scholar] [CrossRef]
- Qi, M.; Zheng, X.; Niu, G.; Ye, A.; Rather, S.A.; Ahmed, N.; Mustafad, N.S.; Wang, P.; Siddiqui, M.H.; Kimar, R.; et al. Supplementation of Acetylcholine Mediates Physiological and Biochemical Changes in Tobacco Lead to Alleviation of Damaging Effects of Drought Stress on Growth and Photosynthesis. J. Plant Growth Regul. 2022, 42, 4616–4628. [Google Scholar] [CrossRef]
- Zandalinas, S.I.; Mittler, R.; Balfagon, D. Plant adaptations to the combination of drought and high temperatures. Physiol. Plant. 2018, 162, 2–12. [Google Scholar] [CrossRef] [PubMed]
- Mathur, S.; Tomar, R.S.; Jajoo, A. Arbuscular mycorrhizal fungi (AMF) protects photosynthetic apparatus of wheat under drought stress. Photosynth. Res. 2019, 139, 227–238. [Google Scholar] [CrossRef] [PubMed]
- Medyouni, I.; Zouaoui, R.; Rubio, E.; Serino, S.; Ahmed, H.B.; Bertin, N. Effects of Water deficit on leaves and fruit quality during the development period in tomato plant. Food Sci. Nutr. 2021, 9, 1949–1960. [Google Scholar] [CrossRef] [PubMed]
- Kamanga, R.M.; Mbega, E.; Ndakidemi, P. Drought Tolerance Mechanisms in Plants: Physiological Responses Associated with Water Deficit Stress in Solanum lycopersicum. Adv. Crop Sci. Tech. 2018, 6, 362. [Google Scholar] [CrossRef]
- Ahammed, G.J.; Li, X.; Yang, Y.; Liu, C.; Cheng, Y. Tomato WRKY81 acts as a negative regulator for drought tolerance by modulating guard cell H2O2–mediated stomatal closure. Environ. Exp. Bot. 2019, 171, 103960. [Google Scholar] [CrossRef]
- Jiao, S.; Zeng, F.; Huang, Y.; Zhang, L.; Mao, J.; Chen, B. Physiological, biochemical and molecular responses associated with drought tolerance in grafted grapevine. BMC Plant Biol. 2023, 23, 110. [Google Scholar] [CrossRef]
- Yu, F.Y.; Jin, L.Y.; Li, J.J. Characteristics of Spring Drought in Southwest China and the Anomalous Circulation. Desert Oasis Meteor. 2020, 14, 68–76. (In Chinese) [Google Scholar] [CrossRef]
- Hanson, A.D.; Nelsen, C.E.; Everson, E.H. Evaluation of free proline accumulation as an index of drought resistance using two contrasting barley cultivars1. Crop Sci. 1977, 17, 720–726. [Google Scholar] [CrossRef]
- Ibrahim, E.A.; Ebrahim, N.E.S.; Mohamed, G.Z. Effect of water stress and foliar application of chitosan and glycine betaine on lettuce. Sci. Rep. 2023, 13, 17274. [Google Scholar] [CrossRef] [PubMed]
- Pei, L.M.; Li, H.; Zhou, Y.Y.; Li, W.J.; Jiang, Y.H.; Li, H. Exogenous glycine betaine application contributes to abiotic stress tolerance in maize. J. Plant Biol. 2022, 65, 517–529. [Google Scholar] [CrossRef]
- Seymen, M.; Şahin, A.Ş.; Tanrıverdi, Ö.B. Mitigation Effects of Proline and Glycine Betaine to Green Onion Under Flooding Stress. Gesunde Pflanz. 2023, 75, 1639–1652. [Google Scholar] [CrossRef]
- Chungloo, D.; Tisarum, R.; Samphumphuang, T.; Sotesaritkul, T.; Singh, H.P.; Takabe, T.; Cha-um, S. Mitigation of Water-Deficit Stress, Physio-morphological Adaptation, and Elevation of Andrographolide in Andrographis paniculata using Foliar Glycine Betaine. J. Plant Growth Regul. 2023, 42, 6273–6285. [Google Scholar] [CrossRef]
- Yang, X.H.; Liang, Z.; Wen, X.G.; Lu, C.M. Genetic engineering of the biosynthesis of glycine betaine leads to increased tolerance of photosynthesis to salt stress in transgenic tobacco plants. Plant Mol. Biol. 2008, 66, 73–86. [Google Scholar] [CrossRef] [PubMed]
- Feng, P.W. Study on the Mechanism of Glycine Betaine Improve the Tolerance of Cd Stress in Tobacco. Master’s Thesis, Shandong Agricultural University, Taian, China, 2018. [Google Scholar]
- Shahbazi, M.; Tohidfar, M.; Aliniaeifard, S.; Yazdanpanah, F.; Bosacchi, M. Transgenic tobacco co-expressing flavodoxin and betaine aldehyde dehydrogenase confers cadmium tolerance through boosting antioxidant capacity. Protoplasma 2022, 259, 965–979. [Google Scholar] [CrossRef] [PubMed]
- Yang, X.H.; Liang, Z.; Lu, C.M. Genetic engineering of the biosynthesis of glycine betaine enhances photosynthesis against high temperature stress in transgenic tobacco plants. Plant Physiol. 2005, 38, 2299–2309. [Google Scholar] [CrossRef]
- Gorham, J.; McDonnell, E.; WynJones, R.G. Determination of Betaines as Ultraviolet-Absorbing Esters. Ann. Chim. Acta 1982, 138, 277–283. [Google Scholar] [CrossRef]
- Arnon, D.I. Copper enzymes in isolated chloroplasts-polyphenoloxidase in Beta vulgaris. Plant Physiol. 1949, 24, 1–15. [Google Scholar] [CrossRef]
- Farquhar, G.D.; Sharkey, T.D. Stomatal conductance and photosynthesis. Ann. Rev. Plant Pysiol. 1982, 33, 317–345. [Google Scholar] [CrossRef]
- Butler, W.L.; Kitajima, M. Fluorescence quenching in photosystem II of chloroplasts. Biochim. Biophys. Acta 1975, 376, 116–125. [Google Scholar] [CrossRef] [PubMed]
- Genty, B.; Briantais, J.M.; Baker, N.R. The relationship between the quantum yield of photosynthetic electrontransport and quenching of chlorophyll fluorescence. Biochim. Biophys. Acta. 1989, 990, 87–92. [Google Scholar] [CrossRef]
- Strasser, R.J. The grouping model of plant photosynthesis. In Chloroplast Development; Akoyunoglou, G., Argyroudi-Akoyunoglou, J., Eds.; Elsevier: Amsterdam, The Netherlands, 1978; pp. 513–524. [Google Scholar]
- Strasser, R.J. The grouping model of plant photosynthesis: Heterogeneity of pho tosynthetic units in thylakoids. In Photosynthesis III. Structure and Molecular Organization of the Photosynthetic Apparatus; Akoyunoglou, G., Ed.; Balaban International Science Services: Philadelphia, PA, USA, 1981; pp. 727–737. [Google Scholar]
- Strasser, B.J.; Strasser, R.J. Measuring fast fluorescence transients to address environmental questions: The JIP-test. In Photosynthesis: From Light to Biosphere; Mathis, P., Ed.; Kluwer Academic Publishers: Alphen aan den Rijn, The Netherlands, 1995; Volume V, pp. 977–980. [Google Scholar]
- Strasser, R.J. Donor side capacity of photosystem II probed by chlorophyll a fluorescence transient. Photosynth. Res. 1997, 52, 147–155. [Google Scholar] [CrossRef]
- Strasser, R.J.; Srivastava, A.; Tsimilli-Michael, M. The fluorescence transient as a tool to characterize and screen photosynthetic samples. In Probing Photosynthesis: Mechanism, Regulation and Adaptation; Yunus, M., Pathre, U., Mohanty, P., Eds.; Taylor and Francis: London, UK, 2000; pp. 445–483. [Google Scholar]
- Weatherley, P.E. Studies in water relations of cotton plants. I. The field measurement of water deficit in leaves. New Phytol. 1950, 49, 81–87. [Google Scholar] [CrossRef]
- Marion, M. Bradford. A rapid and sensitive method for the quantitation of microgram quantities of protein utilizing the principle of protein-dye binding. Anal. Biochem. 1976, 72, 248–254. [Google Scholar] [CrossRef]
- Bates, L.S.; Waldren, R.P.; Tear, I.D. Rapid Determination of Free Proline for Water Stress Studies. Plant Soil 1973, 39, 205–207. [Google Scholar] [CrossRef]
- Tissue, D.T.; Wright, S.J. Effect of seasonal water availability on phenology and the annual shoot carbohydrate cycle of tropical forest shrubs. Funct. Ecol. 1995, 9, 518–527. [Google Scholar] [CrossRef]
- Fan, L.; Zheng, S.Q.; Wang, X.M. Antisense suppression of phospholipase D alpha retards abscisic acid and ethylene promoted senescence of postharvest Arabidopsis leaves. Plant Cell 1997, 9, 2183–2196. [Google Scholar] [CrossRef]
- Prochazkova, D.; Sairam, R.K.; Srivastava, G.C.; Singh, D.V. Oxidative stress and antioxidant activity as the basis of senescence in maize leaves. Plant Sci. 2001, 161, 765–771. [Google Scholar] [CrossRef]
- Wang, A.G.; Luo, G.H. Quantitative relation between the reaction of hydroxylamine and superoxide anion radicals in plants. Plant Physiol. Commun. 1990, 6, 55–57. [Google Scholar] [CrossRef]
- Sairam, P.K.; Srivastava, G.C. Changes in antioxidant activity in sub-cellular fractions of tolerant and susceptible wheat genotypes in response to long term salt stress. Plant Sci. 2002, 162, 897–904. [Google Scholar] [CrossRef]
- Bartoli, C.G.; Tambussi, E.; Beltrano, J.; Montaldi, E.; Puntarulo, S.; Simontacchi, M. Drought and watering-dependent oxidative stress: Effect on antioxidant content in Triticum aestivum L. leaves. J. Exp. Bot. 1999, 50, 375–383. [Google Scholar] [CrossRef]
- Beauchamp, C.; Fridovich, I. Suproxide Dismusase: Improved assays and an assay applicable to acrylamidegel. Anal. Biochem. 1971, 44, 276–2871. [Google Scholar] [CrossRef] [PubMed]
- Aebi, H. Catalase in vitro. Methods Enzymol. 1984, 105, 121–126. [Google Scholar] [CrossRef] [PubMed]
- Maehly, A.; Chance, B. Catalases and peroxidases. Methods Biochem. Anal. 1954, 1, 357–424. [Google Scholar] [CrossRef] [PubMed]
- Nakano, Y.; Asada, K. Hydrogen peroxide is scavenged by ascorbate-specific peroxidase in spinach chloroplasts. Plant Cell Physiol. 1981, 22, 867–880. [Google Scholar]
- Droppa, M.; Masojidek, J.; Rózsa, Z.; Wolak, A.; Horváth, G. Characteristics of Cu deficiency-induced inhibition of photosynthetic electron transport in spinach chloroplasts. BBA-Bioenerg. 1987, 891, 75–84. [Google Scholar] [CrossRef]
- Deng, L.Y.; Wang, H.C. Cold hardiness of crape in relation to membrane lipid composition. Acta Physiol. Sin. 1982, 8, 273–283, (In Chinese with English Abstract). [Google Scholar]
- Wang, G.P.; Xue, X.M.; Yang, X.H.; Chen, R.; Han, X.P. The genetic engineering of glycine betaine synthesis in tobacco improves the resistance of the photosynthetic apparatus to drought stress. Plant Biotechnol. Rep. 2022, 16, 229–242. [Google Scholar] [CrossRef]
- Nuccio, M.L.; Russell, B.L.; Nolte, K.D.; Rathinasabapathi, B.; Gage, D.A.; Hanson, A.D. The endogenous choline supply limits glycine betaine synthesis in transgenic tobacco expressing choline monooxygenase. Plant J. 1998, 16, 487–496. [Google Scholar] [CrossRef]
- Wang, W.S. Analysis of Effects of Drought/NaCl Stress on Soybean Based on Chlorophyll Fluorescence Kinetics. Ph.D. Thesis, Shenyang Agricultural University, Shenyang, China, 2018. [Google Scholar]
- Liu, J.; Zhu, L.J.; Zhang, K.; Wang, X.M.; Wang, L.W.; Gao, X.N. Effects of Drought Stress/Rewatering on Photosynthetic Characteristics and Yield of Soybean at Different Growth Stages. Ecol. Environ. Sci. 2022, 31, 286–296. [Google Scholar] [CrossRef]
- Grumet, R.; Hanson, A.D. Genetic evidence for an osmoregulatory/function of glycinebetaine accumulation in barley. Funct. Plant Biol. 1986, 13, 353–364. [Google Scholar] [CrossRef]
- Tisarum, R.; Theerawitaya, C.; Samphumphuang, T.; Singh, H.P.; Cha-Um, S. Foliar application of glycinebetaine regulates soluble sugars and modulates physiological adaptations in sweet potato (Ipomoea batatas) under water deficit. Protoplasma 2020, 257, 197–211. [Google Scholar] [CrossRef] [PubMed]
- Zhang, G.S. Effects of Exogenous Glycine Betaine on Physiologicalcharacteristics in Super Black Waxy Maize under Cadmium Stress. Master’s Thesis, Huaibei Normal University, Huaibei, China, 2017. [Google Scholar] [CrossRef]
- Figuetoa-soto, C.G.; Valenzuel-soto, M. Glycine betaine rather than acting only as an osmolyte also plays a role as regulator in cellular metabolism. Biochimie 2018, 147, 89–97. [Google Scholar] [CrossRef] [PubMed]
- Ma, X.L.; Wang, Y.J.; Xie, S.L.; Li, F.; Wang, W. Glycinebetaine Applied through Roots Protects the Photosynthetic Apparatus of Tobacco Seedlings under Water Stress. J. Plant Physiol. Mol. Biol. 2006, 32, 465–472. [Google Scholar]
- Maxwell, K.; Johnson, G.N. Chlorophyll fluorescence—A practical guide. J. Exp. Bot. 2000, 51, 659–668. [Google Scholar] [CrossRef] [PubMed]
- Janik, E.; Bednarska, J.; Zubik, M.; Puzio, M.; Luchowski, R.; Grudzinski, W.; Mazur, R.; Garstka, M.; Maksymiec, W.; Kulik, A. Molecular architecture of plant thylakoids under physiological and light stress conditions: A study of lipid-light-harvesting complex II model membranes. Plant Cell 2013, 25, 2155–2170. [Google Scholar] [CrossRef]
- Kobayashi, K. Role of membrane glycerolipids in photosynthesis, thylakoid biogenesis and chloroplast development. J. Plant Res. 2016, 129, 565–580. [Google Scholar] [CrossRef]
- Djanaguiraman, M.; Boyle, D.L.; Welti, R.; Jagadish, S.V.K.; Prasad, P.V.V. Decreased photosynthetic rate under high temperature in wheat is due to lipid desaturation, oxidation, acylation, and damage of organelles. BMC Plant Biol. 2018, 18, 55. [Google Scholar] [CrossRef]
- Sen, A.; William, W.P.; KBrain, A.P.R. Formation of inverted micelles in dispersions of mixed galactolipids. Nature 1981, 293, 488–490. [Google Scholar] [CrossRef]
- Demé, B.; Cataye, C.; Block, M.A.; Maréchal, E.; Jouhet, J. Contribution of galactoglycero lipids to the 3-dimensional architecture of thylakoids. FASEB J. 2014, 28, 3373–3383. [Google Scholar] [CrossRef] [PubMed]
- Gounaris, K.; Brain, A.R.P.; Quinn, P.J.; Williams, W.P. Structural reorganization of fluidity of the thylakoid membranes in responses to heat stress. Biochim. Biophys. Acta 1984, 766, 198–208. [Google Scholar] [CrossRef]
- Yu, B.; Benning, C. Anionic lipids are required for chloroplaststructure and function in Arabidopsis. Plant J. 2003, 36, 762–770. [Google Scholar] [CrossRef] [PubMed]
- Leng, J.; Li, L.B.; Chen, H.; Xu, Y.N.; Kuang, T.T. The membrane lipid compositions in spinach LHCII and the function role of PG in LHCII aggregation. Acta Biophys. Sin. 2002, 18, 388–393. [Google Scholar]
- Bai, M.; Zeng, W.; Chen, F.; Ji, X.; Zhuang, Z.; Jin, B.; Wang, J.; Jia, L.; Peng, Y. Transcriptome expression profiles reveal response mechanisms to drought and drought-stress mitigation mechanisms by exogenous glycine betaine in maize. Biotechnol. Lett. 2022, 44, 367–386. [Google Scholar] [CrossRef] [PubMed]
- Doyle, S.M.; Diamond, M.; Mccabe, P.F. Chloroplast and reactive oxygen species involvement in apoptotic-like programmed cell death in Arabidopsis suspension cultures. J. Exp. Bot. 2009, 61, 473–482. [Google Scholar] [CrossRef] [PubMed]
- Muhammad, I.; Shalmani, A.; Ali, M.; Yang, Q.H.; Ahmad, H.; Li, F.B. Mechanisms Regulating the Dynamics of Photosynthesis Under Abiotic Stresses. Front. Plant Sci. 2020, 11, 615942. [Google Scholar] [CrossRef] [PubMed]
- Saneoka, H.; Moghaieb, R.E.A.; Premachandra, G.S.; Fujita, K. Nitrogen nutrition and water stress effects on cell membrane stability and leaf water relations in Agrostis palustris Huds. Environ. Exp. Bot. 2004, 52, 131–138. [Google Scholar] [CrossRef]
- Lv, S.L.; Yang, A.F.; Zhang, K.W.; Wang, L.; Zhang, J.R. Increase of glycine betaine synthesis improves drought tolerance in cotton. Mol. Breed. 2007, 20, 233–248. [Google Scholar] [CrossRef]
- Banerjee, A.; Roychoudhury, A. Abiotic stress, generation of reactive oxygen species, and their consequences: An overview. In Revisiting the Role of Reactive Oxygen Species (ROS) in Plants: ROS Boon or Bane for Plants? Singh, V.P., Singh, S., Tripathi, D., Prasad, S.M., Chauhan, D.K., Eds.; John Wiley & Sons, Inc.: Hoboken, NJ, USA, 2017; pp. 23–50. [Google Scholar]
- Hanson, A.D.; May, A.M.; Grumet, R.; Bode, J.; Jamieson, G.C.; Rhodes, D. Betaine synthesis in Chenopods: Localization in chloroplasts. Proc. Natl. Acad. Sci. USA 1985, 82, 3678–3682. [Google Scholar] [CrossRef]
- Smirnoff, N.; Cumbes, Q.J. Hydroxyl radical scavenging activity of compatible solutes. Phytochemistry 1989, 28, 1057–1060. [Google Scholar] [CrossRef]
- Asada, K. Radical production and scavenging in chloroplasts. In Photosynthesis and the Environment; Baker, N.R., Ed.; Kluwer Academic Publishers: Dordrecht, The Netherlands, 1996; pp. 123–150. [Google Scholar]
Disclaimer/Publisher’s Note: The statements, opinions and data contained in all publications are solely those of the individual author(s) and contributor(s) and not of MDPI and/or the editor(s). MDPI and/or the editor(s) disclaim responsibility for any injury to people or property resulting from any ideas, methods, instructions or products referred to in the content. |
© 2024 by the authors. Licensee MDPI, Basel, Switzerland. This article is an open access article distributed under the terms and conditions of the Creative Commons Attribution (CC BY) license (https://creativecommons.org/licenses/by/4.0/).