Growth Dynamic, Productivity, Evapotranspiration, and Water-Economic Indices of Forage Cactus under Different Irrigation Depths

 , ,
, ,  ,
,
Abstract
:1. Introduction
2. Materials and Methods
2.1. Study Area
2.2. Monitoring Soil Water Dynamics
2.3. Growth, Yield, and Morpho-Physiological Indices
2.4. Water and Economic Indicators
2.5. Statistical Analysis
3. Results
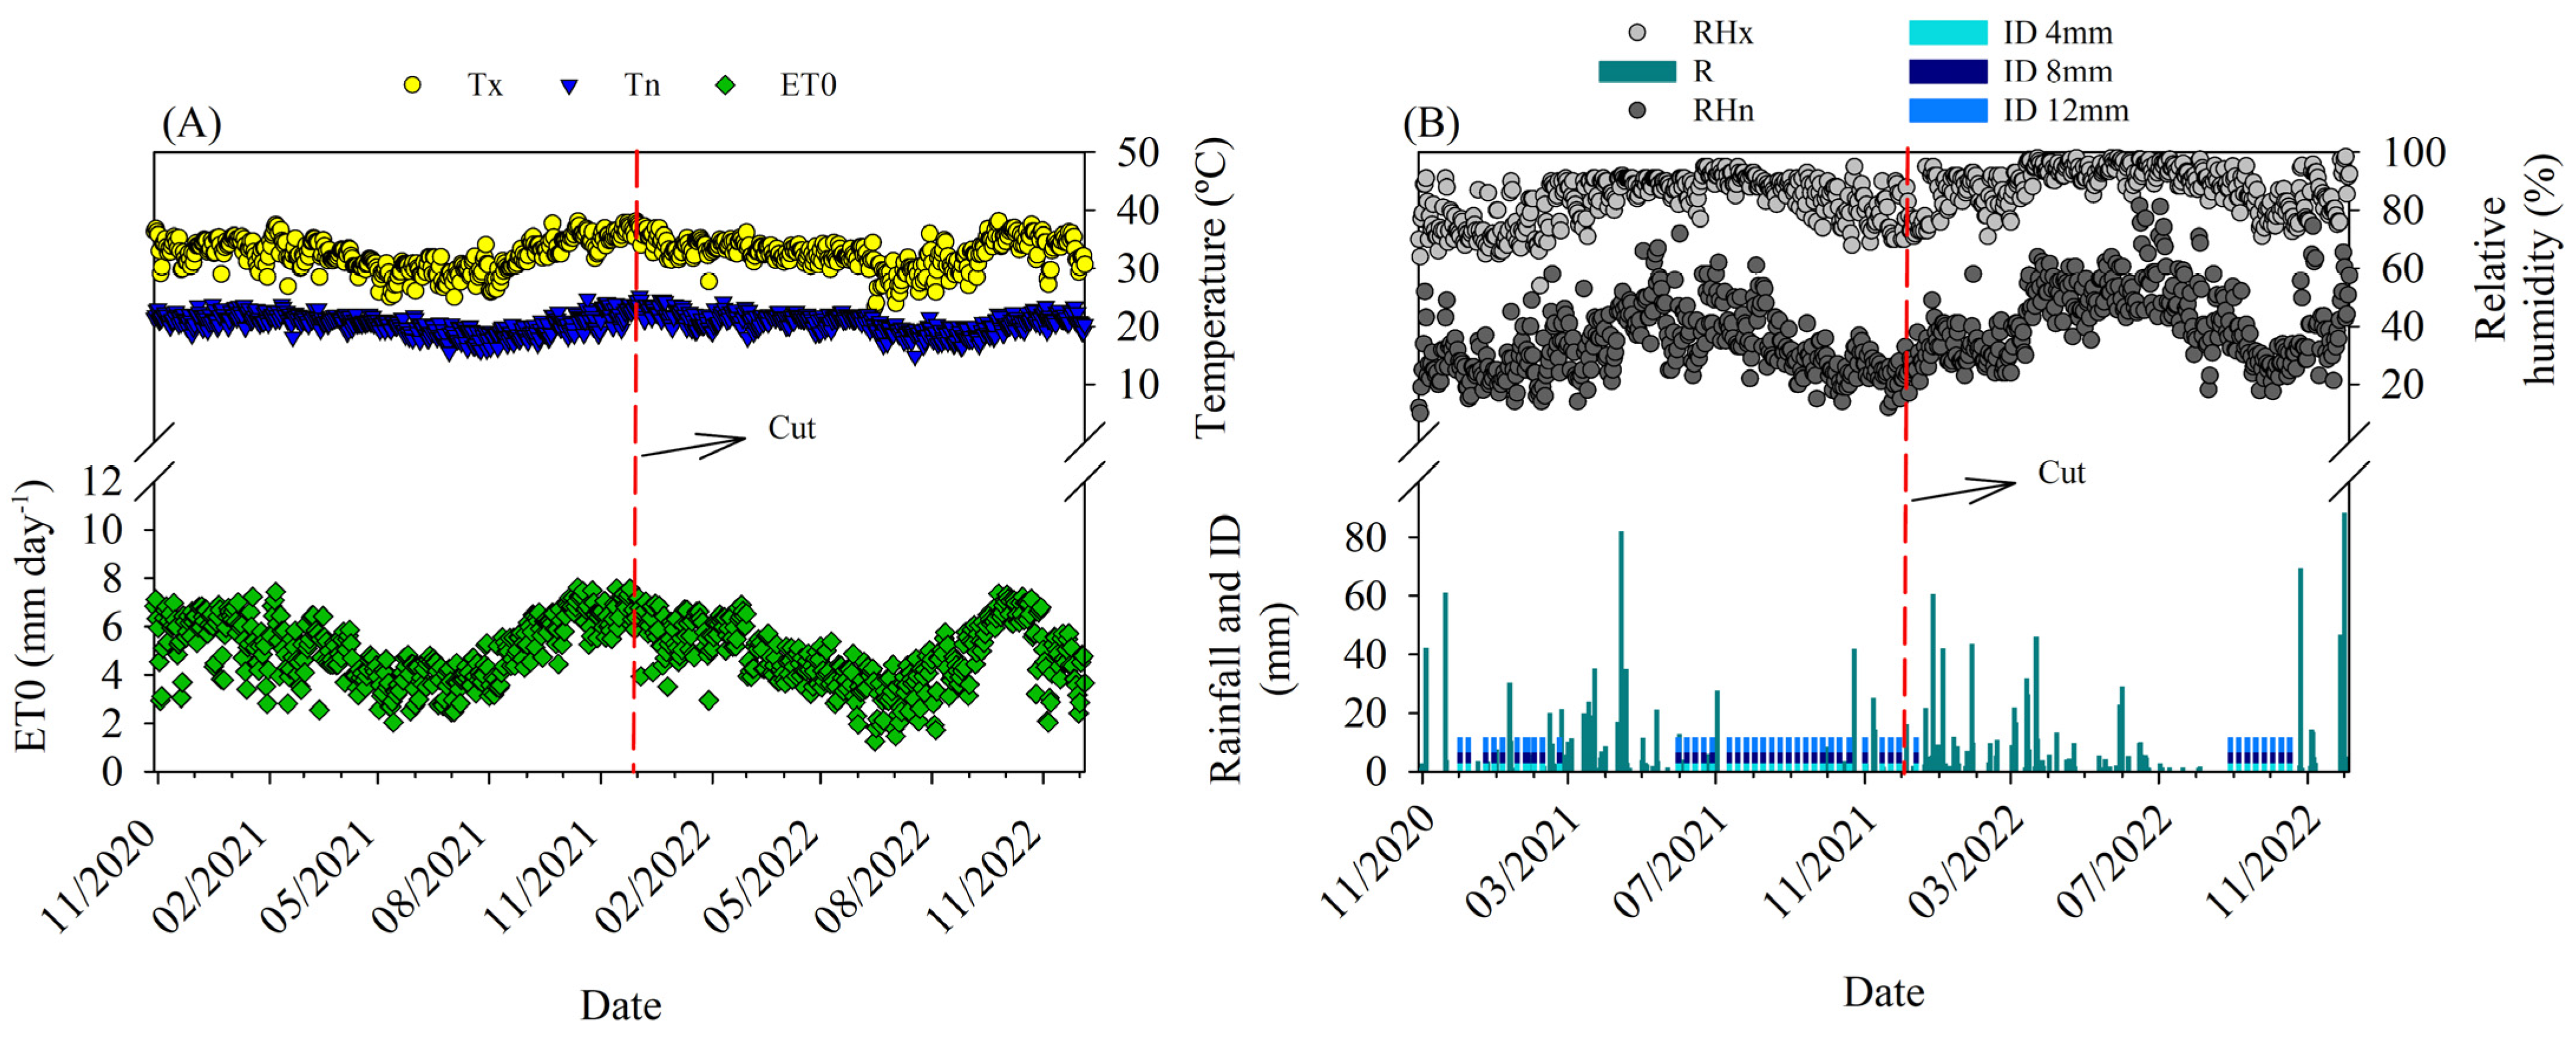
3.1. Water Balance
3.2. Structural Characteristics of Forage Cactus
3.3. Forage Yield
3.4. Morphophysiological Indices
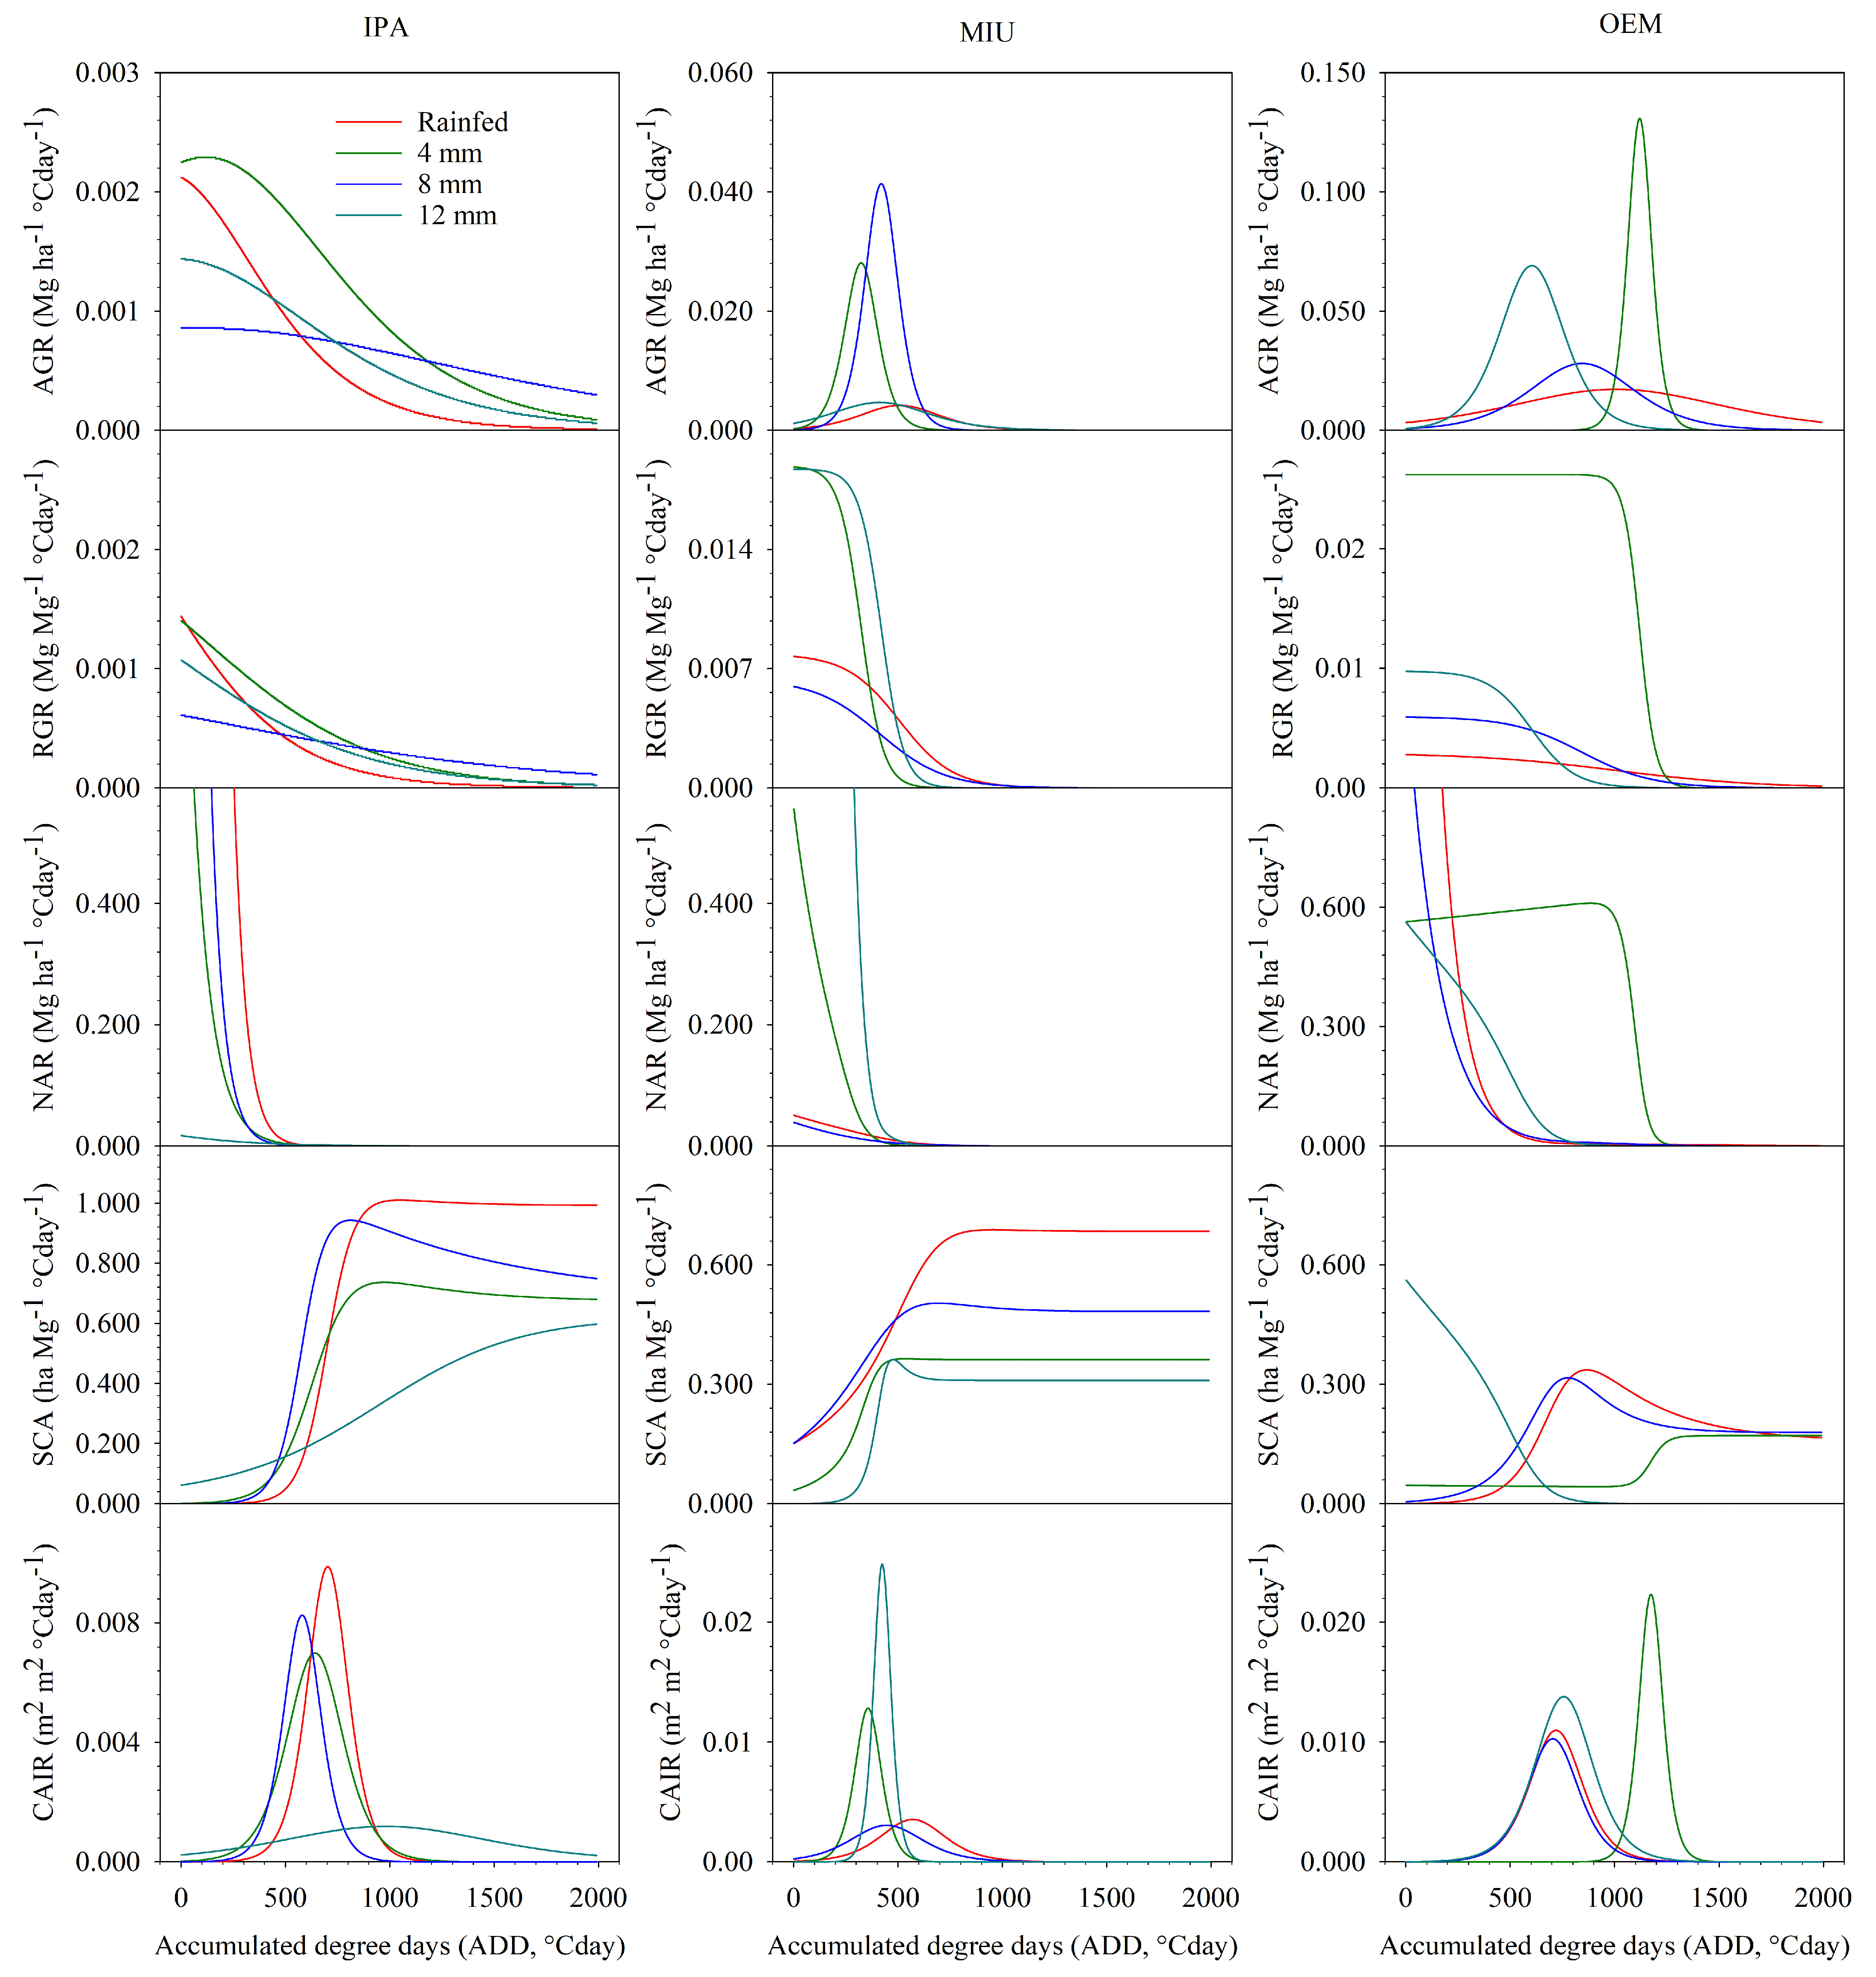
3.4.1. First Experimental Cycle
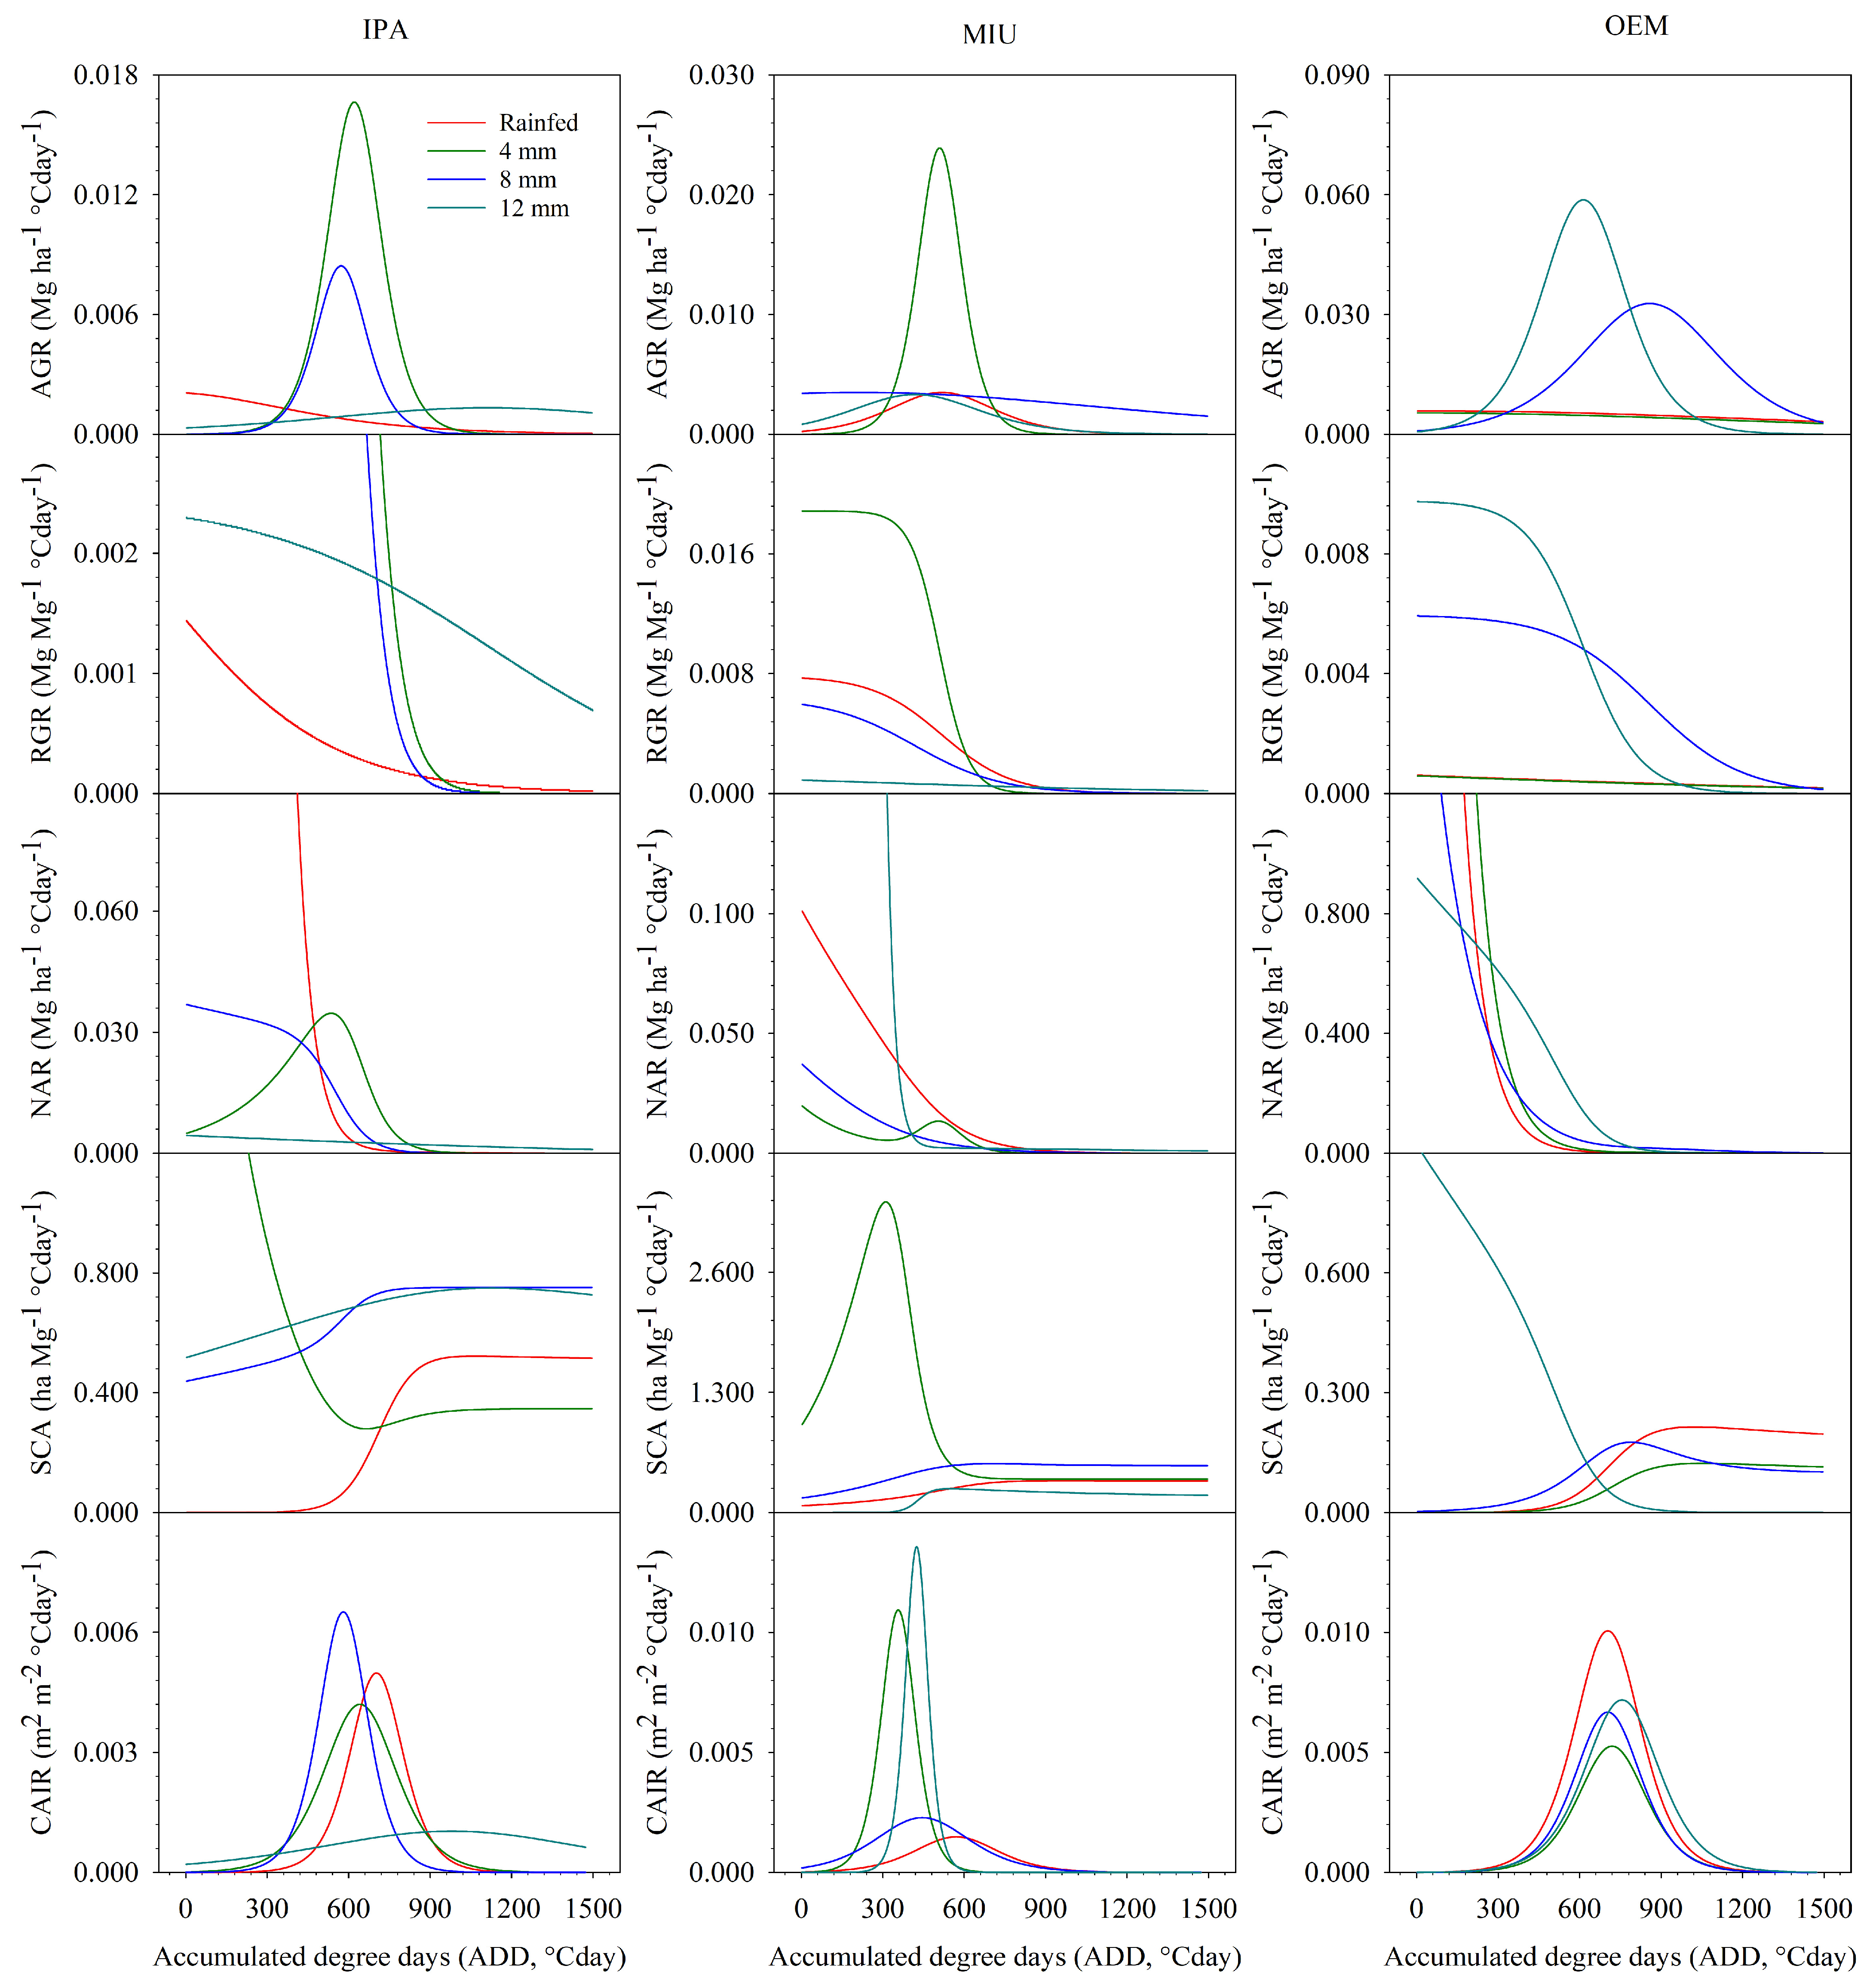
3.4.2. Second Experimental Cycle
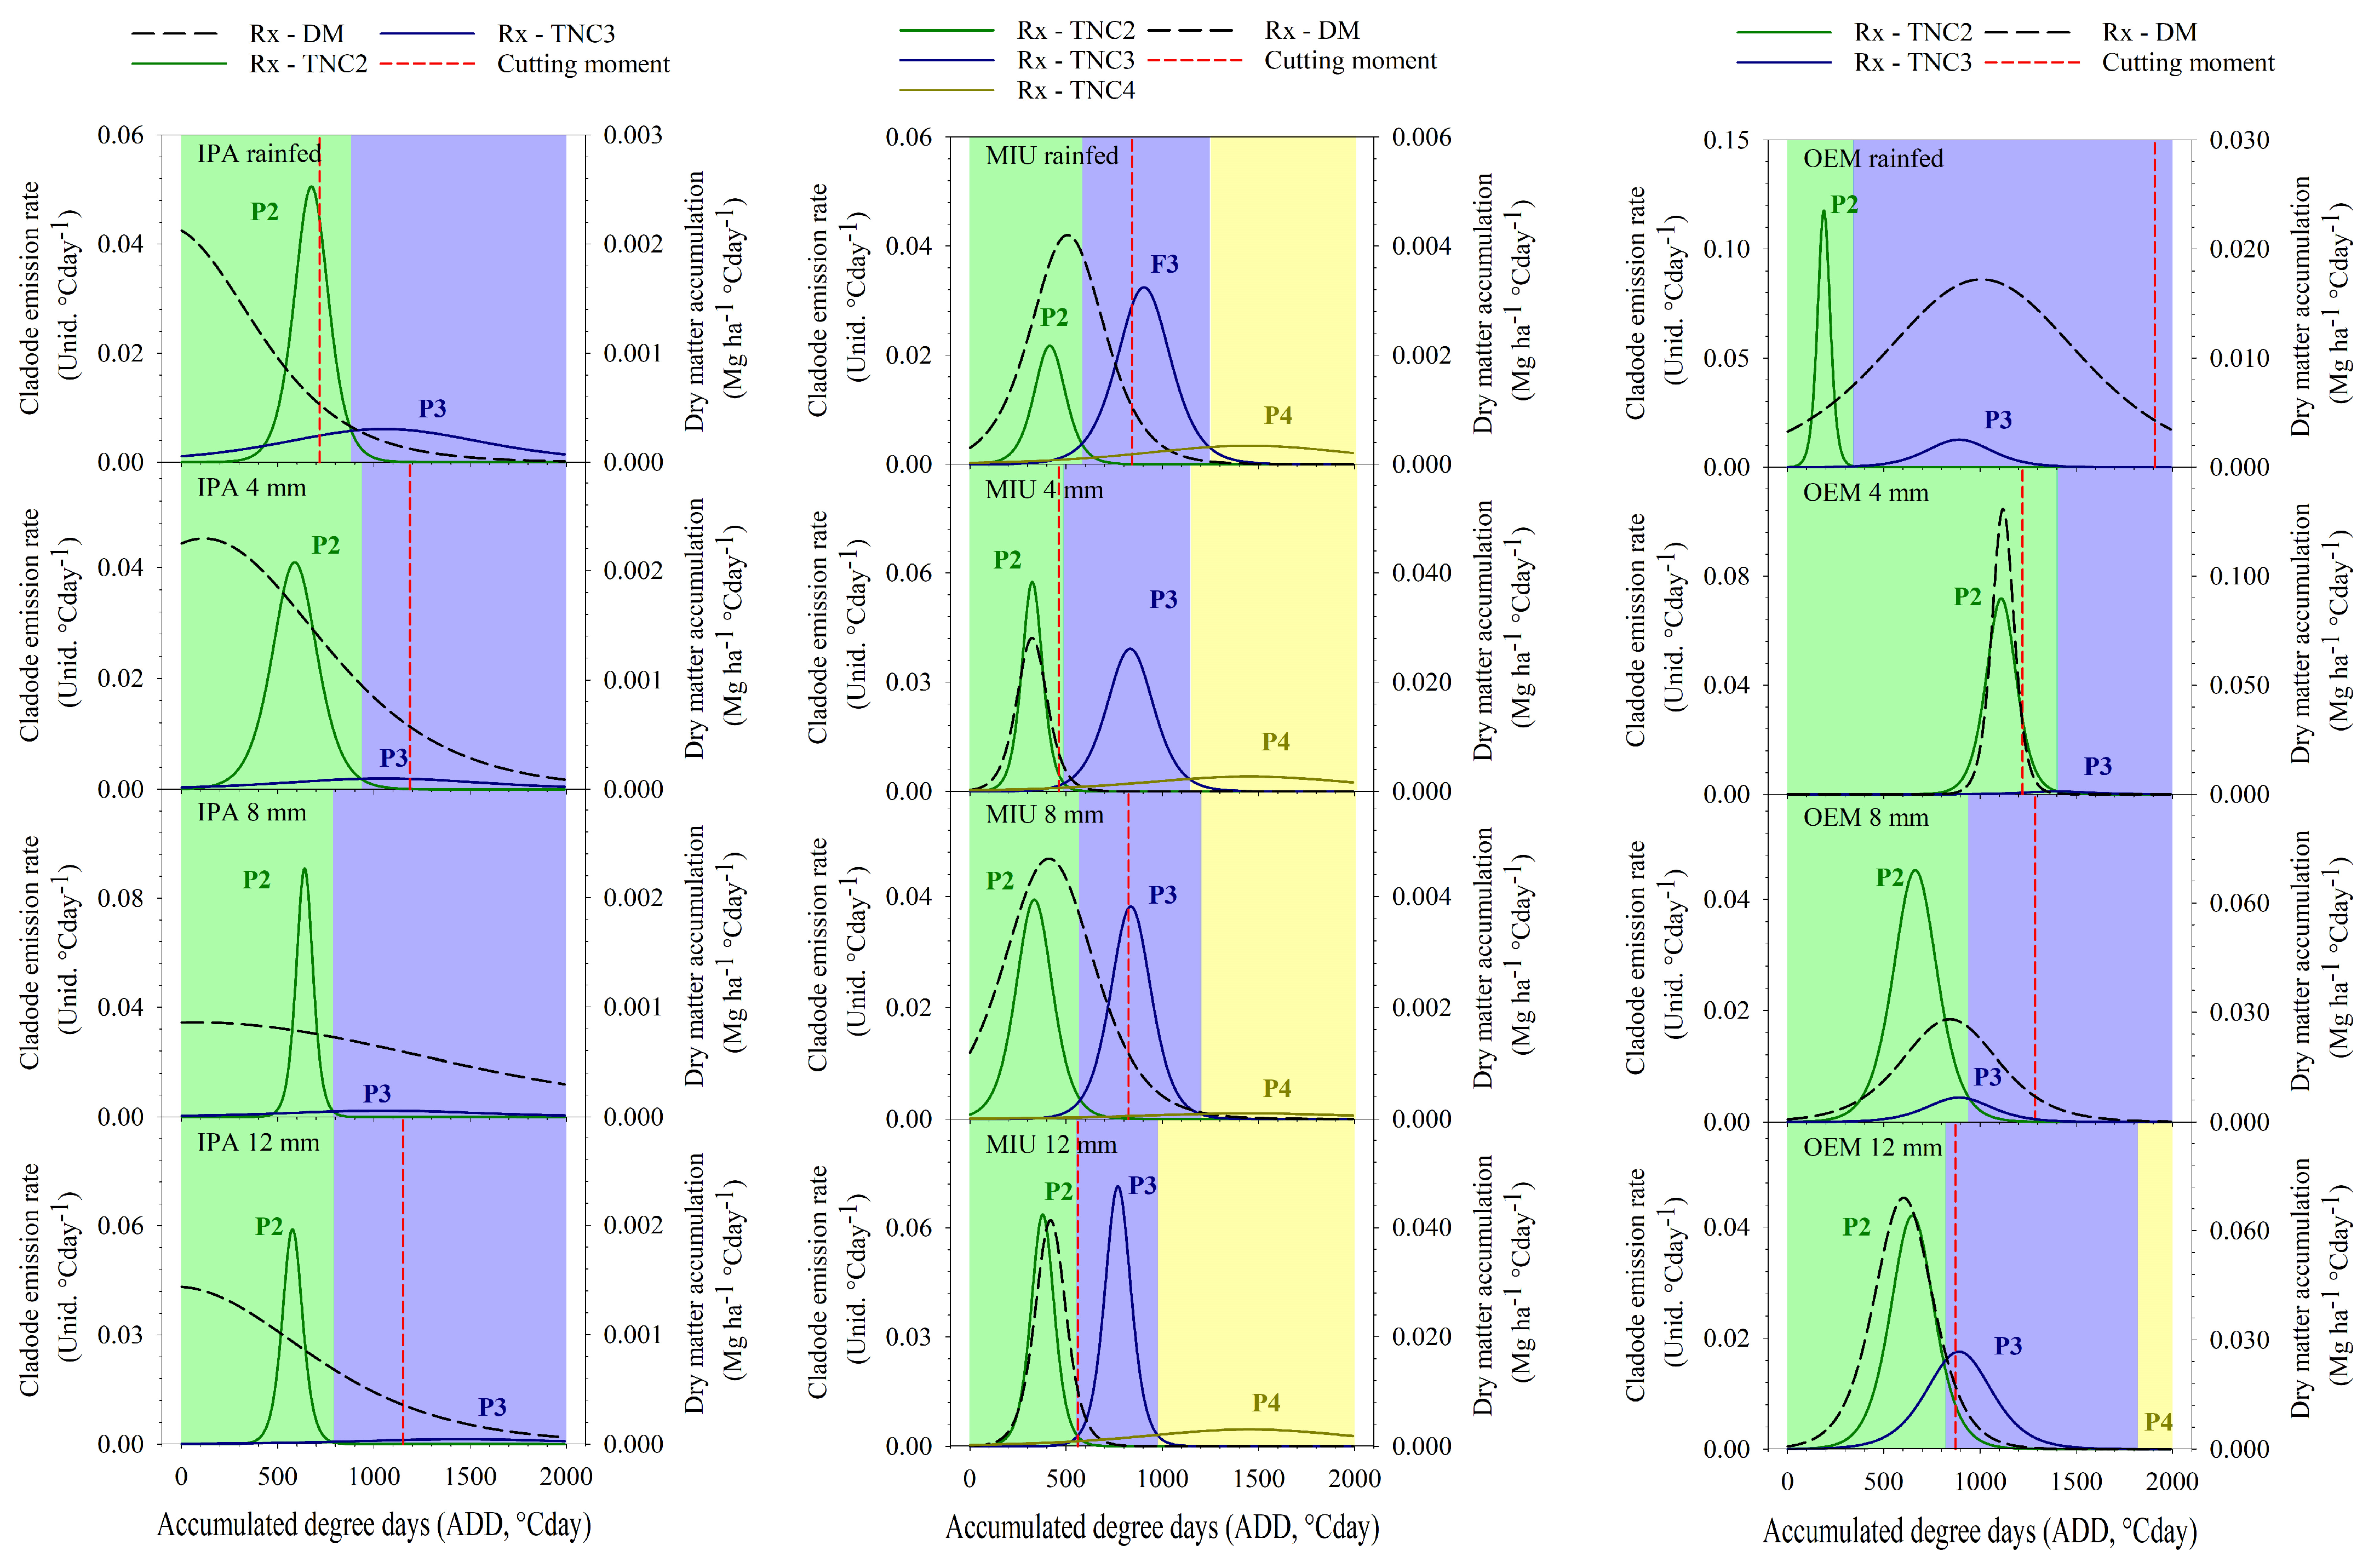
3.5. Phenophases and Cutting Moment
3.5.1. First Experimental Cycle
3.5.2. Second Experimental Cycle
3.6. Water Use and Economic Indicators
4. Discussion
4.1. Water Balance and Water Use Efficiency and Economic Indicators
4.2. Morphological Characteristics and Forage Yield
4.3. Phenophases and Cutting Moment
4.4. Morphophysiological Indices
5. Conclusions
Supplementary Materials
Author Contributions
Funding
Data Availability Statement
Acknowledgments
Conflicts of Interest
References
- Chikwanha, O.C.; Mupfiga, S.; Olagbegi, B.R.; Katiyatiya, C.L.F.; Molotsi, A.H.; Abiodun, B.J.; Dzama, K.; Mapiye, C. Impact of water scarcity on dryland sheep meat production and quality: Key recovery and resilience strategies. J. Arid. Environ. 2021, 190, 104511. [Google Scholar] [CrossRef]
- Lai, X.; Shen, Y.; Wang, Z.; Ma, J.; Yang, X.; Ma, L. Impact of precipitation variation on summer forage crop productivity and precipitation use efficiency in a semi-arid environment. Eur. J. Agron. 2022, 141, 126616. [Google Scholar] [CrossRef]
- Lal, B.; Sarkar, S.; Gautam, P.; Meena, R.L.; Bhatt, R.S.; Sahoo, A. Environmental impacts and resource use for sheep production in semi-arid India investigated by life cycle assessment. J. Clean. Prod. 2022, 345, 131088. [Google Scholar] [CrossRef]
- Kumar, S.; Mishra, A.K.; Pramanik, S.; Mamidanna, S.; Whitbread, A. Climate risk, vulnerability, and resilience: Supporting livelihood of smallholders in semiarid India. Land Use Policy 2020, 97, 104729. [Google Scholar] [CrossRef]
- Fust, P.; Schlecht, E. Importance of timing: Vulnerability of semi-arid rangeland systems to increased variability in temporal distribution of rainfall events as predicted by future climate change. Ecol. Model. 2022, 468, 109961. [Google Scholar] [CrossRef]
- Queiroz, M.G.; Silva, T.G.F.; Zolnier, S.; Jardim, A.M.R.F.; Souza, C.A.A.; Araújo Júnior, G.N.; Morais, J.E.F.; Souza, L.S.B. Spatial and temporal dynamics of soil moisture for surfaces with a change in land use in the semi-arid region of Brazil. Catena 2020, 188, 104457. [Google Scholar] [CrossRef]
- Jardim, A.M.R.F.; Souza, L.S.B.; Alves, C.P.; Araújo, J.F.N.; Souza, C.A.A.; Pinheiro, A.T.; Araújo, G.G.L.; Campos, F.S.; Tabosa, J.N.; Silva, T.G.F. Intercropping forage cactus with sorghum affects the morphophysiology and phenology of forage cactus. Afr. J. Range Forage Sci. 2021, 40, 129–140. [Google Scholar] [CrossRef]
- Alves, C.P.; Jardim, A.M.R.F.; Araújo Júnior, G.N.; Souza, L.S.B.; Araújo, G.G.L.; Souza, C.A.A.; Salvador, K.R.S.; Leite, R.M.C.; Pinheiro, A.G.; Silva, T.G.F. How to enhance the agronomic performance of cactus-sorghum intercropped system: Planting configurations, density, and orientation. Ind. Crop. Prod. 2022, 184, 115059. [Google Scholar] [CrossRef]
- Araújo, G.N., Jr.; Silva, T.G.F.; Souza, L.S.B.; Souza, M.S.; Araújo, G.G.L.; Moura, M.S.B.; Santos, J.P.A.S.; Jardim, A.M.R.F.; Alves, C.P.; Alves, H.K.M.N. Productivity, bromatological composition and economic benefits of using irrigation in the forage cactus under regulated deficit irrigation in a semiarid environment. Bragantia 2021, 80, e1221. [Google Scholar] [CrossRef]
- Campos, A.R.F.; Silva, A.J.P.; Van Lier, Q.J.; Nascimento, F.A.L.; Fernandes, R.D.M.; Almeida, J.N.; Paz, V.P.S. Yield and morphology of forage cactus cultivars under drip irrigation management based on soil water matric potential thresholds. J. Arid. Environ. 2021, 193, 104564. [Google Scholar] [CrossRef]
- Lankford, B.; Pringle, C.; McCosh, J.; Shabalala, M.; Hess, T.; Knox, J.W. Irrigation area, efficiency, and water storage mediate the drought resilience of irrigated agriculture in a semi-arid catchment. Sci. Total Environ. 2023, 859, 160263. [Google Scholar] [CrossRef]
- Jardim, A.M.R.F.; Santos, H.R.B.; Alves, H.K.M.N.; Ferreira-Silva, S.L.; Souza, L.S.B.; Araújo Júnior, G.N.; Souza, M.S.; Araújo, G.G.L.; Souza, C.A.A.; Silva, T.G.F. Genotypic differences relative photochemical activity, inorganic and organic solutes and yield performance in clones of the forage cactus under semi-arid environment. Plant Physiol. Biochem. 2021, 162, 421–430. [Google Scholar] [CrossRef]
- Silva, M.V.; Pandorf, H.; Almeida, G.L.P.; Lima, R.P.; Santos, A.; Jardim, A.M.R.F.; Rolim, M.M.; Silva, J.L.B.; Batista, P.H.D.; Silva, R.A.B.; et al. Spatio-temporal monitoring of soil and plant indicators under forage cactus cultivation by geoprocessing in Brazilian semi-arid region. J. S. Am. Earth Sci. 2021, 107, 103155. [Google Scholar] [CrossRef]
- Alves, H.K.M.N.; Silva, T.G.F.; Jardim, A.M.R.F.; Souza, L.S.B.; Araújo Júnior, G.N.; Souza, C.A.A.; Moura, M.S.B.; Araújo, G.G.L.; Campos, F.S.; Cruz Neto, J.F. The use mulch in cultivating the forage cactus optimizes yield in less time and increases the water use efficiency of the crop. Irrig. Drain. 2022, 72, 75–89. [Google Scholar] [CrossRef]
- Souza, M.S.; Araújo Júnior, G.N.; Souza, L.S.B.; Jardim, A.M.R.F.; Silva, G.I.N.; Araújo, G.G.L.; Campos, F.S.; Leite, M.L.M.V.; Tabosa, J.N.; Silva, T.G. Forage yield, competition and economic benefit of intercropping cactus and millet with mulch in a semi-arid environment. Afr. J. Range Forage Sci. 2022, 40, 219–230. [Google Scholar] [CrossRef]
- Rocha Filho, R.R.; Santos, D.C.; Véras, A.S.C.; Siqueira, M.C.B.; Novaes, L.P.; Mora-Luna, R.; Monteiro, C.C.F.; Ferreira, M.A. Can spineless forage cactus be the queen of forage crops in dryland areas? J. Arid. Environ. 2021, 186, 104426. [Google Scholar] [CrossRef]
- Araújo Júnior, G.N.; Jardim, A.M.R.F.; Silva, M.J.; Alves, C.P.; Souza, C.A.A.; Costa, S.A.T.; Cunha, M.V.; Simões, A.N.; Silva, J.R.I.; Souza, L.S.B.; et al. Growth dynamics and accumulation of forage mass of forage cactus clones as affected by meteorological variables and water regime. Eur. J. Agron. 2021, 131, 126375. [Google Scholar] [CrossRef]
- Araújo Júnior, G.N.; Silva, T.G.F.; Souza, L.S.B.; Araújo, G.G.L.; Moura, M.S.B.; Alves, C.P.; Salvador, K.R.S.; Souza, C.A.A.; Montenegro, A.A.A.; Silva, M.J. Phenophases, morphophysiological indices and cutting time in clone of the forage cacti under controlled water regimes in a semiarid environment. J. Arid. Environ. 2021, 190, 104510. [Google Scholar] [CrossRef]
- Lima, L.R.; Silva, T.G.F.; Jardim, A.M.R.F.; Souza, C.A.A.; Queiroz, M.G.; Tabosa, J.N. Growth, water use, and efficiency of forage cactus sorghum intercropping under different water depths. Rev. Bras. Eng. Agríc. Ambient. 2018, 22, 113–118. [Google Scholar] [CrossRef]
- Silva, E.C.B.; Lima, J.R.S.; Antonino, A.C.D.; Melo, A.A.S.; Souza, E.S.; Souza, R.M.S.; Silva, V.P.; Oliveira, C.L. Efeito da Irrigação Suplementar na Produtividade e Eficiência no Uso de Água da Palma Forrageira. Rev. Bras. Geogr. Física 2020, 13, 2744–2759. [Google Scholar] [CrossRef]
- Fonseca, V.A.; Santos, M.R.; Silva, J.A.; Donato, S.L.R.; Rodrigues, C.S.; Brito, C.F.B. Morpho-physiology, yield, and water-use efficiency of Opuntia ficus-indica irrigated with saline water. Acta Sci.—Agron. 2019, 41, 42631. [Google Scholar] [CrossRef]
- Fernández, J.E.; Alcon, F.; Diaz-Espejo, A.; Hernandez-Santana, V.; Cuevas, M.V. Water use indicators and economic analysis for on-farm irrigation decision: A case study of a super high density olive tree orchard. Agric. Water Manag. 2020, 237, 106074. [Google Scholar] [CrossRef]
- Singh, A. Judicious and optimal use of water and land resources for long-term agricultural sustainability. Resour. Conserv. Recycl. Adv. 2022, 13, 200067. [Google Scholar] [CrossRef]
- Queiroz, M.G.; Silva, T.G.F.; Zolnier, S.; Silva, S.M.S.; Lima, L.R.; Alves, J.O. Características morfofisiológicas e produtividade da palma forrageira em diferentes lâminas de irrigação. Rev. Bras. Eng. Agríc. Ambient. 2015, 19, 931–938. [Google Scholar] [CrossRef]
- Alvares, C.A.; Stape, J.L.; Sentelhas, P.C.; Gonçalves, J.L.M.; Sparovek, G. Koppen’s climate classification map of Brazil. Meteorol. Z. 2013, 22, 711–728. [Google Scholar] [CrossRef]
- Beck, H.E.; Zimmerman, N.E.; McVicar, T.R.; Vergopolan, N.; Berg, A.; Wood, E.F. Present and future Köppen-Geiger climate classification maps at 1-km resolution. Sci. Data 2018, 5, 180214. [Google Scholar] [CrossRef]
- Pereira, P.D.C.; Silva, T.G.F.; Zolnier, S.; Morais, J.E.F.; Santos, D.C. Growth evolution of cactus forage drip irrigated. Rev. Caatinga 2015, 28, 184–195. [Google Scholar] [CrossRef]
- Soil Survey Staff. Keys to Soil Taxonomy, 12th ed.; USDA-Natural Resources Conservation Service: Washington, DC, USA, 2014. [Google Scholar]
- Richards, L.A. Diagnose and Improvement of Saline and Alkali Soils; Handbook, 60; USDA: Washington, DC, USA, 1954; 60p. [Google Scholar]
- Allen, R.G.; Pereira, L.S.; Raes, D.; Smith, M. Crop Evapotranspiration: Guidelines for Computing Crop Requirements; FAO. Irrigation and Dranaige Paper, 56; FAO: Rome, Italy, 1998; 300p. [Google Scholar]
- Libardi, P.L. Dinâmica da Água no Solo; Editora da Universidade de São Paulo: São Paulo, Brazil, 2005. [Google Scholar]
- Silva, T.G.F.; Miranda, K.R.; Santos, D.C.; Queiroz, M.G.; Silva, M.C.; Cruz Neto, J.F.; Araújo, J.E.M. Área do cladódio de clones de palma forrageira: Modelagem, análise e aplicabilidade. Rev. Bras. Ciências Agrárias 2014, 9, 633–641. [Google Scholar] [CrossRef]
- Souza, M.S.; Silva, T.G.F.; Souza, L.S.B.; Alves, H.C.M.N.; Leite, R.M.C.; Souza, C.A.A.; Araújo, G.G.L.; Campos, F.S.; Silva, M.J.D.; Souza, P.J.D.O.P. Growth, phenology and harvesting time oof cactus-millet intercropping system under biotic mulching. Arch. Agron. Soil Sci. 2021, 67, 1852553. [Google Scholar] [CrossRef]
- R Core Team. R: A Language and Environment for Statistical Computing; R Foundation for Statistical Computing: Vienna, Austria, 2022; Available online: https://www.R-project.org/ (accessed on 25 January 2023).
- Araújo Primo, J.T.; Silva, T.G.F.; Silva, S.M.S.; Moura, M.S.B.; Souza, L.S.B. Calibração de sondas capacitivas, funções físico-hídricas e variação do armazenamento de água em um argissolo cultivado com palma forrageira. Rev. Ceres 2015, 62, 20–29. [Google Scholar] [CrossRef]
- Morais, J.E.F.; Silva, T.G.F.; Queiroz, M.G.; Araújo, G.G.L.; Moura, M.S.B.; Araújo Júnior, G.N. Hydrodynamic changes of the soil-cactus interface, effective actual evapotranspiration, and its water efficiency under irrigation. Rev. Bras. Eng. Agríc. Ambient. 2017, 21, 273–278. [Google Scholar] [CrossRef]
- Expósito, A.; Berbel, J. Agricultural irrigation water use in a closed basin and the impacts on water productivity: The case of the Guadalquivir River Basin (Southern Spain). Water 2017, 9, 136. [Google Scholar] [CrossRef]
- Grafton, R.Q.; Williams, J.; Perry, C.J.; Molle, F.; Ringler, C.; Steduto, P.; Udall, B.; Wheeler, S.A.; Wang, Y.; Garrick, D.; et al. The paradox of irrigation efficiency. Science 2018, 361, 748–750. [Google Scholar] [CrossRef] [PubMed]
- Velasco-Muñoz, J.F.; Aznar-Sánchez, J.; Belmonte-Ureña, L.J.; Román-Sánchez, I.M. Sustainable water use in agriculture: A review of worldwide research. Sustainability 2018, 10, 1084. [Google Scholar] [CrossRef]
- Dubeux Júnior, J.C.B.; Santos, M.V.F.; Cunha, M.V.; Santos, D.C.; Souza, R.T.A.; Mello, A.C.L.; Souza, T.C. Cactus (Opuntia and Nopalea) nutritive value: A review. Anim. Feed. Sci. Technol. 2021, 275, 114890. [Google Scholar] [CrossRef]
- Araújo, G.N., Jr.; Souza, L.S.B.; Jardim, A.M.R.F.; Alves, C.P.; Assis, M.C.S.; Silva, J.O.N.; Souza, C.A.A.; Pinheiro, A.G.; Oliveira, A.C.; Silva, T.G.F. The association between morphological characteristics and yield in forage cactus cactus varies according to water regimes: A principal component analysis. J. Prof. Assoc. Cactus Dev. 2022, 24, 83–95. [Google Scholar] [CrossRef]
- Silva, T.G.F.; Araújo Primo, J.T.; Morais, J.E.F.; Diniz, W.J.S.; Souza, C.A.A.; Silva, M.C. Crescimento e produtividade de clones de palma forrageira no Semiárido e relações com variáveis meteorológicas. Rev. Caat 2015, 28, 10–18. [Google Scholar]
- Cruz, P.E.; Pavón, N.P. Reproductive phenology of Isolatocereus dumortieri (Cactaceae) in semiarid scrub in central Mexico: Effect of rain during the dry season. J. Arid. Environ. 2013, 92, 53–58. [Google Scholar] [CrossRef]
- Amorim, D.M.; Silva, T.G.F.; Pereira, P.C.; Souza, L.S.B.; Minuzzi, R.B. Phenophases and cutting time of forage cactus under irrigation and cropping systems. Pesqui. Agropecu. Trop. 2017, 47, 62–71. [Google Scholar] [CrossRef]
- Arba, M.; Falisse, A.; Choukr-Allah, R.; Sindic, M. Effect of irrigation at critical stages on the phenology of flowering and fruiting of the cactus Opuntia spp. Braz. J. Biol. 2018, 78, 653–660. [Google Scholar] [CrossRef]
- Garofalo, P.; Rinaldi, M. Leaf gas exchange and radiation use efficiency of sunflower (Helianthus annum L.) in response to different deficit irrigation strategies: From solar radiation to plant growth analysis. Eur. J. Agron. 2015, 64, 88–97. [Google Scholar] [CrossRef]
- Zhang, Z.; Christensen, M.; Nan, Z.; Whish, J.P.M.; Bell, L.W.; Wang, J.; Wang, Z.; Sim, R. Plant development and solar radiation interception of four annual forage plants in response to sowing date in a semi-arid environment. Ind. Crop. Prod. 2019, 131, 41–53. [Google Scholar] [CrossRef]
- Franck, N.; Muños, V.; Alfaro, F.; Arancibia, D.; Pérez-Quezada, J. Estimating the Carbon Assimilation of Growing Cactus Pear Cladodes through Different Methods. Acta Hortic. 2013, 19, 157–164. [Google Scholar] [CrossRef]


| Physical Properties | ||||||||||
| Depth | ρd | Ø | Sand | Silt | Clay | |||||
| cm | kg dm−3 | % | ------------------------ g kg−1 ------------------------- | |||||||
| 0–20 | 1.45 | 42.27 | 828.6 | 148.3 | 23.2 | |||||
| 20–40 | 1.34 | 46.76 | 795.4 | 160.1 | 44.6 | |||||
| Chemical Properties | ||||||||||
| Depth | E.C. | pH | C | P | K | Na | Ca | Mg | CEC | V |
| cm | dS cm−1 | g kg−1 | mg dm−3 | ------------------ cmolc dm−3 ------------------ | % | |||||
| 0–20 | 0.33 | 6.0 | 4.6 | 168.9 | 13.8 | 1.09 | 3.5 | 1.90 | 20.9 | 97.2 |
| 20–40 | 0.24 | 6.3 | 3.0 | 154.1 | 11.8 | 1.47 | 2.9 | 1.75 | 18.3 | 98.7 |
| Cycle 1 | Cycle 2 | ||||||||||||||||||||||
| IPA Rainfed | MIU Rainfed | OEM Rainfed | IPA Rainfed | MIU Rainfed | OEM Rainfed | ||||||||||||||||||
| Per. | Days | R + ID | Δs | ET | ETd | Δs | ET | ETd | Δs | ET | ETd | Per. | Days | R + ID | Δs | ET | ETd | Δs | ET | ETd | Δs | ET | ETd |
| 1 | 77 | 92 | −6 | −83 | −1.1 | −5 | −82 | −1.1 | −3 | −80 | −1.0 | 1 | 77 | 282 | 23 | −188 | −2.4 | 22 | −188 | −2.4 | 14 | −196 | −2.5 |
| 2 | 77 | 376 | 14 | −225 | −2.9 | 11 | −228 | −3.0 | 12 | −227 | −3.0 | 2 | 77 | 124 | −10 | −121 | −1.6 | −12 | −123 | −1.6 | −9 | −119 | −1.5 |
| 3 | 77 | 78 | −18 | −87 | −1.1 | −18 | −87 | −1.1 | −12 | −81 | −1.1 | 3 | 77 | 46 | −18 | −58 | −0.7 | −18 | −58 | −0.8 | −12 | −52 | −0.7 |
| 4 | 77 | 10 | −12 | −21 | −0.3 | −11 | −20 | −0.3 | −15 | −24 | −0.3 | 4 | 77 | 107 | −12 | −86 | −1.1 | −11 | −85 | −1.1 | −15 | −88 | −1.1 |
| 5 | 91 | 261 | 17 | −179 | −2.0 | 19 | −177 | −1.9 | 20 | −175 | −1.9 | 5 | 21 | 47 | 6 | −29 | −1.4 | 9 | −26 | −1.2 | 5 | −30 | −1.4 |
| - | 399 | 816 | −5 | −595 | −1.5 | −4 | −594 | −1.5 | 3 | −587 | −1.5 | - | 329 | 607 | −11 | −481 | −1.5 | −9 | −479 | −1.4 | −16 | −486 | −1.5 |
| IPA 4 mm | MIU 4 mm | OEM 4 mm | IPA 4 mm | MIU 4 mm | OEM 4 mm | ||||||||||||||||||
| 1 | 77 | 121 | 0 | −103 | −1.3 | 2 | −101 | −1.3 | −5 | −108 | −1.4 | 1 | 77 | 282 | 18 | −193 | −2.5 | 20 | −191 | −2.5 | 14 | −197 | −2.6 |
| 2 | 77 | 376 | 11 | −228 | −3.0 | 7 | −232 | −3.0 | 11 | −228 | −3.0 | 2 | 77 | 124 | −11 | −121 | −1.6 | −12 | −123 | −1.6 | −11 | −121 | −1.6 |
| 3 | 77 | 114 | −14 | −115 | −1.5 | −17 | −119 | −1.5 | −7 | −109 | −1.4 | 3 | 77 | 46 | −14 | −54 | −0.7 | −17 | −57 | −0.7 | −7 | −47 | −0.6 |
| 4 | 77 | 46 | −12 | −57 | −0.7 | −10 | −55 | −0.7 | −17 | −62 | −0.8 | 4 | 77 | 140 | −12 | −117 | −1.5 | −10 | −116 | −1.5 | −17 | −123 | −1.6 |
| 5 | 91 | 280 | 18 | −191 | −2.1 | 20 | −190 | −2.1 | 22 | −188 | −2.1 | 5 | 21 | 54 | 10 | −33 | −1.5 | 11 | −32 | −1.5 | 6 | −36 | −1.7 |
| - | 399 | 936 | 3 | −695 | −1.7 | 1 | −697 | −1.7 | 3 | −695 | −1.7 | - | 329 | 647 | −9 | −518 | −1.6 | −9 | −518 | −1.6 | −16 | −525 | −1.6 |
| IPA 8 mm | MIU 8 mm | OEM 8 mm | IPA 8 mm | MIU 8 mm | OEM 8 mm | ||||||||||||||||||
| 1 | 77 | 150 | 6 | −122 | −1.6 | 1 | −127 | −1.6 | 3 | −125 | −1.6 | 1 | 77 | 282 | 21 | −190 | −2.5 | 17 | −193 | −2.5 | 15 | −195 | −2.5 |
| 2 | 77 | 376 | 2 | −237 | −3.1 | 7 | −232 | −3.0 | 4 | −235 | −3.1 | 2 | 77 | 124 | −12 | −123 | −1.6 | −12 | −123 | −1.6 | −11 | −122 | −1.6 |
| 3 | 77 | 151 | −8 | −141 | −1.8 | −3 | −136 | −1.8 | −5 | −138 | −1.8 | 3 | 77 | 46 | −8 | −48 | −0.6 | −3 | −43 | −0.6 | −5 | −45 | −0.6 |
| 4 | 77 | 83 | −6 | −85 | −1.1 | −11 | −90 | −1.2 | −11 | −90 | −1.2 | 4 | 77 | 172 | −6 | −142 | −1.8 | −11 | −148 | −1.9 | −11 | −147 | −1.9 |
| 5 | 91 | 298 | 4 | −218 | −2.4 | 9 | −213 | −2.3 | 12 | −211 | −2.3 | 5 | 21 | 62 | 8 | −41 | −2.0 | 4 | −44 | −2.1 | 8 | −41 | −1.9 |
| - | 399 | 1056 | −1 | −802 | −2.0 | 2 | −799 | −2.0 | 2 | −799 | −2.0 | - | 329 | 687 | 3 | −543 | −1.7 | −5 | −551 | −1.7 | −3 | −550 | −1.7 |
| IPA 12 mm | MIU 12 mm | OEM 12 mm | IPA 12 mm | MIU 12 mm | OEM 12 mm | ||||||||||||||||||
| 1 | 77 | 179 | 4 | −147 | −1.9 | −3 | −154 | −2.0 | −1 | −152 | −2.0 | 1 | 77 | 282 | 21 | −189 | −2.5 | 19 | −192 | −2.5 | 17 | −194 | −2.5 |
| 2 | 77 | 376 | 3 | −236 | −3.1 | 10 | −229 | −3.0 | 7 | −232 | −3.0 | 2 | 77 | 124 | −11 | −122 | −1.6 | −10 | −121 | −1.6 | −13 | −124 | −1.6 |
| 3 | 77 | 187 | −2 | −165 | −2.1 | −8 | −171 | −2.2 | 2 | −160 | −2.1 | 3 | 77 | 46 | −2 | −42 | −0.5 | −8 | −48 | −0.6 | 2 | −38 | −0.5 |
| 4 | 77 | 119 | −9 | −121 | −1.6 | −10 | −122 | −1.6 | −11 | −123 | −1.6 | 4 | 77 | 205 | −9 | −175 | −2.3 | −10 | −176 | −2.3 | −11 | −176 | −2.3 |
| 5 | 91 | 316 | 1 | −235 | −2.6 | 10 | −225 | −2.5 | 5 | −231 | −2.5 | 5 | 21 | 69 | 3 | −53 | −2.5 | 9 | −47 | −2.2 | 2 | −53 | −2.5 |
| - | 399 | 1177 | −4 | −903 | −2.3 | −2 | −901 | −2.2 | 2 | −897 | −2.2 | - | 329 | 727 | 2 | −580 | −1.9 | −1 | −584 | −1.8 | −2 | −585 | −1.9 |
| Cycle 1 | Cycle 2 | ||||||||||
| Variables | Cactus | Rainfed | 4 mm | 8 mm | 12 mm | Variables | Cactus | Rainfed | 4 mm | 8 mm | 12 mm |
| PH | IPA | 84.2 b | 94.2 | 90.7 | 69.7 b | PH | IPA | 69.2 | 82.5 | 78.7 | 75.5 |
| MIU | 72.9 b | 84.2 | 75.5 | 87.5 ab | MIU | 60.7 | 74.5 | 77.2 | 69.2 | ||
| OEM | 95.2 Aba | 79.1 B | 86.2 AB | 107.0 Aa | OEM | 81.0 | 82.5 | 80.7 | 83.7 | ||
| PW | IPA | 71.2 | 75.1 | 78.7 a | 64.5 | PW | IPA | 58.7 | 70.0 | 72.6 | 63.5 |
| MIU | 65 | 67.6 | 54.3 b | 76.2 | MIU | 58.8 | 78.8 | 58.1 | 67.0 | ||
| OEM | 70.6 | 66.5 | 66.8 ab | 75.1 | OEM | 68.3 | 59.4 | 75.2 | 70.9 | ||
| TNC | IPA | 27.0 | 21.5 | 18.2 | 16.0 b | TNC | IPA | 17.0 ab | 15.2 b | 16.7 | 15.0 b |
| MIU | 26.5 | 31.7 | 26.0 | 38.7 a | MIU | 15.3 Bb | 29.8 Aa | 17.3 B | 28.0 Aa | ||
| OEM | 22.2 | 22.2 | 22.2 | 26.2 bc | OEM | 26.0 a | 17.0 b | 19.0 | 21.7 ab | ||
| NC1 | IPA | 5.0 ab | 4.7 | 3.5 | 4.7 | NC1 | IPA | 6.0 ab | 4.2 | 6.2 a | 5.5 |
| MIU | 2.7 b | 3.5 | 3.2 | 3.7 | MIU | 3.5 b | 4.5 | 3.0 b | 3.7 | ||
| OEM | 5.2 a | 5.7 | 5.5 | 4.2 | OEM | 6.2 a | 4.7 | 4.7 ab | 5.7 | ||
| NC2 | IPA | 12.0 | 12.7 | 10.5 | 8.2 | NC2 | IPA | 10.0 ab | 9.7 | 9.0 | 8.5 |
| MIU | 4.7 | 8.2 | 10.0 | 10.2 | MIU | 4.7 b | 10.5 | 6.5 | 10.8 | ||
| OEM | 10.2 | 15.0 | 13.7 | 12.7 | OEM | 14.3 a | 9.5 | 10.0 | 10.7 | ||
| NC3 | IPA | 8.5 ab | 2.7 b | 3.2 b | 2.0 b | NC3 | IPA | 0.5 b | 0.2 b | 0.5 b | 0.0 b |
| MIU | 12.0 a | 12.7 a | 10.7 a | 13.0 a | MIU | 5.2 Ba | 9.5 Aba | 6.2 Aba | 10.2 Aa | ||
| OEM | 5.7 b | 0.5 b | 2.0 b | 8.0 ab | OEM | 4.5 ab | 1.7 b | 3.2 ab | 4.2 b | ||
| NC4 | IPA | 0.5 | 0.0 | 0.0 | 0.0 | NC4 | IPA | 0.0 | 0.0 b | 0.0 | 0.0 b |
| MIU | 5.0 | 6.0 | 1.5 | 6.7 | MIU | 0.7 B | 4.0 Aa | 0.5 B | 2.2 Aba | ||
| OEM | 0.0 | 0.0 | 0.0 | 0.2 | OEM | 0.0 | 0.0 b | 0.0 | 0.0 b | ||
| NC5 | IPA | 0.0 | 0.0 | 0.0 | 0.0 | NC5 | IPA | 0.0 | 0.0 | 0.0 | 0.0 |
| MIU | 1.0 | 0.2 | 0.0 | 4.0 | MIU | 0.0 | 0.2 | 0.0 | 0.0 | ||
| OEM | 0.0 | 0.0 | 0.0 | 0.0 | OEM | 0.0 | 0.0 | 0.0 | 0.0 | ||
| CL | IPA | 24.6 Ba | 28.1 Aba | 29.5 Aa | 26.9 Aba | CL | IPA | 24.5 Ba | 25.5 Aba | 29.4 Aa | 26.8 Aba |
| MIU | 16.7 b | 19.7 b | 18.4 b | 20.3 b | MIU | 16.6 b | 18.7 b | 20.0 b | 17.5 b | ||
| OEM | 27.4 a | 28.5 a | 28.5 a | 27.4 a | OEM | 24.0 a | 24.9 a | 26.6 a | 25.2 a | ||
| CW | IPA | 14.8 b | 16.0 b | 18.3 b | 16.6 b | CW | IPA | 14.3 Bb | 13.7 Abb | 17.0 Ab | 17.0 Abb |
| MIU | 8.9 Cc | 13.2 b | 10.5 c | 10.2 c | MIU | 8.3 c | 10.1 c | 11.2 c | 10.1 c | ||
| OEM | 21.3 a | 23.8 a | 23.8 a | 22.9 a | OEM | 18.8 a | 20.2 a | 21.9 a | 21.0 a | ||
| CT | IPA | 33.0 a | 27.6 | 29.4 | 32.7 | CT | IPA | 25.1 | 27.9 | 25.9 | 36.2 a |
| MIU | 24.9 b | 23.9 | 27.5 | 28.4 | MIU | 19.6 | 23.3 | 24.5 | 27.5 ab | ||
| OEM | 22.5 b | 28.1 | 23.9 | 26.4 | OEM | 21.7 | 24.1 | 20.6 | 23.2 b | ||
| CP | IPA | 59.1 Cb | 66.4 Abb | 69.4 Aa | 62.2 BCb | CP | IPA | 57.4 Bb | 63.8 Aba | 64.7 Aa | 65.3 Aba |
| MIU | 39.5 c | 45.5 c | 41.9 b | 46.1 c | MIU | 38.6 a | 44.7 b | 45.6 b | 40.9 b | ||
| OEM | 70.4 a | 72.9 a | 73.6 a | 50.4 a | OEM | 58.5 Bb | 63.0 Aba | 69.8 Aa | 62.0 Aba | ||
| CAI | IPA | 3.4 ab | 3.5 b | 2.8 ab | 2.5 b | CAI | IPA | 2.1 Bb | 2.3 AB | 2.6 Aab | 2.4 Ab |
| MIU | 1.6 b | 2.5 b | 1.7 b | 3.1 b | MIU | 0.9 b | 2.2 | 1.4 b | 1.9 b | ||
| OEM | 4.9 a | 5.0 a | 4.8 a | 6.4 a | OEM | 4.4 a | 2.7 | 3.2 a | 3.9 a | ||
| Cycle 1 | Cycle 2 | ||||||||||
| Var. | Cactus | Rainfed | 4 mm | 8 mm | 12 mm | Var. | Cactus | Rainfed | 4 mm | 8 mm | 12 mm |
| PD | IPA | 8967.4 b | 11,141.3 b | 7065.2 b | 5706.5 c | PD | IPA | 8695.6 b | 10,597.8 b | 6521.7 b | 5434.8 c |
| MIU | 4347.8 Bb | 14,673.9 Ab | 6250.0 Bb | 14,945.6 Ab | MIU | 4.076.1 Bb | 13,858.7 Ab | 5706.5 Bb | 14,673.9 Ab | ||
| OEM | 40,217.4 a | 43,478.3 a | 40,489.1 a | 42,663.0 a | OEM | 39.402.2 a | 42,663.0 a | 39,945.6 a | 42,391.3 a | ||
| FM | IPA | 33.9 b | 54.4 b | 40.0 b | 30.7 b | FM | IPA | 27.0 b | 45.5 b | 28.9 b | 26.63 b |
| MIU | 17.0 b | 69.3 b | 34.5 b | 82.6 b | MIU | 14.8 b | 57.0 b | 20.7 b | 83.8 b | ||
| OEM | 337.6 Aba | 227.8 Ba | 280.8 Aba | 376.6 Aa | OEM | 236.9 a | 188.0 a | 250.8 a | 292.8 a | ||
| DM | IPA | 2.6 b | 3.7 b | 3.0 b | 2.6 b | DM | IPA | 2.5 b | 4.3 b | 2.4 b | 2.2 b |
| MIU | 2.1 b | 5.9 b | 2.9 b | 8.9 b | MIU | 1.8 b | 5.1 b | 2.8 b | 9.0 b | ||
| OEM | 23.5 a | 19.9 a | 18.8 a | 28.3 a | OEM | 20.0 a | 18.2 a | 22.0 a | 24.0 a | ||
| DMC | IPA | 0.10 | 0.10 | 0.10 | 0.10 | DMC | IPA | 0.09 b | 0.08 | 0.08 | 0.08 |
| MIU | 0.10 | 0.10 | 0.10 | 0.10 | MIU | 0.11 a | 0.09 | 0.10 | 0.10 | ||
| OEM | 0.10 | 0.10 | 0.07 | 0.10 | OEM | 0.08 b | 0.10 | 0.09 | 0.08 | ||
| Cycle 1 | ||||||||||
| Cactus | Depths | R | ID | ET | Revenue | Variable cost | Fixed cost | Opportunity costs | Gross margin | Net margin |
| IPA | 0 | 816.2 | 0.0 | 2017.5 | 975.1 | 254.9 | 4665.9 | 17,274.5 | 720.2 | −3945.6 |
| 4 | 816.2 | 116.5 | 2017.5 | 1566.9 | 509.7 | 4665.9 | 18,282.1 | 1057.2 | −3608.6 | |
| 8 | 816.2 | 233.0 | 2017.5 | 1150.5 | 764.6 | 4665.9 | 15,115.2 | 385.9 | −4279.9 | |
| 12 | 816.2 | 349.4 | 2017.5 | 884.8 | 892.2 | 4665.9 | 11.804.2 | −7.2 | −4673.0 | |
| Depths | WUEc | *WUEc | WPc | *WPc | WPI | GEWPI | NEWPI | EWPc | EWPI | |
| 0 | 2.5 | 0.5 | 0.1 | 0.3 | 0.0 | 0.0 | 0.0 | 2.1 | 0.0 | |
| 4 | 2.2 | 0.9 | 0.2 | 0.4 | 3.2 | 0.9 | −3.1 | 2.0 | 15.7 | |
| 8 | 1.9 | 0.6 | 0.1 | 0.3 | 1.3 | 0.2 | −1.8 | 1.4 | 6.5 | |
| 12 | 1.7 | 0.6 | 0.1 | 0.2 | 0.7 | 0.0 | −1.3 | 1.0 | 3.4 | |
| Cactus | Depths | R | ID | ET | Revenue | Variable cost | Fixed cost | Opportunity costs | Gross margin | Net margin |
| MIU | 0 | 816.2 | 0.0 | 2017.5 | 489.4 | 254.9 | 4665.9 | 31,238.0 | 234.6 | −4431.3 |
| 4 | 816.2 | 116.5 | 2017.5 | 1994.7 | 509.7 | 4665.9 | 38,723.6 | 1485 | −3180.9 | |
| 8 | 816.2 | 233.0 | 2017.5 | 992.8 | 764.6 | 4665.9 | 31,957.8 | 228.2 | −4437.6 | |
| 12 | 816.2 | 349.4 | 2017.5 | 2378.3 | 892.2 | 4665.9 | 43,042.2 | 1486.3 | −3179.5 | |
| Depths | WUEc | *WUEc | WPc | *WPc | WPI | GEWPI | NEWPI | EWPc | EWPI | |
| 0 | 2.5 | 0.5 | 0.1 | 0.3 | 0.0 | 0.0 | 0.0 | 3.8 | 0.0 | |
| 4 | 2.2 | 1.0 | 0.3 | 0.6 | 5.1 | 1.3 | −2.7 | 4.2 | 33.2 | |
| 8 | 1.9 | 0.6 | 0.1 | 0.3 | 1.3 | 0.1 | −1.9 | 3.0 | 13.7 | |
| 12 | 1.7 | 0.9 | 0.4 | 0.8 | 2.5 | 0.4 | −0.9 | 3.7 | 12.3 | |
| Cactus | Depths | R | ID | ET | Revenue | Variable cost | Fixed cost | Opportunity costs | Gross margin | Net margin |
| OEM | 0 | 816.2 | 0.0 | 2017.5 | 9719.7 | 254.9 | 4665.9 | 14,683.3 | 9464.8 | 4799.0 |
| 4 | 816.2 | 116.5 | 2017.5 | 6559.7 | 509.7 | 4665.9 | 21,593.1 | 6050.0 | 1384.1 | |
| 8 | 816.2 | 233.0 | 2017.5 | 8085.7 | 764.6 | 4665.9 | 19,721.7 | 7321.1 | 2655.3 | |
| 12 | 816.2 | 349.4 | 2017.5 | 10,842.8 | 892.2 | 4665.9 | 18,282.1 | 9950.8 | 5285.0 | |
| Depths | WUEc | *WUEc | WPc | *WPc | WPI | GEWPI | NEWPI | EWPc | EWPI | |
| 0 | 2.5 | 1.5 | 1.2 | 2.9 | 0.0 | 0.0 | 0.0 | 1.8 | 0.0 | |
| 4 | 2.2 | 1.7 | 1.0 | 2.1 | 17.1 | 5.2 | 1.2 | 2.3 | 18.5 | |
| 8 | 1.9 | 1.4 | 0.9 | 1.8 | 8.1 | 3.1 | 1.1 | 1.9 | 8.5 | |
| 12 | 1.7 | 1.9 | 1.4 | 2.4 | 8.1 | 2.8 | 1.5 | 1.6 | 5.2 | |
| Cycle 2 | ||||||||||
| Cactus | Depths | R | ID | ET | Revenue | Variable cost | Fixed cost | Opportunity costs | Gross margin | Net margin |
| IPA | 0,0 | 719.1 | 0.0 | 1579.3 | 776.7 | 188.5 | 0.0 | 14,395.4 | 588.2 | 588.2 |
| 4,0 | 719.1 | 40.0 | 1579.3 | 1310.7 | 377.0 | 0.0 | 13,963.5 | 933.7 | 933.7 | |
| 8,0 | 719.1 | 80.1 | 1579.3 | 833.2 | 565.5 | 0.0 | 12,955.9 | 267.7 | 267.7 | |
| 12,0 | 719.1 | 120.1 | 1579.3 | 766.8 | 659.8 | 0.0 | 12,236.1 | 107.0 | 107.0 | |
| Depths | WUEc | *WUEc | WPc | *WPc | WPI | GEWPI | NEWPI | EWPc | EWPI | |
| 0 | 2.2 | 0.8 | 0.2 | 0.4 | 0.0 | 0.0 | 0.0 | 2.0 | 0.0 | |
| 4 | 2.1 | 0.9 | 0.3 | 0.6 | 10.8 | 2.3 | 2.3 | 1.8 | 34.9 | |
| 8 | 2.0 | 0.7 | 0.2 | 0.3 | 3.0 | 0.3 | 0.3 | 1.6 | 16.2 | |
| 12 | 1.9 | 0.7 | 0.1 | 0.3 | 1.8 | 0.1 | 0.1 | 1.5 | 10.2 | |
| Cactus | Depths | R | ID | ET | Revenue | Variable cost | Fixed cost | Opportunity costs | Gross margin | Net margin |
| MIU | 0 | 719.1 | 0.0 | 1579.3 | 427.6 | 188.5 | 0.0 | 14,395.4 | 239.1 | 239.1 |
| 4 | 719.1 | 40.0 | 1579.3 | 1641.3 | 377.0 | 0.0 | 28,790.8 | 1264.3 | 1264.3 | |
| 8 | 719.1 | 80.1 | 1579.3 | 595.8 | 565.5 | 0.0 | 18,354.1 | 30.3 | 30.3 | |
| 12 | 719.1 | 120.1 | 1579.3 | 2413.0 | 659.8 | 0.0 | 30,230.3 | 1753.2 | 1753.2 | |
| Depths | WUEc | *WUEc | WPc | *WPc | WPI | GEWPI | NEWPI | EWPc | EWPI | |
| 0 | 2.2 | 0.7 | 0.1 | 0.2 | 0.0 | 0.0 | 0.0 | 2.0 | 0.0 | |
| 4 | 2.1 | 1.6 | 0.3 | 0.7 | 12.6 | 3.2 | 3.2 | 3.8 | 71.9 | |
| 8 | 2.0 | 0.9 | 0.1 | 0.3 | 2.6 | 0.0 | 0.0 | 2.3 | 22.9 | |
| 12 | 1.9 | 1.9 | 0.6 | 1.1 | 7.5 | 1.5 | 1.5 | 3.6 | 25.2 | |
| Cactus | Depths | R | ID | ET | Revenue | Variable cost | Fixed cost | Opportunity costs | Gross margin | Net margin |
| OEM | 0 | 719.1 | 0.0 | 1579.3 | 6821.1 | 188.5 | 0.0 | 20,585.4 | 6632.6 | 6632.6 |
| 4 | 719.1 | 40.0 | 1579.3 | 5414.3 | 377.0 | 0.0 | 13,675.6 | 5037.3 | 5037.3 | |
| 8 | 719.1 | 80.1 | 1579.3 | 7220.3 | 565.5 | 0.0 | 14,395.4 | 6654.8 | 6654.8 | |
| 12 | 719.1 | 120.1 | 1579.3 | 8430.0 | 659.8 | 0.0 | 15,475.0 | 7770.2 | 7770.2 | |
| Depths | WUEc | *WUEc | WPc | *WPc | WPI | GEWPI | NEWPI | EWPc | EWPI | |
| 0 | 2.2 | 2.2 | 1.3 | 2.8 | 0.0 | 0.0 | 0.0 | 2.9 | 0.0 | |
| 4 | 2.1 | 1.8 | 1.2 | 2.4 | 45.4 | 12.6 | 12.6 | 1.8 | 34.2 | |
| 8 | 2.0 | 2.0 | 1.4 | 2.7 | 27.4 | 8.3 | 8.3 | 1.8 | 18.0 | |
| 12 | 1.9 | 2.2 | 1.5 | 2.9 | 20.0 | 6.5 | 6.5 | 1.8 | 12.9 | |
Disclaimer/Publisher’s Note: The statements, opinions and data contained in all publications are solely those of the individual author(s) and contributor(s) and not of MDPI and/or the editor(s). MDPI and/or the editor(s) disclaim responsibility for any injury to people or property resulting from any ideas, methods, instructions or products referred to in the content. |
© 2024 by the authors. Licensee MDPI, Basel, Switzerland. This article is an open access article distributed under the terms and conditions of the Creative Commons Attribution (CC BY) license (https://creativecommons.org/licenses/by/4.0/).
Share and Cite
Araújo Júnior, G.d.N.; Leite, R.M.C.; Morais, J.E.F.d.; Alves, C.P.; Souza, C.A.A.d.; Almeida, A.C.d.S.; Jardim, A.M.d.R.F.; Souza, L.S.B.d.; Eugenio, D.d.S.; Silva, T.G.F.d. Growth Dynamic, Productivity, Evapotranspiration, and Water-Economic Indices of Forage Cactus under Different Irrigation Depths. Agronomy 2024, 14, 691. https://doi.org/10.3390/agronomy14040691
Araújo Júnior GdN, Leite RMC, Morais JEFd, Alves CP, Souza CAAd, Almeida ACdS, Jardim AMdRF, Souza LSBd, Eugenio DdS, Silva TGFd. Growth Dynamic, Productivity, Evapotranspiration, and Water-Economic Indices of Forage Cactus under Different Irrigation Depths. Agronomy. 2024; 14(4):691. https://doi.org/10.3390/agronomy14040691
Chicago/Turabian StyleAraújo Júnior, George do Nascimento, Renan Matheus Cordeiro Leite, José Edson Florentino de Morais, Cleber Pereira Alves, Carlos André Alves de Souza, Alexsandro Claudio dos Santos Almeida, Alexandre Maniçoba da Rosa Ferraz Jardim, Luciana Sandra Bastos de Souza, Danielle da Silva Eugenio, and Thieres George Freire da Silva. 2024. "Growth Dynamic, Productivity, Evapotranspiration, and Water-Economic Indices of Forage Cactus under Different Irrigation Depths" Agronomy 14, no. 4: 691. https://doi.org/10.3390/agronomy14040691