Abstract
In vitro-induced microrhizomes are promising for producing disease-free planting materials in ginger (Zingiber officinale Rosc.), spice and medicinal crops threatened by several soil-borne diseases. The study examined microrhizome induction, genetic homogeneity, and field performance in ginger. The condition combination of 3.0 mg·L−1 6-benzylaminopurine (BAP), 100 g·L−1 sucrose, and a 12-h photoperiod (the optimal conditions) produced the largest number of microrhizomes among all treatments but resulted in a lower average fresh weight during the 60-day culture period. Larger microrhizomes exhibited greater tolerance to water loss and a higher percentage of sprouting. Therefore, additional efforts were made to increase the size of the microrhizomes. Under the optimal conditions, the fresh weight increased significantly to 280.3 mg and 403.4 mg after 30 days of additional culture and in vitro culture of small-sized microrhizomes, respectively. Flow cytometry analysis and SSR characterization confirmed the genetic homogeneity of the regenerated plants with microrhizomes (MR) and those obtained by directly sowing sprouted microrhizomes into the substrate without acclimatization (FMR). At harvest, the MR had the most robust growth, a significantly higher fresh rhizome weight (206.1 g per plant) than the FMR (121.8 g per plant) and conventional tissue-cultured plants (TC), and similar rhizome finger size (11.5 g and 10.2 cm2) to the FMR. These findings suggest that both the MR and the FMR have advantages over the TC in producing seedling rhizomes of ginger in the first growing season. The established approach may be useful for large-scale production of disease-free ginger rhizomes.
1. Introduction
Ginger (Zingiber officinale Rosc.) is a perennial herbaceous monocotyledon of the Zingiberaceae family, widely used as a spice and medicinal plant globally [1]. The thick and tuberous rhizomes of ginger are traditionally consumed as a cooking vegetable, food condiment, and herbal remedy. They contain several bioactive compounds with known antimicrobial, antioxidant, anti-inflammatory, and anti-tumor properties [1,2]. Ginger is commonly propagated through rhizome splitting due to infrequent flowering and poor seed set [3]. Many propagules are required due to the low reproductive rate. Moreover, ginger rhizomes are vulnerable to soil-borne diseases, such as bacterial wilt and rhizome rot, which can cause significant yield and quality losses during storage and cultivation [4,5]. These diseases are easily transmitted by rhizomes, leading to high infection rates in the next growing season [4]. Productivity and quality are significantly reduced when diseased rhizomes are used as propagation materials [4,5]. Therefore, it is imperative to cultivate pathogen-free seedling rhizomes via a cost-effective method with a high multiplication rate to ensure success in cultivating this crop species. In vitro culture has been extensively used to produce disease-free plants in numerous crop species [6,7], including ginger [8,9]. However, ginger plants regenerated in vitro generally produce low yields and small rhizomes that are not suitable for commercial use in the first growing season [10]. Typically, it takes 2–3 growing cycles to produce a yield and seed rhizome size that is acceptable to the grower [9,10]. Moreover, conventional tissue culture plants require several time-consuming and labor-intensive procedures before plant transplantation, such as removing residual media and acclimating the plants [11,12]. Additionally, it is expected that plants may experience losses during acclimation due to the significant environmental changes from controlled conditions to the ex vitro environment [11,13]. Consequently, the production of disease-free rhizomes using conventional tissue culture is limited in ginger due to its inefficiency and high cost.
Microrhizomes are miniature rhizomes induced in vitro. Over the past decades, microrhizome induction has been achieved in several rhizomatous crop species, such as Curcuma aromatica [14,15], Curcuma caesia [16], and Kaempferia parviflora [17]. Microrhizome technology is becoming increasingly popular in rhizomatous crops due to its several potential advantages over traditional in vitro culture systems. Microrhizomes could successfully sprout both in vitro and in vivo [18] and were easily stored and transported [19]. Recently, it has been reported that in vitro-induced microrhizomes could be used for germplasm conservation [20], artificial seed production [21], and secondary metabolite production [16,22]. In ginger, attempts have been made to induce microrhizomes in vitro using high concentrations of sucrose and different combinations of plant growth regulators (PGRs) [23,24,25]. Ginger microrhizomes, harvested freshly, were observed to sprout within 14–20 days of storage in wet sand and thrived in the field [24,25,26]. Using the transverse thin cell layer section of the microrhizomes as explants, plants were regenerated at a high frequency via somatic embryogenesis in ginger [27]. In short, in vitro-produced microrhizomes have multiple practical applications in ginger, including producing disease-free seedling rhizomes [26].
Several factors have been reported to play essential roles in developing microrhizomes in Zingiberaceae species. These factors include carbohydrate type [23], sucrose concentration [25,28], PGRs combination [26,29], culture vessel [30], and photoperiod [31]. Sucrose, at a concentration ranging from 60 to 90 g·L−1, was found to be the most effective carbon source for inducing microrhizomes in several varieties of ginger [23,25,26,28]. Additionally, it should be noted that the in vitro formation of ginger microrhizomes is significantly impacted by PGRs. The most commonly used PGRs for microrhizome induction are exogenous 6-benzylaminopurine (BAP) and 1-naphthylacetic acid (NAA) [23,26,29]. For example, Rout et al. [23] found that the highest percentage of microrhizome formation was observed on MS medium supplemented with 4.44 μM BAP and 5.71 μM IAA. Moreover, the photoperiod is a crucial factor in ginger microrhizome formation. A 16-h photoperiod treatment is commonly used to induce ginger microrhizomes [28,30,32]. A 24-h photoperiod was also reported to have greater effectiveness than other photoperiods in microrhizome production [23,24]. Mehaboob et al. [31] found that microrhizome production significantly increased under an 8-hour photoperiod. The growth and development of in vitro cultured tissues are regulated by various factors, such as medium composition and culture environment [33]. However, most reports have only provided protocols for inducing microrhizome in ginger by manipulating one or two factors. Typically, these factors are PGRs or carbohydrate levels [23,25,26]. High genetic homogeneity is critical for successful clonal propagation of plants regenerated in vitro [34,35]. Despite extensive research into microrhizome induction in ginger over the last decades, there still needs to be more understanding of the genetic homogeneity of in vitro-induced microrhizomes. Additionally, the growth performance of microrhizomes must be assessed before practical application [36]. In turmeric, Shirgurkar et al. [18] found that the size and fresh weight of microrhizomes induced in vitro affected their sprouting percentage. However, no related reports are available in ginger. Therefore, an orthogonal experimental design was utilized to establish the optimal conditions for the in vitro induction of ginger microrhizomes. Two methods were tested to enhance the average fresh weight of microrhizomes: prolonging the induction duration and in vitro culture of the induced microrhizomes. The study evaluated the sprouting characteristics, genetic homogeneity, and field performance of microrhizomes. The research aimed to develop a precise and efficient protocol for producing high-quality ginger microrhizomes and assess their potential practical applications in field plantings.
2. Materials and Methods
2.1. Plant Materials
Plants of disease-free Zingiber officinale Rosc. cv Fengtou were previously obtained [9]. The plants were maintained on Murashige and Skoog (MS) basal medium [37] supplemented with 1 mg·L−1 6-benzylaminopurine (BAP), 0.2 mg·L−1 indole butyric acid (IBA), 30 g·L−1 sucrose, and 7.5 g·L−1 agar (pH 5.8), with a subculture interval of 60 days. After 30 days of culture under cool white, fluorescent lamps with a light intensity of approximately 50 μmol m−2 s−1 and a 14-h daylight period at 25 ± 1 °C, regenerated multiplied shoots of approximately 4.0 cm in height were separated and used as initial explants for the microrhizome induction. All reagents were purchased from Beijing Solarbio Science & Technology Co., Ltd. (Beijing, China), unless otherwise specified.
2.2. Microrhizome Induction
An orthogonal design of three factors at three levels obtained by SPSS 23.0 (SPSS Inc., Chicago, IL, USA) was applied to determine an optimal approach for the microrhizome induction, as listed in Table 1. The three factors were selected based on previous research [25,26,27], namely the BAP concentration (A), sucrose concentration (B), and photoperiod (C). Levels of the factors were set as 1.0, 2.0, and 3.0 mg·L−1 for the BAP concentration, 60, 80, and 100 g·L−1 for the sucrose concentration, and 12 h/12 h, 16 h/8 h, and 20 h/4 h (light/dark) cycles for the photoperiod. The regulation of the photoperiod is controlled by a device that sets the times for turning the lights on and off. According to the L9 (33) orthogonal array, nine groups of different culture condition treatments were conducted. All media were based on MS basal medium fortified with 7.5 g·L−1 agar at pH 5.8. For microrhizome induction, healthy individual shoots of approximately 4.0 cm in height were separated. Then, they were cultured on the medium after the roots were trimmed to nearly 0.5 cm in length. All cultures were maintained at 25 ± 1 °C under a light intensity of 50 μmol m−2 s−1, and photoperiod was set as indicated in Table 1. Four explants were inoculated in each 300 mL glass container filled with 60 mL of the culture medium. Four containers with a total of 16 plants were used, and three repetitions were performed. At the end of 60 days of culture, data was collected on the number of regenerated shoots, plant height, and quantity and fresh weight of microrhizomes. Finally, a validation experiment was conducted to determine the optimal culture conditions. The conditions that produced the highest number of microrhizomes and the greatest average fresh weight were used as controls.

Table 1.
The Orthogonal L9 (33) array and effects of different culture condition combinations on the number and average fresh weight of the induced microrhizomes of ‘Fengtou’ ginger after 60 days of inoculation.
2.3. Water Loss Rate Analysis and Sprouting Tests
The induced microrhizomes were collected, washed with tap water for 10 min, and dried on filter paper. After weighing, the microrhizomes were graded into three groups according to the fresh weight: small (<150 mg), medium (150–250 mg), and large size (>250 mg). Then, the samples were left to air-dry at room temperature. To evaluate the effects of the microrhizome sizes and air-drying duration on the water loss rate and sprouting percentage, different-sized microrhizomes were subjected to air drying for 0, 1, 2, and 3 days. Five microrhizomes of each treatment were weighed immediately to obtain a measure of fresh mass (Wf) to estimate the water loss rate. After that, the microrhizomes were air-dried and weighed again (Wd), and the water loss rate was calculated as (Wf − Wd)/Wf × 100) [38]. For testing the sprouting percentage, 20 microrhizomes of each treatment were placed on moistened filter paper in a 100 × 15 mm Petri dish. The dishes were sealed with parafilm and incubated at 25 ± 1 °C under continuous darkness. Twenty days later, the sprouting percentage was calculated as the percentage of the number of sprouted microrhizomes over the total number of microrhizomes. The measurements were repeated three times.
2.4. Increasing the Fresh Weight of Microrhizomes
Two approaches were employed to enhance the fresh weight of microrhizomes: (1) extending the culture period and (2) in vitro culture of the induced microrhizomes. Both approaches were based on the optimal condition combination for the microrhizome induction according to the orthogonal test. In the first experiment, the culture duration was prolonged from 60 to 90 days based on our preliminary observation. The changes in several microrhizome characteristics were examined, including the microrhizome number, microrhizome length and width, microrhizome fresh weight, and percentage of different-sized microrhizomes. In the second experiment, 60-day-old microrhizomes of approximately 120 mg in fresh weight were isolated and cultured under the optimal conditions, with 30 g·L−1 sucrose as a control. Four culture vessels with three microrhizomes were used for each treatment, and three repetitions were conducted for each experiment. After 60 days of culture, the shoot length, shoot number, microrhizome number, and microrhizome fresh weight were determined.
2.5. Plant Establishment for the Field Experiment
Three types of plants were prepared for subsequent field experiments, namely conventional tissue-cultured plants (TC), in vitro-raised plants with microrhizomes (MR), and plants forced from harvested microrhizomes (FMR). The TC and MR plants were obtained after 60 days of culture on the subculture medium and under the optimal induction conditions (3.0 mg·L−1 BAP, 100 g·L−1 sucrose, and a 12-h photoperiod), respectively. The TC and MR plants were rinsed with running tap water to remove adhered medium residues for acclimatization. Then, they were transferred to plastic seedling trays (6 cm × 6 cm × 10 cm/cell) filled with a commercial substrate (Jiangsu Peilei Matrix Technology Development Co., Ltd., Zhenjiang, China). The plants were covered with transparent plastic covers to maintain humidity and then incubated at 25 ± 1 °C with a 14-h photoperiod (130 μmol m−2 s−1). Fifteen days later, the covers were removed, and the plants were incubated for another 15 days at around 28 °C day/18 °C night. To obtain the FMR plants, the harvested microrhizomes of approximately 300 mg in fresh weight were sowed directly in the trays under the above-mentioned conditions. Thirty days later, the survival rate was calculated. Thirty-two plants or microrhizomes were used for each treatment, with three repetitions for each type.
2.6. Genetic Homogeneity Assessment
Before examining the field performance, flow cytometry and molecular marker analysis were conducted to assess the genetic homogeneity of these plants. Five plants were randomly selected from each plant type (TC, MR, and FMR). The relative nuclear DNA content was estimated as described by Zhang et al. [39] on a CytoFLEX flow cytometer (Beckman Coulter, Suzhou, China). The fluorescence intensity of released nuclei from each sample was measured with three replicates.
Total genomic DNA was extracted from approximately 100 mg of the fresh leaves of each sample following the method of Fulton et al. [40]. DNA concentration and purity were determined on a NanoDrop One C spectrophotometer (Thermo Fisher Scientific, Madison, WI, USA). For simple sequence repeat (SSR) amplifications, ten randomly selected ginger-specific microsatellite loci (Table S1) retrieved from Zhao et al. [9] were analyzed to assess the genetic homogeneity. The PCR reaction was performed in a total volume of 20 μL containing 2 μL of 25 ng·μL−1 temple DNA, 1.0 μL of each forward and reverse primer (10 μM), 10 μL of 3G Master Mix for polyacrylamide gel electrophoresis (Vazyme, Nanjing, China), and 6.0 μL ddH2O. The amplification was performed in an FC-96G thermocycler (BigFish, Hangzhou, China) under the following program: initial denaturation for 2 min at 94 °C, followed by 40 cycles of denaturation at 94 °C for 30 s, annealing at a temperature according to each primer for 30 s and extension at 72 °C for 30 s, and final extension at 72 °C for 10 min. PCR products were separated on an 8% (w/v) non-denaturing polyacrylamide gel and visualized by silver staining according to Yu et al. [41].
2.7. Field Performance Evaluation
The TC, MR, and FMR plants were planted in soil in a plastic greenhouse from late April to mid-November 2023. The temperature and relative humidity during the research period ranged from 14.5 °C to 38.9 °C and 42.1% to 85.6%, respectively. The soil texture of the experimental site was sandy loam, with a pH value of 7.3. Approximately 100 plants of each type were planted in soil with a spacing of 20 × 60 cm and a planting depth of 20 cm. Shading, irrigation, fertilization, and hilling were performed as necessary during the growing season.
Morphological parameters and production potential were investigated after approximately 160 days (harvest time) of growth in the field, including the plant height, tiller number, main tiller diameter, number of leaves per tiller, leaf length and width, rhizome length and width, number of rhizome fingers per plant, rhizome fresh weight, fresh weight and volume per rhizome finger, aboveground biomass per plant, root fresh weight per plant. Related data were collected following the descriptors reported by Zambrano Blanco and Baldin Pinheiro [42]. The leaf greenness index was determined on three fully expanded leaves per plant with a portable chlorophyll meter (SPAD-502 plus, Konica Minolta, Tokyo, Japan). The volume of rhizome fingers was determined according to the water displacement method. The root/shoot ratio was calculated by dividing the root fresh weight by the aboveground biomass. To estimate the dry matter percentage, the fresh rhizome samples were weighed (Wf), cut into pieces, and dried in a hot air oven at 60 °C until the weight stabilized (Wd). The dry matter percentage was calculated as Wd/Wf × 100 [43]. Five plants were randomly selected from each group, and three repetitions were conducted for each measurement.
2.8. Statistical Analysis
Data analyses were performed using SPSS 23.0 (SPSS Inc., Chicago, IL, USA). The percentage data were transformed into arcsine-square root prior to analysis. For the orthogonal experiments, a univariate analysis of variance (ANOVA) was employed to evaluate each factor’s impact on microrhizome induction. The statistical significance of variations in microrhizome parameters across various durations of culture and sucrose concentrations was evaluated by Student’s t-test. A two-way ANOVA was performed to assess the water loss rate and the sprouting percentage. A one-way ANOVA analyzed other data with Duncan’s multiple range test.
3. Results
3.1. Effects of Different Culture Condition Combinations on Microrhizome Induction
After 60 days of culture, the plant morphology under different treatments showed significant differences (Figure S1). The shoots cultured on the media containing 60 g·L−1 sucrose with a more extended photoperiod (16 and 20 h), namely the T4 and T7, exhibited more robust growth. Conversely, poor plant growth was observed in the presence of 80 or 100 g·L−1 sucrose, including the treatments of T2, T3, T6, and T9.
Table 1 presents the results of the influence of different condition combinations on the number and the average fresh weight of the induced microrhizomes after 60 days of culture. The treatment T9, which consisted of 3.0 mg·L−1 BAP, 100 g·L−1 sucrose, and a 16-h photoperiod, yielded the highest number of microrhizomes per explant (11.42), followed by the T8 (8.43) and T6 (7.88). The microrhizomes produced through the treatment T5 (2.0 mg·L−1 BAP, 80 g·L−1 sucrose, and a 20-h photoperiod) had the highest average fresh weight (183.5 mg), followed by the treatment T8 (159.6 mg) and T4 (157.6 mg). The range analysis showed that the effects of the three factors on the microrhizome number reduced in the order of A (BAP concentration) > B (sucrose concentration) > C (photoperiod). In contrast, it was A > C > B for the average fresh weight of the microrhizomes (Table 2). The results suggest that the concentration of BAP was the most influential factor for both the quantity and average fresh weight of the induced microrhizomes. According to the values of k1, k2, and k3, the optimal combination for producing microrhizomes in large quantities was A3B3C1 (3.0 mg·L−1, 100 g·L−1 sucrose, and a 12-h photoperiod). For microrhizome expansion, the optimal condition was A2B2C3 (2.0 mg·L−1 BAP, 80 g·L−1 sucrose, and a 20-h photoperiod). Table S2 shows that all three factors had a significant effect (p < 0.001) on the number of induced microrhizomes per explant, according to a further univariate ANOVA. Additionally, the average fresh weight of microrhizomes was significantly affected by the BAP concentration (p < 0.001), sucrose concentration (p < 0.05), and photoperiod (p < 0.05).
Table 2.
Range analysis of the L9 (33) test for the in vitro induction of microrhizomes of ‘Fengtou’ ginger.
3.2. Validation Experiment
According to the results of the orthogonal array, the combination of A3B3C1 was identified as the theoretically optimal condition for producing microrhizomes in large quantities. It is worth noting that this combination was not included in Table 1 of the orthogonal array. To confirm the effects of this optimal combination on the number and average fresh weight of induced microrhizomes, a validation experiment was performed. The controls employed were the combination that yielded the most microrhizomes (T9) and the greatest average fresh weight (T5), as determined by the orthogonal results. Swelling at the base of the shoot explants and microrhizome initiation were observed after approximately ten days of culture under the optimal combination (Figure 1A). It was accompanied by forming adventitious shoots with roots (Figure 1A). After 30 days of culture, each plant explant generated several microrhizomes and 4-6 robust roots at its base (Figure 1B). At the end of 60 days of culture, multiple shoots with well-developed roots were regenerated (Figure 1C), and numerous microrhizomes were observed at the base of the shoots (Figure 1D). The induced microrhizomes exhibited varying sizes and shapes and had a light yellow color (Figure 1E). Under the optimal conditions, each explant produced 9–17 microrhizomes with an average of 13.94 (Figure 1F), which was significantly higher than those produced under the T5 (1.98) and T9 treatments (11.42). The average weight of microrhizomes harvested after 60 days under the optimal conditions was only 117.0 mg, which was substantially lower than that of T5 (183.5 mg) (Figure 1F). However, there was no significant difference in the average weight of microrhizomes between the optimal and T9 treatments (Figure 1F).
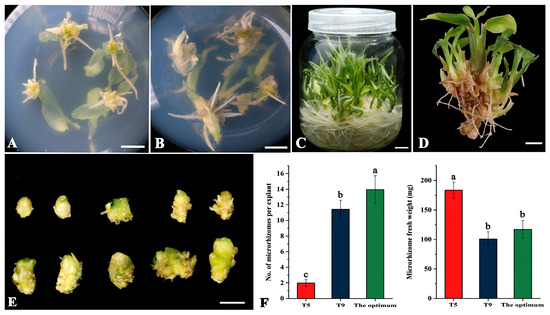
Figure 1.
In vitro induction of microrhizomes of ‘Fengtou’ ginger under the theoretical optimum condition combination (3.0 mg·L−1 BAP, 100 g·L−1 sucrose, and a 12-h photoperiod) based on an orthogonal test. (A) microrhizome initiation ten days after culture; (B) induced microrhizomes after 30 days of culture; (C) regenerated shoots with well-developed roots after 60 days of culture; (D) microrhizomes observed at the shoot base 60 days after culture; (E) typical microrhizomes produced from one explant within 60 days; (F) the number (left) and average fresh weight (right) of the induced microrhizomes after 60 days of culture under the treatments of T5 (2.0 mg·L−1 BAP, 80 g·L−1 sucrose, and a 20-h photoperiod), T9 (3.0 mg·L−1 BAP, 100 g·L−1 sucrose, and a 16-h photoperiod), and the optimum condition combination. Bars = 1 cm. Values with different letters on the bars are significantly different (p < 0.05), as estimated by Duncan’s multiple range test.
3.3. Effects of Various Sizes and Air-Drying Duration on Water Loss Rate and Sprouting Percentage in Microrhizomes
Figure 2A shows freshly harvested microrhizomes of varying sizes placed in Petri dishes with wet filter papers to assess sprouting percentage. After ten days of incubation, most microrhizomes produced 1–3 buds, each approximately 1 cm long (Figure 2B). Upon transfer to a moist substrate, the sprouted microrhizomes exhibited robust growth with a 100% survival rate (Figure 2C). The study then investigated the effects of microrhizome size and air-drying duration on water loss rate (Figure 2D) and germination percentage (Figure 2E). The water loss rate decreased for small (<150 mg), medium (150–250 mg), and large (>250 mg) microrhizomes with increasing air-drying duration. Significant changes in the water loss rate (p < 0.05) were detected only in small-sized microrhizomes only after one day of exposure to air drying. In contrast, large and medium-sized microrhizomes significantly reduced the water loss rate (p < 0.05) after two days of treatment. The two-way ANOVA results showed that air-drying duration significantly altered the water loss rate (p < 0.001). Microrhizome size and the interaction of air-drying duration with microrhizome size did not have a significant effect on the water loss rate. The sprouting percentage of small and medium microrhizomes significantly decreased with increasing air-drying duration (p < 0.05), and they lost the ability to sprout entirely after two days of treatment. Large microrhizomes maintained a 100% sprouting percentage on the first day of air drying but then significantly decreased (p < 0.05) until reaching 0% on the third day. The study confirmed the statistical significance of microrhizome size, air-drying time, and size × time interaction on sprouting percentage at the 0.1% level.
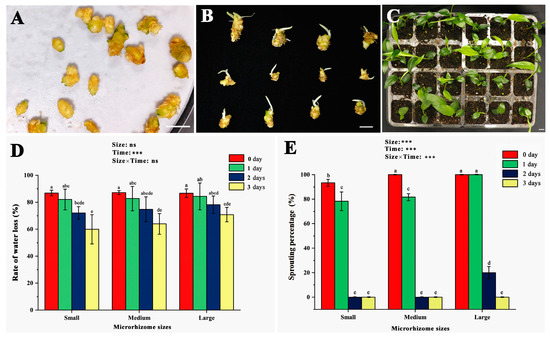
Figure 2.
Effects of different sizes and air-drying duration on the water loss rate and sprouting percentage of the ginger microrhizomes. The sizes were determined by the microrhizome fresh weight, including small (<150 mg), medium (150–250 mg), and large size (>250 mg). (A) freshly harvested microrhizomes placed on wet filter papers in a petri dish for the sprouting test; (B) sprouting of the fresh microrhizomes of different sizes after ten days of incubation at 25 °C; (C) growth of the microrhizome-propagated plants (MRP) 30 days after transplantation; (D) changes in the rate of water loss in the small, medium, and large-sized microrhizomes treated by different air-drying time; (E) impacts of air-drying time and microrhizome sizes on the ex vitro sprouting frequency. Bars = 1 cm. Different letters on the bars indicate significant differences by Duncan’s range test at the 5% level. ns and *** mean non-significant and significant differences (p < 0.001) using two-way ANOVA with interaction approach.
3.4. Effects of Culture Duration and Sucrose Concentration on Microrhizome Fresh Weight
Two independent experiments were conducted to increase the fresh weight of microrhizomes, including prolonging the culture period and in vitro culture of the microrhizomes. The effects of different culture durations (60 and 90 days) on microrhizome characteristics under the optimal combination of conditions are shown in Figure 3. The number of microrhizomes per explant increased from 13.94 to 14.89 when the culture duration was extended from 60 to 90 days (Figure 3A). However, it was observed that the increase was not statistically significant. The length (Figure 3B) and width (Figure 3C) of the microrhizomes increased by 1.59 and 1.61 times, respectively, after 90 days of culture compared to those cultured for 60 days. Additionally, the average fresh weight of the microrhizomes increased from 117.04 mg at 60 days to 280.30 mg at 90 days (Figure 3D). The results of the significance analysis indicate that extending the culture period by 30 days led to a significant increase in microrhizome length (p < 0.05), microrhizome width (p < 0.01), and average microrhizome fresh weight (p < 0.05). The average fresh weight of microrhizomes ranged from 58.0 mg to 157.1 mg after 60 days of culture. Among these, 88.1% and 11.9% belonged to the small and medium-sized groups, respectively, while no large microrhizomes were identified (Figure 3E). In comparison, the average fresh weight of the microrhizomes varied widely, ranging from 73.5 mg to 847.1 mg after 90 days of culture. Among these microrhizomes, 49.6%, 32.6%, and 17.8% belonged to the large, medium, and small-sized groups, respectively (Figure 3E). The statistical analysis revealed that the extended 30-day culture significantly increased the percentage of large (p < 0.01) and medium microrhizomes (p < 0.05), while significantly decreasing the percentage of small-sized microrhizomes (p < 0.001).
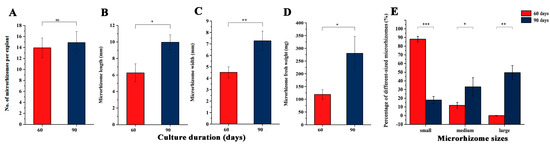
Figure 3.
Effects of different culture duration (60 and 90 days) on the microrhizome characteristics under the optimum condition combination (3.0 mg·L−1 BAP, 100 g·L−1 sucrose, and a 12-h photoperiod), including the microrhizome number per explant (A), microrhizome length (B), microrhizome width (C), microrhizome fresh weight (D), and percentage of different-sized microrhizomes (E). *, **, and *** indicate significant differences between the 60 and 90 days-induced microrhizomes estimated by Student’s t-test at p < 0.05, 0.01, and 0.001, respectively. ns means non-significant differences.
The effects of different concentrations of sucrose (30 and 100 g·L−1) on the development of new microrhizomes were analyzed in the second experiment, as shown in Figure 4. After 60 days of culture, the regenerated plants treated with 100 g·L−1 sucrose showed more vigorous growth compared to those treated with 30 g·L−1 sucrose (Figure 4A). In addition, microrhizomes were observed at the shoot base when 100 g·L−1 sucrose was applied (Figure 4B). The regenerated multiple shoots with microrhizomes remained viable for at least four months on the medium containing 100 g·L−1 sucrose (Figure 4C). Compared to the 30 g·L−1 sucrose treatment, the medium supplemented with 100 g·L−1 sucrose significantly increased the shoot length (p < 0.01) and number (p < 0.05) after 60 days of culture (Figure 4D). The treatment with 100 g·L−1 sucrose resulted in an average number of 21.3 new microrhizomes per microrhizome, which was significantly higher than that of the 30 g·L−1 sucrose treatment (Figure 4D). Furthermore, the microrhizomes treated with 100 g·L−1 sucrose had a significantly (p < 0.05) higher average fresh weight (403.4 mg) than those treated with 30 g·L−1 sucrose treatment (Figure 4D).
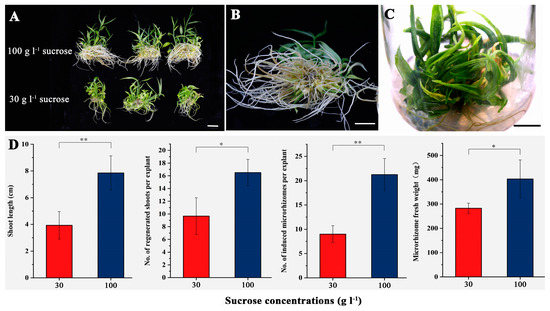
Figure 4.
In vitro culture of small-sized microrhizomes under the optimum condition combination except the sucrose concentrations for 60 days. (A) regenerated plants from the microrhizomes on the medium containing 30 (below) and 100 g·L−1 sucrose (above), respectively; (B) new microrhizomes induced on the medium containing 100 g·L−1 sucrose; (C) shoot clusters maintained on the medium containing 100 g·L−1 sucrose for four months; (D) effects of different concentrations of sucrose on the shoot length, number of regenerated shoots per explant, microrhizome number, and microrhizome fresh weight. Bars = 2 cm. * and ** indicate significant differences between the 30 and 100 g·L−1 sucrose treatment estimated by Student’s t-test at p < 0.05 and 0.01, respectively.
3.5. Genetic Homogeneity Assessment of the Established Plants by Flow Cytometry and SSR Marker Analysis
Flow cytometry and SSR molecular markers were utilized to evaluate the genetic uniformity of the established TC, MR, and FMR plants. The flow cytometry analysis results showed a single peak located at approximately 5.4 × 10⁵ in the histogram for all three plant types (Figure 5), indicating no variation in their ploidy level. Furthermore, ten pairs of SSR primers were used to evaluate the genetic homogeneity of the three types of plants. Out of the primers used, four markers (Ginger11, Ginger49, Ginger84, and Ginger97) produced reproducible banding patterns with 3–5 amplified DNA fragments in all DNA samples (Figure 6). The four SSR primer pairs did not show any changes in banding patterns among the three types of plants, indicating a high degree of genetic homogeneity.
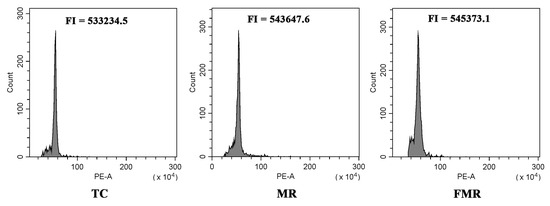
Figure 5.
Flow cytometry analysis of the TC (conventional tissue-cultured plants), MR (in vitro-raised plants with microrhizomes), and FMR plants (plants forced from harvested microrhizomes). FI: fluorescence intensity.
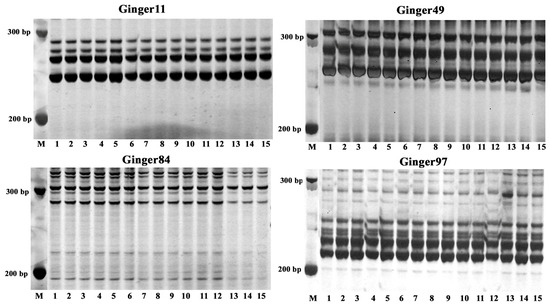
Figure 6.
SSR profiles of the TC, MR, and FMR plants by the primer pairs Ginger11, Ginger49, Ginger84, and Ginger97. M: DL500 DNA marker (Takara Bio Inc., Shiga, Japan); Lanes: 1–5: the TC plants; 6–10: the MR plants; 11–15: the FMR plants.
3.6. Field Performance Evaluation of the Three Types of Plants
A comparative analysis was performed to determine the survival rate and plant performance among the TC, MR, and FMR plants. The survival rate was recorded after 30 days of growth in the trays as shown in Figure 7A. The FMR plants had the highest survival rate (100%), followed by the MR (98.6%) and TC (90.3%) plants. There was no significant difference in survival rate between the FMR and MR plants in the survival rate, both of which were significantly higher than that of the TC plants. The plants showed strong growth both at 60 and 120 days after planting in the field (Figure S2) and at the time of harvest (Figure 7B). At harvest, significant morphological differences were observed among the three plant types. Specifically, compared to the TC and FMR plants, the MR plants had increased plant height and more erect tillers (Figure 7C) and produced larger rhizomes (Figure 7D) with more giant rhizome fingers (Figure 7E). The arrangement of rhizomes in all three plant types was irregular, with different numbers and sizes of rhizome fingers (Figure 7D). The rhizome fingers of all plants had visible knobs and a yellow flesh color (Figure 7E).
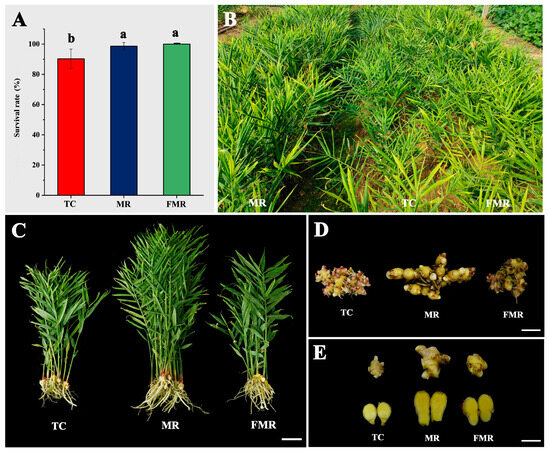
Figure 7.
The survival rate, field performance, and rhizome features of the three types of plants (TC, MR, and FMR). (A) the survival rate after 30 days of growth in the substrate; (B) growth performance in the field at harvest; (C–E) the representative plants (C), rhizomes (D), and rhizome fingers; (E) the TC, MR, and FMR plants at harvest. Values with different letters on the bars indicate significantly different (p < 0.05) according to Duncan’s multiple range test. Bars = 10 cm for (A) and 5 cm for (B,C).
Differences in the above-ground morphological traits, rhizome characteristics, root/shoot ratio, and dry matter percentage of the three types of plants grown in the field at harvest are presented in Table 3. Among the three types, the MR plants had the tallest height (83.7 cm), the highest number of tillers per plant (17.1), and the highest number of leaves on the main tiller (20.2). When the FMR plants were compared with the TC and MR plants, they had the largest main tiller diameter (8.0 mm), leaf SPAD value (44.3), and leaf length (19.9 cm) and width (2.5 cm) but produced the least number of tillers per plant (11.4) and leaves on the main tiller (15.8). The TC plants were found to have the largest leaf length to width ratio (8.8), the shortest plant height (63.3 cm), the lowest leaf SPAD value (41.1), and thinner leaves (16.7 cm long and 1.9 cm wide) than the other two plant types. These observations suggest that the TC plants have narrower and less green leaves than the other plant types. No significant differences were found in the above-ground measurements within the three plant types except for the number of tillers per plant between the MR and FMR plants, the plant height between the MR and TC plants, and the leaf width between the FMR and TC plants.
Table 3.
Comparisons of the aboveground morphological characteristics, rhizome features, root/shoot ratio, and dry matter percentage among three types of plants grown in the field at harvest, including the conventionally tissue-cultured plants (TC), in vitro-raised plants with microrhizomes (MR), and plants forced from the microrhizomes (FMR).
In contrast, all rhizome characteristics differed significantly among the three groups. The MR plants showed a statistically significant increase in rhizome length (15.1 cm) and rhizome width (5.3 cm) compared to the FMR and TC, respectively. Additionally, the MR plants had an average fresh rhizome weight of 206.1 g, approximately 2.1 and 1.7 times that of the TC and FMR, respectively. The number of rhizome fingers produced was highest in each MR plant (18.5), followed by the TC (16.3) and FMR (12.9). However, no significant differences were found between the TC and both the MR and the FMR plants. The MR group exhibited the highest average fresh weight (11.9 g) and volume (10.5 cm2) of rhizome fingers, which was significantly higher than that of the TC plants and not significantly different from that of the FMR. No significant differences were found among the three plant types in terms of the root/shoot ratio and dry matter percentage. The results showed that the MR plants were more responsive in rhizome production than the other two types, including size, fresh weight, number, mass, and volume of rhizome fingers.
4. Discussion
In vitro induction of small storage organs has been reported in several plant species [16,28,44]. Microrhizome development is a complex process influenced by numerous internal and external factors [44]. The in vitro induction of ginger microrhizomes is significantly influenced by several factors, such as sucrose content, concentration of plant growth regulators (PGRs), and photoperiod [23,25,26,28]. However, most reports have only provided protocols for microrhizome induction in ginger by manipulating one or two factors, typically PGRs or carbohydrate levels. In this study, an orthogonal experiment was conducted to investigate the optimal conditions for microrhizome induction in ginger, including three factors: BAP concentration, sucrose concentration, and photoperiod, each at three levels. The results showed that all three factors had a significant impact on the number and fresh weight of the induced microrhizomes. Zahid et al. [26] also reported that the concentration of sucrose and NAA, as well as their interaction, had significant effects (p < 0.001) on the number, biomass, and diameter of the in vitro-induced microrhizomes.
Cytokinins, such as BAP, have various functions in plant growth and development, making them a popular choice for in vitro induction of ginger microrhizomes [26,28,29]. In this study, an increased level of BAP significantly increased the number of microrhizomes, which is consistent with the findings of Abbas et al. [29]. However, a significant decrease in the average fresh weight of microrhizomes was observed at BAP concentrations above 2.0 mg·L−1. The study confirms previous research that showed a significant decrease in microrhizome fresh weight when BAP concentrations reached 4.0 mg·L−1 or higher [28]. A conflicting result was reported by Zahid et al. [26], who found that a BAP concentration greater than 15 μM significantly reduced the number, biomass, and diameter of the ginger microrhizomes. According to Rani et al. [22], the number and fresh weight of induced ginger microrhizomes varied depending on the genotype. Therefore, it is possible that the differences in BAP requirements for ginger microrhizome induction are due to genotypic differences.
Sucrose is the main carbon source utilized in tissue culture. To encourage microrhizome differentiation in ginger, it has been well-documented that the sucrose concentration should be increased to over 60 g·L−1 [25,28]. This study found that using higher sucrose concentrations (80 and 100 g·L−1) also significantly increased the number of microrhizomes compared to the treatment with 60 g·L−1 sucrose. However, in this study, a significant reduction in the average fresh weight of the microrhizomes was observed when the sucrose concentration was raised from 80 to 100 g·L−1. This result is consistent with the findings of Zahid et al. [26], who reported a decrease in biomass of induced microrhizomes when sucrose concentrations exceeded 60 and 75 g·L−1 in the presence of 7.5 and 5 μM NAA, respectively. David et al. [25] reported that the addition of surplus sucrose to the culture medium could cause osmotic stress, which could hinder nutrient intake by the cultures. In this study, it was found that an excessive amount of sucrose (100 g·L−1) limited the growth of aerial shoots. This limitation could reduce photosynthetic capacity and impede biomass accumulation in the microrhizomes.
In addition to PGRs and sucrose, photoperiod plays a crucial role in microrhizome formation in ginger [23,24,31]. This study found that a longer photoperiod led to a decrease in the number of microrhizomes but an increase in their average fresh weight. This result is consistent with the findings of Mehaboob et al. [31], who reported that a shorter photoperiod of 8 h resulted in a greater biomass of microrhizomes. However, according to most reports, a 16-h photoperiod was found to be more effective in inducing ginger microrhizomes [25,26,28,30,32]. Further research is needed to understand the mechanisms that underlie the impact of photoperiod on the induction and growth of microrhizomes in vitro.
Efficient and high-quality induction of microrhizomes is crucial for their practical application. The validation experiment confirmed the accuracy of the predicted optimal condition combination (A3B3C1: 3.0 mg·L−1 BAP, 100 g·L−1 sucrose, and 12-h photoperiod) by producing a significantly larger number of microrhizomes (13.94 per shoot explant) compared to the controls. However, the average fresh weight of microrhizomes treated with the A3B3C1 (117.04 mg) was significantly lower than that of the T5 treatment (A2B2C3: 2.0 mg·L−1 BAP, 80 g·L−1 sucrose, and 20-h photoperiod), which yielded the highest microrhizome fresh weight in the original orthogonal experiment. Similar observations were made by Singh et al. [30], who noted that treatments favoring microrhizome production were typically associated with a lower average fresh weight. Previous studies have indicated that the size and fresh weight of in vitro-induced microrhizomes have an impact on their sprouting percentage [18]. This study also found that the sprouting percentage of the microrhizomes was significantly affected by their fresh weight. Desiccation is a significant factor that adversely affects the storage life and quality of ginger rhizomes [45,46], leading to a reduction in the sprouting percentage. To maintain the quality of ginger rhizomes, it is important to prevent desiccation. This study found that larger microrhizomes were more resistant to water loss, which could explain their higher sprouting percentage during air drying.
Therefore, we attempted to increase the microrhizome fresh weight based on the optimal condition combination (A3B3C1) in this study. The results showed that an additional 30 days of culture under the optimal conditions significantly increased the average microrhizome fresh weight to 280.3 mg. This finding is supported by Rani et al. [22], who reported that the fresh weight of microrhizomes increased with the duration of the induction period during the first three months of culture. In the second experiment, microrhizomes were isolated and cultured in vitro to increase their fresh weight. The results showed that using 100 g·L−1 sucrose was more efficient in inducing microrhizome production, with an average of 21.3 new microrhizomes and an average fresh weight of 403.4 mg. This approach achieved notably superior efficiency compared to earlier ginger reports [23,26,29,30]. The study found that the average fresh weight was sufficient, with samples containing large microrhizomes and a high sprout percentage. In addition, the newly produced microrhizomes and the regenerated multiple shoots grew normally after four months of culture. In other Zingiberaceae species, microrhizomes have been found to be preserved in vitro for up to six months [14]. Therefore, the in vitro-induced microrhizomes have the potential to produce large quantities of new, high-quality microrhizomes in vitro and to conserve germplasm in ginger.
Genetic uniformity of in vitro-produced progenies is critical for commercial applications [34,35]. However, numerous factors, including the explant sources, medium components, and duration and number of subcultures, can induce morphological, cytological, genetic, and epigenetic variations in regenerated plants [47]. Although the most suitable medium for microrhizome induction (A3B3C1) contains a high amount of BAP (3.0 mg·L−1) and sucrose (100 g·L−1), the genetic homogeneity of the TC, MR, and FMR plants in this study was confirmed by flow cytometry analysis and SSR characterization. Genetic instability and somaclonal variation have rarely been reported in ginger [9,48], possibly due to the high genetic stability during in vitro culture [9]. However, the limited use of five plants and ten pairs of SSR primers in this study may provide insufficient genetic information of the regenerated population. Zhao et al. [9] used flow cytometry analysis and discovered that out of approximately 2000 in vitro-propagated ginger plants, five plants were mixoploid, containing both diploid and tetraploid cells. Therefore, more plants, primers, and methods are needed to comprehensively evaluate the genetic uniformity of microrhizome plants in the future.
After verification of the genetic uniformity, the MR, FMR and TC plants were grown in the field for comparative analysis of their growth performance and rhizome characteristics at harvest. Compared to the other two plant types, the MR plants showed superior growth performance in the field, exhibited the largest rhizomes and produced the most significant number and average weight and volume of rhizome fingers. In Curcuma longa, Nayak and Naik [36] also found that the in vitro-raised plants with microrhizomes produced a larger rhizome yield than the micropropagated plants without microrhizomes. Seed rhizome size is known to significantly affect growth and rhizome yield in ginger [49]. In addition to biologically active constituents, ginger rhizomes contain an abundance of carbohydrates, proteins, and other nutrients necessary for the growth of young plants [2,49]. As a result, the growth and rhizome yield of the MR plants were improved compared to the TC plants. This result could be related to the fact that the microrhizomes of the MR plants contained nutrient components that promoted plant growth. In general, in vitro propagated plants produced low yield and small rhizome fingers in the first growing season in ginger [9,10]. This study further demonstrated that the tissue culture-derived plants produced the smallest size and weight of rhizome fingers. In addition, acclimation of in vitro regenerated plants may have several limitations, such as labor intensity, time consumption, and plant losses [11,12]. Conversely, it has been reported that the germinated microrhizomes have a high survival rate when transferred to the field without acclimatization [18,19,26]. In this study, the MR and TC plants required an acclimation process. In contrast, the FMR plants were obtained by sowing the sprouted microrhizomes directly into the substrate without acclimation. The results showed a significantly higher survival rate for both MR and FMR compared to TC, indicating that the two plant types were more easily able to adapt to the ex-vitro environment. Although the FMR plants produced significantly fewer rhizome fingers than the MR, the weight and volume of the rhizome fingers were similar to those of the MR, suggesting that both the MR and FMR plants had their unique advantages in producing disease-free seedling rhizomes in ginger in the first generation. However, additional research is needed to evaluate field performance and production in the following season.
5. Conclusions
This study presents an efficient procedure for the in vitro production of high-quality ginger microrhizomes with satisfactory field performance (Figure 8). Disease-free ginger plants grown in vitro are used as the starting materials. The largest number of microrhizomes is achieved after 60 days of culture on MS medium supplemented with 3.0 mg·L−1 BAP and 100 g·L−1 sucrose under a 12-h photoperiod (the optimal culture conditions). Induced microrhizomes are cultured under the optimal conditions for 60 days to obtain a sufficient number of large-sized microrhizomes. The MR and FMR plants can produce the first generation of disease-free rhizomes with an acceptable number and size of rhizome fingers. This protocol could contribute to producing genetically stable and disease-free ginger rhizomes more efficiently and cost-effectively than the traditional method. Additionally, this approach can be utilized to mass-produce high-quality ginger microrhizomes for various applications, including germplasm conservation, synthetic seed production, and secondary metabolite extraction.
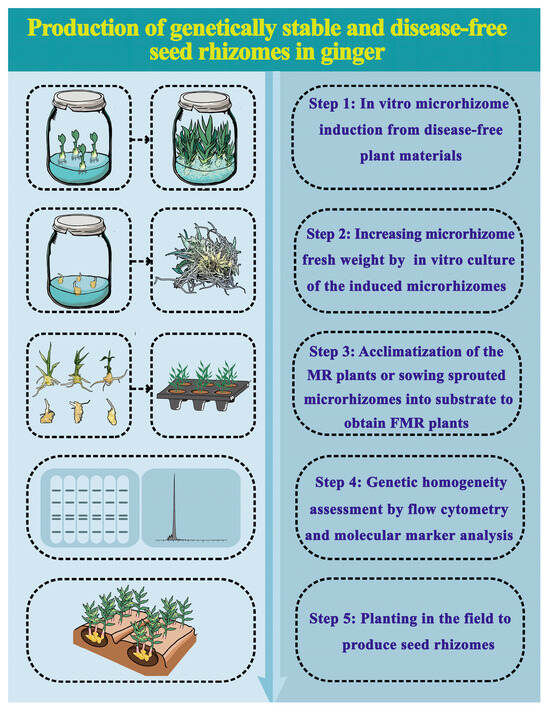
Figure 8.
A flow chart of genetically stable and disease-free rhizome production via in vitro induced ginger microrhizomes. The duration for Step 1, Step 2, Step 3, and Step 5 was 60 days, 30 days, 30 days, and approximately 200 days, respectively.
Supplementary Materials
The following supporting information can be downloaded at https://www.mdpi.com/article/10.3390/agronomy14040747/s1: Table S1: Code and sequence of 20 pairs of SSR primers used in this study. Table S2: Variance analysis of the number and fresh weight of the microrhizomes induced from the in vitro-grown ‘Fengtou’ ginger in the orthogonal design experiment of L9 (33). Figure S1: Representative shoots, roots, and microrhizomes produced from the plants of Zingiber officinale cv. ‘Fengtou’ after 60 days of culture under the nine treatments designed by an orthogonal array. Figure S2: The Field performance of the TC, MR, and FMR plants after 60 and 120 days of planting in the field.
Author Contributions
Conceptualization, X.C., S.Y. and L.H.; methodology, S.Y., L.H. and Y.L.; data curation, S.Y., L.H. and Y.L.; funding acquisition, X.C. and Y.L.; investigation, S.Y. and L.H.; resources, X.C. and Y.L.; writing—original draft, S.Y. and L.H.; writing—review and editing, X.C. and Y.L. All authors have read and agreed to the published version of the manuscript.
Funding
This study was funded by the Key Research and Development program of Hubei province under grant no. 2021BBA096 and no. 2022BBA0061.
Data Availability Statement
The data presented in the study are included in the article and the supplementary figures and tables. Further datasets are available from the corresponding authors during submission or after its publication.
Conflicts of Interest
The authors declare no conflicts of interest.
References
- Mustafa, I.; Chin, N.L. Antioxidant properties of dried ginger (Zingiber officinale Roscoe) var. Bentong. Foods 2023, 12, 178. [Google Scholar] [CrossRef]
- Garza-Cadena, C.; Ortega-Rivera, D.M.; Machorro-García, G.; Gonzalez-Zermeño, E.M.; Homma-Dueñas, D.; Plata-Gryl, M.; Castro-Muñoz, R. A comprehensive review on Ginger (Zingiber officinale) as a potential source of nutraceuticals for food formulations: Towards the polishing of gingerol and other present biomolecules. Food Chem. 2023, 413, 135629. [Google Scholar] [CrossRef]
- Subbarayudu, S.; Shankar Naik, B.; Sunitibala Devi, H.; Bhau, B.S.; Shaik Sha Valli Khan, P. Microsporogenesis and pollen formation in Zingiber officinale Roscoe. Plant Syst. Evol. 2014, 300, 619–632. [Google Scholar] [CrossRef]
- Guji, M.J.; Yetayew, H.T.; Kidanu, E.D. Yield loss of ginger (Zingiber officinale) due to bacterial wilt (Ralstonia solanacearum) in different wilt management systems in Ethiopia. Agric. Food Secur. 2019, 8, 5. [Google Scholar] [CrossRef]
- Zhou, J.; Liu, X.; Sun, C.; Li, G.; Yang, P.; Jia, Q.; Cai, X.; Zhu, Y.; Yin, J.; Liu, Y. Silica nanoparticles enhance the disease resistance of ginger to rhizome rot during postharvest storage. Nanomaterials 2022, 12, 1418. [Google Scholar] [CrossRef]
- Salokhe, S. Development of an efficient protocol for production of healthy sugarcane seed cane through Meristem culture. J. Agric. Food Res. 2021, 4, 100126. [Google Scholar] [CrossRef]
- Kim, S.H.; Zebro, M.; Jang, D.C.; Sim, J.E.; Park, H.K.; Kim, K.Y.; Bae, H.M.; Tilahun, S.; Park, S.M. Optimization of plant growth regulators for in vitro mass propagation of a disease-free ‘Shine Muscat’ grapevine cultivar. Curr. Issues Mol. Biol. 2023, 45, 7721–7733. [Google Scholar] [CrossRef]
- Sharma, T.R.; Singh, B.M. High-frequency in vitro multiplication of disease-free Zingiber officinale Rosc. Plant Cell Rep. 1997, 17, 68–72. [Google Scholar] [CrossRef]
- Zhao, X.; Yu, S.; Wang, Y.; Jiang, D.; Zhang, Y.; Hu, L.; Zhu, Y.; Jia, Q.; Yin, J.; Liu, Y.; et al. Field performance of disease-free plants of ginger produced by tissue culture and agronomic, cytological, and molecular characterization of the morphological variants. Agronomy 2022, 13, 74. [Google Scholar] [CrossRef]
- Lincy, A.K.; Jayarajan, K.; Sasikumar, B. Relationship between vegetative and rhizome characters and final rhizome yield in micropropagated ginger plants (Zingiber officinale Rosc.) over two generations. Sci. Hortic. 2008, 118, 70–73. [Google Scholar] [CrossRef]
- Asayesh, Z.M.; Vahdati, K.; Aliniaeifard, S. Investigation of physiological components involved in low water conservation capacity of in vitro walnut plants. Sci. Hortic. 2017, 224, 1–7. [Google Scholar] [CrossRef]
- Duan, J.X.; Duan, Q.X.; Zhang, S.F.; Cao, Y.M.; Cai, X.D. Morphological, physiological, anatomical and histochemical responses of micropropagated plants of Trichosanthes kirilowii to hydroponic and soil conditions during acclimatization. Plant Cell Tissue Organ Cult. 2020, 142, 177–186. [Google Scholar] [CrossRef]
- Osório, M.L.; Gonçalves, S.; Coelho, N.; Osório, J.; Romano, A. Morphological, physiological and oxidative stress markers during acclimatization and field transfer of micropropagated Tuberaria major plants. Plant Cell Tissue Organ Cult. 2013, 115, 85–97. [Google Scholar] [CrossRef]
- Nayak, S. In vitro multiplication and microrhizome induction in Curcuma aromatica Salisb. Plant Growth Regul. 2000, 32, 41–47. [Google Scholar] [CrossRef]
- Ho, N.T.H.; Thien, P.T.; Nhat, Q.H.; Hoang, A.N.; Ngoc, T.L.T.; Bao, L.N.D.; Minh, N.N.T.; Bich, P.T.T. Microrhizome induction and curcumin accumulation in Curcuma aromatica Salisb. Acta Agrobot. 2023, 75, 7511. [Google Scholar]
- Anjum, A.; Quraishi, A. Enhanced epicurzerenone production via in vitro elicitation of microrhizomes of Curcuma caesia Roxb. In Vitro Cell. Dev. Biol. Plant 2023, 59, 825–838. [Google Scholar] [CrossRef]
- Labrooy, C.; Abdullah, T.L.; Stanslas, J. Influence of N6-benzyladenine and sucrose on in vitro direct regeneration and microrhizome induction of Kaempferia parviflora Wall. Ex Baker, an important ethnomedicinal herb of Asia. Trop. Life Sci. Res. 2020, 31, 123–139. [Google Scholar] [CrossRef]
- Shirgurkar, M.V.; John, C.K.; Nadgauda, R.S. Factors affecting in vitro microrhizome production in turmeric. Plant Cell Tissue Organ Cult. 2001, 64, 5–11. [Google Scholar] [CrossRef]
- Devi, N.S.; Kishor, R.; Sharma, G.J. Microrhizome induction in Acorus calamus Linn.—An important medicinal and aromatic plant. Hort. Environ. Biotechnol. 2012, 53, 410–414. [Google Scholar] [CrossRef]
- Brijesh, H.; Ajjappala, B. Micropropagation strategies in medicinally important turmeric (Curcuma sp.): Current research and future challenges. J. Appl. Biol. Biotechnol. 2023, 11, 1–8. [Google Scholar] [CrossRef]
- Quraishi, A.; Mehar, S.; Sahu, D.; Jadhav, S.K. In vitro mid-term conservation of Acorus calamus L. via cold storage of encapsulated microrhizome. Braz. Arch. Biol. Technol. 2017, 60, e17160378. [Google Scholar] [CrossRef]
- Rani, M.; Shylaja, M.R.; Mathew, D.; Girija, D.; Shankar, M.A.; Sureshkumar, P.; Beena, C. Potential of microrhizomes for in vitro gingerol and shogaol synthesis in ginger (Zingiber officinale Rosc.). Proc. Natl. Acad. Sci. USA 2022, 92, 121–129. [Google Scholar] [CrossRef]
- Rout, G.R.; Palai, S.K.; Samantaray, S.; Das, P. Effect of growth regulator and culture conditions on shoot multiplication and rhizome formation in ginger (Zingiber officinale Rosc.) in vitro. In Vitro Cell. Dev. Biol. Plant 2001, 37, 814–819. [Google Scholar] [CrossRef]
- Zheng, Y.; Liu, Y.; Ma, M.; Xu, K. Increasing in vitro microrhizome production of ginger (Zingiber officinale Roscoe). Acta Physiol. Plant 2008, 30, 513–519. [Google Scholar] [CrossRef]
- David, D.; Chuwan, L.E.; Gansau, J.A. Optimizing sucrose and BAP concentrations for in vitro microrhizome induction of Zingiber officinale Rosc. ‘Tambunan’. Malays. Appl. Biol. 2018, 47, 47–52. [Google Scholar]
- Zahid, N.A.; Jaafar, H.Z.E.; Hakiman, M. Alterations in microrhizome induction, shoot multiplication and rooting of ginger (Zingiber officinale Roscoe) var. Bentong with regards to sucrose and plant growth regulators application. Agronomy 2021, 11, 320. [Google Scholar] [CrossRef]
- Thingbaijam, D.S.; Huidrom, D.S. High frequency plant regeneration system from transverse thin cell layer section of in vitro derived ‘Nadia’ ginger microrhizome. Not. Sci. Biol. 2014, 6, 85–91. [Google Scholar] [CrossRef]
- An, N.H.; Chien, T.T.M.; Nhi, H.T.H.; Nga, N.T.M.; Phuc, T.T.; Thuy, L.T.N.; Thanh, T.V.B.; Nguyen, P.T.T.; Phuong, T.T.B. The effects of sucrose, silver nitrate, plant growth regulators, and ammonium nitrate on microrhizome induction in perennially-cultivated ginger (Zingiber officinale Roscoe) from Hue, Vietnam. Acta Agrobot. 2020, 73, 7329. [Google Scholar] [CrossRef]
- Abbas, M.; Aly, U.; Taha, H.; Gaber, E.S. In vitro production of microrhizomes in ginger (Zingiber officinale Rosco). J. Microbiol. Biotech. Food Sci. 2014, 4, 142–148. [Google Scholar] [CrossRef]
- Singh, T.D.; Chakpram, L.; Devi, H.S. Induction of in vitro microrhizomes using silver nitrate in Zingiber officinale Rosc. var. Baishey and Nadia. Indian J. Biotechnol. 2014, 13, 256–262. [Google Scholar]
- Mehaboob, V.M.; Faizal, K.; Shamsudheen, K.M.; Raja, P.; Thiagu, G.; Shajahan, A. Direct organogenesis and microrhizome production in ginger (Zingiber officinale Rosc.). J. Pharmacogn. Phytochem. 2019, 8, 2880–2883. [Google Scholar]
- Swarnathilaka, D.B.R.; Kottearachchi, N.S.; Weerakkody, W.J.S.K. Factors affecting on induction of microrhizomes in ginger (Zingiber officinale Rosc.), cultivar local from Sri Lanka. Br. Biotechnol. J. 2016, 12, 1–7. [Google Scholar] [CrossRef]
- Monthony, A.S.; Page, S.R.; Hesami, M.; Jones, A.M.P. The past, present and future of Cannabis sativa Tissue culture. Plants 2021, 10, 185. [Google Scholar] [CrossRef] [PubMed]
- Ahmad, Z.; Yadav, V.; Shahzad, A.; Emamverdian, A.; Ramakrishnan, M.; Ding, Y. Micropropagation, encapsulation, physiological, and genetic homogeneity assessment in Casuarina equisetifolia. Front. Plant Sci. 2022, 13, 905444. [Google Scholar] [CrossRef] [PubMed]
- Zhang, Y.; Zhang, J.; Yin, J.; Liu, Y.; Cai, X. Plant regeneration via organogenesis in Jerusalem artichokes and comparative analysis of endogenous hormones and antioxidant enzymes in typical and atypical shoots. Plants 2023, 12, 3789. [Google Scholar] [CrossRef] [PubMed]
- Nayak, S.; Naik, P.K. Factors effecting in vitro microrhizome formation and growth in Curcuma longa L. and improved field performance of micropropagated plants. Sci. Asia 2006, 32, 31–37. [Google Scholar] [CrossRef]
- Murashige, T.; Skoog, F. A revised medium for rapid growth and bioassays with tobacco tissue cultures. Physiol. Plant. 1962, 15, 473–497. [Google Scholar] [CrossRef]
- Qu, C.L.; Lin, S.M.; Potiyaraj, P.; Meng, L.; Wu, C.S.; Yuan, L.; Luo, X.; Ge, F.F.; Tsou, C.H. Polymer packaging through the blending of biowaste oyster shell and low-density polyethylene: A sustainable approach for enhanced food preservation. Polymers 2023, 15, 3977. [Google Scholar] [CrossRef]
- Zhang, Y.S.; Chen, J.J.; Cao, Y.M.; Duan, J.X.; Cai, X.D. Induction of tetraploids in ‘Red Flash’ caladium using colchicine and oryzalin: Morphological, cytological, photosynthetic and chilling tolerance analysis. Sci. Hortic. 2020, 272, 109524. [Google Scholar] [CrossRef]
- Fulton, T.M.; Chunwongse, J.; Tanksley, S.D. Microprep protocol for extraction of DNA from tomato and other herbaceous plants. Plant Mol. Biol. Rep. 1995, 13, 207–209. [Google Scholar] [CrossRef]
- Yu, S.; Zhao, X.; Wang, Y.; Jiang, D.; Zhang, Y.; Hu, L.; Liu, Y.; Cai, X. Morphological, cytological, and molecular-based genetic stability analysis of in vitro-propagated plants from newly induced aneuploids in caladium. Agriculture 2022, 12, 1708. [Google Scholar] [CrossRef]
- Zambrano Blanco, E.; Baldin Pinheiro, J. Agronomic evaluation and clonal selection of ginger genotypes (Zingiber officinale Roscoe) in Brazil. Agron. Colomb. 2017, 35, 275–284. [Google Scholar] [CrossRef]
- Hussein, S.A.; Noori, A.M.; Kanber, H.S. Stratification period with different agricultural media roll on seeds germination ratio and humic acid fertilization on apricot seedlings Prunus armeniaca L. growth. Plant Cell Biotech. Mol. Biol. 2020, 21, 23–29. [Google Scholar]
- Ascough, G.D.; van Staden, J.; Erwin, J.E. In vitro storage organ formation of ornamental geophytes. Hortic. Rev. 2008, 34, 417–445. [Google Scholar] [CrossRef]
- Wu, L.; Li, H.; Jiang, Y.; Sun, C.; Zou, Y.; Liu, Y. Effect of waxing on postharvest quality and storability of ginger (Zingiber officinal Roscoe). Pak. J. Bot. 2020, 52, 147–153. [Google Scholar] [CrossRef] [PubMed]
- Olakunle, O.J.; Olusoga, S.; Batola, L.A.; Atanda, T.T. Effects of pre-storage treatments on sprouting and nutritional quality of ginger (Zingiber officinale Rosc.) rhizomes in different storage periods. Int. J. Agric. 2016, 1, 41–50. [Google Scholar]
- Krishna, H.; Alizadeh, M.; Singh, D.; Singh, U.; Chauhan, N.; Eftekhari, M.; Sadh, R.K. Somaclonal variations and their applications in horticultural crops improvement. 3 Biotech 2016, 6, 54. [Google Scholar] [CrossRef]
- Abd El-Hameid, A.R.; Abo El-kheir, Z.A.; Abdel-Hady, M.S.; Helmy, W.A. Identification of DNA variation in callus derived from Zingiber officinale and anticoagulation activities of ginger rhizome and callus. Bull. Natl. Res. Cent. 2020, 44, 28. [Google Scholar] [CrossRef][Green Version]
- Mahender, B.; Reddy, P.S.S.; Sivaram, G.T.; Balakrishna, M.; Prathap, B. Effect of seed rhizome size and plant spacing on growth, yield and quality of ginger (Zingiber officinale Rosc.) under coconut cropping system. Plant Arch. 2015, 15, 769–774. [Google Scholar]


Disclaimer/Publisher’s Note: The statements, opinions and data contained in all publications are solely those of the individual author(s) and contributor(s) and not of MDPI and/or the editor(s). MDPI and/or the editor(s) disclaim responsibility for any injury to people or property resulting from any ideas, methods, instructions or products referred to in the content. |
© 2024 by the authors. Licensee MDPI, Basel, Switzerland. This article is an open access article distributed under the terms and conditions of the Creative Commons Attribution (CC BY) license (https://creativecommons.org/licenses/by/4.0/).