Abstract
The use of high tunnels, which allows growers to extend their season and improve yields, is increasing in the Southeastern U.S., yet growers face challenges related to weed and disease management, particularly in organic systems. On-station experiments were conducted during fall 2021 and spring 2022 in a split-plot design to assess the efficacy of anaerobic soil disinfestation (ASD) in high tunnels for the organic production of direct-seeded baby leaf lettuce. Soil treatments (ASD, Compost, and Control) and lettuce types (romaine and oakleaf cultivars) were included in whole plots and subplots, respectively. The ASD-treated soils received molasses and granular organic fertilizer as carbon and nitrogen sources. The Compost treatment involved the application of yard waste-based compost and the same organic fertilizer, while the Control soils received organic fertilizer only. The ASD treatment period lasted 8 days rather than the typical 21-day period evaluated in Florida. Crop yield, biometrics (leafy dry matter content, specific leaf area, specific leaf weight), and lettuce quality attributes (leaf color, soluble solids content, total titratable acidity, ferric reducing antioxidant power, ascorbic acid content, total phenolics) were assessed following harvest. In both trials, numerical differences in lettuce fresh weight yield between soil treatments were evident, though not statistically significant. Differences in leaf quality attributes were driven by lettuce cultivar rather than soil treatments. Bottom rot incidence caused by Rhizoctonia solani was reduced by 93% and 87% in the ASD-treated plots compared with the Compost- and Control-treated soils during the spring 2022 trial. The ASD-treated soils had a reduced population density of broadleaf weeds in both baby leaf lettuce production trials. The current study presents novel evidence of the potential of integrating ASD into HT organic production systems without reducing the yield and quality attributes of direct-seeded baby leafy greens compared with common grower practices.
1. Introduction
High tunnels (HTs) are unheated, plastic-covered structures that utilize solar energy as a passive form of heating, along with ventilation for passive cooling [1]. Compared with open field (OF) and greenhouse production systems, HTs provide an intermediate level of protection against extreme environmental conditions including unfavorable temperatures, strong winds, direct rainfall, and intense solar radiation [2]. Aided by government financial support in the U.S. from the High Tunnel Initiative as part of the Natural Resources Conservation Service (NRCS)–Environmental Quality Incentives Program (EQIP) [3], the popularity of HTs has risen at the national and Florida-state levels. In a CABI (Commonwealth Agricultural Bureaux International) direct database search of peer-reviewed journal articles published in the U.S. from 1980 to 2009, only four studies containing either “hightunnel” or “high tunnel” in the title were identified. Yet between 2010 and 2023, that number increased to 38. Among the 38 identified studies, 26% contained either “lettuce” (Lactuca sativa), “leafy green”, spinach” (Spinacia oleracea), “arugula” (Eruca vesicaria), or “organic” in the title.
Moreover, the popularity of HT production in the Southeastern U.S. has steadily increased over the past two decades. Based on the most recent Florida-specific data, the use of HTs increased from nearly 0 to 76 ha between 2001 and 2013 [4]. While this reflects a state-wide survey of 240 grower operations larger than 1.2 ha, additional large-scale operations have since developed [5]. As HTs continue to increase in popularity among small- and large-scale producers in Florida, research-based recommendations are needed to address growers’ concerns related to high humidity and rapidly fluctuating seasonal temperatures, the poor retention of water and nutrients in sandy soils, and pest, disease, and weed pressure [6].
One pre-plant technique that has gained considerable attention and shows promise as an alternative to chemical soil fumigation for disease and weed management is anaerobic soil disinfestation (ASD). ASD is dependent on the bioavailability of added carbon (C) amendments coupled with irrigation to soil saturation within the topsoil profile, which promotes soil microbial respiration and subsequent anaerobic conditions. Under reducing soil conditions, soil microbial decomposition of C amendments results in the formation of anaerobic metabolites such as short-chain fatty acids and volatile compounds that are likely toxic to and inhibit weed seed germination and pathogen viability [7]. The ASD treatment period can range from 14 days to several weeks depending on climatic conditions [8]. Previous studies have focused on the influence of soil temperature, soil type, soil depth, treatment duration, and C source on the effectiveness of ASD as a preplant management technique. However, according to previous review articles [9,10], no studies have been conducted in organically managed HT systems. In addition, no studies investigating ASD in HT systems for the organic production of baby leaf lettuce in Florida have been published. Lettuce is commonly grown in muck soils in south Florida, while limited information is available on lettuce production in central and northern Florida, where sandy soils with low levels of organic matter predominate. Recently, breeding efforts have been initiated to determine the adaptability of butterhead, iceberg, loose leaf, and romaine lettuces to sandy soils in Florida [11]. Unsurprisingly, information is lacking regarding the impact of ASD on the different genotypes of baby leaf lettuce grown organically in HT systems.
HTs are considered high-value real estate in terms of production area, and growers may be reluctant to wait several weeks between harvest and subsequent planting. Therefore, ASD should be optimized for direct-seeded crops such as baby leaf lettuce grown in organically managed HT systems. One way to optimize ASD for direct-seeded crops is to reduce the ASD treatment period. Doing so would allow for a quicker turnover from one crop to the next and may remove barriers to adoption among organic growers. Given the generally warmer conditions in HT vs. OF production, it is hypothesized that the ASD treatment period may be reduced in HT systems without compromising the suppressive effects on soilborne pathogens and weeds.
Therefore, the overall objective of this study was to determine the effectiveness of ASD for the soilborne disease and weed management of baby leaf lettuce in an organically managed HT production system. Moreover, this study aimed to assess the impact of ASD on the performance of multiple cultivars of four lettuce types (red oakleaf, green oakleaf, red romaine, and green romaine) that are commonly grown in HTs in the Southeastern U.S.
2. Materials and Methods
2.1. Field Experiments
Field trials were conducted in two production seasons on certified organic land at the University of Florida Plant Science Research and Education Unit in Citra, Florida. A trial was conducted in the fall between 1 November 2021 and 26 December 2021 and repeated in the spring between 18 April and 26 May 2022. In between lettuce trials, arugula (Eruca sativa ‘Astro’; Johnny’s Selected Seeds, Winslow, ME, USA) was seeded for crop rotation. Lettuce was direct seeded on 11 November 2021 and 28 April 2022 during the fall and spring trials, respectively, using a Jang JP-1 push seeder (Johnny’s Selected Seeds, Winslow, ME, USA). There were four rows in each bed, with 5.1 cm as the spacing between plants, and 21.6 cm between the rows in each bed. During the fall trial, each experimental unit measured 86.4 cm wide by 6.1 m long. To accommodate the additional four lettuce cultivars, the experimental units measured 86.4 cm wide by 3.0 m long during the spring trial. Based on field calibrations, two seeds were dispensed simultaneously at each 5.1 cm spacing. Accordingly, the total plant population for each lettuce cultivar within a soil treatment was 956 during fall 2021 trial and 478 during spring 2022 trial. Baby leaf lettuce was harvested 45 days after sowing (DAS) on 26 December 2021 (fall trial) and 28 DAS on 26 May 2022 (spring trial).
The soil type was classified as Gainesville loamy sand (Hyperthermic, coated Typic Quartzipsamments) with 96.8% sand, 2.0% clay, 1.2% silt, and a soil bulk density of 1.54 g cm−3. The soil was thoroughly rototilled at 15 cm below the soil line in the experimental plots at the time of field preparation. In both seasons, the field trials were arranged in a split-plot design. Four north–south-oriented caterpillar HTs (30.5 m long × 4.3 m wide × 2.7 m high) were used as four replications. The pre-plant soil treatments (ASD, Compost, and Control) were included in the whole plots following a randomized complete block design (RCBD), with lettuce cultivars randomized in the subplots. Whole plots were re-randomized in each trial. The ASD treatment consisted of applying ASD with 6.9 m3 ha−1 of molasses (Agricultural Carbon Source, TerraFeed, LLC, Plant City, FL, USA) and 6.8 Mg ha−1 of granular organic fertilizer (Everlizer®, heat-treated chicken litter, 3%N-3%P2O5-3%K2O; Live Oak, FL, USA), the Compost treatment involved the use of 6.8 Mg ha−1 Everlizer® and 22.4 Mg ha−1 yard waste compost (YWC), and the Control treatment involved the application of only 6.8 Mg ha−1 Everlizer®.
Three false beds (24.4 m long, 0.9 m wide, 5 cm high, and 0.9 m between bed centers) were made in each of the four blocks (replications) and randomly assigned to ASD, Compost, or Control. A 1:1 (v:v) water dilution of molasses and Everlizer® were used to set up the ASD treatment. The water and molasses mixture was applied to the top of the bed and tilled at a soil depth of 15 cm with a rotary cultivator to evenly amend the soil following common grower practices. The beds undergoing ASD treatment were irrigated using overhead sprinkler irrigation (Netafim USA, Fresno, CA, USA) with an output of 69.7 L h−1 at 241.3 kPa water pressure. Overhead irrigation was attached to the main center ridge in each HT and measured 2.4 m above the ground. The total run time required to saturate the upper 5 cm of the ASD beds was 1.9 h. The Compost and Control treatment beds were covered with a 6 mil (0.152 mm) silage tarp to prevent those plots from receiving irrigation during the initiation of the ASD soil treatment. After the irrigation of the ASD beds, a 0.025 mm black VaporSafe® TIF (Raven Industries Inc., Sioux Falls, SD, USA) polyethylene mulch with an ethylene vinyl alcohol (EVOH) barrier layer was used to cover the ASD beds for 8 days. Compost + Everlizer® and Everlizer® alone were applied to the Compost and Control treatments and tilled at a soil depth of 15 cm with a rotary cultivator, respectively, after the 8-day ASD treatment period had ended, and the TIF mulch covering the ASD beds were removed. Lettuce was direct seeded to a depth of 2.5 cm 10 days after the ASD soil treatment was initiated using a Jang JP-1 push seeder (Johnny’s Selected Seeds, Winslow, ME, USA). There were four rows in each bed, with 5.1 cm as the spacing between plants and 21.6 cm between the rows in each bed.
2.2. Lettuce Cultivars
During the fall trial, four lettuce cultivars were used (red oakleaf ‘3SX1012’, green oakleaf ‘3SX3202’, red romaine ‘3SX3506’, and green romaine ‘3SX3410’; 3 Star Lettuce, Gonzales, CA, USA). During the spring trial, an additional four cultivars were included (red oakleaf ‘Garrison’, green oakleaf ‘Clearwater’, red romaine ‘Powerhouse’, and green romaine ‘Carlsbad’; Johnny’s Selected Seeds, Winslow, ME, USA). The lettuce cultivars used during the fall trial represent the lettuce types being evaluated in Florida sandy soils compared with muck soils in Florida [11]. Four additional cultivars (two romaine type and two oakleaf type) were included during the spring trial to further expand the representation of lettuce cultivars commonly grown in HTs in the Southeastern U.S.
2.3. Environmental Conditions and Sensor Installation
Soil redox potential (Eh), soil temperature, and soil volumetric water content (VWC) were continuously monitored during the ASD treatment period. Two oxidation–reduction potential sensors (PT combination electrodes, Ag/AgCl reference; Sensorex, Garden Grove, CA, USA) and two soil temperature/VWC sensors (CS655; Campbell Scientific, Logan, UT, USA) were installed to a depth of 15 cm in each plot to measure soil redox potential and soil temperature/VWC, respectively. Data were continuously recorded, as measurements taken every 15 min, with an average value recorded every 60 min using an automatic data logging system (CR-1000x with AM 16/32 multiplexers; Campbell Scientific). Data were used to calculate the cumulative number of hours under anaerobic conditions. Raw soil redox potential values were corrected to relate to the redox potential of a standard hydrogen electrode. Soil anaerobic conditions were determined by the cumulative values of hourly average redox potential values below a critical redox potential (Ceh) [12].
2.4. Determination of Soil pH
Soil samples were taken randomly in each whole plot at a depth of 15 cm using a 1.9 cm diameter soil probe (Oakfield Apparatus Company, Oakfield, WI, USA). Six soil cores were pooled into one composite sample per plot. In each trial, baseline samples were taken prior to ASD treatment, and subsequent samples were taken at 1 and 8 days after treatment (DAT). The samples were analyzed in a commercial lab (Waters Agricultural Laboratories, Inc., Camilla, GA, USA).
2.5. Disease Scouting and Weed Assessment
Weekly scouting and periodic diagnostic tissue sampling were conducted during the fall and spring trials. Disease incidence (%) was estimated visually in each subplot based on the percentage of symptomatic plants.
Using two sampling quadrats (0.30 m2) in each experimental unit, weed assessment was conducted at 7 and 40 DAS during the fall trial and at 7 and 27 DAS during the spring trial. The weeds in each subplot were counted and categorized as broadleaf, grass, or sedge. The weeds were removed by hand after counting. The number of weeds is reported herein on a per m2 basis (weed population density).
2.6. Crop Yield and Biometric Measurements
At harvest, the plants in each experimental unit were cut approximately 2.5 cm above the soil line using a hand-operated Quick-cut Greens Harvester (Farmers Friend, Centerville, TN, USA) to determine fresh weight biomass. The fresh weight yield is reported herein on a per m2 basis. Prior to harvesting, two sampling quadrats (0.30 m2) were used in each subplot to assess specific leaf area (SLA, mm2 mg−1 dry weight) and specific leaf weight (SLW, mg dry weight mm−2 leaf area). For the determination of SLA and SLW, the baby leaf lettuce leaves within each sampling quadrat were cut using scissors at 2.5 cm above the soil line. Fresh weight was recorded. The fresh weight biomass from the quadrat samples was included in total fresh weight biomass in each experimental unit. Leaf area was determined using a leaf area meter LI-3100C (LI-COR Environmental, Inc., Lincoln, NE, USA). The leaves were dried at 65 °C until constant weight. The dried samples were used to determine leaf dry matter content.
2.7. Determination of Lettuce Quality Attributes
Lettuce leaf color was measured immediately after harvest in both the fall and spring trials using fresh samples. Color was measured using a chroma meter (CR-400; Konica Minolta Sensing Americas, Inc., Ramsey, NJ, USA). Five readings were taken on the adaxial side of five leaf blades along the leaf edges to avoid the midrib in each experimental unit with the average readings recorded. The leaves were evaluated by lightness* (L*; 0 = black, 100 = white), chroma* value (C*) as the color purity (0 = dull/low purity, 60 = bright/high purity), hue* angle (h*; 0° = red, 90° = yellow, 180° = green), a* value (green = ‘−’ to red = ‘+’), and b* value (blue = ‘−’ to yellow = ‘+’). When differences in L*, a*, or b* values between the soil treatments or lettuce cultivars were observed, the total difference in color was determined according to the color space defined by the Commission Internationale de l’Eclairage (CIE) using the following formula:
Similarly, when differences in C* or h* values between the soil treatments or lettuce cultivars were observed, the total difference in color was determined according to the color space defined by CIE using the following formula:
For the determination of soluble solids content (SSC) and total titratable acidity (TTA), 200 g of fresh sample was placed in a zip lock plastic bag and stored at −30 °C following crop harvest. Frozen samples (50 g) were thawed, homogenized for 1 min at 4 °C (GLH 850 homogenizer; Omni International, Inc., Kennesaw, GA, USA), and centrifuged at 17,600× gn for 20 min at 4 °C (Sorvall LYNX 4000 Superspeed Centrifuge; Thermo Scientific, Pittsburgh, PA, USA). Supernatants were then filtered through a Whatman #4 filter paper and placed in 20 mL plastic vials for SSC and TTA measurements. SSC was determined by Pasteur pipetting 1 mL of sample supernatant onto an ultraprecision, temperature-compensating digital refractometer (r2i300; Reichert Technologies, Depew, NY, USA) and was expressed as °Brix. TTA was determined using an automatic titrator (905 Titrando; Metrohm Ion Analysis, Herisau, Switzerland) using 0.1 N NaOH to a pH 8.1 endpoint and was expressed as % citric acid based on the acid milliequivalents.
Total phenolic content (TPC) was analyzed using hydrophilic extraction and the Folin–Ciocalteu reaction. Frozen samples (50 g) were thawed, homogenized for 1 min at 4 °C (GLH 850 homogenizer; Omni International, Inc., Kennesaw, GA, USA), and centrifuged at 17,600× gn for 20 min at 4 °C (Sorvall LYNX 4000 Superspeed Centrifuge; Thermo Scientific, Pittsburgh, PA, USA). Supernatants were filtered through a Whatman #4 filter paper and placed in 20 mL plastic vials. The supernatants (0.5 mL) were diluted with 10 mL deionized water, and deionized water was used as a blank. Then, 2.5 mL of 0.2 N Folin–Ciocalteu reagent was added to triplicate samples and blanks, followed by 2.0 mL of 7.5% NaOH. The samples were capped, vortexed for 20 s, and incubated in a 45 °C hot water bath for 15 min. Triplicate aliquots of 250 μL of the mixture were pipetted onto a 96-well microplate, and absorbance was measured at 765 nm on a microplate reader (Synergy HTX Multi-mode reader, BioTek Instruments Inc., Winooski, VT, USA) after 1 min. TPC was then calculated based on an established standard curve constructed using gallic acid from 0.6 to 3 mg mL−1 with 0.6 mg mL−1 intervals.
The determination of the ferric reducing antioxidant power (FRAP) followed the procedures of Benzie and Strain [13]. Briefly, three stock solutions including 10 mM tripyridyltriazine (TPTZ), 20 mM ferric chloride, and 300 mM sodium acetate buffer (pH adjusted to 3.6) were prepared and combined into a working solution at a ratio of 1:1:10 (v:v:v). Trolox® standards were prepared at concentrations from 20 to 120 μM with 20 μM intervals to produce a standard curve. Triplicate 20 μL aliquots of extracted samples were mixed with 960 μL aliquots of working solution by pipetting into 96-cell plate wells. Absorbance was measured at 593 nm on a microplate reader (Synergy HTX Multi-mode reader, BioTek Instruments Inc., Winooski, VT, USA). The FRAP values are expressed as mM of Trolox equivalents (TE) per 100 g fresh weight.
The ascorbic acid (AA) content of baby leaf lettuce was measured spectrophotometrically based on AOAC method 967.21 (AOAC, 2000). Briefly, 1.0 g of fresh lettuce tissue was homogenized for 1 min at 4 °C (GLH 850 homogenizer; Omni International, Inc., Kennesaw, GA, USA) in 20 mL 6% metaphosphoric acid containing 2 N glacial acetic acid mixture and centrifuged at 17,600× gn for 15 min at 4 °C (Sorvall LYNX 4000 Superspeed Centrifuge; Thermo Scientific, Pittsburgh, PA, USA). The supernatants were subsequently allowed to filter through Whatman #4 filter paper prior to analysis. Triplicate 1.0 mL aliquots from each sample were transferred into test tubes. To each test tube, 50 µL 0.2% 2,6-dichloroindophenol (DCIP) were added and then vortexed. All mixtures were kept at room temperature for 1 h before being thoroughly mixed with 1.0 mL of 2% thiourea in 5% metaphosphoric acid and 0.5 mL of 2% dinitrophenylhydrazine in 9 N sulfuric acid. Subsequently, reactions were allowed to incubate for 3 h in a water bath maintained at 60 °C. After 3 h, 2.5 mL 90% H2SO4 were added to each sample. The absorbance of 250 µL of the sample mixture was measured at 540 nm using a microplate reader (Synergy HTX Multi-mode reader, BioTek Instruments Inc., Winooski, VT, USA)). The AA content was calculated based on an established standard curve.
2.8. Statistical Analysis
Prior to statistical analysis, data were checked for normality and log or square root transformed when necessary to meet assumptions of linear mixed models. All data and results in tables and figures are the non-transformed values. Data were analyzed using a linear mixed model in the GLIMMIX procedure of SAS (Version 9.4; SAS Institute, Cary, NC, USA). Soil treatment and lettuce cultivar as well as their interaction were analyzed as fixed effects. Block and the block × soil treatment interaction were considered random effects. Sampling date (DAT) × soil treatment × lettuce cultivar within the block was analyzed as a random residual effect by fitting a first-order autoregressive [AR(1)] model to account for the repeated measures of sampling time using the “slice” statement to compare certain measurements over time for each soil treatment and lettuce cultivar. Multiple comparisons for each measurement among treatments were conducted using Fisher’s Least Significant Difference (LSD) test at α = 0.05. Pearson correlations were used to analyze the relationships between SLA and SLW using pooled data from all the soil treatments and cultivars within each trial.
3. Results
3.1. Soil Oxidation–Reduction Potential and Environmental Conditions
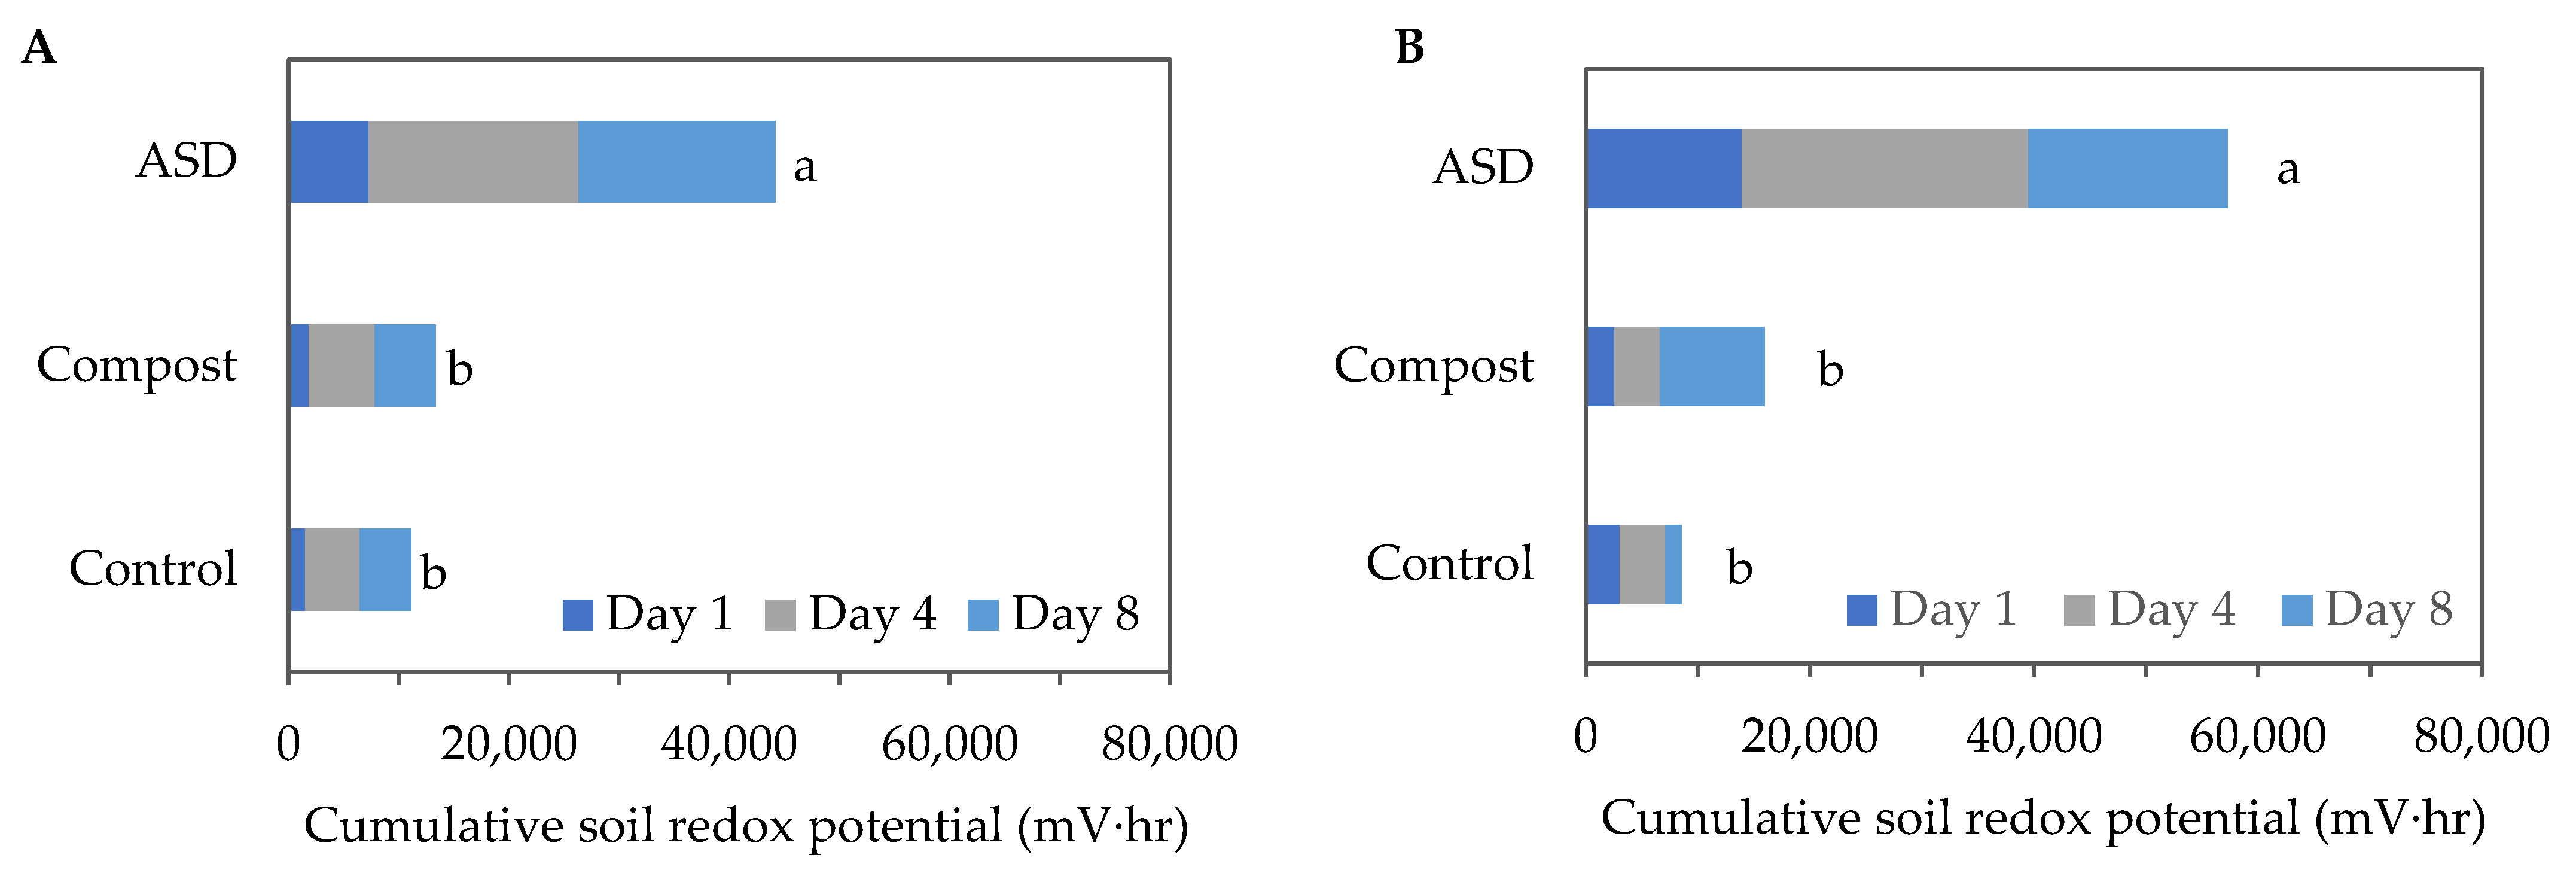
Cumulative soil oxidation–reduction (redox) potential levels were significantly higher in the ASD-treated soils compared with the Compost- and Control-treated soils during both trials. During the fall 2021 trial, the ASD-treated soil reached 44,164 mV∙h of cumulative soil redox potential following an 8-day treatment period, while the Compost and Control treatments reached 13,362 mV∙h and 11,138 mV∙h, respectively (Figure 1A). During the spring trial, the ASD-treated soil reached 57,263 mV∙h of cumulative anaerobic conditions following an 8-day treatment period, while the Compost- and Control-treated soils reached 15,948 mV∙h and 8562 mV∙h, respectively (Figure 1B).
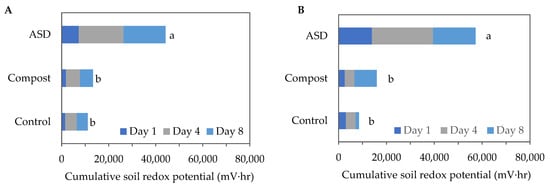
Figure 1.
Cumulative soil redox potential measured during the (A) fall 2021 and (B) spring 2022 trials. Means sharing the same letter are not significantly different according to Fisher’s LSD test at p ≤ 0.05. Values are the mean of n = 4 for each treatment. ASD: 6.9 m3 ha−1 molasses + 6.8 Mg ha−1 Everlizer 3-3-3; Compost: 6.8 Mg ha−1 Everlizer 3-3-3 + 22.4 Mg ha−1 yard waste compost; Control: 6.8 Mg ha−1 Everlizer 3-3-3.
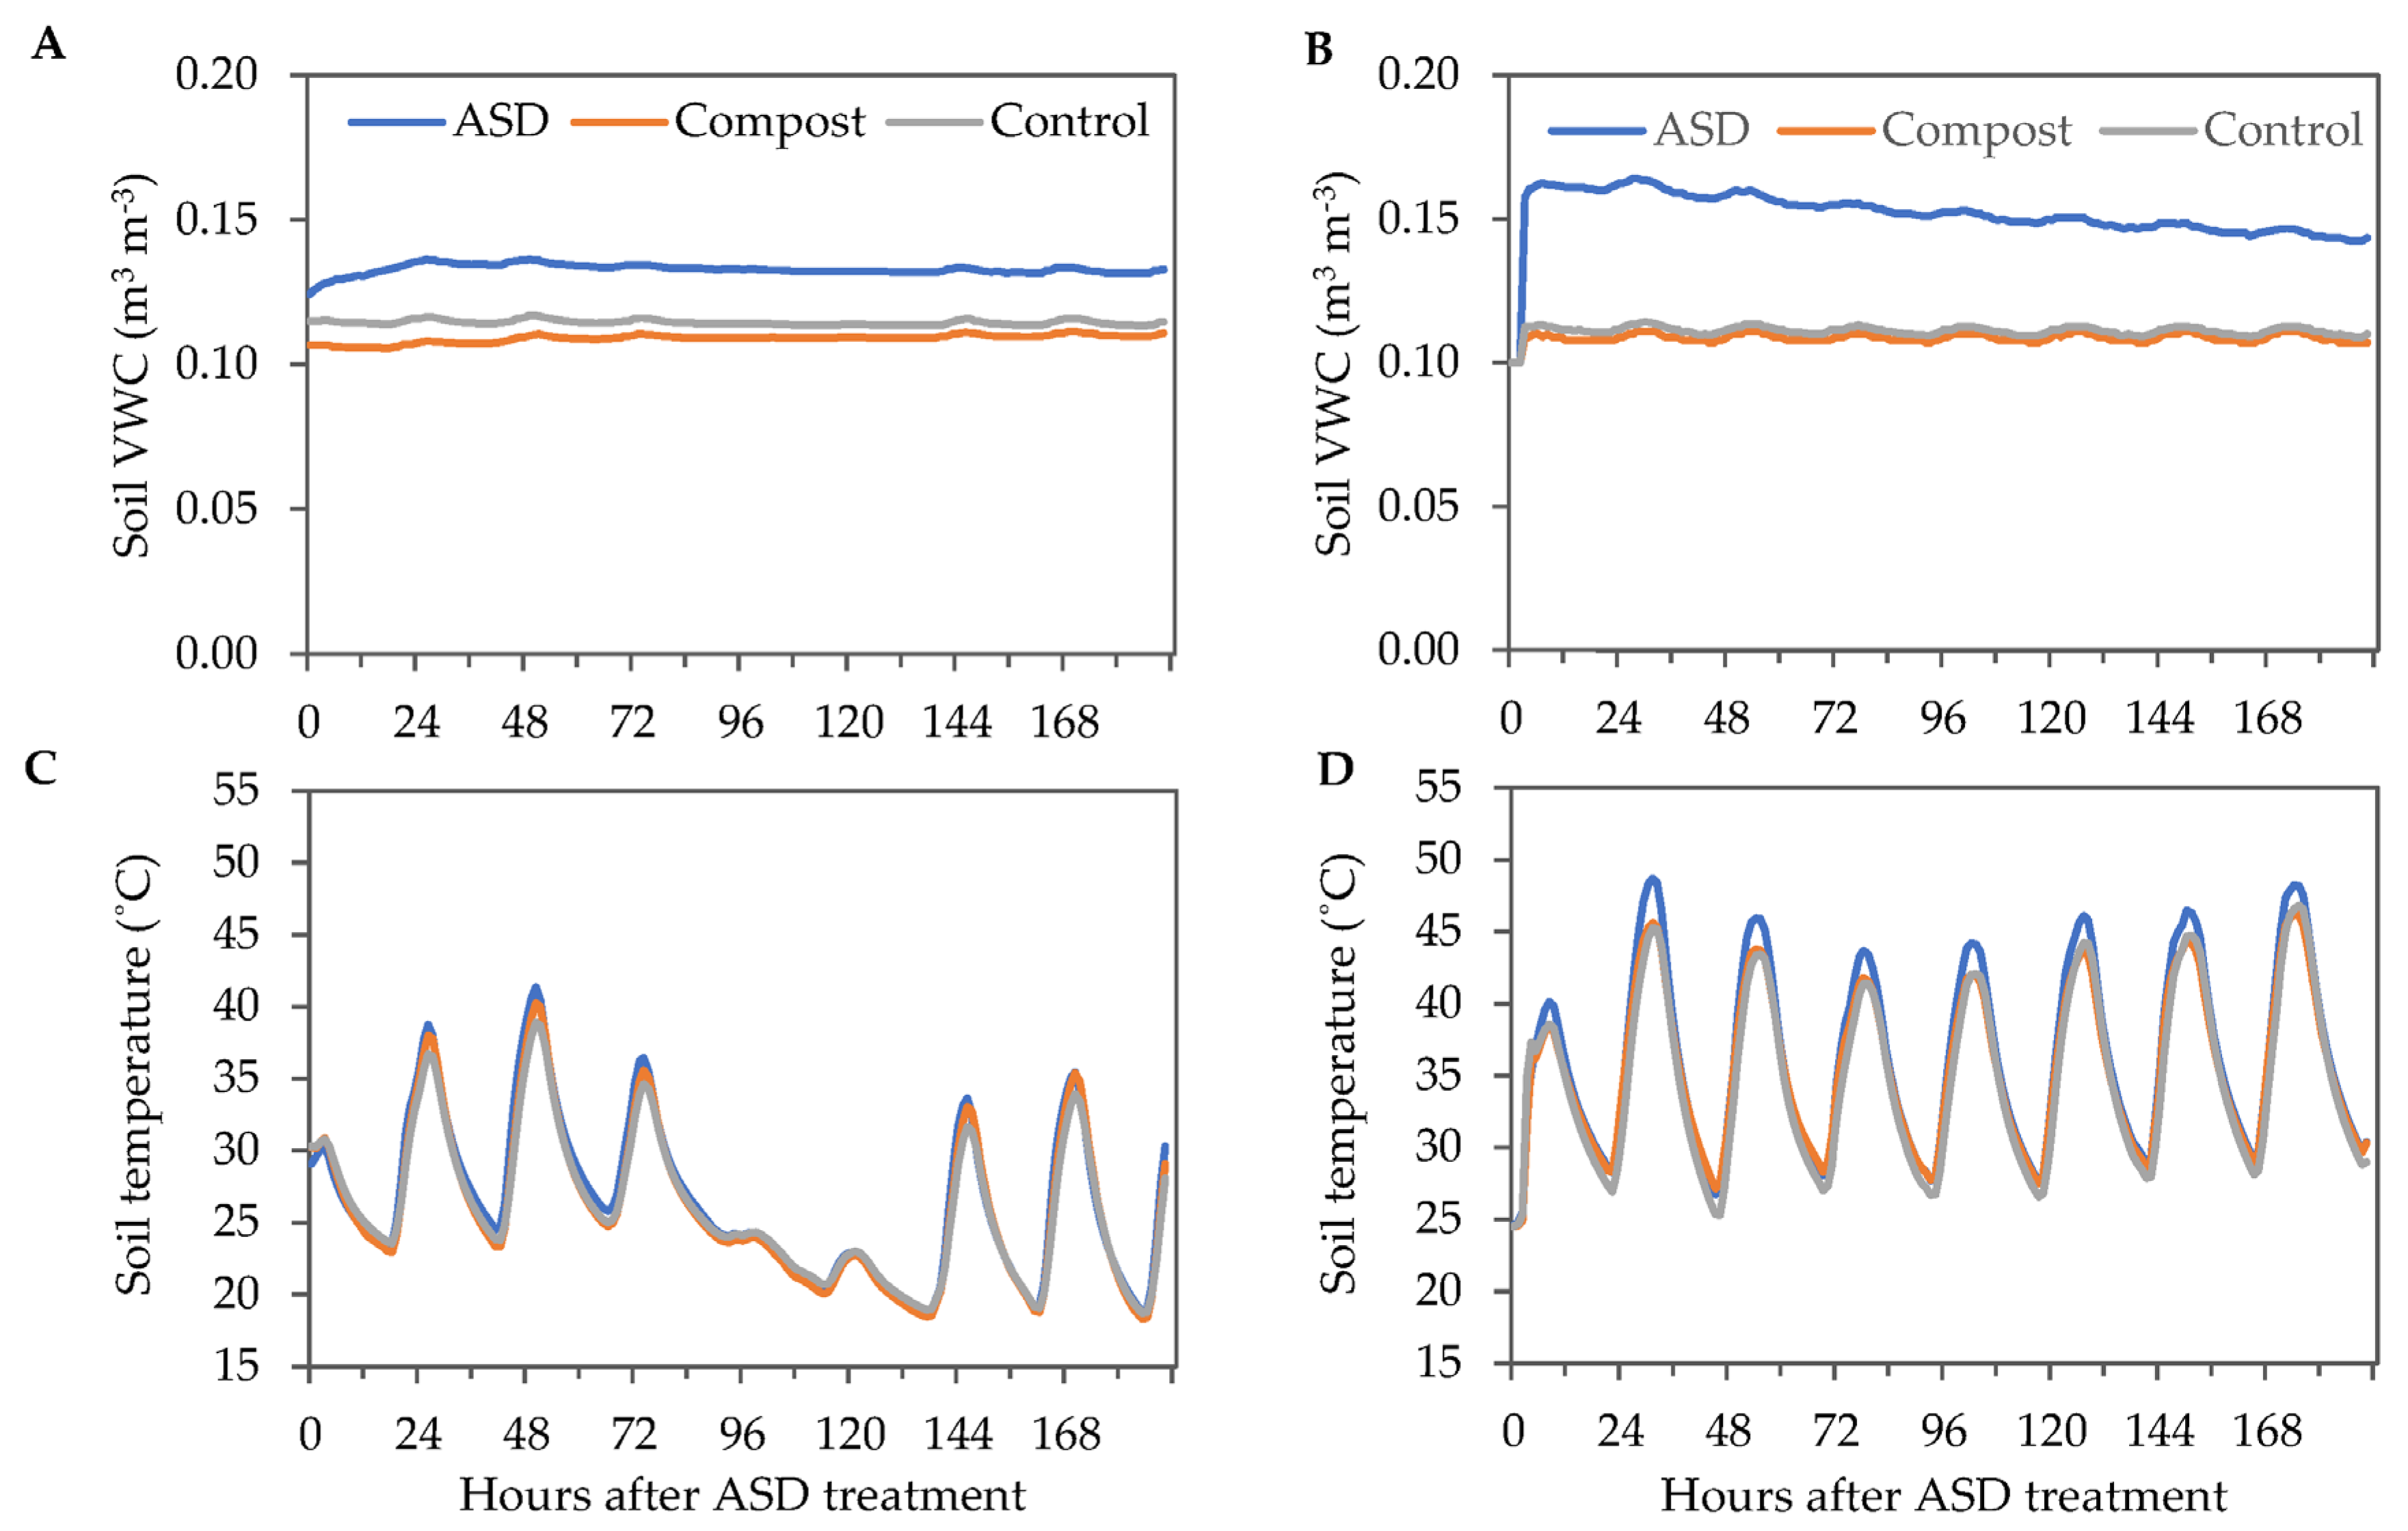
Soil VWC was similar in both years for Compost and Control treatments, while ASD increased soil VWC. Soil VWC in the Control and Compost treatments ranged from 0.10 to 0.11 m3 m−3 during the 8-day ASD treatment period during the fall 2021 trial, while the ASD-treated soils had a maximum VWC of 0.14 m3 m−3 (Figure 2A). During the spring 2022 trial, VWC was greatest at 2 DAT in the ASD-treated soils (0.17 m3 m−3) (Figure 2B). The minimum soil temperatures were 18.3 °C, 18.6 °C, and 18.7 °C in Compost, ASD, and Control treatments, respectively, while the maximum soil temperatures were 38.9 °C, 40.2 °C, and 41.4 °C in Control, Compost, and ASD treatments, respectively, in the fall 2021 trial (Figure 2C). The minimum soil temperature ranged from 24.4 °C in Compost and Control to 24.5 °C in the ASD-treated soils during the 8-day ASD treatment period in the spring 2022 trial (Figure 2D). The maximum soil temperature was highest in the ASD-treated soils (48.7 °C) compared with the Compost-treated (46.3 °C) and Control-treated (46.8 °C) soils.
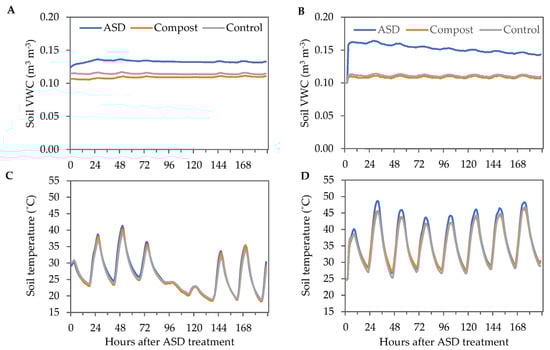
Figure 2.
Environmental conditions during the 8-day ASD treatment period in the fall 2021 and spring 2022 trials. Hourly soil average VWC measured during the (A) fall 2021 and (B) spring 2022 trials. Hourly average soil temperature measured during the (C) fall 2021 and (D) spring 2022 trials. Values are the mean of n = 4 for each treatment. ASD: 6.9 m3 ha−1 molasses + 6.8 Mg ha−1 Everlizer 3-3-3; Compost: 6.8 Mg ha−1 Everlizer 3-3-3 + 22.4 Mg ha−1 yard waste compost; Control: 6.8 Mg ha−1 Everlizer 3-3-3.
3.2. Soil Treatment Impacts on Soil pH
The baseline soil samples taken prior to any soil treatment had a soil pH of 7.9 in all whole plots during the fall 2021 trial. A significant sampling date (DAT) by soil treatment two-way interaction was observed in addition to the main effects of soil treatment and sampling date (Table 1).

Table 1.
Analysis of variance of the effects of soil treatment and sampling date on soil pH during the ASD treatment period in the spring 2021 and fall 2022 trials.
The ASD treatment reduced soil pH to 5.9 at 1 DAT compared with the Compost (7.3) and Control (7.2) treatments. At 8 DAT, the pH in the ASD-treated soils reached 5.7, significantly lower than the soil pH in the Compost and Control treatments. Since the compost and organic fertilizer were not applied in the Compost and Control treatments until after the 8-day ASD treatment period, the soil pH fluctuation observed in the Compost and Control treatments was likely due to the natural variation at the field scale (Table 2). However, soil pH was not affected by either soil treatment or sampling date during the spring 2022 trial (Table 1). With the baseline pH at 6.6, soil pH remained between 6.2 and 6.7 for all soil treatments during the ASD treatment period during the spring 2022 trial.
Table 2.
Sampling date × soil treatment two-way interaction on soil pH during ASD treatment period in fall 2021 trial.
3.3. Soil Treatment Impacts on Disease Incidence and Weed Population Density
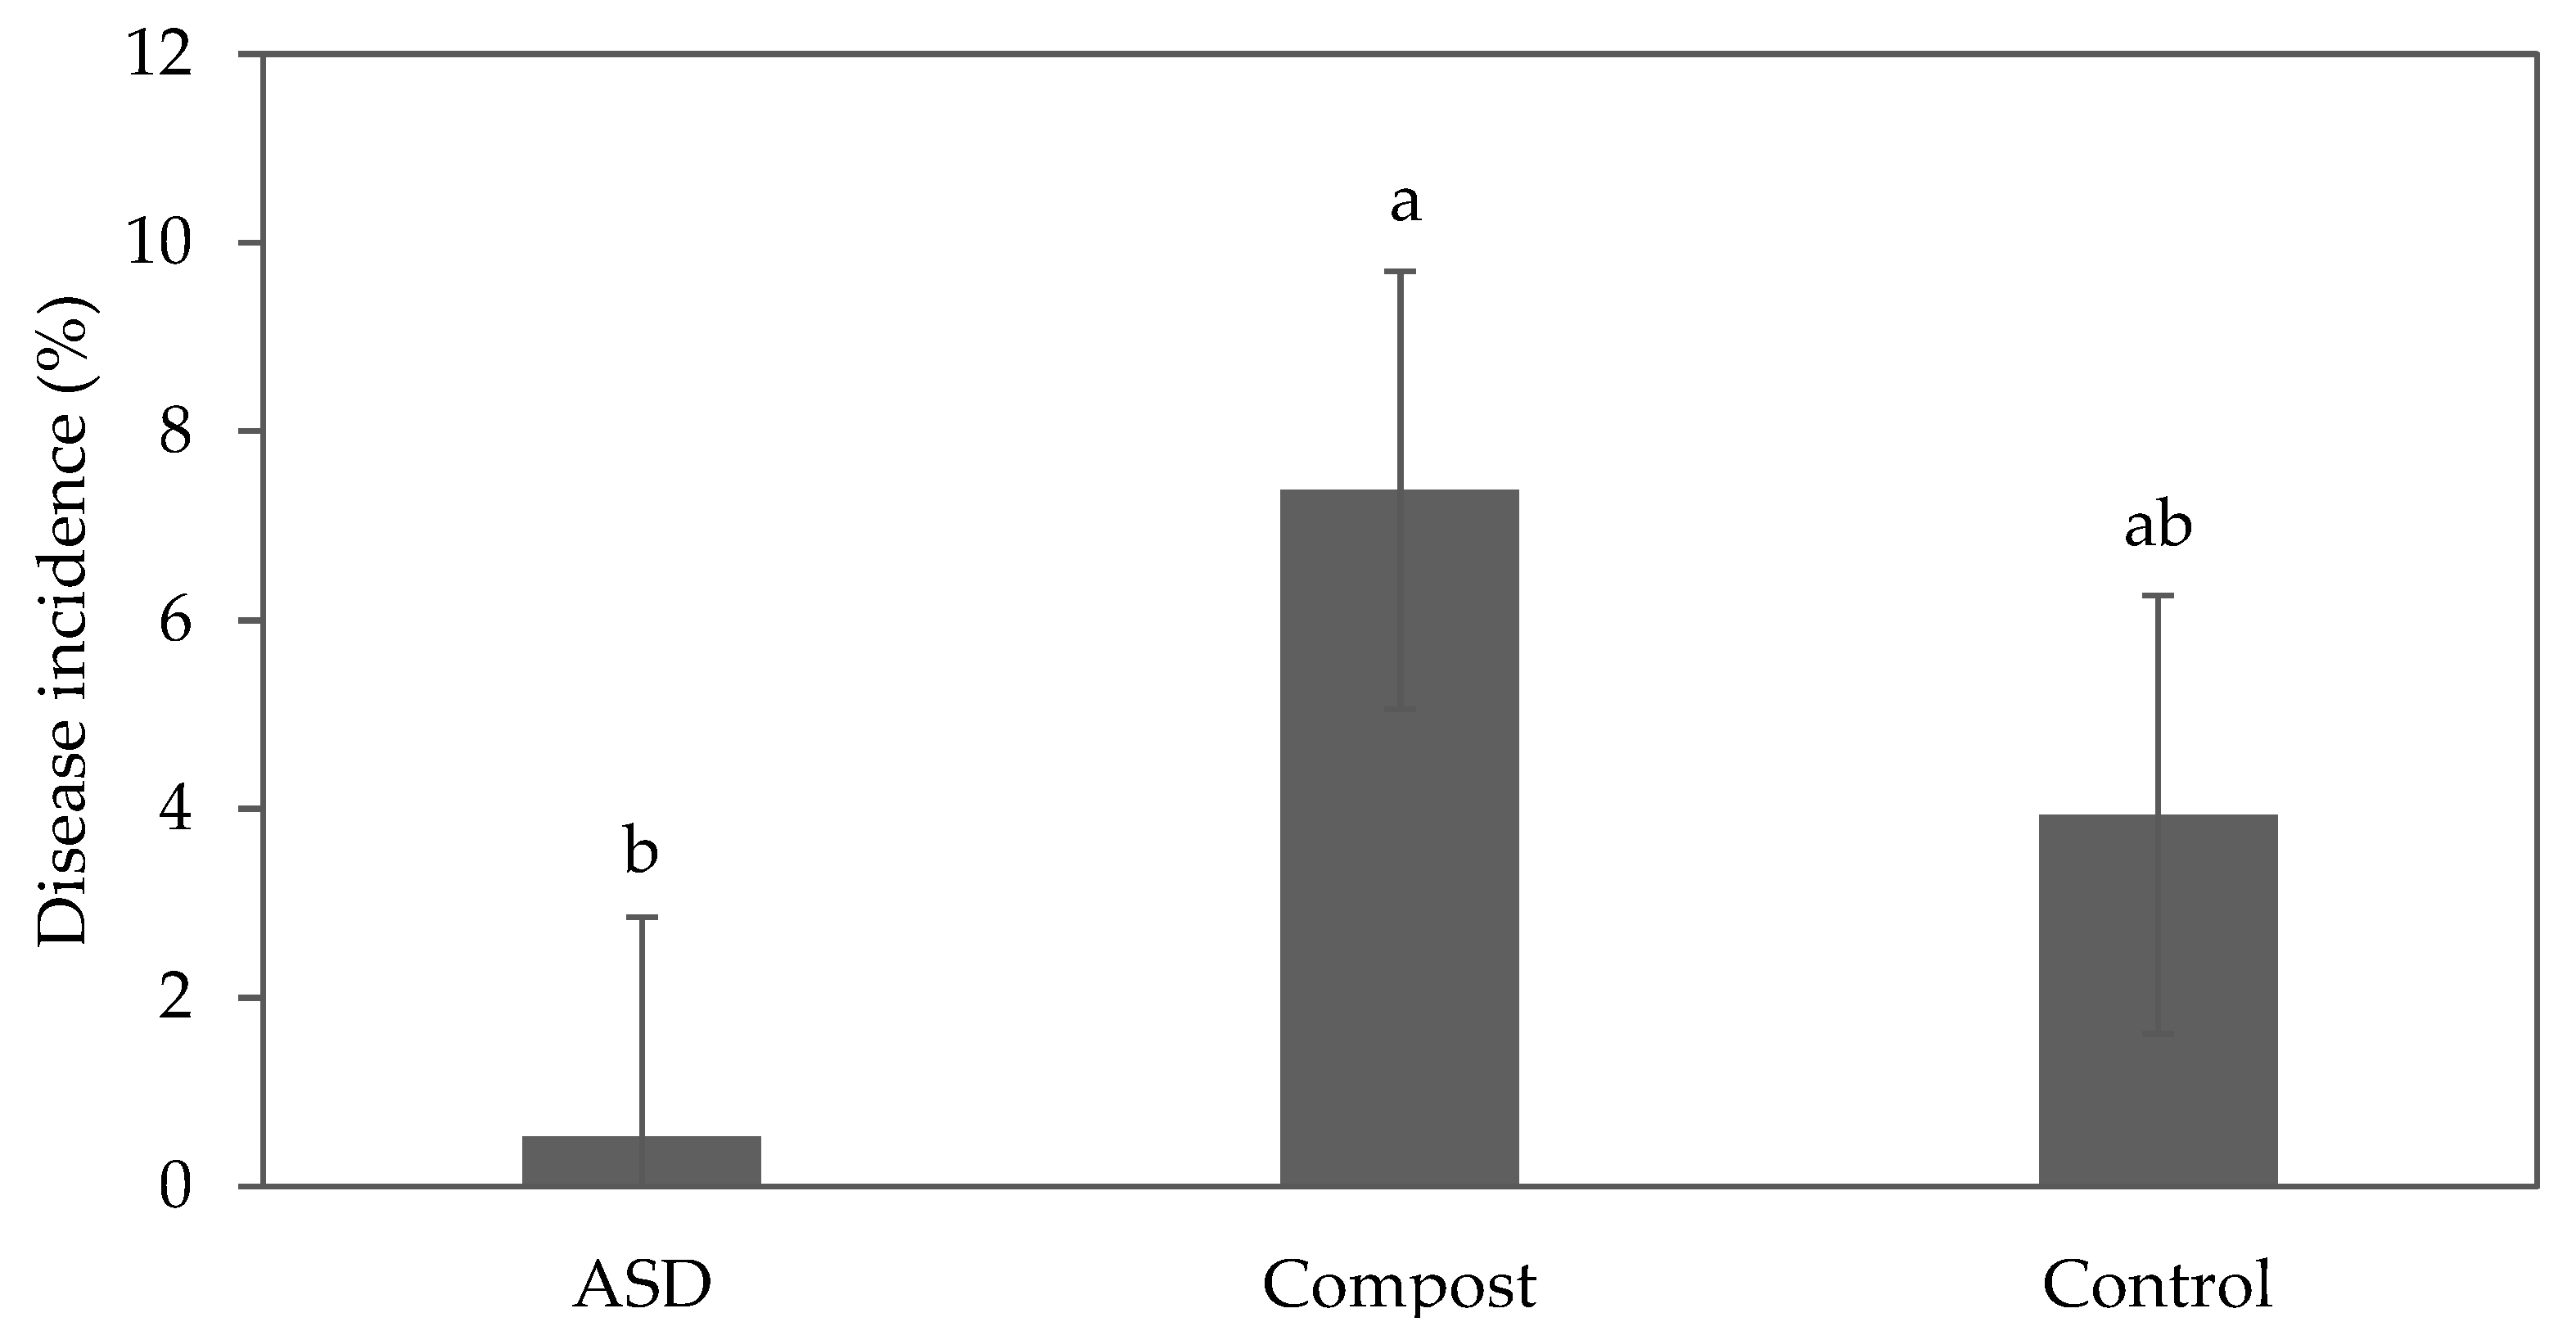
During the fall 2021 trial, the plants did not show any disease symptoms. During the spring 2022 trial, bottom rot caused by Rhizoctonia solani was identified. The disease incidence as measured by the area of diseased plants was reduced by 93% and 87% in the ASD-treated plots compared with the Compost and Control treatments, respectively (Figure 3); however, the difference between ASD and Control was not significant. The lettuce cultivars did not exhibit any significant difference (p = 0.40), although symptoms were first observed on green romaine ‘Carlsbad’ and green oakleaf ‘Clearwater’.

Figure 3.
Effect of soil treatment on disease incidence (% of diseased plants per plot) of baby leaf lettuce plants infected with Rhizoctonia solani during the spring 2022 trial. Bars with the same letter are not significantly different according to Fisher’s LSD test at p ≤ 0.05. Error bars represent standard errors. ASD: 6.9 m3 ha−1 molasses + 6.8 Mg ha−1 Everlizer 3-3-3; Compost: 6.8 Mg ha−1 Everlizer 3-3-3 + 22.4 Mg ha−1 yard waste compost; Control: 6.8 Mg ha−1 Everlizer 3-3-3.
During the fall 2021 trial, soil treatment and lettuce cultivar did not significantly affect the population density of each type of weed (i.e., broadleaf, grass, sedge) assessed or total number of weeds at 7 DAS. At 40 DAS, soil treatment and lettuce cultivar significantly impacted weed population density (Table 3).
Table 3.
Analysis of variance of the effects of soil treatment and cultivar type and their interaction on broadleaf, grass, and sedge weed population density and total weed population density at 7 and 40 days after seeding (DAS) of lettuce during the fall 2021 trial and 7 and 27 DAS during the spring 2022 trial.
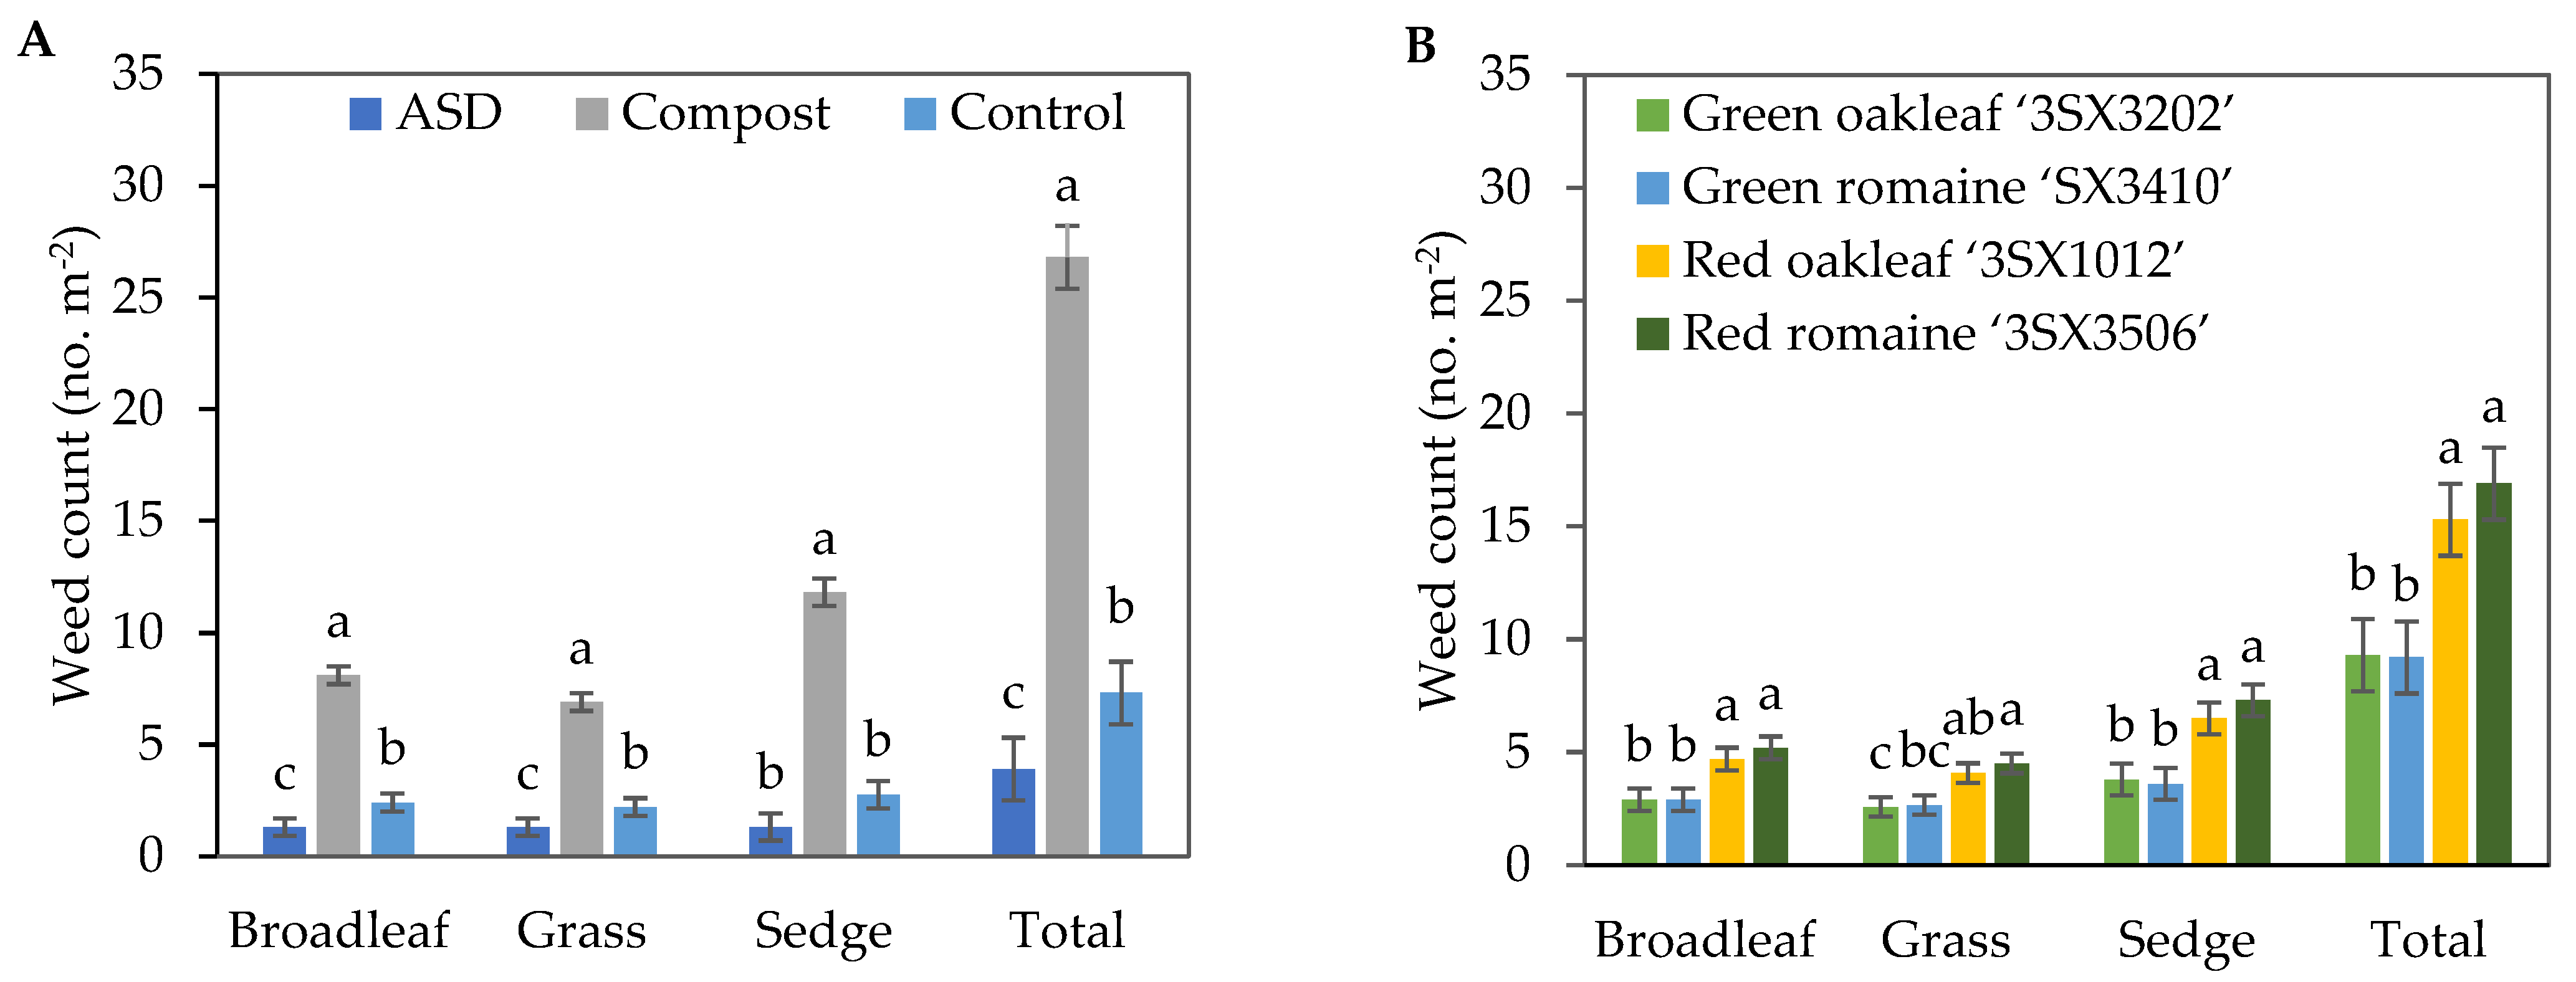
The population density of broadleaf weeds, grasses, sedges and total number of weeds were significantly higher in the Compost treatment compared with the ASD and Control treatments (Figure 4A). Compared with Control, ASD resulted in 46%, 41%, and 47% reductions in broadleaf and grass weeds and total number of weeds, respectively. Compared with Compost, ASD resulted in 84%, 78.7%, 88.9%, and 85.4% reductions in broadleaf, grass, sedge, and total number of weeds, respectively. In general, the red lettuce cultivar plots tended to have greater weed population densities per m2 when compared with the green lettuce cultivar plots in the fall 2021 trial (Figure 4B).
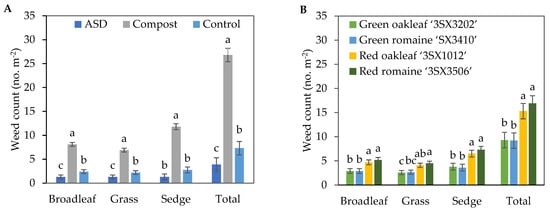
Figure 4.
Effects of soil treatment (A) and lettuce cultivar (B) on broadleaf, grass, and sedge weed population density and total weed population density at 40 days after lettuce seeding during the fall 2021 trial. Bars with the same letter are not significantly different according to Fisher’s LSD test at p ≤ 0.05. Error bars represent standard errors. ASD: 6.9 m3 ha−1 molasses + 6.8 Mg ha−1 Everlizer 3-3-3; Compost: 6.8 Mg ha−1 Everlizer 3-3-3 + 22.4 Mg ha−1 yard waste compost; Control: 6.8 Mg ha−1 Everlizer 3-3-3.
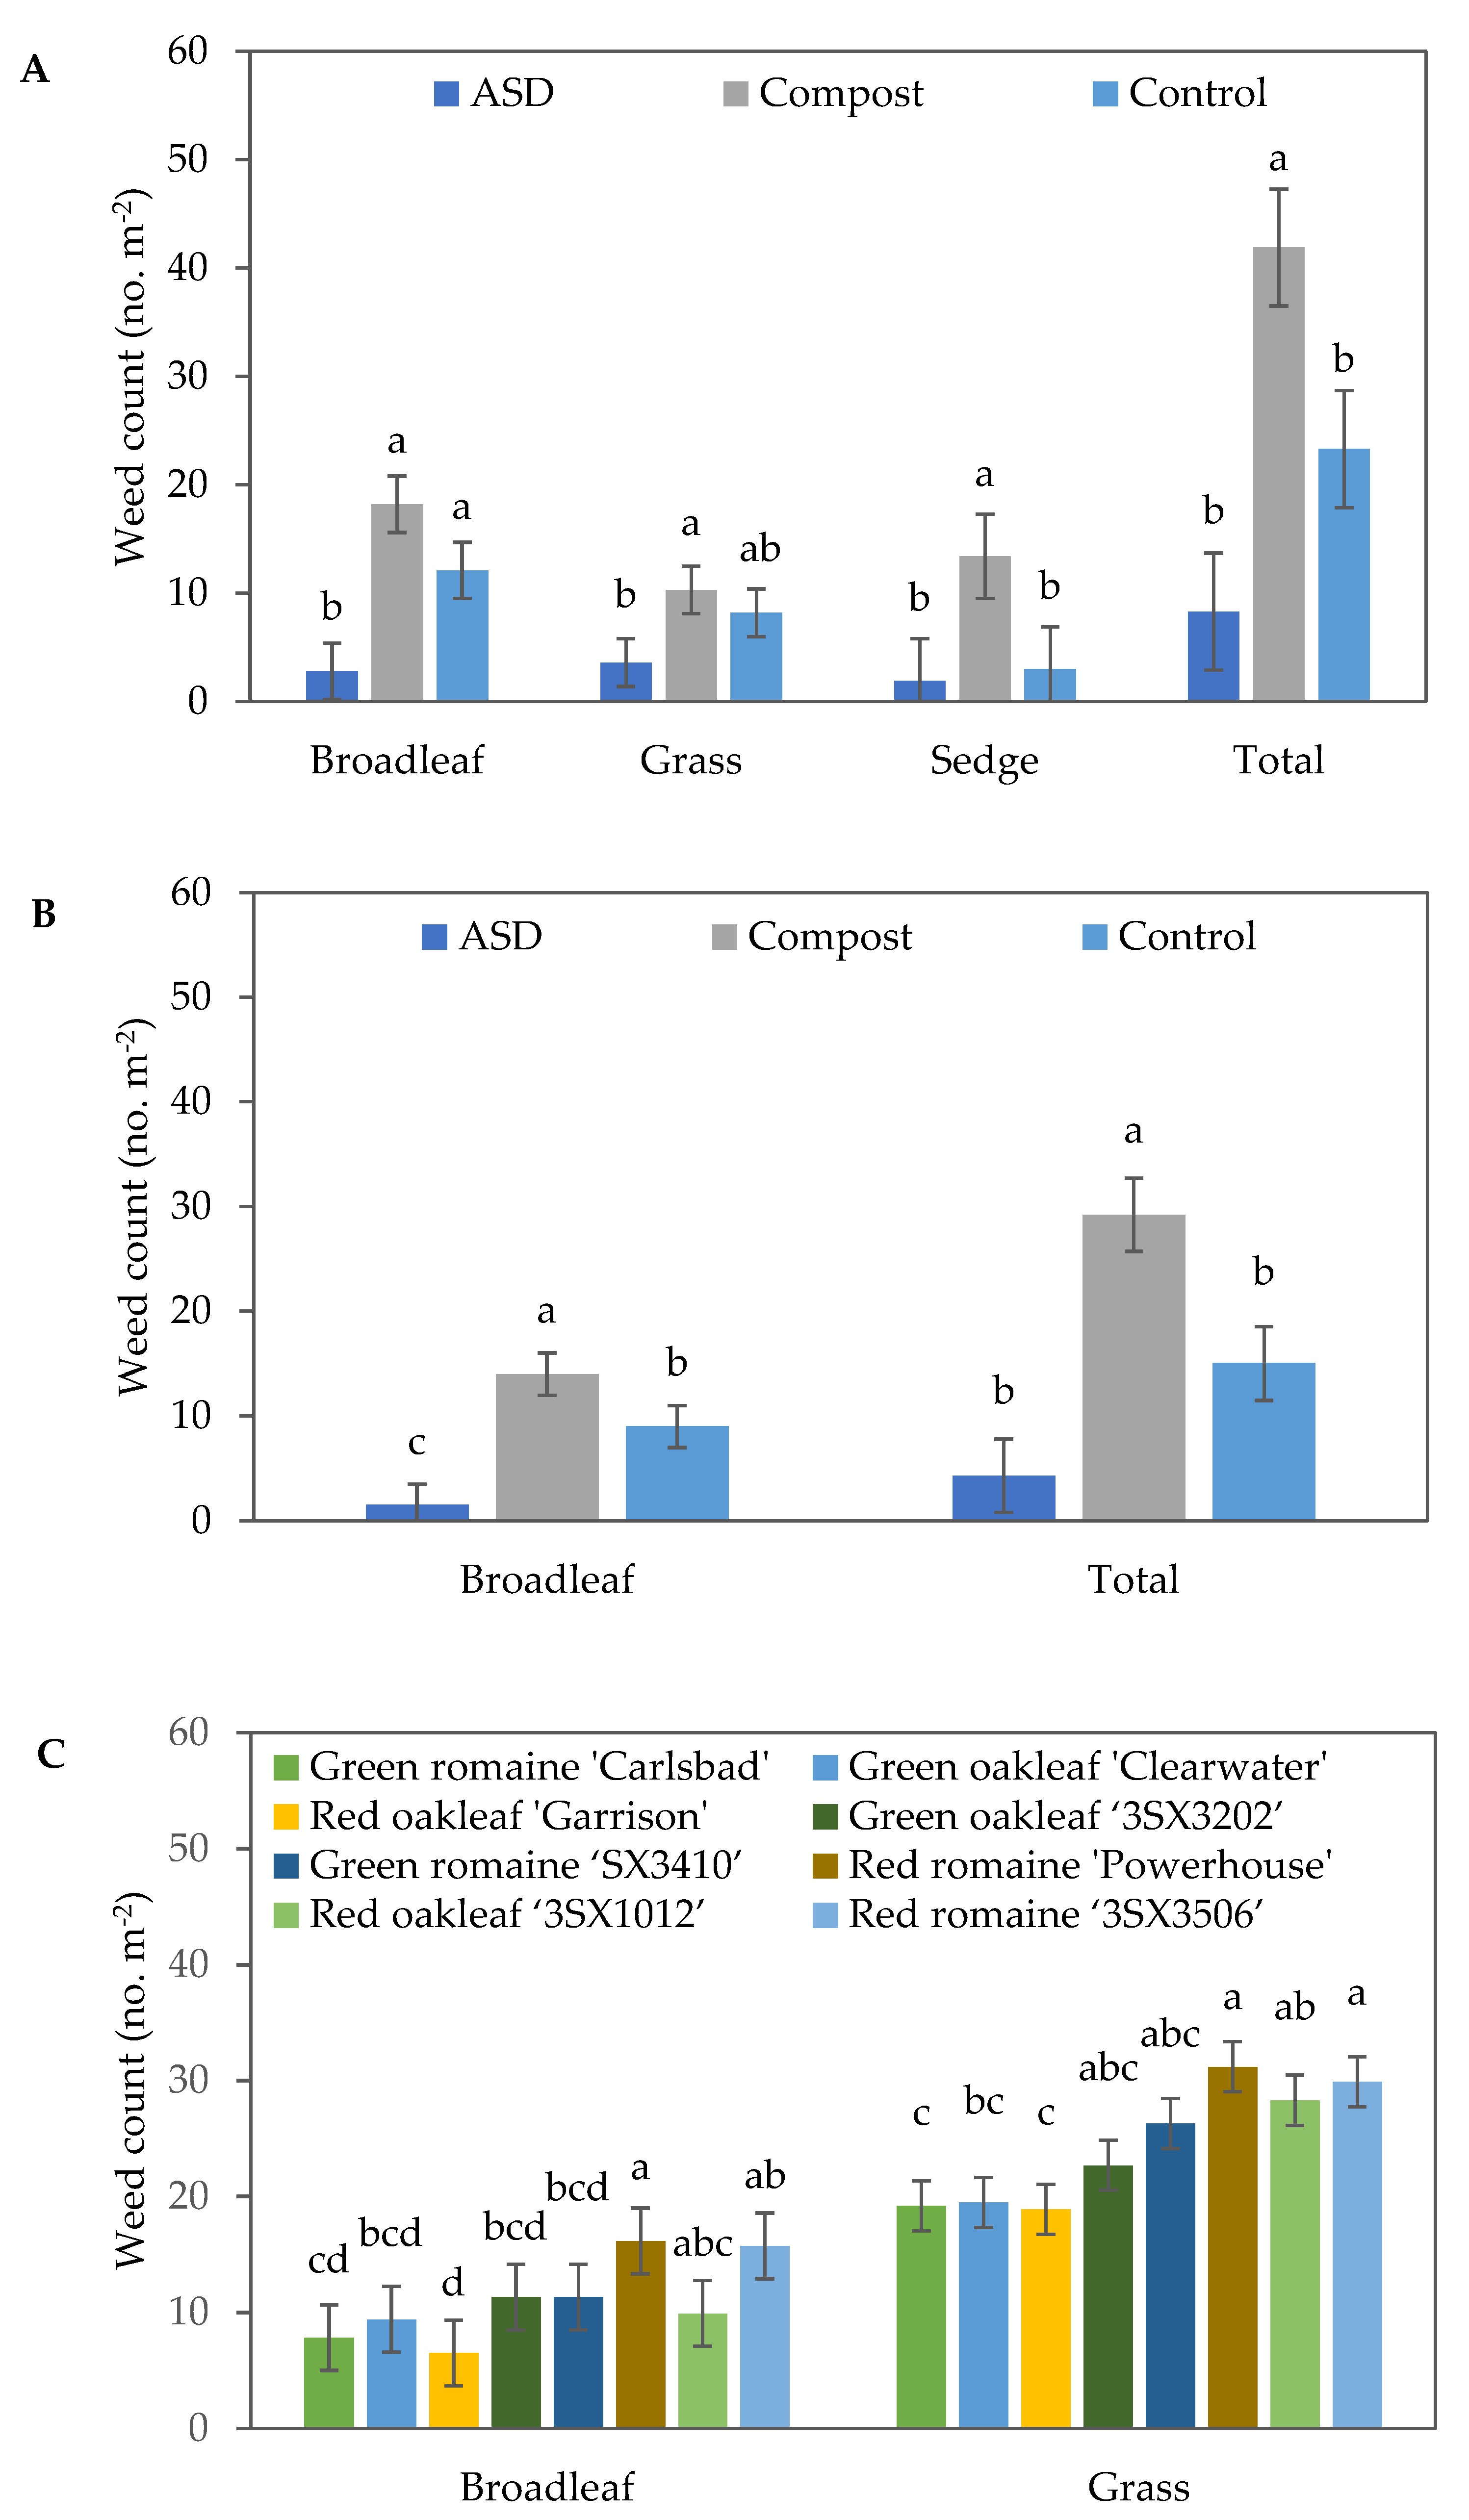
During the spring 2022 trial, soil treatment significantly impacted the broadleaf and sedge weeds, as well as the total population density of the weeds (Table 3). At 7 DAS, a significant reduction in the number of broadleaf weeds was observed in the ASD treatment compared with Compost and Control. Similarly, ASD (4.3 weeds m−2) decreased the total number of weeds by 85% and 71% compared with Compost (29.2 weeds m−2) and Control (15.0 weeds m−2), respectively (Figure 5A). At 27 DAS, soil treatment and lettuce cultivar had significant effects on the number of broadleaf weeds and total number of weeds, while only soil treatment significantly affected the number of sedges (Table 3). ASD significantly reduced the number of broadleaf weeds compared with both Compost and Control, with no significant difference between Compost and Control being observed. ASD significantly reduced the total number of weeds compared with Compost, although no significant differences were observed between the ASD and Control treatments. The number of sedges was also significantly reduced in the Control- and ASD-treated soils compared with the Compost-treated ones (Figure 5B,C). The highest number of broadleaf weeds were observed in red romaine ‘Powerhouse’ (16.2 weeds m−2), while the lowest number of broadleaf weeds was observed in red oakleaf ‘Garrison’ (6.5 weeds m−2) and green romaine ‘Carlsbad’ (7.8 weeds m−2) at 27 DAS. A similar trend was observed in terms of the total number of weeds at 27 DAS during the spring 2022 trial.
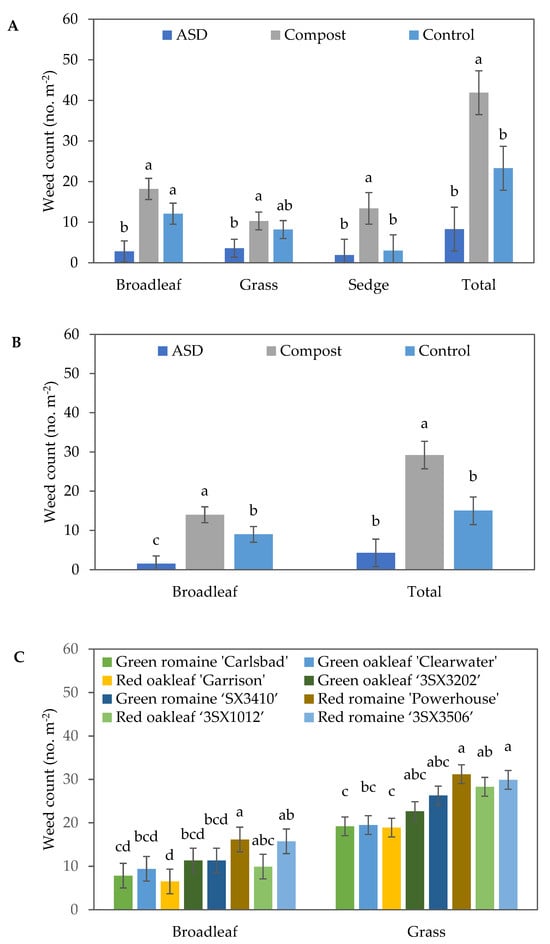
Figure 5.
Effects of soil treatment on weed population density at (A) 7 days after seeding (DAS) of lettuce during the spring 2022 trial and (B) 27 DAS during the spring 2022 trial. (C) Effects of lettuce cultivar on weed population density at 27 DAS during the spring 2022 trial. The error bars represent standard errors. Bars with the same letter are not significantly different according to Fisher’s LSD test at p ≤ 0.05. ASD: 6.9 m3 ha−1 molasses + 6.8 Mg ha−1 Everlizer 3-3-3; Compost: 6.8 Mg ha−1 Everlizer 3-3-3 + 22.4 Mg ha−1 yard waste compost; Control: 6.8 Mg ha−1 Everlizer 3-3-3.
3.4. Soil Treatment Impacts on Crop Yield and Biometrics
During the fall 2021 trial, baby leaf lettuce yield was significantly impacted by cultivar (Table 4). The highest fresh weight per m2 was observed in green oakleaf ‘3SX3202’ (584.6 g m−2), while the lowest yield was observed in red romaine ‘3SX3506’ (326.1 g m−2). No significant differences were observed between green romaine ‘SX3410’ and red oakleaf ‘3SX1012’, between green romaine ‘3SX3506’ and red romaine ‘3SX3506’, between green oakleaf ‘3SX3202’ and green romaine ‘3SX3506’, and between red oakleaf ‘3SX1012’ and red romaine ‘3SX3506’. Neither the main effect of soil treatment nor the soil treatment × cultivar interaction significantly affected the yield of baby leaf lettuce. Numerically, the ASD (639.5 g m−2) treatment increased mean fresh weight by 61% and 103% compared with Compost (396.9 g m−2) and Control (315.5 g m−2), respectively; however, the differences were not statistically significant (Table 4).
Table 4.
Effects of soil treatment and lettuce cultivar on crop biometric and yield parameters during the fall 2021 and spring 2022 trials.
Cultivar also significantly impacted baby leaf lettuce yield during the spring 2022 trial (Table 4). The highest yield was observed in green romaine ‘Carlsbad’ (1871.2 g m−2), green oakleaf ‘3SX3202’ (1714.2 g m−2), red oakleaf ‘Garrison’ (1652.3 g m−2), and green romaine ‘3SX3410’ (1626.7 g m−2), while red romaine ‘3SX3506’ (745.9 g m−2), red romaine ‘Powerhouse’ (950.5 g m−2), and red oakleaf ‘3SX1012’ (975.4 g m−2) produced the lowest yield. Neither soil treatment nor the soil treatment × cultivar interaction exhibited any significant effects on yield (Table 4). In spring 2022, ASD (1654.8 g m−2) increased fresh weight by 49% and 23% compared with Compost (1110.4 g m−2) and Control (1345.1 g m−2), respectively, though the differences among soil treatments were not significant.
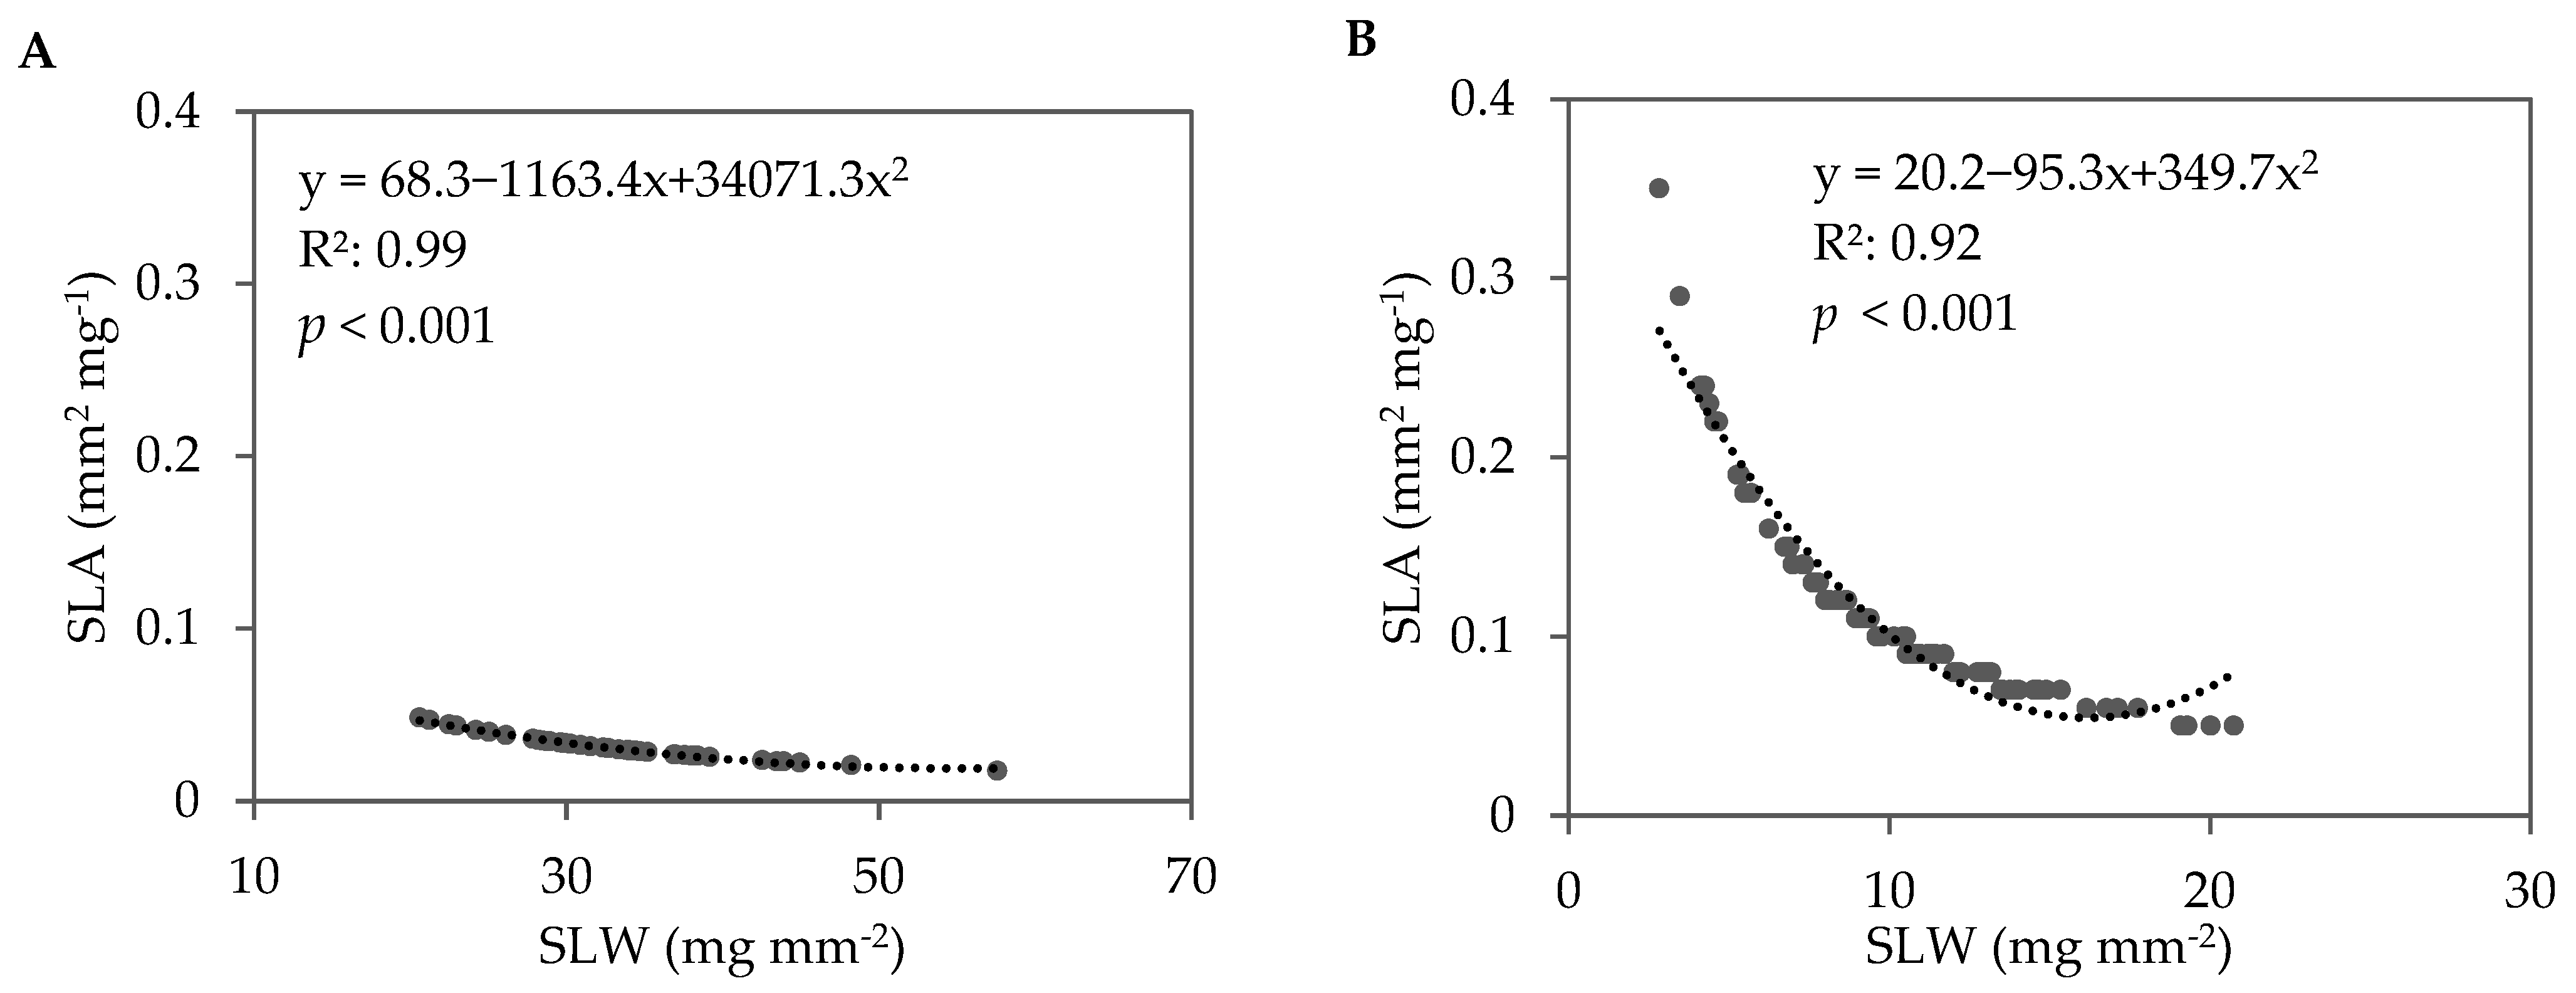
In the fall 2021 trial, lettuce cultivar significantly impacted leaf dry matter content (LDMC), SLA, and SLW (Table 4). Soil treatment also significantly impacted SLA and SLW. The LDMC ranged from 5.7% in green romaine ‘3SX3410’ to 7.1% in red oakleaf ‘3SX1012’. When data were pooled across all soil treatments and lettuce cultivars, a strong negative correlation between SLA and SLW was observed in fall 2021 (Figure 6A). This relationship indicates that the leaves with larger surface areas tended to be thinner compared with leaves with smaller surface areas. The lettuce cultivars grown in the ASD-treated soils had higher SLA (36.1 mm2 mg−1) compared with Compost (32.8 mm2 mg−1) and Control (31.1 mm2 mg−1). Conversely, the lettuce cultivars grown in the ASD-treated soils had lower SLW (0.029 mg mm−2) compared with Compost (0.032mg mm−2) and Control (0.033 mg mm−2) (Table 4). When averaged across the soil treatments, the red cultivars tended to have numerically greater SLA and subsequently lower SLW compared with the green cultivars for oakleaf and romaine lettuce.
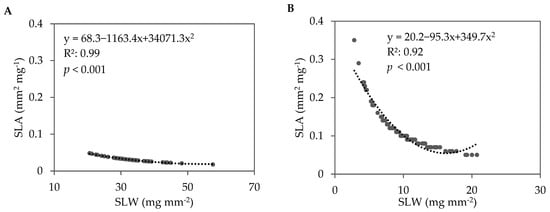
Figure 6.
Correlation between specific leaf area (SLA) and specific leaf weight (SLW) for pooled data across all soil treatments and lettuce cultivars during the (A) fall 2021 and (B) spring 2022 trials. The dotted line and equation represent the regression line and regression equation, respectively, for a second-order polynomial. R2 is the coefficient of determination. Sample size: fall 2021, n = 48; spring 2022, n = 96.
In the spring 2022 trial, LDMC, SLA, and SLW were also significantly influenced by lettuce genotype (Table 4). The LDMC ranged from 4.8% in green romaine ‘Carlsbad’ to 7.2% in red romaine ‘3SX3410’. Similar to the fall 2021 trial, a strong, negative correlation between SLA and SLW was observed when data were pooled across all soil treatments and lettuce cultivars (Figure 6B). Unlike in the fall 2021 trial, the soil treatment did not demonstrate any significant impact on SLA and SLW.
3.5. Lettuce Quality Attributes
During the fall 2021 trial, the leaf color attributes, including a*, b*, C*, H*, and L*, were significantly impacted by lettuce cultivar. No significant soil treatment effect or the soil treatment × cultivar interaction was observed. The leaf color attributes were well differentiated between the green lettuce cultivars and red lettuce cultivars (Table 5). Compared with the green romaine baby leaf lettuce, the green oakleaf type was determined to have higher b* (more yellow) and had a total color difference of ΔE*ab = 2.43.
Table 5.
Effects of soil treatment and lettuce cultivar on leaf color attributes during the fall 2021 and spring 2022 trials.
During the spring 2022 trial, the leaf color attributes, including a*, b*, C*, H*, and L*, were also significantly impacted by lettuce cultivar (Table 5). The H* value was significantly affected by both soil treatment and lettuce cultivar. The total color differences between ASD and Compost or Control were ΔE*CH = 40.11 and ΔE*CH = 27.10, respectively. The largest H* was observed in the ASD treatment (116.3) compared with the Compost (76.2) and Control (89.2) treatments (Table 5). A clear distinction between the red cultivars and green cultivars was observed in the L*, a*, b*, and C* values. The red lettuce cultivars had significantly lower L*, b*, and C* values (darker, less yellow, and less purity) compared with the green lettuce cultivars. On the contrary, the red lettuce cultivars exhibited significantly higher a* values (more red).
Lettuce cultivar significantly impacted SSC and TTA in fall 2021, while there was a lack of an effect deriving from soil treatment type (Table 6). SSC ranged from 2.7 °Brix in green romaine ‘3SX3410’ lettuce to 3.4 °Brix in green oakleaf ‘3SX3202’. Both oakleaf lettuce cultivars had significantly greater levels of SSC compared with green romaine lettuce. Red oakleaf ‘3SX1012’ (0.09 % citric acid) and red romaine ‘3SX3506’ (0.09 % citric acid) had significantly higher TTA compared with both green oakleaf ‘3SX3202’ (0.08 % citric acid) and green romaine ‘3SX3410’ (0.07 % citric acid). Lettuce cultivar significantly impacted TTA in the spring 2022 trial (Table 6). The highest TTA was observed in red romaine ‘3SX3506’ (0.10% citric acid), while the lowest TTA was observed in green romaine ‘3SX3410’ (0.08 % citric acid) and green romaine ‘Carlsbad’ (0.08 % citric acid) (Table 6). SSC was not significantly impacted by soil treatment, lettuce cultivar, or their interaction in spring 2022 (Table 6).
Table 6.
Effects of soil treatment and lettuce cultivar on lettuce quality attributes during the fall 2021 and spring 2022 trials.
The TPC was well differentiated between the red lettuce cultivars and green lettuce cultivars during both the fall 2021 and spring 2022 trials (Table 6). Soil treatment did not result in significant differences in TPC in fall 2021. The TPC ranged from 15.0 mg 100 g FW−1 in green romaine ‘3SX3410’ to 81.2 mg 100 g FW−1 in red oakleaf ‘3SX1012’. During the spring 2022 trial, soil treatment, lettuce cultivar, and the soil treatment × cultivar interaction significantly impacted TPC. Across all soil treatments, the highest TPC was observed in red romaine ‘3SX3506’, red oakleaf ‘Garrison’, red romaine ‘Powerhouse’, and red oakleaf ‘3SX1012’ (60.6 to 66.3 mg 100 g FW−1), regardless of soil treatment, while the lowest TPC was observed in green romaine ‘Carlsbad’ and green romaine ‘3SX3410’ (14.5 and 15.0 mg 100 g FW−1, respectively). The ASD treatment significantly increased TPC in green oakleaf ‘Clearwater’ (49.1 mg 100 g−1 FW) and green oakleaf ‘3SX3202’ (48.2 mg 100 g−1 FW) relative to the Control treatment (24.6 and 27.7 mg 100 g−1 FW, respectively), while the Compost treatment resulted in significantly higher levels of TPC than ASD and Control in red oakleaf ‘Garrison’, red romaine ‘Powerhouse’, and red oakleaf ‘3SX1012’ (Table 7). Within the ASD treatment, green oakleaf ‘Clearwater’ and green oakleaf ‘3SX3202’ did not differ from red romaine ‘3SX3506’, red oakleaf ‘3SX1012’, or red romaine ‘Powerhouse’, but both cultivars showed lower TPCs under Compost and Control (Table 7).
Table 7.
Soil treatment × lettuce cultivar two-way interaction on total phenolic content (mg 100 g−1 FW) during the spring 2022 trial.
Soil treatment and the soil treatment × lettuce cultivar interaction did not significantly affect total antioxidant capacity (measured by the FRAP assay) during the fall 2021 or spring 2022 trial; however, significant differences in FRAP values were observed between the lettuce cultivars in both trials (Table 6). The FRAP values were significantly higher in the red lettuce cultivars than in the green lettuce cultivars, ranging from 11.2 mmol TE 100 g FW−1 in green romaine ‘3SX3410’ to 116.5 mmol TE 100g FW−1 in red oakleaf ‘3SX1012’ during the fall 2021 trial.
A similar trend was observed in the spring 2022 trial, in which the red lettuce cultivars had significantly higher FRAP values compared with the green lettuce cultivars. The FRAP values ranged from 27.3 mmol TE 100 g FW−1 in green romaine ‘Carlsbad’ to 123.9 mmol TE 100 g FW−1 in red romaine ‘3SX3506’. Among the red lettuce cultivars, no significant differences were observed between red oakleaf ‘Garrison’, red oakleaf ‘3SX1012’, red romaine ‘Powerhouse’, and red romaine ‘3SX3506’. Among the green oakleaf cultivars, ‘Clearwater’ and ‘3SX3202’ had higher FRAP values (77.5 and 77.3 mmol TE 100 g FW−1, respectively) compared with both green romaine ‘Carlsbad’ (27.3 mmol TE 100 g FW−1) and green romaine ‘3SX3410’ (28.1 mmol TE 100 g FW−1) (Table 6).
During both the fall 2021 and spring 2022 trials, significant differences in AA content were observed between lettuce cultivars, whereas there was a lack of an effect deriving from soil treatment (Table 6). The highest level of AA during the fall 2021 trial was observed in red oakleaf ‘3SX1012’ (60.3 mg 100 mg FW−1) and red romaine ‘3SX3506’ (57.2 mg 100 mg FW−1), while the lowest AA level was observed in green romaine ‘3SX3410’ (18.2 mg 100 mg FW−1). A similar trend occurred in the spring 2022 trial, where the red lettuce cultivars had significantly higher AA levels compared with the green lettuce cultivars (Table 6). The lowest AA was observed in green romaine ‘3SX3410’ (17.2 mg 100 mg FW−1) and green romaine ‘Carlsbad’ (17.7 mg 100 mg FW−1), while the highest AA was observed in red oakleaf ‘Garrison’ (134.9 mg 100 mg FW−1), red oakleaf ‘3SX1012’ (124.7 mg 100 mg FW−1), red romaine ‘3SX3506’ (107.9 mg 100 mg FW−1), and red romaine ‘Powerhouse’ (93.7 mg 100 mg FW−1).
4. Discussion
4.1. Soil and Environmental Conditions
Soil oxidation–reduction potential (Eh) is a parameter commonly used to assess anaerobic soil conditions and therefore an indicator of the effectiveness of ASD soil treatment [14]. Soil Eh values range from +700 to −300 mV, with values > 200 mV representing aerobic systems and values < 200 mV representing anaerobic systems. The levels of anaerobic conditions in a soil can be further divided into moderately reduced (0 to +300 mV), reduced (0 to −200 mV), and highly reduced (<−200 mV).
During the fall 2021 trial, the hourly redox values of the ASD-treated soils were indicative of reduced conditions, except for days 3–5, which were highly reduced. During the spring 2022 trial, the hourly redox values of the ASD-treated soils were indicative of highly reduced conditions during the 8-day ASD treatment period beginning at 1 day after ASD treatment application. Environmental conditions, including soil moisture and soil temperature, have been demonstrated to affect soil anaerobic conditions [15]. Therefore, the increase in intensity and cumulative anaerobicity during the spring 2022 trial compared with the fall 2021 trial may be related to elevated levels of soil volumetric water content and soil temperature in the spring 2022 trial. Average (20.9 °C) and maximum (30.8 °C) air temperatures were greater in spring 2022 compared with fall 2021 (16.7 °C average air temperature and 30.4 °C maximum air temperature). In both trials, limited soil anaerobic conditions were observed in the Compost and Control treatments, which was expected, as these treatments did not receive any irrigation or addition of soil amendment and organic fertilizer until after the ASD treatment period had ended.
In the current two-year study, cumulative soil redox potential values fell within the range reported by Di Gioia et al. [16] when molasses was applied at either 13.9 m3 ha−1 or 27.7 m3 ha−1 and combined with composted poultry litter at 22 Mg ha−1. However, the values reported in the present study are lower than those reported in a study by Guo et al. [17], wherein molasses was applied at a rate of 6.9 m3 ha−1 in conjunction with composted poultry litter at a rate of 11 Mg ha−1. It needs to be pointed out that the relatively high levels of cumulative soil redox potential values generated in the present study resulted from an 8-day ASD treatment period in a caterpillar tunnel system rather than the typical 21-day duration in an open field (OF), the time period applied in previous ASD studies conducted in Florida [17,18]. These findings suggest the potential of reducing ASD treatment duration in HT systems to achieve desirable soil anaerobicity [19]. The use of a locally available organic fertilizer product (Everlizer®) derived from heat-processed poultry litter was demonstrated to be suitable for ASD application and for supplying nutrients for organic baby leaf lettuce production.
The impact of ASD soil treatment on soil pH has been widely reported, with several authors reporting a decrease in soil pH during the first week of the ASD treatment, followed by the soil pH returning to pre-ASD levels later in the crop cycle [18]. The results of the current study are consistent with these findings, especially when considering the results derived from the fall 2021 trial, in which the soil pH of the ASD-treated soils declined significantly compared with those of the Compost and Control treatments. This significantly lower soil pH accompanying ASD treatment is also in line with the soil redox potential time course and cumulative Eh and may be explained by the accumulation of organic acids as a byproduct of the anaerobic decomposition of molasses as a labile C source [20,21,22]. In a potted greenhouse study, Vecchia et al. [23] also reported a significant reduction in soil pH at 7 days after ASD treatment application using molasses as a C source, whereas pH increased when various cover crop residues were used as C sources. However, in the current study, our results were inconsistent between trials, even though the soil redox potential time course and cumulative Eh indicated strongly reduced soil conditions during both trials. In previous studies, it has been suggested that seasonal variations in soil temperature, volumetric water content, and even the type of gas-impermeable film can influence the relative extent of soil anaerobic conditions [16]. During the spring 2022 trial, soil temperature and volumetric water content were increased compared with the fall 2021 trial, which may explain the comparatively elevated cumulative Eh levels, although no significant reduction in soil pH because of ASD treatment was observed. In their study, Mao et al. [24] also reported an increase in soil pH up to 16 days after ASD treatment application when using 2% (w/w, approximately equivalent to 50 t ha−1) wheat bran, 2% rice bran, or 2% peanut bran as C sources. Similarly, Khadka et al. [25] reported an increase in pH when chicken manure was used as a C source, whereas no drastic pH changes were observed when mustard greens were used as a C source. It has been proposed that the addition of organic matter-derived alkaline agents such as calcium may increase soil pH buffering capacity [25]. Chicken litter-based products, such as the locally available heat-processed poultry litter used in this study, are rich sources of calcium which may increase alkalinity in soils through the formation of calcium bicarbonate.
4.2. ASD Soil Treatment Impacts on Disease and Weed Suppression
In the current study, symptomatic leaf tissue was identified as being infected by R. solani, a fungal pathogen that causes bottom rot in lettuce when warm, moist soil conditions persist [26]. Symptomatic tissues were only observed during the spring 2022 trial, when environmental conditions were relatively warm and moist, compared with the fall 2021 trial. Symptomatic tissues developed brown, sunken lesions on the midribs just above the soil line. As the disease progressed, leaf blades also became infected. Van Beneden et al. [27] and Claerbout et al. [26] also reported a greater occurrence of R. solani when average temperatures ranged from 14 °C to 20 °C compared to the occurrence at lower temperatures (<11 °C). The current study’s observations are in line with previous studies reporting the rapid expansion of rot lesions on the underside of leaf midribs on leaves in direct contact with the soil [28]. The current findings also suggest that ASD can reduce the incidence of lettuce bottom rot compared with commonly used grower practices including the addition of granular fertilizer or granular fertilizer combined with locally available compost.
Weed and insect pest management are considered by farmers to be two of the five most significant production challenges facing organic farming [29]. Given that synthetic herbicides are prohibited in organic production systems, long-term weed management requires an integrated approach to reducing weed seed survival in the seedbank while also minimizing additional weed seed input. In the present study, no insect pests were detected in either production season. Moreover, the ASD treatment had a positive impact on weed suppression compared with the Compost and Control treatments. Specifically, the ASD-treated soils experienced a reduction in the number of broadleaf weeds in both the fall 2021 and spring 2022 trials. The population density of sedges was also significantly lower in ASD vs. Compost, although it was only numerically lower in ASD-treated soils relative to the Control treatment. The reduced weed pressure observed in the ASD-treated soils may be related to an increase in harvested FW and crop biometrics including SLA compared with the Compost and Control treatments. Although the soil treatment means were not significantly different during the spring trial, the general increase in FW and leaf surface area in both production seasons could have played a role in physically limiting weed seed growth through nutrient and resource competition. ASD may provide positive, synergistic impacts through improved crop performance and weed seed mortality [5,18,19]. The current findings are in line with previous ASD trials that have shown that broadleaf weed seeds and nutsedge tubers are sensitive to ASD soil treatment [25,30]. In a previous trial conducted in Florida using molasses as a C source for ASD, yellow nutsedge (Cyperus esculentus) was suppressed by ASD [16]. Significantly lower sprouting and the reproduction of yellow nutsedge tubers was observed when wheat bran was used as an ASD C source in Tennessee [31]. Muramoto et al. [32] reported the complete inhibition of yellow nutsedge tubers at 15 cm soil depth using wheat bran, molasses, ethanol, or broiler litter as C sources for ASD application in Florida. Similarly, Liu et al. [30] reported 100% tuber mortality in ASD-treated soils when paper mulch, peanut shells, or rice bran were used as C sources. Importantly, these studies were conducted using pots in greenhouses or controlled environments rather than at a field scale, as was the case in the current study [25,30,31,32]. The mechanisms responsible for weed suppression may be related to (1) the ability of ASD to enhance the decomposition of organic matter, thereby enhancing the production and accumulation of toxic volatile fatty and organic acids [33,34]; (2) the suppression of weed seed respiration due to low soil oxygen availability; and (3) changes in soil temperature, VWC, and pH, which work together in a synergistic manner to kill weed propagules [35].
In this study, the effects of ASD on broadleaf weed population density when assessed 1 week after seeding and again at harvest were inconsistent between the fall 2021 and spring 2022 trials. Still, a decrease in the number of weeds may contribute to reduced hand weeding labor requirements while improving the marketability and quality of baby leaf lettuce so that the produce does not contain weeds that could be potentially hazardous. In a meta-analysis in which 88 ASD studies were analyzed, the effect of ASD on various categories of weeds varied depending on soil type, ASD treatment period, soil temperature, and the type and form of C source applied [9]. However, none of the studies included in the meta-analysis were conducted in HT organic production systems. Therefore, more research is needed to better understand the benefits of ASD as an integrated preplant strategy for managing the weed seed bank under HT conditions, especially for direct-seeded organic vegetable crops with weed control as a major constraint. It is also noteworthy that the weed pressure remained at higher levels in the Compost treatment in comparison with the ASD and Control treatments in both trials. As composts are commonly used in organic vegetable cropping systems, the impact of compost type, source, and quality as well as application method on weed management in baby leaf lettuce production needs to be further evaluated.
4.3. ASD Soil Treatment and Lettuce Cultivar Impacts on Crop Performance and Leaf Quality Attributes
After the ASD treatment period, lettuce was direct seeded to assess the potential impact of ASD on crop biometric and yield measurements compared with the common production practices of applying granular fertilizer (Control) or the addition of composted materials combined with fertilizer (Compost treatment) in HT organic systems. In both the fall 2021 and spring 2022 trials, no statistically significant effect of soil treatment was observed on lettuce fresh weight yield or leaf dry matter content. However, the numerical difference between the ASD and Compost and Control treatments in baby leaf lettuce yield was quite noticeable. During the spring 2022 trial, baby leaf lettuce was harvested at 28 DAS due to the generally warmer air temperatures compared with the fall 2021 trial, in which the baby leaf lettuce crops were harvested at 45 DAS. In addition, early signs of bolting during the spring 2021 trial necessitated an earlier harvest. The bolting observed in the spring 2022 trial may have contributed to the observed differences in lettuce fresh weight compared with the fall 2021 trial. The differences in lettuce fresh weight observed during the spring 2022 trial were likely related to the increased incidence of R. solani-infected plants in the Compost treatment compared with the ASD and Control treatments. The significant differences in disease incidence may have been related to the water holding capacity of the soil in the different treatments. Soil VWC was greatest in the Compost treatment throughout the duration of the crop cycle. Therefore, the combination of warm soil temperatures and increased VWC may have provided a more favorable environment for R. solani proliferation compared with the Control- and ASD-treated soils. While the disease occurrence remained below 10% in all treatments, it is likely that the increased spread of R. solani-infected plants would have had a marked impact on lettuce fresh weight and quality in the Compost treatments if cut-and-regrow practices were implemented.
The influence of ASD on crop growth and yield performance is mixed according to the literature. Vecchia et al. [23] reported statistically non-significant differences in the plant growth and quality attributes of Salanova® lettuce seeded after ASD treatment using several liquid and non-liquid C sources, including molasses. On the other hand, previous studies on ASD application in fresh-market tomato production indicated significant effects on plant growth, yield, and mineral content at harvest [18,19,36]. The discrepancies between previous reports and the limited impact observed on the lettuce cultivars in this study may be explained by the much shorter crop cycle of lettuce compared with tomato. Moreover, unlike tomato crops, which are harvested multiple times each week during peak production, baby leaf lettuce crops were harvested once in the present study. It would be interesting to assess the impact of ASD on baby leaf lettuce crops that are harvested multiple times through cut-and-regrow practices, as this would make it possible to see whether ASD has a greater effect on enhancing lettuce yield, particularly given the likelihood of the increased incidence and severity of R. solani infection in the Compost and Control treatments over time. While the current study did not report leaf or root nutrient accumulation, future studies should investigate crop nutrient dynamics to determine whether ASD impacts macro- and micronutrient uptake from soils compared with other common grower practices. This information may help explain some of the trends observed in the current study regarding differences in FW accumulation.
To date, most ASD field and greenhouse studies have focused on the production of strawberry, eggplant, tomato, pepper, cucumber, and tree fruits [34,37,38,39,40,41], while relatively fewer studies have focused on ASD for leafy green production. Mowlick et al. [41] investigated the suppression of Fusarium oxysporum f. sp. spinaciae in spinach by ASD. Testen and Miller [42] evaluated the use of ASD as a strategy to manage root-knot nematodes (Meloidogyne hapla) in lettuce grown on muck soils. More recently, Vecchia et al. [23] and Gilardi et al. [43] investigated different C sources associated with ASD, including cover crops for the production of lettuce. However, none of these studies on leafy greens quantified leaf color and other quality properties. Hence, information regarding the effects of ASD soil treatment on the quality attributes of direct-seeded lettuce is lacking. Therefore, this study is the first to quantify the leaf quality attributes of baby leaf lettuce grown following ASD soil treatment. Certainly, to date, this is the first study conducted in a HT organic production system in Florida sandy soils comparing multiple commercially available lettuce cultivars.
In both the fall 2021 and spring 2022 trials, the leaf color attributes, including a*, b*, C*, and L*, were not significantly impacted by soil treatments. Similarly, the leaf quality attributes, including SSC, TTA, FRAP, and AA, were not significantly different among the soil treatments during both trials, except for the fact that we found higher total phenolics in the ASD and Compost treatments compared to the Control treatment. The differences in lettuce leaf color and antioxidant properties were driven by lettuce cultivar in both seasons. In general, the red lettuce cultivars tended to have increased FRAP and TPC values. These results are unsurprising given that red lettuce cultivars contain higher levels of anthocyanins, which, aside from imparting red/purple hues, constitute a considerable proportion of the phenolic antioxidant compounds compared with green lettuce cultivars [44,45]. These findings suggest that ASD application did not negatively impact the leaf color and quality attributes of direct-seeded baby leaf lettuce when compared with other commonly used grower practices.
5. Conclusions
The adoption of HT systems is growing, particularly in the Southeastern U.S., and the adoption of HT systems also holds great potential for improving organic crop production. Therefore, research-based recommendations in relation to disease, pest, weed, and nutrient management are needed. While ASD is a promising technique for disease and weed control, optimization may be required to shorten the ASD treatment period to allow for a faster turnover from one crop to the next, especially with short-cycled, high-value crops. This study provides novel evidence that the ASD treatment period can be reduced in HT organic systems while still achieving sufficiently high soil anaerobic conditions. The results demonstrate that the commonly used 21-day ASD treatment period in Florida can be shortened to an 8-day treatment period while still achieving a significant reduction in the incidence of R. solani and the suppression of different categories of weeds, particularly broadleaf weeds. In addition, the reduction in the severity of diseases caused by R. solani and the decreased weed population density support the potential of using ASD treatment to improve crop productivity. Furthermore, the ASD-treated soils performed as well as other soils that have been subjected to commonly used grower practices in terms of the impacts on leaf quality attributes such as the leaf color, SSC, TTA, FRAP, TPC, and AA of multiple commercially available lettuce cultivars. Moreover, the genotypic effect outweighed soil treatment impact for driving the observed differences in leaf color and antioxidant properties. Given the inconsistencies between trials regarding the effects of ASD treatment on crop yield and performance, future studies should investigate the impact of ASD on crop micro- and macronutrient accumulation in the leaf and root tissues of direct-seeded baby leafy greens. This information may help explain the variation in crop performance and its related impacts on weed development during the crop cycle. Additionally, other popular leafy greens grown in HT organic systems, including arugula, spinach, and kale, should be investigated.
Author Contributions
Conceptualization, X.Z. and I.R.V.; methodology, I.R.V., X.Z., E.N.R., J.K.B., N.S.D. and G.S.-M.; formal analysis, I.R.V. and X.Z.; investigation, I.R.V. and X.Z.; data curation, I.R.V.; writing—original draft preparation, I.R.V. and X.Z.; writing—review and editing, I.R.V., X.Z., E.N.R., J.K.B., N.S.D. and G.S.-M.; funding acquisition, X.Z. and I.R.V. All authors have read and agreed to the published version of the manuscript.
Funding
This work was supported by the National Institute of Food and Agriculture, U.S. Department of Agriculture, under award number 2019-38640-29878 through the Southern Sustainable Agriculture Research and Education program under subaward number GS20-221 as well as the University of Florida IFAS SEEDIT Program.
Data Availability Statement
The original contributions presented in the study are included in the article, further inquiries can be directed to the corresponding author.
Acknowledgments
We thank James Colee for his assistance with statistical analysis and Buck Nelson for his help with the field work.
Conflicts of Interest
The authors declare no conflicts of interest.
References
- Lamont, W.J. Overview of the use of high tunnels worldwide. HortTechnology 2009, 19, 25–29. [Google Scholar] [CrossRef]
- Carey, E.E.; Jett, L.; Lamont, W.J.; Nennich, T.T.; Orzolek, M.D.; Williams, K.A. Horticultural crop production in high tunnels in the United States: A snapshot. HortTechnology 2009, 19, 37–43. [Google Scholar] [CrossRef]
- Janke, R.R.; Altamimi, M.E.; Khan, M. The use of high tunnels to produce fruit and vegetable crops in North America. Agric. Sci. 2017, 8, 692–715. [Google Scholar] [CrossRef]
- Hochmuth, R.C.; Toro, D.E. Characterization of the Florida Fresh Fruit and Vegetable Industry Using Hydroponic Systems or Protected Agriculture Structures. Available online: https://edis.ifas.ufl.edu/publication/HS1240 (accessed on 29 August 2023).
- Cultiva Farms USA Completes Next Phase of Multi-Million Dollar Expansion in Jennings. Available online: https://www.hamiltoncda.org/news/cultiva-farms-usa-completes-next-phase-of-multi-million-dollar-expansion-in-jennings/ (accessed on 29 August 2023).
- Donovan, M.; Ruiz-Menjivar, J.; Coolong, T.; Swisher, M.E. A scientometric review of the peer-reviewed research on high tunnels in the United States. Renew. Agric. Food Syst. 2023, 38, e48. [Google Scholar] [CrossRef]
- Sanabria-Valazques, A.D.; Testen, A.L.; Khadka, R.B.; Liu, Z.; Xu, F.; Miller, S.A. Anaerobic soil disinfestation reduces viability of Sclerotinia sclerotiorum and S. minor sclerotia and root-knot nematodes in muck soils. Phytopathology 2020, 110, 795–804. [Google Scholar] [CrossRef]
- Lopes, E.A.; Canedo, E.J.; Gomes, V.A.; Vieira, B.S.; Parreira, D.F.; Neves, W.S. Anaerobic soil disinfestation for the management of soilborne pathogens: A review. Appl. Soil Ecol. 2022, 174, 104408. [Google Scholar] [CrossRef]
- Shrestha, U.; Augé, R.M.; Butler, D.M. A meta-analysis of the impact of anaerobic soil disinfestation on pest suppression and yield of horticultural crops. Front. Plant Sci. 2016, 7, 1254. [Google Scholar] [CrossRef]
- Priyashantha, A.H.; Attanayake, R.N. Can anaerobic soil disinfestation (ASD) be a game changer in tropical agriculture? Pathogens 2021, 10, 133. [Google Scholar] [CrossRef]
- Kreutz, G.F.; Sandoya, G.V.; England, G.K.; Mussoline, W. Exploring the potential of lettuce (Lactuca sativa) as an early crop in Florida’s sandy soils. HortScience 2021, 56, 59–70. [Google Scholar] [CrossRef]
- Rabenhorst, M.C.; Castenson, K.L. Temperature effects on iron reduction in a hydric soil. Soil Sci. 2005, 170, 734–742. [Google Scholar] [CrossRef]
- Benzie, I.F.F.; Strain, J.J. The ferric reducing ability of plasma (FRAP) as a measure of “antioxidant power”: The FRAP assay. Anal. Biochem. 1996, 239, 70–76. [Google Scholar] [CrossRef]
- Inglett, P.W.; Reddy, K.R.; Corstanje, R. Anaerobic Soils. In Encyclopedia of Soils in the Environment; Elsevier: Amsterdam, The Netherlands, 2005; pp. 72–78. [Google Scholar]
- Li, B.; Zhou, J.; Lu, Y.; Xiong, Z. Field-aged biochar reduces the greenhouse gas balance in a degraded vegetable field treated by reductive soil disinfestation. Environ. Sci. Pollut. Res. 2019, 26, 10609–10620. [Google Scholar] [CrossRef] [PubMed]
- Di Gioia, F.; Ozores-Hampton, M.; Hong, J.C.; Kokalis-Burelle, N.; Albano, J.; Zhao, X.; Rosskopf, E.N. The effects of anaerobic soil disinfestation on weed and nematode control, fruit yield, and quality of Florida fresh-market tomato. HortScience 2016, 51, 703–711. [Google Scholar] [CrossRef]
- Guo, H.; Di Gioia, F.; Zhao, X.; Ozores-Hampton, M.; Swisher, M.E.; Hong, J.C.; Rosskopf, E.N. Optimizing anaerobic soil disinfestation for fresh market tomato production: Nematode and weed control, yield, and fruit quality. Sci. Hortic. 2017, 218, 105–116. [Google Scholar] [CrossRef]
- Di Gioia, F.; Ozores-Hampton, M.; Zhao, X.; Thomas, J.; Wilson, P.; Li, Z.; Rosskopf, E.N. Anaerobic soil disinfestation impact on soil nutrients dynamics and nitrous oxide emissions in fresh-market tomato. Agric. Ecosyst. Environ. 2017, 240, 194–205. [Google Scholar] [CrossRef]
- Shennan, C.; Muramoto, J.; Baird, G.; Cruz, S.; Daugovish, O.; Koike, S.; Bolda, M. Anaerobic soil disinfestation: California. Eur. J. Plant Pathol. 2011, 117, 403–415. [Google Scholar]
- Momma, N.; Yamamoto, K.; Simandi, P.; Shishido, M. Role of organic acids in the mechanisms of biological soil disinfestation (BSD). J. Gen. Plant Pathol. 2006, 72, 247–252. [Google Scholar] [CrossRef]
- Hewavitharana, S.S.; Klarer, E.; Reed, A.J.; Leisso, R.; Poirier, B.; Honaas, L.; Mazzola, M. Temporal dynamics of the soil metabolome and microbiome during simulated anaerobic soil disinfestation. Front. Microbiol. 2019, 10, 2365. [Google Scholar] [CrossRef] [PubMed]
- Rosskopf, E.N.; Di Gioia, F.; Hong, J.C.; Pisani, C.; Kokalis-Burelle, N. Organic amendments for pathogen and nematode control. Annu. Rev. Phytopathol. 2020, 58, 277–311. [Google Scholar] [CrossRef]
- Vecchia, L.; Di Gioia, F.; Ferrante, A.; Hong, J.C.; White, C.; Rosskopf, E.N. Integrating cover crops as a source of carbon for anaerobic soil disinfestation. Agronomy 2020, 10, 1614. [Google Scholar] [CrossRef]
- Mao, Y.; Hafeez, A.; Pan, T.; Wu, C.; Wang, L.; Muramoto, J.; Tian, J. Suppression of tomato bacterial wilt by anaerobic soil disinfestation and associations with production of antagonistic compounds. Plant Soil 2022, 477, 539–552. [Google Scholar] [CrossRef]
- Khadka, R.B.; Sanabria-Valazques, A.D.; Cardina, J.; Miller, S.A. Evaluation of anaerobic soil disinfestation for environmentally sustainable weed management. Agronomy 2022, 12, 3147. [Google Scholar] [CrossRef]
- Claerbout, J.; Decombel, A.; Volckaert, A.; Venneman, S.; Vandevelde, I.; Bleyaert, P.; Höfte, M. Glasshouse-specific occurrence of basal rot pathogens and the seasonal shift of Rhizoctonia solani anastomosis groups in lettuce. Eur. J. Plant Pathol. 2019, 155, 841–858. [Google Scholar] [CrossRef]
- Van Beneden, S.; Pannecoucque, J.; Debode, J.; De Backer, G.; Höfte, M. Characterization of fungal pathogens causing basal rot of lettuce in Belgian greenhouses. Eur. J. Plant Pathol. 2009, 124, 9–19. [Google Scholar] [CrossRef]
- Ritchie, F.; Bain, R.A.; McQuilken, M.P. Effects of nutrient status, temperature, and pH on mycelial growth, sclerotial production and germination of Rhizoctonia solani from potato. J. Plant Pathol. 2009, 91, 589–596. [Google Scholar]
- Snyder, L.; Schonbeck, M.; Velez, T.; Tencer, B. 2022 National Organic Research Agenda Outcomes and Recommendations from the 2020 National Organic & Transitioning Farmer Surveys and Focus Groups; Organic Farming Research Foundation: Santa Cruz, CA, USA, 2022. [Google Scholar]
- Liu, D.; Samtani, J.B.; Johnson, C.S.; Butler, D.M.; Derr, J. Weed control assessment of various carbon sources for anaerobic soil disinfestation. Int. J. Fruit Sci. 2020, 20, 1005–1018. [Google Scholar] [CrossRef]
- Shrestha, U.; Rosskopf, E.N.; Butler, D.M. Effect of anaerobic soil disinfestation amendment type and C: N ratio on Cyperus esculentus tuber sprouting, growth and reproduction. Weed Res. 2018, 58, 379–388. [Google Scholar] [CrossRef]
- Muramoto, J.; Shennan, C.; Fitgerald, A.; Koike, S.; Bold, M.; Daugovish, O.; Butler, D.M. Effect of Anaerobic Soil Disinfestation on Weed Seed Germination. In Proceedings of the Annual International Research Conference on Methyl Bromide Alternatives and Emissions Reductions, San Diego, CA, USA, 14–16 November 2007. [Google Scholar]
- Greenwood, D.J. The effect of oxygen concentration on the decomposition of organic materials in soil. Plant Soil 1961, 14, 360–376. [Google Scholar] [CrossRef]
- McCarty, D.G.; Inwood, S.E.E.; Ownley, B.H.; Sams, C.E.; Wszelaki, A.L.; Butler, D.M. Field evaluation of carbon sources for anaerobic soil disinfestation in tomato and bell pepper production in Tennessee. HortScience 2014, 49, 272–280. [Google Scholar] [CrossRef]
- Khadka, R.B.; Cardina, J.; Miller, S.A. Perspectives on anaerobic soil disinfestation for weed management. J. Integr. Pest Manag. 2021, 12, 32. [Google Scholar] [CrossRef]
- Jiang, Y.; Kang, Y.; Han, C.; Zhu, T.; Deng, H.; Xie, Z.; Zhong, W. Biochar amendment in reductive soil disinfestation process improved remediation effect and reduced N2O emission in nitrate-riched degraded soil. Arch. Agron. Soil Sci. 2020, 66, 983–991. [Google Scholar] [CrossRef]
- Huang, X.; Lui, L.; Wen, T.; Zhang, J.; Shen, Q.; Cai, Z. Reductive soil disinfestations combined or not with Trichoderma for the treatment of a degraded and Rhizoctonia solani infested greenhouse soil. Sci. Hortic. 2016, 206, 51–61. [Google Scholar] [CrossRef]
- Muramoto, J.; Shennan, C.; Zavatta, M.; Baird, G.; Toyama, L.; Mazzola, M. Effect of anaerobic soil disinfestation and mustard seed meal for control of charcoal rot in California strawberries. Int. J. Fruit Sci. 2016, 16, 59–70. [Google Scholar] [CrossRef]
- Khadka, R.B.; Marasini, M.; Rawal, R.; Testen, A.L.; Miller, S.A. Effects of anaerobic soil disinfestation carbon sources on soilborne diseases and weeds of okra and eggplant in Nepal. Crop Prot. 2020, 135, 104846. [Google Scholar] [CrossRef]
- Donahoo, T.; Zhang, L.; Cutulle, M.; Hajihassani, A. Economic analysis of grafting and anaerobic soil disinfestation for tomato production in South Carolina. HortTechnology 2021, 31, 615–624. [Google Scholar] [CrossRef]
- DuPont, S.T.; Hewavitharana, S.S.; Mazzola, M. Field scale application of Brassica seed meal and anaerobic soil disinfestation for the control of apple replant disease. Appl. Soil Ecol. 2021, 166, 104076. [Google Scholar] [CrossRef]
- Mowlick, S.; Yasukawa, H.; Inoue, T.; Takehara, T.; Kaku, N.; Ueki, K.; Ueki, A. Suppression of spinach wilt disease by biological soil disinfestation incorporated with Brassica juncea plants in association with changes in soil bacterial communities. Crop Prot. 2013, 54, 185–193. [Google Scholar] [CrossRef]
- Testen, A.L.; Miller, S.A. Anaerobic soil disinfestation to manage soilborne diseases in muck soil vegetable production systems. Plant Dis. 2019, 103, 1757–1762. [Google Scholar] [CrossRef]
- Gilardi, G.; Pugliese, M.; Gullino, M.L.; Garibaldi, A. Evaluation of different carbon sources for anaerobic soil disinfestation against Rhizoctonia solani on lettuce in controlled production systems. Phytopathol. Mediterr. 2020, 59, 77–96. [Google Scholar] [CrossRef]
- Selma, M.V.; Luna, M.C.; Martínez- Sánchez, A.; Tudela, J.A.; Beltrá, D.; Baixauli, C.; Gil, M.I. Sensory quality, bioactive constituents, and microbiological quality of green and red fresh-cut lettuces (Lactuca sativa L.) are influenced by soil and soilless agricultural production systems. Postharvest Biol. Technol. 2012, 63, 16–24. [Google Scholar] [CrossRef]
Disclaimer/Publisher’s Note: The statements, opinions and data contained in all publications are solely those of the individual author(s) and contributor(s) and not of MDPI and/or the editor(s). MDPI and/or the editor(s) disclaim responsibility for any injury to people or property resulting from any ideas, methods, instructions or products referred to in the content. |
© 2024 by the authors. Licensee MDPI, Basel, Switzerland. This article is an open access article distributed under the terms and conditions of the Creative Commons Attribution (CC BY) license (https://creativecommons.org/licenses/by/4.0/).